Fish Population Studies of the Seagrass Beds and Coral ... · PDF fileFish Population Studies...
60
Converted to digital format by Aric Bickel (NOAA/RSMAS) in 2005. Copy available at the NOAA Miami Regional Library. Minor editorial changes may have been made. Fish Population Studies of the Seagrass Beds and Coral Reefs of Cayo Berberia and Cayo Ratones, Ponce, P.R. Jose M. Berrios, Jaime K. Gonzalez Azar, Israel Diaz Rodriguez Department of Natural Resources Scientific Research Area Marine Resources Division
-
Upload
vuongkhanh -
Category
Documents
-
view
218 -
download
4
Transcript of Fish Population Studies of the Seagrass Beds and Coral ... · PDF fileFish Population Studies...
Converted to digital format by Aric Bickel (NOAA/RSMAS) in 2005. Copy available at the NOAA Miami Regional Library. Minor editorial changes may have been made.
Fish Population Studies of the Seagrass Beds and Coral Reefs of Cayo Berberia and Cayo Ratones, Ponce, P.R.
Jose M. Berrios, Jaime K. Gonzalez Azar, Israel Diaz Rodriguez
Department of Natural Resources Scientific Research Area
Marine Resources Division

DEPARTMENT OF NATURAL RESOURCES S C I E N T I F I C R E S E A R C H A R E A M A R I N E R E S O U R C E S Z I V I S I O N
F I S H P O P U L A T I O N S T U D I E S O F T H E S E A G R A S S B E D S A N D C O R A L R E E F S O F C A Y O B E R B E R I A A N D C A Y O R A T O N E S , P O N C E , P . R .
J O S E M . B Y B E R R I O S D I A Z
J A I M E K . GONZALEZ AZAR ISRAEL D I A Z R O D R I G U E Z

Table of contents page
Acknowledgements ....................................................... 3
List of Figures ........................................................ 4
List of Tables ......................................................... 4
List of Plates ......................................................... 5
Abstract ................................................................ 6
Introduction ........................................................... 8
Materials and Methods ................................................ 10
Results ................................................................ 15
Coral Reef Fishes .............................................. 15
General Description and Species Distribution ........ 15
Species Richness .......................................... 16
Number of Individuals .................................... 17
Density .................................................... 18
Species Diversity ........................................ 18
Similarity ................................................. 19
Abundance .................................................. 19
Dominant Species .......................................... 20
Fishes of the Thalassia Beds and Mangroves ................ 21
General Description ...................................... 21
Discussion ............................................................. 22
Coral Reef Fishes .............................................. 22
Fishes of the Thalassia and Mangrove Areas ................ 25
Conclusions ............................................................ 26
Recommendations ....................................................... 28
Literature Cited ...................................................... 30
Figures ................................................................ 35
Tables .................................................................. 39
Plates .................................................................. 46
Appendix 1 ............................................................. 55
- 2 -
Acknowledgements
First we want to express thanks to Julio Cardona and Jorge
M o r e n o for p r o v i d i n g c r i t i c a l r e v i e w and comments, for their
s t a t i s t i c a l s u p p o r t and for t h e i r invaluable suggestions for
improving the manuscript.
We are d e e p l y i n d e b t e d to Richard Webb for his invaluable
a s s i s t a n c e w i t h c o m p u t e r p r o g r a m m i n g and for stimulating
discussions and cooperation.
Thanks are especially due to Miguel Canals and Howard Ferrer
for c r i t i c a l l y r e a d i n g the manuscript and for their extensive
field assistance.
Hector Merced is gratefully acknowledged for developing and .
printing the photographs and for an occasional extra hand in the
field.
We want to acknowledge the crew of the R/\' Jean A, the D.N.R.
rangers of Ponce and Boqueron and the Brigada of Caja de Muertos
Island for their logistical support during the field work.
A short conversation with Dr. Jim Bohnsack was very useful
for improving the presentation of the data.
Margarita Fonseca and Norma Vergara typed different parts of
the manuscript.
Other persons which assisted us at different stages of the
s t u d y were Iris C o r u j o , E m i l i a Medina, Aileen Velazco, Luz M.
C r u z , J o r g e R o d r i g u e z , A n t o n i o R i o s , Gerardo Ortiz and JoAnn
Mercado and we are indebted to them.
Unless otherwise indicated all the photographs were taken by
J o s e M. B e r r i o s . Any e r r o r s or o m i s s i o n s are the a u t h o r s '
responsibility.
Funding for this project was provided by the Federal Aid to
Fish Restoration Act, Dingell - Johnson, Project F-5.
- 3 -
List of Figures
page
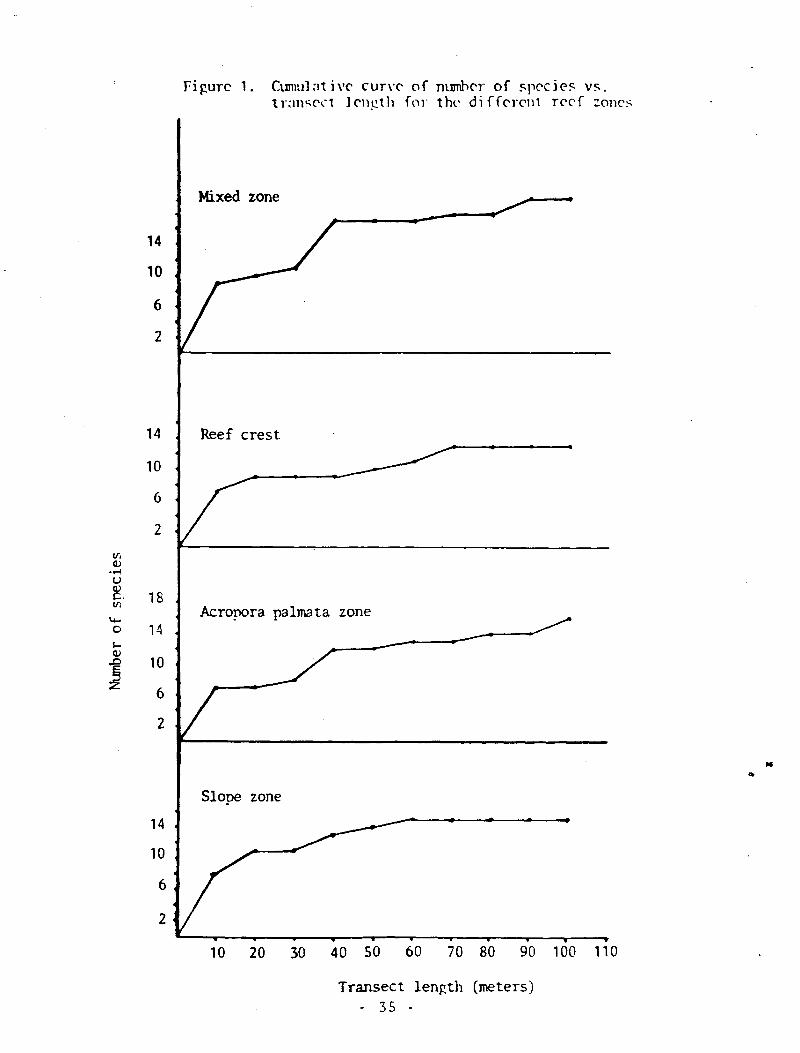
Figure 1. Cumulative curve of number of species versus transect length from the different reef zones ....... 35
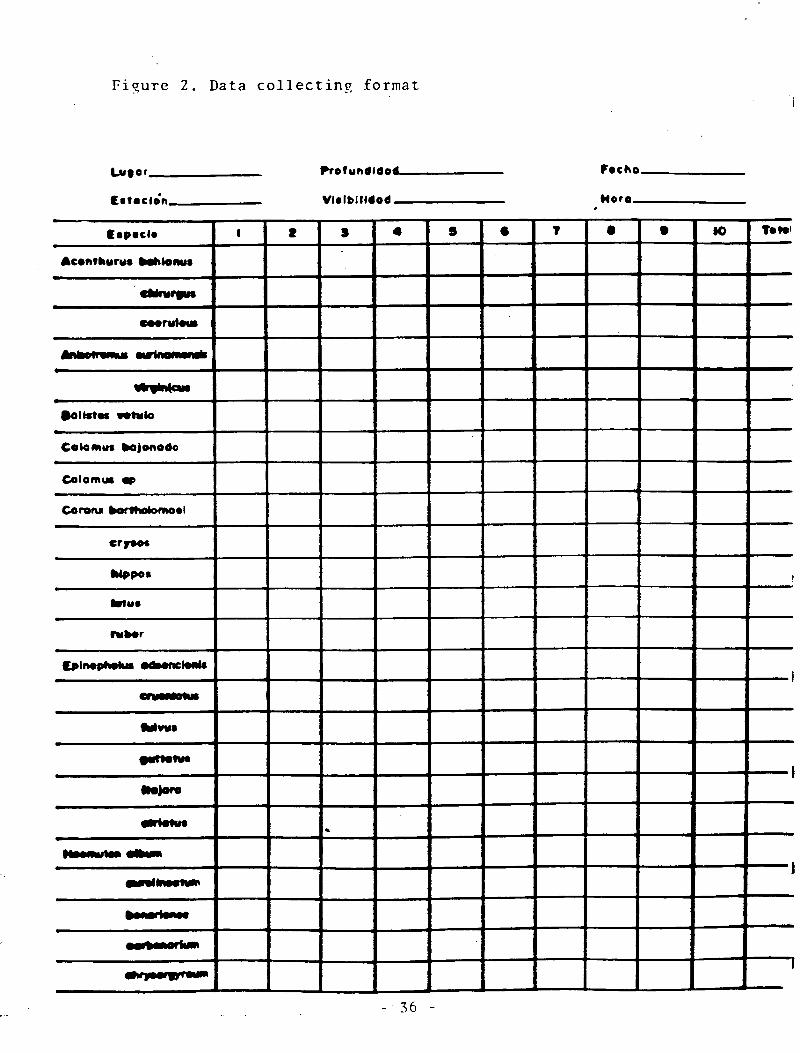
Figure 2. Data collecting format .................................... 36
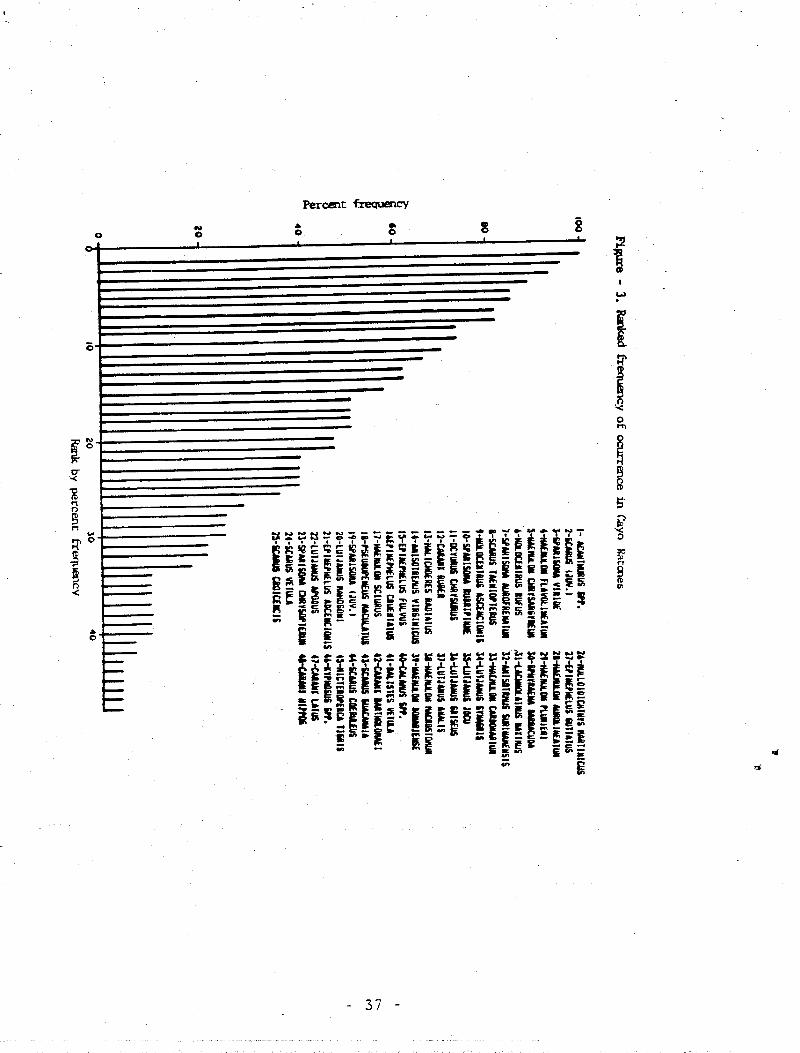
Figure 3. Ranked frequency of ocurrence in Cayo Berberia ...... 37
Figure 4. Ranked frequency of ocurrence in Cayo Ratones ....... 38
List of Tables
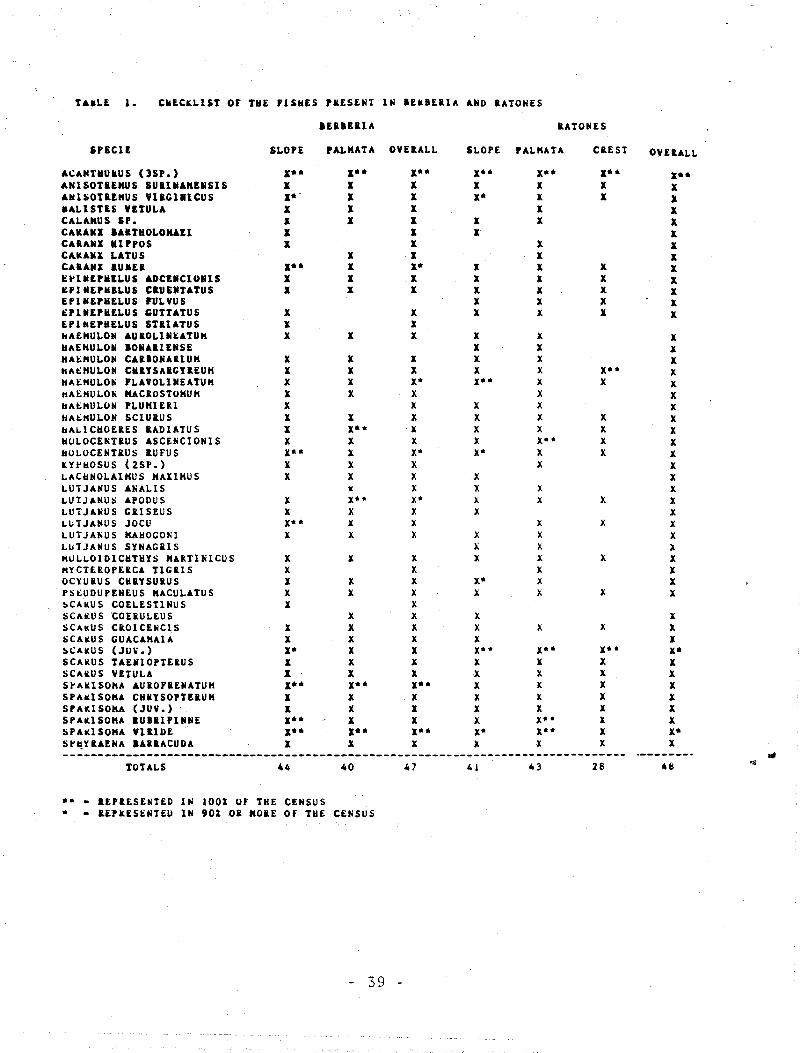
Table 1. Checklist of the fishes present in Berberia and
Ratones reefs ................................................. 39
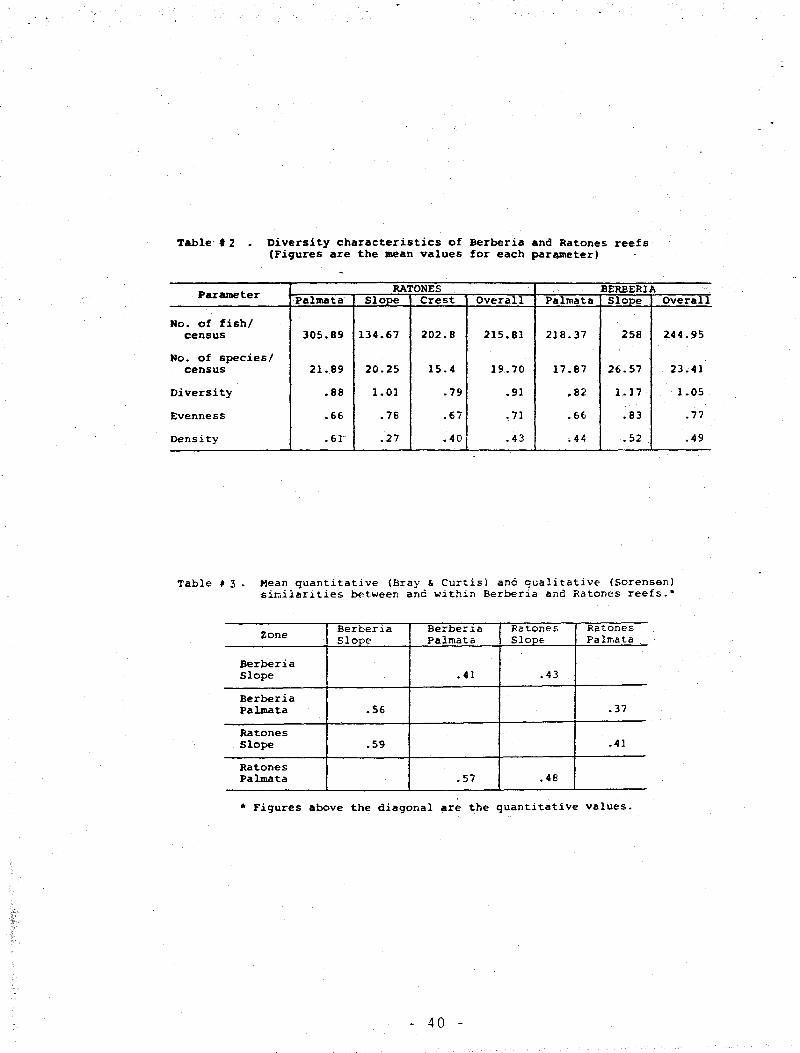
Table 2. Diversity characteristics of Berberia and Ratones
reefs ........................................................... 40
Table 3. Mean quantitative and qualitative similarities
between and within Berberia and Ratones reefs ......... 40
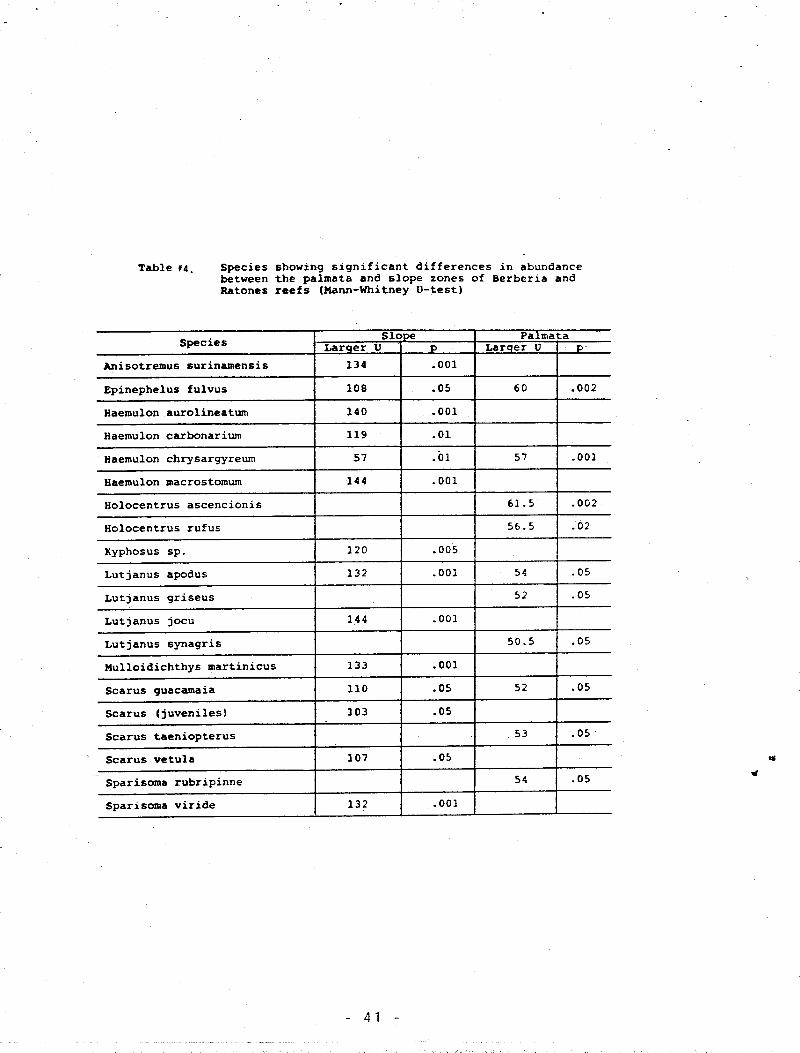
Table 4. Species showing significant differences in abundance
between the A. palmata and slope zones of Berberia
and Ratones reefs ............................................ 41
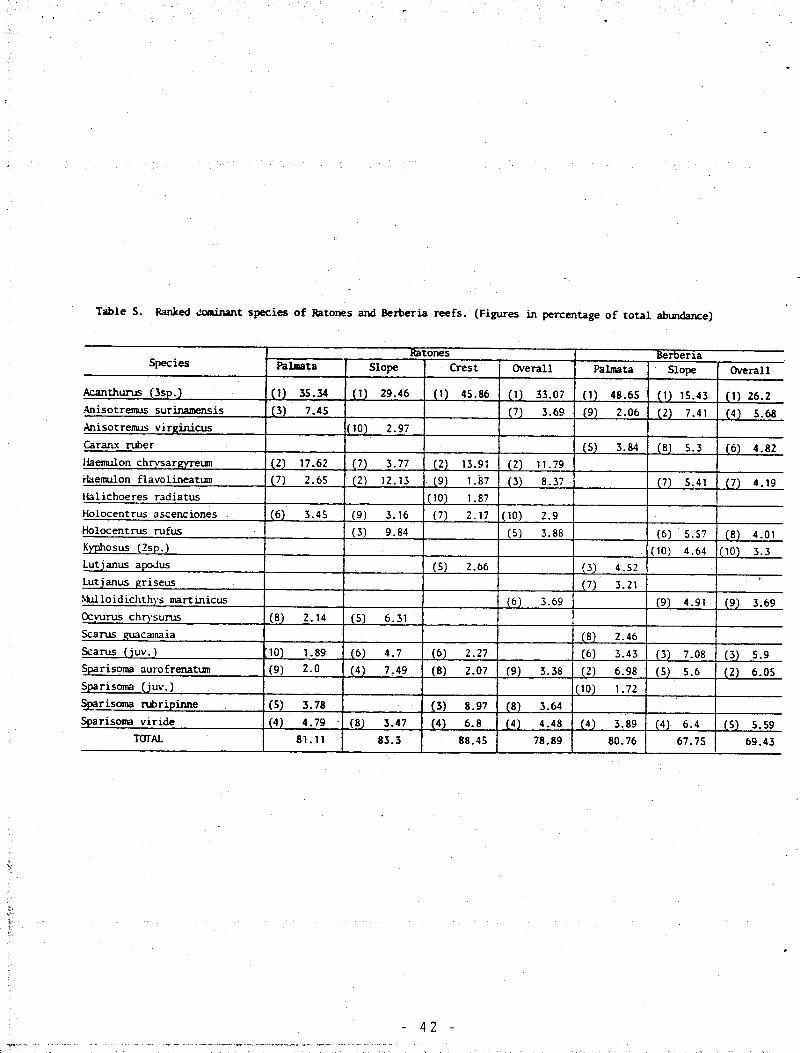
Table 5. Ranked dominant species of Berberia and Ratones
reefs ........................................................... 42
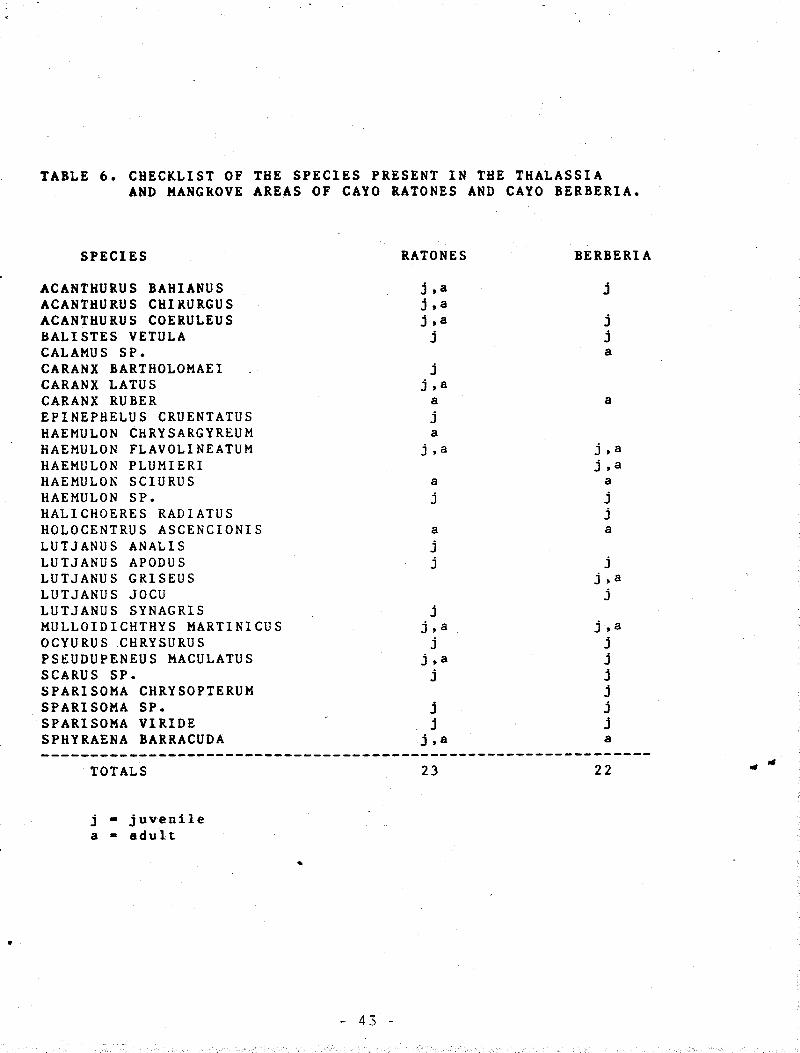
Table 6. Checklist of the species present in the Thalassia
and mangroves areas of Cayo Ratones and Cayo
Berberia ....................................................... 43
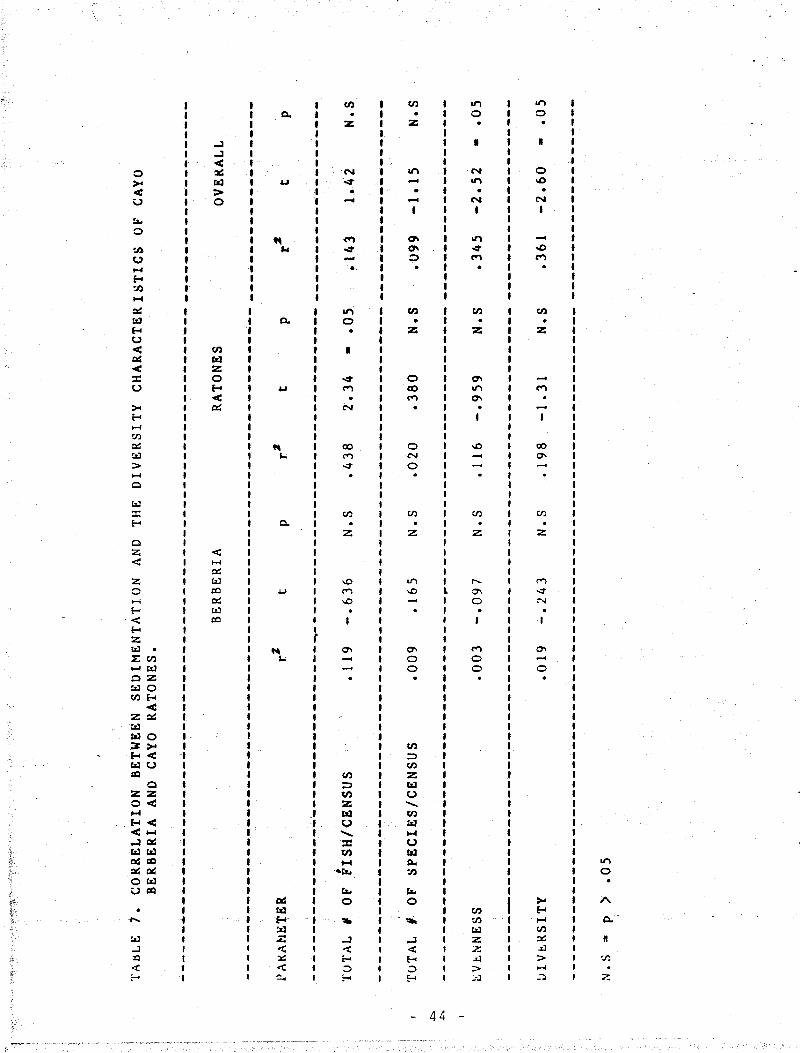
Table 7. Correlation between sedimentation and the diversity
characteristics of Cayo Berberia and Cayo Ratones 44
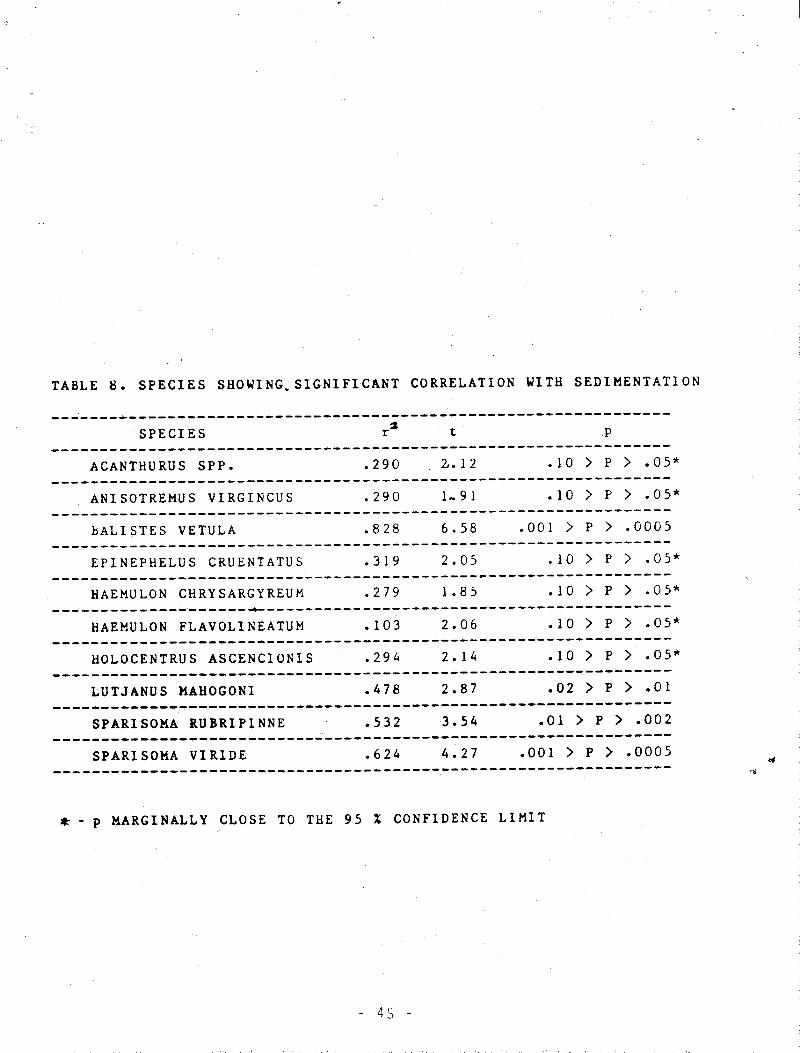
Table 8. Species showing significant correlation with
sedimentation ................................................. 45
- 4 -
List of Plates page
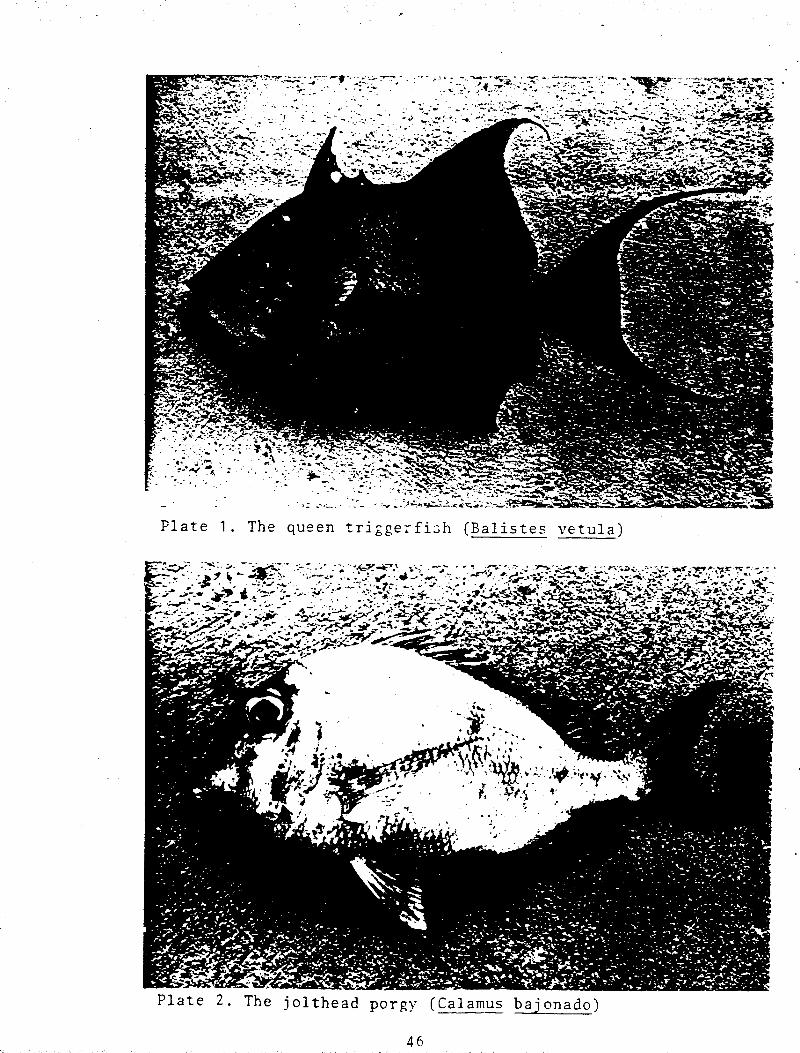
Plate 1. The queen triggerfish (Balistes vetula) ............ 46
Plate 2. The jolthead porgy (Calamus bajonado) .............. 46
Plate 3. The bar jack (Caranx ruber) ........................ 47
Plate 4. The graysby (Epinephelus cruentatus) ............... 47
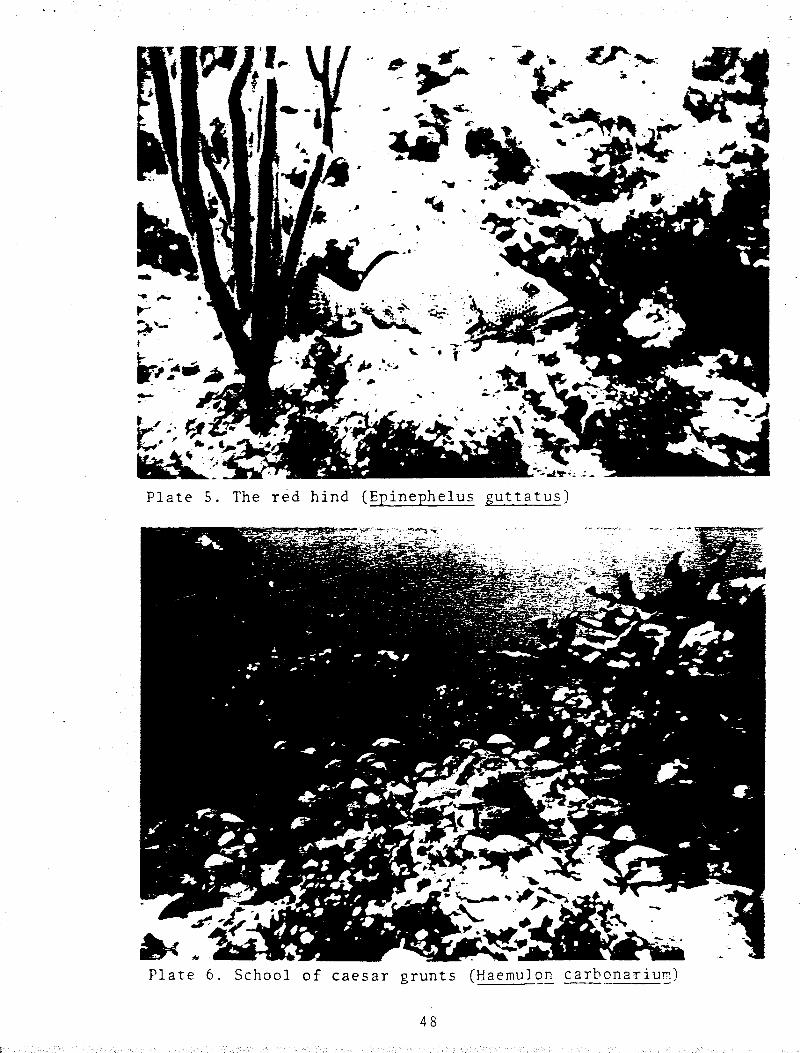
Plate 5. The red hind (Epinephelus guttatus) ................ 48
Plate 6. School of caesar grunts (Haemulon carbonarium) .... 48
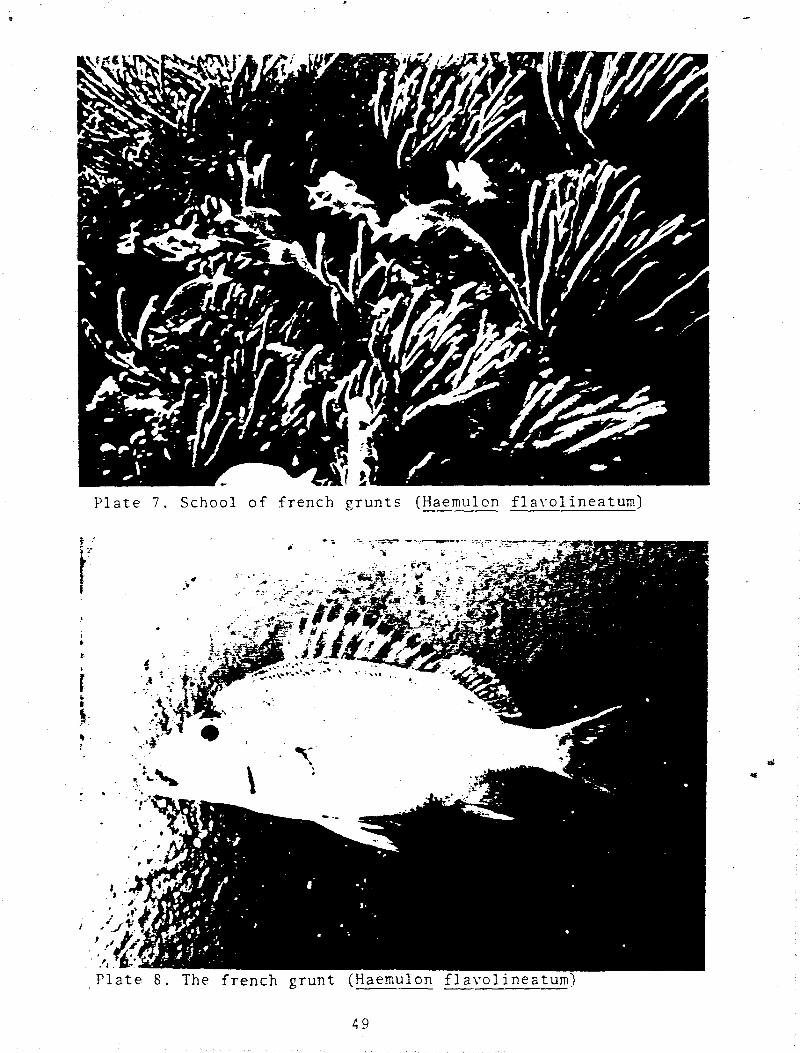
Plate 7. School of french grunts (Haemulon flavolineatum) 49
Plate 8. The french grunt (Haemulon flavolineatum) .......... 49
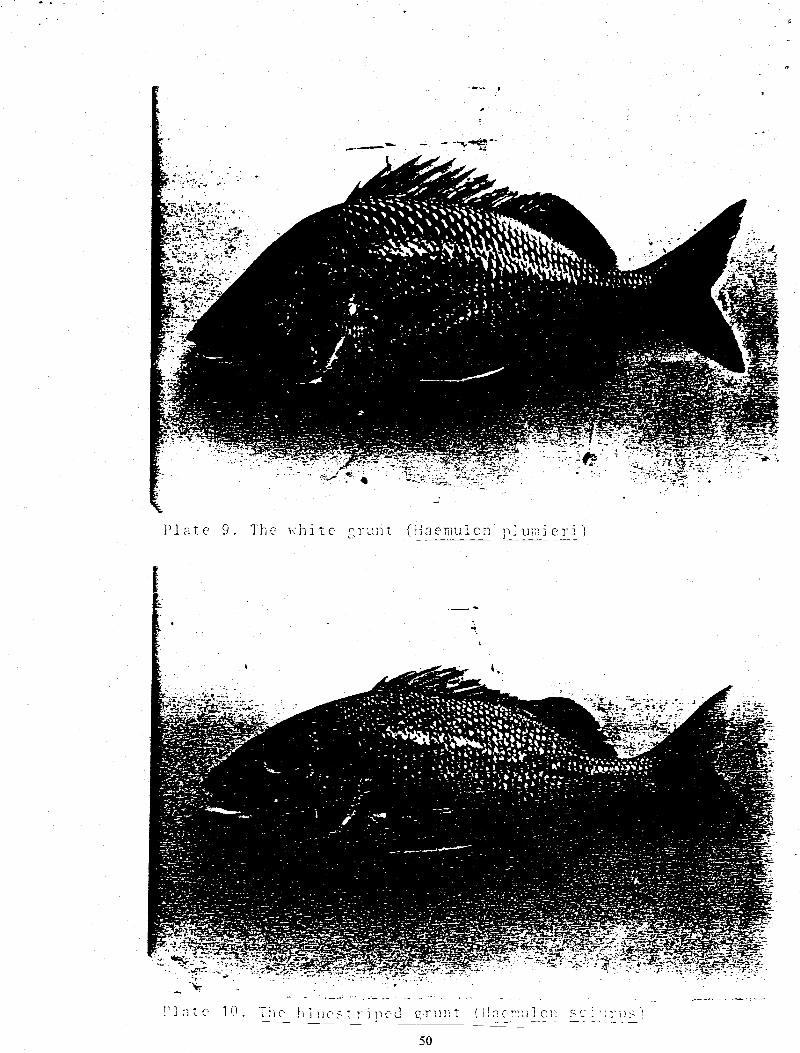
Plate 9. The white grunt (Haemulon plumieri) ................ 50
Plate 10. The bluestriped grunt (Haemulon sciurus) .......... 50
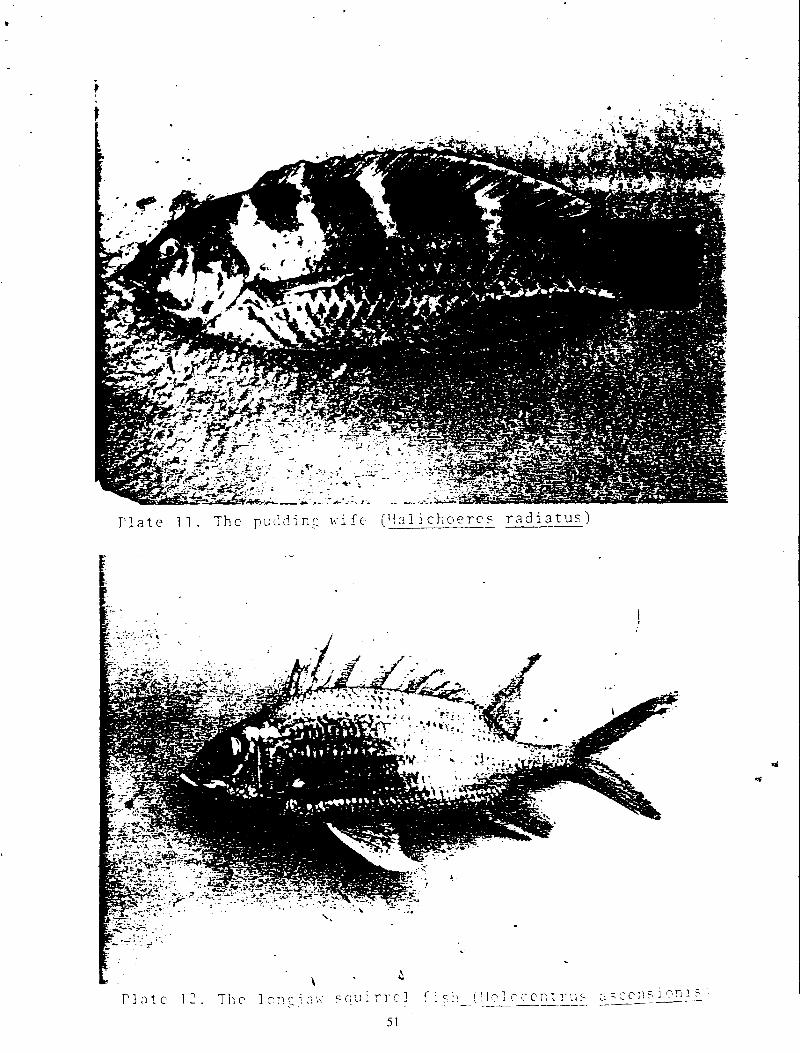
Plate 11. The pudding wife (Halichoeres radiatus) ........... 51
Plate 12. The longjaw squirrelfish (Holocentrus ascensionis) 51
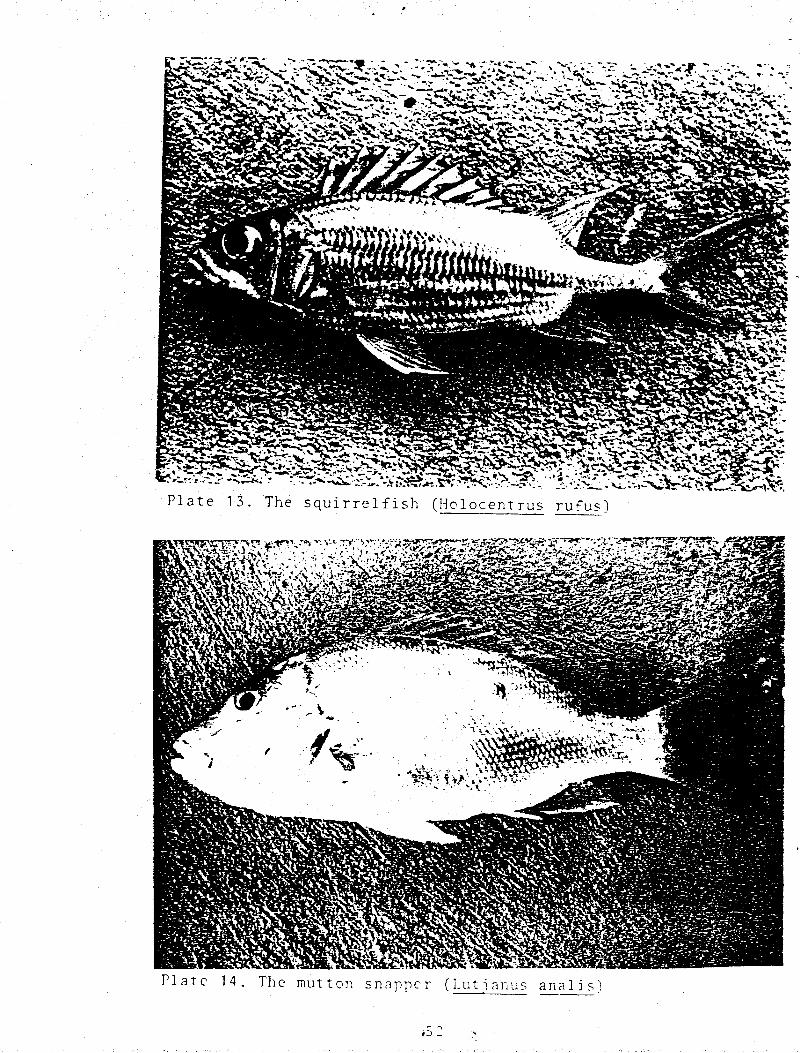
Plate 13. The squirrelfish (Holocentrus rufus) .............. 52
Plate 14. The mutton snapper (Lutjanus analis) .............. 52
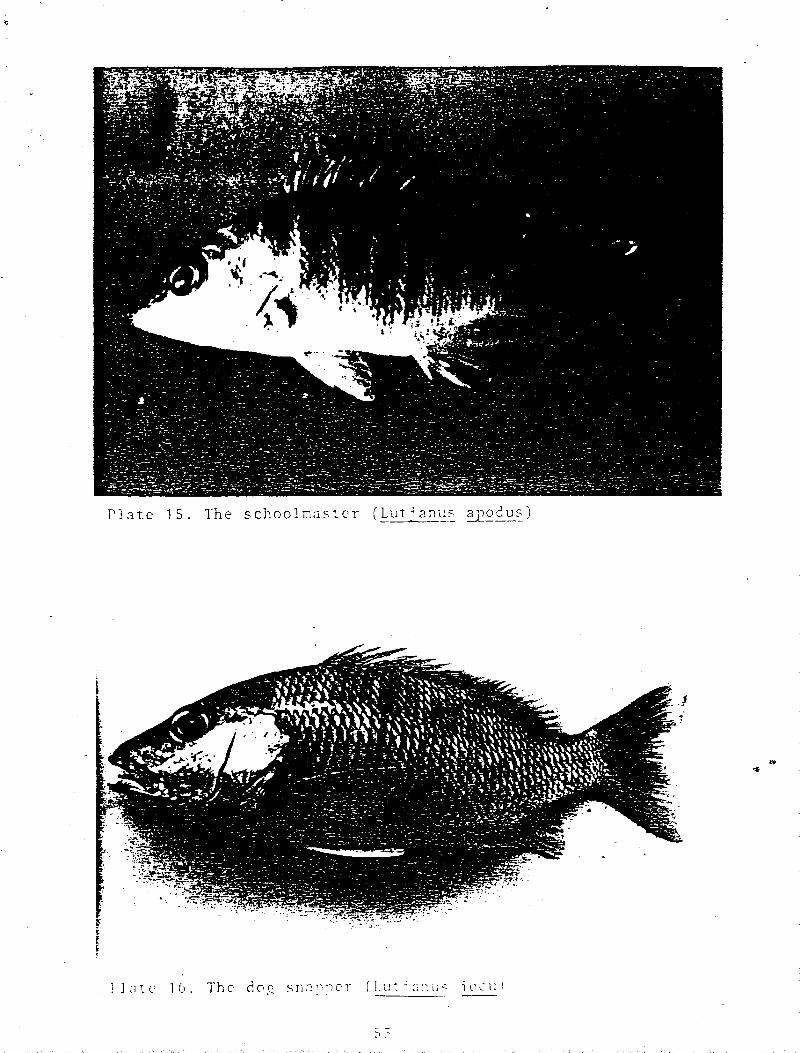
Plate 15. The schoolmaster (Lutjanus apodus) ................ 53
Plate 16. The dog snapper (Lutjanus jocu) ................... 53
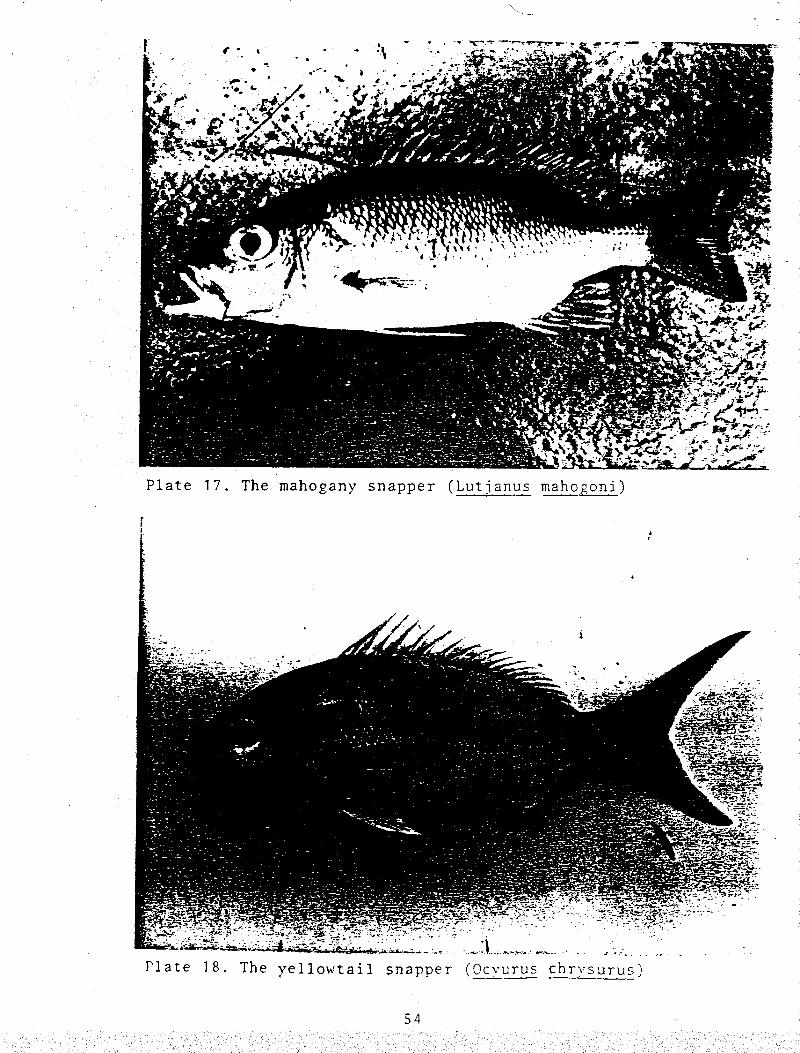
Plate 17. The mahogany snapper (Lutjanus mahogori) .......... 54
Plate 18. The yellowtail snapper (Ocyurus chrysurus) ........ 54
5

ABSTRACT
T w o c o r a l r e e f s in the s o u t h c o a s t of Puerto Rico (Cayo
Berberia and Cayo Ratones) were visually censused between 1983 and
1985 to determine the effects of sedimentation on their sport fish
populations.
Species composition, species diversity, dominant species and
a b u n d a n c e were the p a r a m e t e r s compared within and between the
zones of the two reefs studied. These parameters were correlated
with the degree of sedimentation to measure the effects of this
s t r e s s o r . S i m i l a r i t y indices were calculated within and between
the reef z o n e s . M a n n - W i t h n e y U-test was used to test for
significant differences in species abundances between the reefs.
The censusing technique used was a modification of the visual
m e t h o d d e v e l o p e d by B r o c k ( S e e B r o c k , 1954). The reason for
chosing the visual method was because this is a non-destructive
t e c h n i q u e for assessing fish populations. We compared the reefs
over a period of two years by setting permanent transect lines and
m a k i n g v i s u a l a s s e s s m e n t s periodically without disturbing the
populations.
S i x t y t h r e e reef s p o r t fish species were chosen as target
species. Nine reefs were evaluated during the first year in order
to choose the most convenient, logistically, for detailed study.
Cayo Berberia and Cayo Ratones were chosen on that basis.
C o r r e l a t i o n a n a l y s i s s h o w e d that there was a significant
r e l a t i o n s h i p b e t w e e n sedimentation and the abundance values of
four of the s p e c i e s s t u d i e d . A n o t h e r s e v e n species showed a
c o r r e l a t i o n m a r g i n a l l y c l o s e to the 95% confidence limit. A
significant correlation was also found between sedimentation and
t o t a l n u m b e r of f i s h / c e n s u s for Cayo Ratones and between
sedimentation and the evenness and diversity values for combined
data. Fourteen species showed significant differences in abundance
- 6 -

between the reef slopes of Berberia and Ratones reefs. For the A.
p a l m a t a z o n e s , ten s p e c i e s w e r e s i g n i f i c a n t l y different in
abundance.
Cayo Berberia showed the highest overall abundance, species
diversity and density. The reef slope of Berberia displayed the
greater abundance and species diversity. In Ratones, although the
s l o p e was more d i v e r s e , the A. palmata zone showed the highest
a b u n d a n c e . Mean a b u n d a n c e was very much influenced by large
n u m m b e r s of j u v e n i l e p a r r o t f i s h e s , g r u n t s and acanthurids.
Acanthurus spp. were represented in all of the censuses at both
reefs.
The maximum number of species in a particular census was 30
for the slope of Berberia while the maximum number of individuals
was 457 for the A. palmata zone of Ratones. The density (ind/m 2)
in the reef slope of Berberia ranged between .23 to .83 with a
mean of .52 while in the reef slope of Ratones it ranged between
.13 to .43 with a mean of .27. The high density values were very
much influenced by schooling species such as surgeonfishes, grunts
and p a r r o t f i s h e s . A c a n t h u r i d s were the d o m i n a n t species in
B e r b e r i a as w e l l as in R a t o n e s with 2 6 . 2 0 % and 33.67%,
respectively, of the total abundance. In Berberia the ten dominant
s p e c i e s a c c o u n t e d for 6 9 . 4 3 % of the total abundance while in
Ratones they made up 78.49% of the total.
The A. palmata and slope zones proved to be very different in
species composition and abundance. Cayo Berberia and Cayo Ratones
slopes showed an average similarity of .59 and .43 based on the
Sorenson (S) and the Bray and Curtis (B&C) Indices, respectively.
The A. palmata zones of these reefs showed an average similarity
of .57 (S) and .37 (B&C). The slope zones were more similar than
the A. p a l m a t a z o n e s . The l a r g e s t similarity between the two
zones, within a reef, was .74 (S) and .72 (B&C).
- 7 -
INTRODUCTION
The role of s e v e r a l factors such as structural complexity,
l i v e c o r a l c o v e r , and m i c r o h a b i t a t a v a i l a b i l i t y on species
diversity of coral reef fish populations has been well documented.
( S e e W i l l i a m s , 1982; Sale, 1977; Randall, 1963; Talbot, Russell
and Anderson, 1978; Alevizon and Brooks, 1975). The effects of
m a j o r s t o r m s and o t h e r a t m o s p h e r i c disturbances on the coral
c o m m u n i t y and a s s o c i a t e d fish f a u n a s have also been studied
(Walsh, 1983).
Reef fish communities have been increasingly recognized and
u t i l i z e d as v a l u a b l e e c o n o m i c and recreational resources but,
although an important resource, little is known about the impact
of different types of pollution and other human activities on the
reefs and their associated systems. Literature about the effects
of s e d i m e n t a t i o n on the diversity and abundance of coral reef
fishes, specially sport fish, is very scarce.
Some of the few studies include that of Johnston and Wildish
(1981) who demonstrated experimentally that the feeding of larval
herring was affected by the degree of sedimentation to which they
w e r e s u b j e c t e d . They f o u n d that in greater concentrations of
suspended sediment ( > 20mg/L) the visibility of prey and light
i n t e n s i t y were s i g n i f i c a n t l y d e c r e a s e d and the feeding rate
depressed.
Sale and Douglas (1981) found that the number of species seen
in several censuses was affected by water transparency but they
f a i l to s t a t e if that e f f e c t was caused by a reaction of the
f i s h e s to the s u s p e n d e d sediments and turbidity or because the
observers could not see the fishes even if they were present.
Galzin (1981) outlined the effects of sand dredging on fish
fauna from a lagoon habitat on the French West Indian Island of
G u a d a l u p e . He found that the resuspension in the water of fine
sand p a r t i c l e s caused by dredging activities had the following
effects:
- 8 -
a) provoked the disappearance of 20 fish species out of 29
which had colonized the principal dredging site during a
dredging interruption,
b) caused an almost total disappearance, or a large decrease,
in the ichthyological fauna in neighboring areas,
c) caused an unbalanced ichthyological population as shown by
the g r e a t v a r i a b i l i t y in the diversity indices and low
equitability values.
Amesbury (1981) reported that fish abundance and diversity in
Truck were s i g n i f i c a n t l y reduced in areas subjected to intense
deposition of sediments.
S e e l y e , H a s s e l b e r g and Mac ( 1 9 8 2 ) conducted a series of
controlled experiments to examine the potential absorption by fish
of contaminants from suspended sediments. They used fish from lake
and hatchery origin and found accumulation of PCB 's, Fe, As, Cr,
and Na w i t h i n a 10 day study period. These results demonstrate
that several common environmental contaminants can be accumulated
by f i s h d i r e c t l y from s u s p e n d e d sediments. They suggested the
possibility that contaminants associated with sediment particles
that c o l l e c t e d on the gills of the fish were taken up directly
through these tissues.
Diversity indices have been used by many authors to indicate
stress in aquatic systems. Wilhm and Dorris (1968), as cited in
Betchel and Copeland (1970), state that values below 1.0 represent
highly polluted areas, values between 1.0 and 2.0 indicate stress
and v a l u e s 2.0 and a b o v e i n d i c a t e r e l a t i v e l y unstressed
e c o s y s t e m s . But the diversity values are influenced by combined
e f f e c t s of f a c t o r s such as h a b i t a t s i z e , c u r r e n t patterns,
a v a i l a b i l i t y of r e c r u i t s , h a b i t a t structure and others which
cannot be considered as stressors. Furthermore, those values apply
to temperate and subtropical fish populations (Martin and Patus,
1973).
T h e r e e x i s t s a w e l l k n o w n l a t i t u d i n a l effect on species
diversity (Pianka, 1980). For example, Hobson (1982) counted only
- 9 -
30 s p e c i e s on 33 t r a n s e c t l i n e s over three years in four
Californian habitats compared to 133 species on 22 transects over
one y e a r in four H a w a i i a n h a b i t a t s . Generally, there. is more
d i v e r s i t y and l e s s a b u n d a n c e per s p e c i e s in tropical areas.
D i v e r s i t y i n d i c e s by t h e m s e l v e s are meaningless, so we used
diversity indices in conjunction with similarity indices to make
comparisons within and between reefs.
Many of the effects caused by sedimentation do not affect the
f i s h e s d i r e c t l y but the i n v e r t e b r a t e s w h i c h they feed upon.
M o l l u s k s , u r c h i n s , c o r a l s , a l g a e and all sedentary fauna are
seriously affected when subjected to high sediment rates (Galzin,
1981).
Many fish species are highly adaptable to stress situations
( H o c u t t et al. 1 9 8 2 ) . There are oportunistic species which are
t o l e r a n t of h e a t , c h e m i c a l s , o r g a n i c load and high turbidity
( M a r t i n and P a t u s , 1 9 7 3 ) . Thus, it was felt that a turnover in
species composition or abundance, or a significant difference in
these a t t r i b u t e s in two similar reefs could be an indicator of
s t r e s s in a c o m m u n i t y and would be u s e f u l as a parameter to
measure or estimate the effects of certain type of disturbance.
The objective of this study was to determine the density of
the principal sport fishes in two reef areas in the South Coast of
Puerto Rico and to assess the impact of sedimentation stress on
c o r a l reef c o m m u n i t i e s and their fish population by comparing
healthy and stressed sites.
MATERIALS AND METHODS
Visual census of coral reef fishes has become a widely used
method in the study of coral reef fish ecology because it is the
only n o n - d e s t r u c t i v e way to sample coral reef fish populations
(Brock 1954; Alevizon and Brook 1975; Jones and Chase 1975; Jones
and Thompson 1978; Risk 1972; Smith and Tyler 1975; Kimmel 1985;
Sanderson and Solonsky, 1980; Bohnsack and Bannerot, 1985). Many
- 10 -
researchers have statistically proved the validity of the method
and have pointed out the possible biases and ways to correct them
( S e e J o n e s and T h o m p s o n , 1978; Sale and Sharp, 1983; Sale and
D o u g l a s , 1 9 8 1 ) . K i m m e l ( 1 9 8 5 ) tested three methods for visual
counts of fishes and has used the technique in Puerto Rico.
The technique employed for this research is a modification of
the B r o c k v i s u a l method (See Brock,1954). Two observers equiped
w i t h S C U B A , a w a t c h , and a slate with a data collecting format
made quantitative visual censusing of reef fish fauna along 100
meters transect lines. The counting path for each diver was 2.5
meters wide. Each diver counted only the fishes at his side of the
transect. The two counts were summed together to arrive at a total
count.
At the p r e l i m i n a r y p h a s e of the study a test was made to
determine the optimum size of the sample area. Several 100 meters
t r a n s e c t s d i v i d e d into 10 meters intervals were laid along the
different zones of the reefs and all the individuals of the target
species were identified and counted. The 10 meter intervals were
later analyzed as independent transects and the cumulative number
of species in the first 10, the first 20, the first 30 meters,
etc. were compared with the qualitative lists previously made for
each zone. When cumulative number of species was plotted against
the transect length the curve reached an asymptotic level at 80
meters (Figure 1). The results shows that a length of 80 meters is
a d e q u a t e to s a m p l e more than 9 0 % of the assemblage. We
conservatively chose 100 meters to provide for a greater margin
for variation. Also it was felt that a 100 x 5 area was capable of
a c c o m o d a t i n g all the available species and thus any difference
between transects is independent of the size of the area chosen.
Due to the uneven distribution of fish throughout the coral
reefs we stratified them into four zones according to depth and
c o r a l s t r u c t u r e ( s e e Ferrer, 1985 for study site description).
T h r o u g h this p r o c e s s we g r o u p e d e l e m e n t s w h i c h shared some
c h a r a c t e r i s t i c so that a b e t t e r estimate of density could be
o b t a i n e d . When the total p o p u l a t i o n is divided into several
- 11 -
s u b p o p u l a t i o n s the e f f i c i e n c y of the s a m p l i n g is increased
(Caughley, 1978)
During the preliminary survey the four zones were sampled in
each reef. Nevertheless fish faunas present in the mixed and A .
palmata zones were not significantly different ( t-Test, p < .05),
and thus the mixed zone censuses were not performed subsequently.
The reef crest or breaker zone was almost always so rough that it
was i m p o s s i b l e to m a k e e n o u g h counts for comparisons with the
other areas.
In this method time is not a limiting factor. The time taken
to complete a transect is primarily a function of the density of
the fish at a given time of the day. The 100 meters transects were
c o m p l e t e d in an a v e r a g e time of 27 minutes. The observers were
allowed to search in caves, crevices, under ledges and had enough
t i m e to m a k e a c a r e f u l i d e n t i f i c a t i o n of the s p e c i e s .
N e v e r t h e l e s s , the standard deviation between the time spent for
r u n n i n g the t r a n s e c t s was only 7.5 m i n u t e s . Observers were
previously trained for quick identification of the species by the
use of slides and also by practical tests underwater previous to
the start of the study.
Maximum depth was 35 feet so bottom time was not a limiting
factor and decompression dives were not necessary. A record of the
counts was kept on two 7 x 11 Mylar sheets stapled together and
p r e p r i n t e d with the target species scientific names arranged in
alphabetical order. The form had rows for the 63 species and was
ruled vertically into twelve columns. The first for the specific
name, the next 10 corresponding to the 10 meter intervals and the
last column for the totals (Figure 2). Our study was restricted to
6 3 r e e f s p o r t f i s h s p e c i e s w h i c h were c h o s e n based on the
literature review and the previous experience of the researchers
on the r e e f s of the Island. The 10 meter intervals allowed the
researcher to obtain data about the distribution of species and to
identify the microniches along the 100 meters transect.
- 12 -
On the top side of the form, space is provided for recording
the area and station name, visibility, depth, time and date. A
lead p e n c i l was used for t a k i n g n o t e s and extra pencils were
a l w a y s k e p t in the vest pocket. A safety diver accompained the
observers swimming about three meters above the bottom and five
meters behind them. Although not taking notes, he was alert to the
species and their movements along the strip. Later, the species
seen by him and not by the observers were added to the counts.
If a fish school entered the transect they were counted-or
estimated to the nearest 5 to 10 individuals. At the end of the t r a n s e c t , the o b s e r v e r s swam back and counted those fishes not
previously seen.
For setting the transects, the reefs were divided into zones,
as explained before, and a transect was laid along each of them.
Each zone was more or less homogeneous if compared with the total
a r e a . T r a n s e c t l i n e s were not n e c e s s a r i l y laid straight but
following the contours of the different zones. The lines were made
o f a n o n - f l o a t i n g b r a i d e d nylon rope. Ten small numbered buoys
were attached with 1 meter cords to mark the 10 meters intervals.
It took no more than f i f t e e n minutes to lay down the transect
line. They were set permanently in position.
Of the visually censusable fishes there were several groups
that p r e s e n t e d s p e c i a l p r o b l e m s . I n d i v i d u a l s of the genera
K y p h o s u s , C a l a m u s and j u v e n i l e S c a r i d a e o f t e n could not be
accurately identified underwater at the species level. Thus, these
groups are reported collectivelly but treated as species in the
analyses. The only exception was Sparisoma viride (Scaridae) whose
juvenile is distinguishable from the other species of the Family.
S p e c i e s s u c h as L u t j a n u s a n a l i s and Calamus sp. were rapidly
s e a r c h for b e c a u s e this species tend to flee as soon as divers
approach them. The main shortcoming of visual censusing in this
study was the accurate counts of wandering schooling species such
as the Acanthurus so the three species of Acanthurus were counted
as a single species when they ocurred in mixed schools.
- 13 -
In the Thalassia beds fishes were collected with experimental
g i l l n e t s w h o s e s t r e t c h e d m e s h ranged from 1 to 5 inches.
C o l l e c t i o n p e r i o d s s p a n n e d from 3 to 4 hours. Day and night
collections were made.
We had c e r t a i n limitations for sampling in Thalassia beds.
Gill net samples were not taken as often as necessary because the
equipment used has to be managed from a larger vessel which was
available only twice. From the samples taken is not possible to
p r o v i d e a b u n d a n c e d a t a . V i s u a l q u a l i t a t i v e and quantitative
censuses were made but the latter proved to be ineffective due to
the low fish density and the large size of the Thalassia meadows
at both reefs. Individuals observed were visually categorized as
juveniles or adults.
To calculate fish density the total number of individuals of
all species per transect were summed and divided by the total area
covered by the transect (500m 2).
Within and between community comparisons were made using the
Shannon and Weaver(1948) diversity function (log base 10) and the
evenness values of Pielou (1978).
To examine the similarity in community structure within and
b e t w e e n r e e f s we used the Sorenson (1948) and Bray and Curtis
( 1 9 5 7 ) I n d i c e s of Similarity. Sorenson Index considers only the
p r e s e n c e or a b s e n c e of species while Bray and Curtis considers
also the abundance values by taking into account the relationship
of each species to its counterpart in another community (Jones and
Thompson, 1978).
A p r o g r a m for the A p p l e c o m p u t e r was developed for
calculating diversity and similarity indices using VisiCalc based
da to f i l e s . The statistical analyses were made with the Stat-Pro
and Key-Stat packages for the Apple.
- 14 -
RESULTS
CORAL REEF FISHES
General Description and Species Distribution
The data for all the transects within a reef was combined and
analyzed to examine the overall status of the fish communities of
Berberia and Ratones reefs .
Table 1 is a checklist of the species present per zone and
per reef and shows a cumulative total of 47 species observed in
Berberia and 48 species in Ratones. Ten species considered in this
s t u d y were n e v e r o b s e r v e d in any of the quantitative or
qualitative censuses of the reefs studied. Epinephelus striatus,
although observed during the qualitative censuses in Cayo Ratones;
was n e v e r f o u n d in the t r a n s e c t area. The most surprising and
unexpected finding was that Epinephelus fulvus, a common reef
fish, was not present in any of the qualitative or quantitative
censuses of Berberia.
Two species, Epinephelus striatus and Scarus coelestinus were
r e c o r d e d in B e r b e r i a but not in R a t o n e s and three species,
Epinephelus fulvus, Haemulon bonariense and Lutjanus synagris were
r e p r e s e n t e d in R a t o n e s but a b s e n t in Berberia. Caranx Tuber,
K y p h o s u s s p p . and the juveniles of Scarus although present in
Ratones were not as abundant as in Berberia. The opposite was true
for Haemulon chrysargyreum, Holocentrus ascencionis and Sparisoma
r u b r i p i n n e . F o r t y five species were common to both reefs. This
d o e s not m e a n s that s p e c i e s not s h a r e d in c o m m o n would not
e v e n t u a l l y a p p e a r if additional censuses were made because some
s p e c i e s s e e n d u r i n g the q u a l i t a t i v e censuses were never seen
d u r i n g the c o u n t s . T h r e e s p e c i e s , Acanthurus spp., Sparisoma
a u r o f r e n a t u m and S. v i r i d e w e r e r e p r e s e n t e d in 100% of the
censuses of Berberia while in Ratones only Acanthurus spp. was
counted in all the censuses (Figures 3 and 4). It is also evident
from these figures that in general the fish species in Berberia
reef were m o r e a s s o c i a t e d with the reef than the species at
- 15 -
Ratones reef. In Berberia seven species were found in more than
90% of the censuses and the least frequent species were found in
18% of the censuses. In Ratones reef only three species were found
in more than 90% of the censuses and 16 species appeared in 18% or
less of the countings.
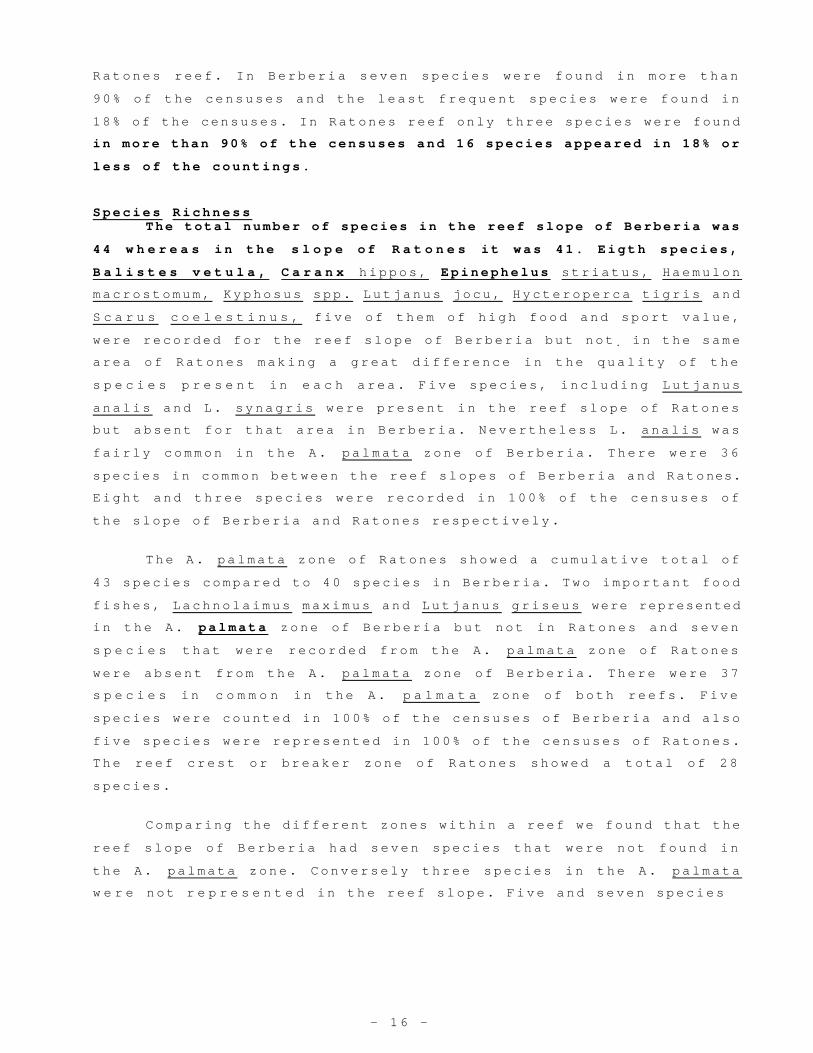
Species Richness The total number of species in the reef slope of Berberia was
44 w h e r e a s in the s l o p e of R a t o n e s it was 41. Eigth species,
B a l i s t e s v e t u l a , C a r a n x hippos, Epinephelus striatus, Haemulon
macrostomum, Kyphosus spp. Lutjanus jocu, Hycteroperca tigris and
S c a r u s c o e l e s t i n u s , five of them of high food and sport value,
were recorded for the reef slope of Berberia but not . in the same
area of Ratones making a great difference in the quality of the
s p e c i e s p r e s e n t in e a c h area. Five species, including Lutjanus
analis and L. synagris were present in the reef slope of Ratones
but absent for that area in Berberia. Nevertheless L. analis was
fairly common in the A. palmata zone of Berberia. There were 36
species in common between the reef slopes of Berberia and Ratones.
Eight and three species were recorded in 100% of the censuses of
the slope of Berberia and Ratones respectively.
The A. palmata zone of Ratones showed a cumulative total of
43 species compared to 40 species in Berberia. Two important food
fishes, Lachnolaimus maximus and Lutjanus griseus were represented
in the A. palmata zone of Berberia but not in Ratones and seven
s p e c i e s that were recorded from the A. palmata zone of Ratones
were absent from the A. palmata zone of Berberia. There were 37
s p e c i e s in c o m m o n in the A. p a l m a t a zone of both reefs. Five
species were counted in 100% of the censuses of Berberia and also
five species were represented in 100% of the censuses of Ratones.
The reef crest or breaker zone of Ratones showed a total of 28
species.
Comparing the different zones within a reef we found that the
reef slope of Berberia had seven species that were not found in
the A. palmata zone. Conversely three species in the A. palmata
w e r e not r e p r e s e n t e d in the reef slope. Five and seven species
- 16 -
were represented in 100% of the censuses of the A. palmata and
reef slope of Berberia respectively. Five species were represented
in 1 0 0 % of the c e n s u s e s of the A. palmata zone of Ratones and
three species in 100% of the slope 's censuses of this reef. For
Ratones reef there were seven species in the A. palmata zone not
represented in the reef slope and four species in the reef slope
that were absent from the A. palmata zone.
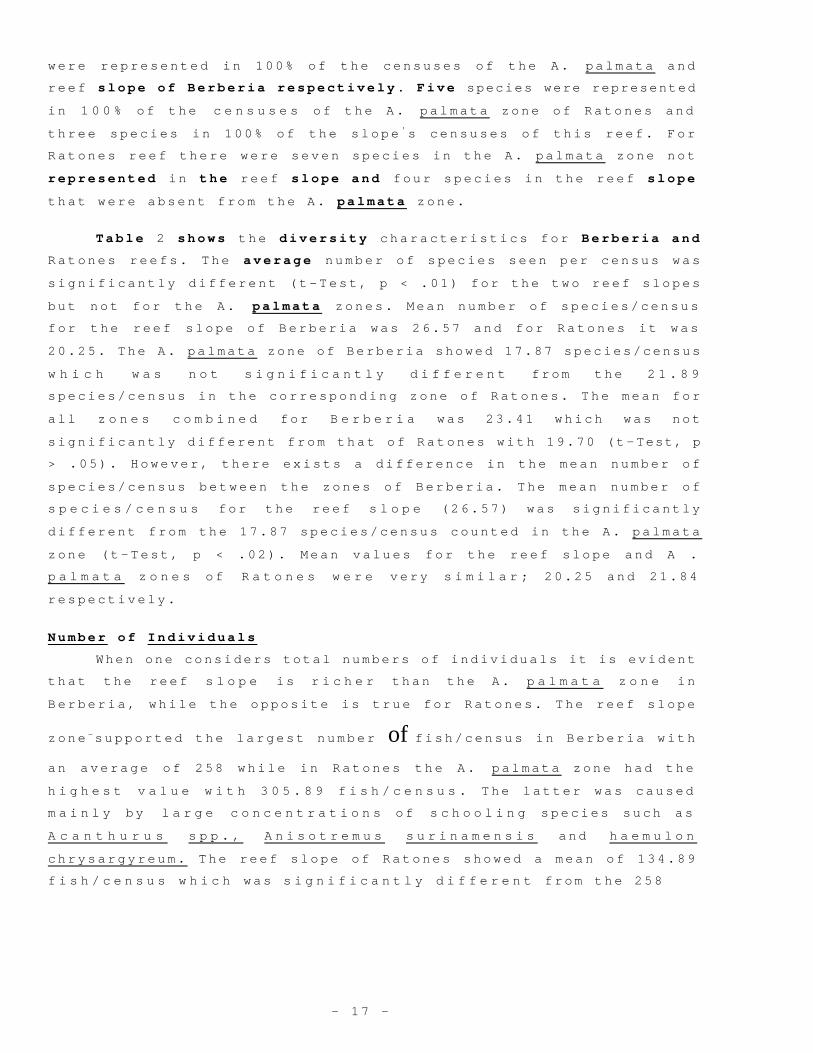
Table 2 shows the diversity characteristics for Berberia and
Ratones reefs. The average number of species seen per census was
significantly different (t-Test, p < .01) for the two reef slopes
but not for the A. palmata zones. Mean number of species/census
for the reef slope of Berberia was 26.57 and for Ratones it was
20.25. The A. palmata zone of Berberia showed 17.87 species/census
w h i c h w a s n o t s i g n i f i c a n t l y d i f f e r e n t from the 2 1 . 8 9
species/census in the corresponding zone of Ratones. The mean for
all z o n e s c o m b i n e d for B e r b e r i a was 23.41 which was not
significantly different from that of Ratones with 19.70 (t-Test, p
> .05). However, there exists a difference in the mean number of
species/census between the zones of Berberia. The mean number of
s p e c i e s / c e n s u s for the reef s l o p e (26.57) was significantly
different from the 17.87 species/census counted in the A. palmata
zone (t-Test, p < .02). Mean values for the reef slope and A .
p a l m a t a z o n e s of R a t o n e s w e r e very s i m i l a r ; 20.25 and 21.84
respectively.
Number of Individuals
When one considers total numbers of individuals it is evident
that the reef s l o p e is r i c h e r than the A. p a l m a t a z o n e in
Berberia, while the opposite is true for Ratones. The reef slope
zone -supported the largest number of fish/census in Berberia with an average of 258 while in Ratones the A. palmata zone had the
h i g h e s t v a l u e w i t h 3 0 5 . 8 9 f i s h / c e n s u s . The latter was caused
m a i n l y by l a r g e c o n c e n t r a t i o n s of s c h o o l i n g species such as
A c a n t h u r u s s p p . , A n i s o t r e m u s s u r i n a m e n s i s and h a e m u l o n
chrysargyreum. The reef slope of Ratones showed a mean of 134.89
f i s h / c e n s u s w h i c h was s i g n i f i c a n t l y d i f f e r e n t from the 258
- 17 -
fish/census of Berberia 's slope. The mean number of fish/census
for the combined data of Berberia (244.95) was not significantly
different from the mean of Ratones (215.37) (t-Test, p > .05). The
A. p a l m a t a z o n e s of these r e e f s did not s h o w a significant
difference (t-Test, p > .05). A significant difference (t-Test, p
< . 0 5 ) was f o u n d by c o m p a r i n g the mean number of fish/census
within Ratones reef but not for Berberia.
Density
We compared overall fish densities for the two reefs. Density
values for corresponding zones were also compared. Berberia had a
mean density of .49 fish/m 2 based on combined data which was not
s i g n i f i c a n t l y d i f f e r e n t f r o m the . 4 3 fish/m 2 calculated for
R a t o n e s ( M a n n - W h i t n e y U - T e s t , p > .05). The reef slope of
Berberia with .52 fish/m 2 was significantly different from the
slope of Ratones with .27 fish/m 2 (Mann-Whitney U-test, p < .05).
However the A. palmata zone of Ratones with .61 fish/m 2 did not
show a significant difference with the A. palmata zone of Berberia
with .44 fish/m 2 ( M a n n - W i t h n e y U-Test, p > .05). The zones of
Ratones were significantly different (t-Test, p < .05) in terms of
density but not Berberia 's zones. The mean density for the reef
c r e s t of R a t o n e s was h i g h e r than that of the reef slope. The
highest density in a particular census was .91 fish/n 2 for the A .
palmata zone of Ratones.
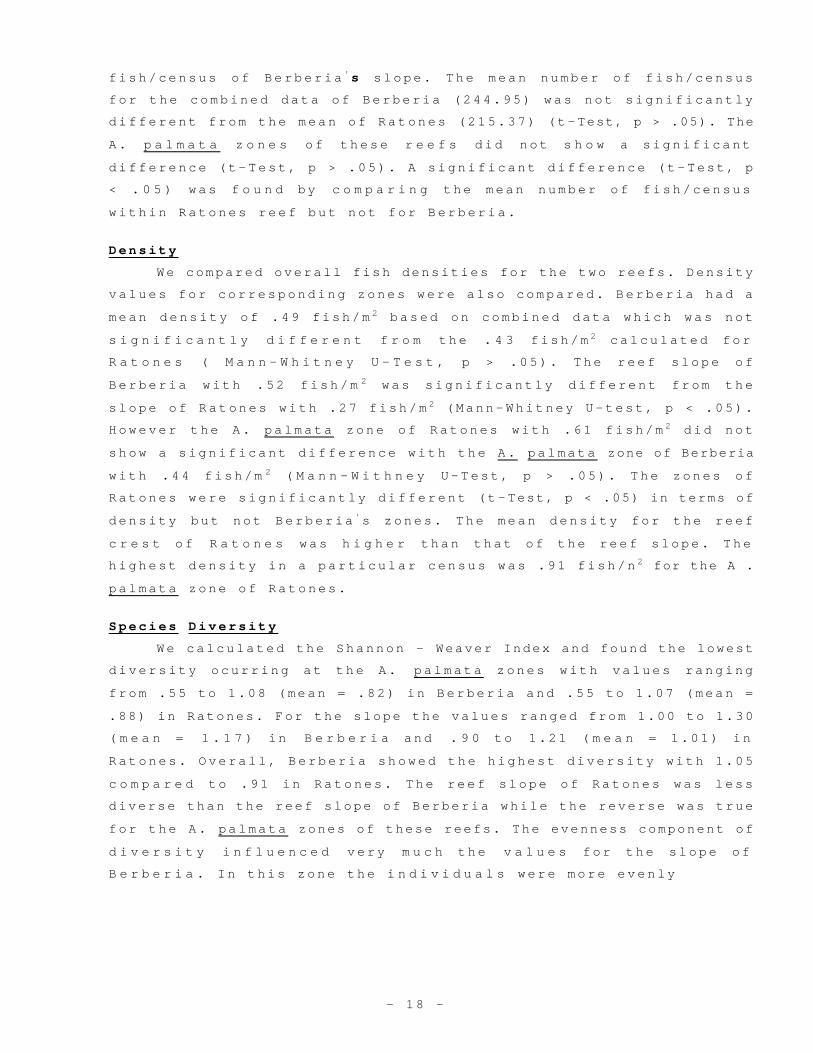
Species Diversity
We calculated the Shannon - Weaver Index and found the lowest
diversity ocurring at the A. palmata zones with values ranging
from .55 to 1.08 (mean = .82) in Berberia and .55 to 1.07 (mean =
.88) in Ratones. For the slope the values ranged from 1.00 to 1.30
( m e a n = 1 . 1 7 ) in B e r b e r i a and . 9 0 to 1.21 ( m e a n = 1.01) in
Ratones. Overall, Berberia showed the highest diversity with 1.05
c o m p a r e d to .91 in Ratones. The reef slope of Ratones was less
diverse than the reef slope of Berberia while the reverse was true
for the A. palmata zones of these reefs. The evenness component of
d i v e r s i t y i n f l u e n c e d very m u c h the v a l u e s for the slope of
B e r b e r i a . In this zone the i n d i v i d u a l s were more evenly
- 18 -
distributed within the species present. Mean evenness in this zone
was the h i g h e s t with . 8 3 . The mean overall evenness value was
higher for Berberia (.77) than for Ratones (.71).
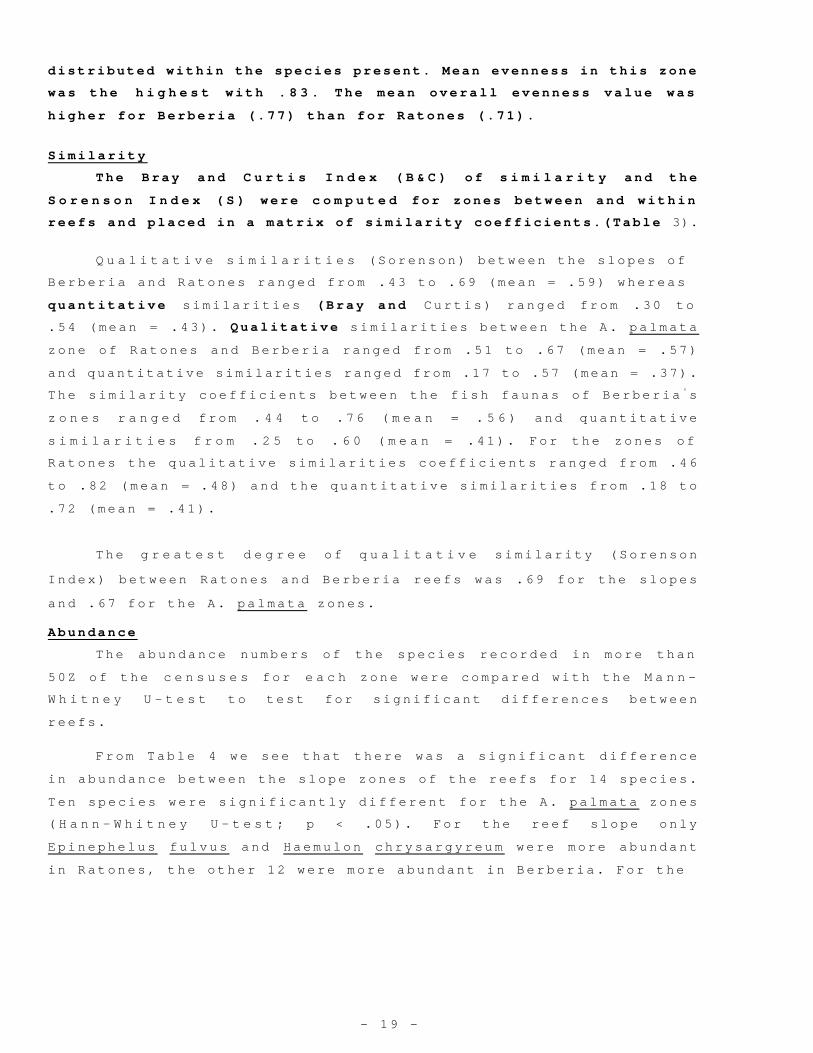
Similarity
The Bray and C u r t i s I n d e x ( B & C ) of s i m i l a r i t y and the
S o r e n s o n I n d e x ( S ) were c o m p u t e d for zones between and within
reefs and placed in a matrix of similarity coefficients.(Table 3).
Q u a l i t a t i v e s i m i l a r i t i e s (Sorenson) between the slopes of
Berberia and Ratones ranged from .43 to .69 (mean = .59) whereas
quantitative similarities (Bray and Curtis) ranged from .30 to
.54 (mean = .43). Qualitative similarities between the A. palmata
zone of Ratones and Berberia ranged from .51 to .67 (mean = .57)
and quantitative similarities ranged from .17 to .57 (mean = .37).
The similarity coefficients between the fish faunas of Berberia 's
z o n e s r a n g e d from . 4 4 to .76 ( m e a n = . 5 6 ) and quantitative
s i m i l a r i t i e s f r o m . 2 5 to . 6 0 ( m e a n = .41). For the zones of
Ratones the qualitative similarities coefficients ranged from .46
to .82 (mean = .48) and the quantitative similarities from .18 to
.72 (mean = .41).
The g r e a t e s t d e g r e e of q u a l i t a t i v e similarity (Sorenson
Index) between Ratones and Berberia reefs was .69 for the slopes
and .67 for the A. palmata zones.
Abundance
The abundance numbers of the species recorded in more than
50Z of the c e n s u s e s for e a c h zone were compared with the M a n n -
W h i t n e y U - t e s t to test for significant differences between
reefs.
From Table 4 we see that there was a significant difference
in abundance between the slope zones of the reefs for 14 species.
Ten species were significantly different for the A. palmata zones
( H a n n - W h i t n e y U - t e s t ; p < .05). For the reef slope only
Epinephelus fulvus and Haemulon chrysargyreum were more abundant
in Ratones, the other 12 were more abundant in Berberia. For the
- 19 -

A. palmata zone only Lutjanus griseus and Scarus guacamaia were
more a b u n d a n t in B e r b e r i a . E p i n e p h e l u s f u l v u s and Haemulon
chrysargyreum were more abundant in both zones of Ratones while
S c a r u s g u a c a m a i a dominated in both zones of Berberia. Lutjanus
apodus was more abundant in the reef slope of Berberia than in the
reef slope of Ratones but less abundant in the A. palmata zone of
Berberia than in the A. palmata zone of Ratones.
A n i s o t r e m u s s u r i n a m e n s i s represented 7.41% of the total
abundance for the reef slope of Berberia while for the reef slope
of R a t o n e s it a c c o u n t e d only for .19%. This difference may be
attributable to the l a c k o f a suitable habitat in the reef slope
of R a t o n e s for this s p e c i e s . In B e r b e r i a reef it was always
present in caves formed by large Montastrea colonies. Such caves
w e r e not a v a i l a b l e in the reef s l o p e of R a t o n e s . Although
E p i n e p h e l u s _ f u l v u s was not very abundant in the reef slope of
R a t o n e s , it was c o m p l e t e l y absent from Berberia This situation
requires further studies because there is no apparent reason for
their a b s e n c e in Berberia. Factors such as competition, fishing
p r e s s u r e , food a v a i l a b i l i t y and habitat availability should be
considered.
Some species showed marked differences in abundance between
the two z o n e s of e a c h of the r e e f s s t u d i e d , as for example,
Kyphosus spp. and Anisotremus surinamensis were always recorded at
the same spot in Berberia 's reef slope and not in the A. palmata
z o n e a l t h o u g h the t r a n s e c t l i n e s for these zones were fairly
c l o s e . Most of the s p e c i e s ocurred in both zones but had
p r e f e r e n c e for one of t h e m . The difference between the zones
within a reef were not tested statistically.
Dominant Species The 10 dominant fish species per zone and for each reef are
shown in Table 5. These represented 78.89% of the total abundance
for Ratones and 69.43% for Berberia. Seven of the dominant species
were common to both reefs although their abundance varied greatly
between them. Three of the ten dominant species of Ratones were
not represented in the ten dominant species of Berberia. Similarly
- 20 -

three of the ten dominant species of Berberia were not represented
in the ten dominant species of Ratones. The reef slope of Ratones
and Berberia shared six of the ten dominant species for that zone
while five species were shared in the A. palmata zone. The slope
and A. p a l m a t a z o n e s of R a t o n e s shared eight of the dominant
species and the slope and A. palmata zones of Berberia shared six
species.
A c a n t h u r u s s p p . r a n k e d first in abundance in all zones of
both r e e f s . N u m b e r s of A c a n t h u r u s spp. represented 33.67% and
26.2% of the abundance for Berberia and Ratones respectively being
the most a b u n d a n t s p e c i e s . W i t h i n the Acanthurus most of the
individuals observed were A. bahianus. Ocassionally they ocurred
in monospecific schools of more than 100 individuals. A. chirurgus
was the rarest of the acanthurid group. Haemulon chrysargyreum, .
which ranked second in Ratones (11.79%), was not represented in
the ten dominant species of Berberia. The species which ranked
s e c o n d in b e r b e r i a , S p a r i s o m a aurofrenatum, was the nineth in
Ratones with 3.36% of the total abundance.
The greatest difference in abundance for the reef slope was
shown by Haemulon macrostomum and Lutjanus jocu which were very
common in Berberia but not in Ratones. In the A. palmata zone the
greatest difference was shown by Haemulon chrysargyreum which was
very c o m m o n in R a t o n e s but few individuals were recorded for
B e r b e r i a . In a n o t h e r c o m m o n reef fish species there was more
d i v e r g e n c e t h a n e x p e c t e d . The u s u a l l y very c o m m o n Haemulon
flavolineatum ranked third in Ratones while it was the seventh in
abundance in Berberia.
FISHES OF THE THALASSIA BEDS AND 1-IANGROVES
General Description
A total of 23 species of fishes were recorded for Ratones and
22 s p e c i e s for B e r b e r i a ( T a b l e 6 ) . S e v e n s p e c i e s that were
r e c o r d e d for R a t o n e s w e r e a b s e n t in Berberia and six of the
b e r b e r i a ' s s p e c i e s were absent in Ratones. Sixteen species were
common to both areas.
- 21 -
Visual observations in the T h a l a s s i a beds of both areas
indicated a large number of juvenile fish species. Large numbers
of j u v e n i l e g r u n t s , parrotfishes, and yellowtails were commonly
observed. One of the few exceptions were adult Sphyraena barracuda
which were common at both areas. Also, adult individuals of Caranx
ruber were observed in the mangrove area of Ratones.
Juveniles of Balistes vetula, Acanthurus spp. and Holocentrus
s p p . were f r e q u e n t l y - f o u n d living in the empty shells of queen
c o n c h s . A l m o s t e v e r y object or structure in the grass flats of
both areas was occupied by one or several species of fishes.
Schools of more than 100 individuals of juvenile Haemulon
flavolineatum and Mulloidichthys martinicus were commonly seen in
the m a n g r o v e a r e a of R a t o n e s . Pseudupeneus maculatus was also
fairly common. Medium size Lut janus griseus, L. apodus a n d H .
s c i u r u s were c o m m o n in the m a n g r o v e and T h a l a s s i a beds of
Berberia.
Qualitative similarities between the fish assemblages of the
two areas studied yielded a value of .71 for the three year study
period.
DISCUSSION CORAL REEF FISHES
Berberia and Ratones reefs were expected to differ in fish
species composition and/or abundance since they are subjected to
different rates of sedimentation. Sedimentation rate in Berberia's
slope ranged from 2.34 mg/cm 2/day to 47.55 mg/cm 2/day while for
the same area of Ratones it ranged from 8.09 mg/cm 2/day to 53.07
mg/cm 2/day. For the A. palmata zones Berberia 's values ranged from
3.96 mg/cm 2/day to 16.61 mg/cm 2/day and from 27.83 mg/cm 2/day to
1 1 6 . 8 3 m g / c m 2/day in Ratones. (see Ferrer, 1986). These values
proved to be significantly different, (t-Test, p < .05).
- 22 -
Fourteen species out of 49 showed significant differences in
a b u n d a n c e b e t w e e n the two reef slopes and 10 species out of 46
showed significant differences between the A. palmata zones (Table
4 ) . The f i s h f a u n a s of these two reefs are slightly over 50%
similar. Mean qualitative similarity between the reef slopes was
only .59 and the mean quantitative similarity was only .43. The A. palmata zones showed a mean qualitative similarity of .57 and a
mean q u a n t i t a t i v e similarity of .37. Considering values down to
. 8 0 as i n d i c a t i n g i d e n t i t y in f a u n a l c o m p o s i t i o n (Sale and
D o u g l a s , 1 9 8 1 ) , we have that the values obtained represent a
significant difference in the composition of the fish faunas of
the reefs studied.
S t a t i s t i c a l l y s i g n i f i c a n t correlations were found between
sedimentation and some of the diversity parameters in Berberia and
Ratones reefs. The number of was positively correlated
(r 'l = .438, p < .05) with sedimentation in the Ratones reef
( T a b l e 7 ) . N e v e r t h e l e s s t o t a l d i v e r s i t y and e v e n n e s s were
n e g a t i v e l y c o r r e l a t e d i n d i c a t i n g a possible shift in species
c o m p o s i t i o n and a b u n d a n c e . Galzin (1981) found evidence which
s u g g e s t s that h i g h l y t u r b i d water caused by dredging directly
influences benthic flora and fauna, resulting in the elimination
o f c e r t a i n s p e c i e s and permitting the proliferation of others.
A p p a r e n t l y , while some species tend to disappear from the area
o t h e r s , w h i c h are t o l e r a n t to h i g h sedimentation increase in
n u m b e r s , thus decreasing the diversity and evenness values. How
long can a particular species live in a highly sedimented area is
not known. That would require laboratory manipulation for testing.
Three species, Balistes vetula, Sparisona rubripinne and S.
viride showed significant positive correlation with sedimentation
(Table 8). The relationship of B. vetula is difficult to explain.
We expected this species to show a negative correlation since it
is frequently seen in clear waters. We believe that the abundance
o f this s p e c i e s was too low to make a valid inference.
Nevertheless S. viride and S. rubripinne were expected to show a
p o s i t i v e c o r r e l a t i o n as they did. These species are common in
- 23 -

fairly s e d i m e n t e d areas where algae, their principal foods, are
a b u n d a n t . O t h e r t h r e e s p e c i e s , A c a n t h u r u s spp., Holocentrus
a s c e n c i o n i s and H a e m u l o n c h r y s a r g y r e u m showed a positive
correlation marginally close to the 95% confidence limit. A high
positive correlation was expected for the former two but not for
the latter. Acanthurus form large schools and are common in areas
with heavy g r o w t h of algae and Holocentrus ascencionis is also
common in areas of high turbidity but Haemulon chrysargyreum is
m o r e c o m m o n on c l e a r w a t e r r e e f s and in m a n g r o v e a r e a s as
juveniles. Lutjanus mahogoni showed a negative correlation with
sedimentation as was expected for this species and Epinephelus
cruentatus and Haemulon flavolineatum showed negative correlation
with sedimentation very close to the 95% confidence limit. All are
common in reefs of clear waters.
C h a n g e s in a b u n d a n c e and s p e c i e s composition were often
o b s e r v e d a s s o c i a t e d with an increase in suspended sediments and
poor visibility. Species like Caranx bartholomaei and Sphyraena
barracuda were only seen when visibility was poor. These changes
in visibility appear to be often correlated with periods of heavy
rainfall and moderate to strong wind.
P h y s i c a l f a c t o r s such as wind velocity, wave exposure and
water d e p t h s t r o n g l y i n f l u e n c e s the resuspension of sediments
(Marshall and Orr, 1931). Average sedimentation in the shallower
A. palmata zones was higher than in the slope zones of both reefs
although stations were fairly close (Ferrer, et al. 1985). As a
possible consequence of this the distribution of species may be
affected as is suggested by the data we obtained. It was found
that the mean quantitative similarity between the fish communities
of the zones of Ratones as well as for the zones of Berberia was
only .41. For Berberia values as low as .18 were obtained.
It was frequently observed, as Brock (1954) point out, that
several species had a definite pattern of distribution associated
with bottom topography. Many species were observed consistently in
the same places of the reefs. This behavior of restricting their
habitat to certain characteristics of the bottom must have a major
- 24 -
effect upon their abundance if their habitat is subjected to any
kind of stress and the availability of similar places are limited.
The scarcity of suitable areas for these species would become a
m a j o r o b s t a c l e for their abundance since the densities of the
s p e c i e s are r e l a t e d to the h a b i t a t a v a i l a b l e and reef fish
production is strongly habitat dependent (Smith and Tyler, 1972;
S a l e , 1975; O g d e n and E h r l i c h , 1977). The problem may be
exacerbated during the recruitment phase when the fishes may not
be able to c o m p e t e for s p a c e and could be more vulnerable to
p r e d a t i o n . Nevertheless, since fishes are mobile organisms they
have the option of avoiding environmental disturbances and danger
( H o c u t t , 1 9 8 2 ) . So m a n a g e m e n t p l a n s for reef fishes should
c o n s i d e r the d e s i g n of a r t i f i c i a l s t r u c t u r e s as refugia in
unstressed sites where the physical relief of the bottom does not
provide shelter for the fishes to live if the natural areas are
subjected to irreversible damages.
FISHES OF THE THALASSIA AND MANGROVES AREAS
A total of 29 (46%) species, almost all of them juveniles,
out of 63 t a r g e t s p e c i e s , w e r e recorded in the Thalassia and
mangrove areas of both sites although no exhaustive sampling was
done. Martin and Cooper (1981) sampling with ichthyocides in the
Thalassia beds in the southwestern coast of Puerto Rico collected
only 12 ( 1 9 % ) of our target species. Weinstein and Heck (1979)
reported 24 (38%) of our target species for the seagrass meadows
along the Caribbean Coast of Panama. If we take into cosideration
that many of the t a r g e t species are exclusively reef fishes we
c o u l d a s s u m e that the assemblage of this areas was fairly well
qualitatively described.
The data collected by us, as can be seen from Table 6, shows
that the Thalassia beds of both areas proved to be of inestimable
value as nursery areas for many juvenile fish species by providing
cover for them and for the organisms on which they feed (Randall,
19676; Medina, et al, 1986). Many of this species are an important
c o m p o n e n t of the s p o r t and c o m m e r c i a l fishery or are of
considerable value as bait or forage.
- 25 -
Other r e s e a r c h e r s have found similar relationships between
the fish communities and the seagrasss meadows. Ogden and Ehrlich
( 1 9 7 7 ) found that many fish s p e c i e s , as well as certain
i n v e r t e b r a t e s , spend all or part of their juvenile life in
seagrass beds and Randall (1967), Ogden and Ehrlich, 1977; Smith
and Tyler, 1972 have documented the daily migrations of many reef
f i s h s p e c i e s to the beds to feed. Thorhaug (1981) say that the
s e a g r a s s m e a d o w s provide a habitat for hundredes of species of
fish, c r u s t a c e a n and mollusks which have juvenile forms needing
p r o t e c t i o n and s h e l t e r in the early life stages. Weinstein and
Heck (1979) found that juveniles of reef-associated predators are
c o m m o n in the s e a g r a s s m e a d o w s . In summary, the role of this
habitat as a nursery area for many fish species is a well known
fact.
Apparently the presence of seagrass beds had an effect on the
c o m p o s i t i o n of the reef f i s h f a u n a in the areas studied as
i n d i c a t e d by the n u m b e r s of g r u n t s and s n a p p e r s . H a e m u l o n
f l a v o l i n e a t u m , H. c h r y s a r g y r e u m and Lutjanus apodus were very
c o m m o n in both r e e f s . T h e s e f i s h e s depend very much on the
Tiialassia beds for feeding and shelter (Randall, 1967; Stoner,
1981).
A l t h o u g h we are u n a b l e to p r o d u c e quantitative data for
comparing the seagrass beds of this reefs it is evident from the
similarity index (Sorenson Index = .71) that there are differences
in their fish communities.
CONCLUSIONS
Many f a c t o r s are p r o b a b l y involved in the structuring of
coral reef fish communities and sedimentation is one of them as
s u g g e s t e d by the d a t a . S e d i m e n t a t i o n is l i k e l y to c a u s e a
significant change in the composition and abundance of coral reef
fish populations. The relative importance of each factor depends
on their m a g n i t u d e and may differ between different species of
f i s h e s . Their influences have implications on the management of
- 26 -
this and its associated communities and therefore on the general
environment and the well being of a country 's fisheries.
The correlation between sedimentation and diversity of coral
reef f i s h c o m m u n i t i e s i n d i c a t e s that their structure may be
i n f l u e n c e d by the s e d i m e n t a t i o n stress to which they are
s u b j e c t e d . We found s i g n i f i c a n t d i f f e r e n c e s in fish species
r i c h n e s s and d e n s i t y in two r e e f s with d i f f e r e n t r a t e s of
sedimentation. Although Ratones reef was structurally more complex
t h a n B e r b e r i a ( F e r r e r , 1 9 8 6 ) , w h i c h p r o v i d e s for a higher
diversity and density of fishes (Risk, 1972; Alevizon and Brooks,
1975; G l a d f e l t e r and Gladfelter, 1978;), the latter showed the
highest diversity and density. Being Ratones reef more affected by
sedimentation, it is evident that sedimentation plays a major role
in the structuring of these fish communities.
The d e v e l o p m e n t of c o a s t a l tourism and the sport and
c o m m e r c i a l f i s h e r i e s , w h i c h d e p e n d on a h e a l t h y marine
e n v i r o n m e n t , could be affected by sedimentation processes. The
source of the sediments may be of biological origin but the most
d a n g e r o u s , due to their t o x i c i t y , are those that come from
industrial, agricultural and domestic wastes.
Sediment loads could seriously affect the fish population of
the reefs if not adequately managed, by shifting the composition
of species from first category species to less desirable species
as is s u g g e s t e d by the data obtained. In general, the species
present at Berberia, the least stressed reef, are of higher sport
and c o m m e r c i a l q u a l i t y t h a n the species at Ratones reef.
Important food and game fish such as groupers, snappers and grunts
all prefered clear waters. It appears that these groups of fishes
would be d e t r i m e n t a l l y affected by sedimentation. On the other hand
the s a m e p r o c e s s of s e d i m e n t a t i o n may be a factor contributing to the
abundance of other species which prefer turbid weaters but it is well
known that the most sought after species are those that prefer clear
waters.
- 27 -

T h e o r i e s r e g a r d i n g the s t r u c t u r i n g of c o r a l reef fish
communities are frequently found on literature. Many authors have
suggested the role of stochastic processes to account for it. But
t h e r e a l s o e x i s t s m u c h e v i d e n c e that many factors, not only
chance, are responsible for the patterns of community structure.
This investigation presents some evidence that sedimentation could
be one of those factors.
This i n v e s t i g a t i o n p r o v i d e s baseline data on the general
ecology of both reefs and general aspects about the structures of
their fish communities. These may serve as a frame of reference to
e v a l u a t e a n a t u r a l s y s t e m and to d e t e c t c h a n g e s c a u s e d by
s e d i m e n t a t i o n or o t h e r d i s t u r b a n c e s and s h o u l d be used to
f o r m u l a t e m a n a g e m e n t guidelines for the marine environment. No
previous data about the -fishes of the reefs studied is available.
RECOMMENDATIONS
1. Extraction of bottom materials, dredging, filling,
dumping a n d o t h e r a c t i v i t i e s w h i c h could i n c r e a s e
the sedimentation in the coral reefs should be prohibited
or highly regulated.
2. The quality and quantity of our fishery resources that
depend on the coral reefs should be determined in order to
have baseline data for future reference.
3. Coral reef areas with touristic potential should be
i d e n t i f i e d and p r o t e c t e d by m e a n s of the existing
regulations or by the creation of natural reserves.
4. General oceanographic studies to collect baseline data
about the normal levels of sedimentation, turbidity, water
t r a n s p a r e n c y , and circulation patterns of the currents
should be conducted around the Island 's reefs. These would
serve as a guide to establish water quality standards for
those parameters.
5. Statistics on fishing pressure and the recreational use
of the reefs is necessary.
- 28 -

6. The use of artificial reefs and fish attractor devices
as a method for increasing the fishery resources should
be studied.
7. Creel census data should be collected around the Island.
8. Ocean outfall sites for disposal of domestic and
i n d u s t r i a l w a s t e s should consider the presence of coral
reef c o m m u n i t i e s and its a s s o c i a t e d s y s t e m s and the
general oceanographic conditions.
10. Sites for future developments should be chosen taking
into consideration the delicate balance of the marine
e n v i r o n m e n t and the p o s s i b l e adverse effects of these
activities.
11. New surveys in other reefs would be useful in
establishing the relationships observed between fish
population and the condition of the habitat.
12. It was felt that if the reefs were different in fish
species composition and abundance, the differences could
be d o c u m e n t e d with the method u s e d . We feel that the
method is accurate but could be improved if an underwater
tape r e c o r d e r is used b e c a u s e many species are missed
when you are l o o k i n g at the slate, whereas with a
r e c o r d e r the o b s e r v e r eyes do not leave the transect.
Also, the utilization of a video camera would provide a
permanent record of each transect.
13. We focused on sport fishes for this investigation but
the h y p o t h e s i s that f i s h p o p u l a t i o n s could be
seriously a f f e c t e d by sedimentation would be better
approached by assessing other species that could be better
indicators of sedimentation like the chaetodontids which
are suspected to have coevolved with corals and thus would
be the first s p e c i e s to d i s s a p p e a r if the c o r a l s are
affected by s e d i m e n t a t i o n . Additional research is needed
considering all the reef f i s h species and the
relationships between them.
- 29 -

LITERATURE CITED
Alevizon, W.S. and M.G. Brooks. 1975. The comparative structure of
two W e s t e r n A t l a n t i c f i s h a s s e m b l a g e s . Bull. Mar. Sci.,
25:482-490.
Amesbury, S.S. 1981. Effects of turbidity on shallow water reef
fish assemblages in Truk, Eastern Caroline Island. 4th. Int.
Coral Reef Symposium. Mar. Sci. Center, Univ. of Phillipines.
Beavis, W.R. et al. 1979. A study of the mercury concentrations of
the fish off the South and West coasts of Puerto Rico. U.P.R.
CEER-M-42.
Bechtel, T.J. and B.J. Copeland. 1970. Fish diversity indices as
i n d i c a t o r s o f p o l l u t i o n in G a l v e s t o n B a y , T e x a s .
Contributions Mar. Sci., Univ. Texas. 15: 103-132.
B o h n s a c k , J . A . and S.P. Bannerot. 1983. A random point census
technique for visually assessing coral reef fishes. In: C.A.
B a r a n s , and S . A . Bortone. (Eds.). The visual assessment of
f i s h p o p u l a t i o n s in the Southeastern United States: 1982
W o r k s h o p . S o u t h C a r o l i n a Sea Grant Consortium, Technical
Report 1, SC-SG-TR-01-83. 52 p.
B r a y , J . R . and J . T . C u r t i s . 1957. An ordination of the upland
forest communities of Southern Wisconsin. Ecol. Monog., 27:
325-349.
Brock, V.E. 1954. A preliminary report on a method of estimating
reef fish populations. Jour. Wildlife Mgmt., 18(3): 297-308.
Caughley, G. 1978. Analysis of vertebrate populations. John Wiley
and Sons.
Collette, B.B. and F.H: Talbot. 1972. Activity patterns of coral
reef f i s h e s w i t h emphasis on nocturnal-diurnal changeover.
In: B.B. C o l l e t t e and S.A. E a r l e , (Eds.) Results of the
- 30 -
T e k t i t e p r o g r a m : E c o l o g y of Coral Reef Fishes. Nat. Hist.
Mus. L.A. Co. Sci. Bull. 14.
Colton, D.E. and W.S. Alevizon. 1981. Diurnal vaiability in a fish
a s s e m b l a g e of a B a h a m i a n c o r a l r e e f . Env. Biol. Fish.,
6(3-4): 341-345.
Ferrer, h. et al. 1986. Assessment of coral reefs at Cayo Berberia
and Cayo Ratones. First part of this report.
Galzin, R. 1981. Effects of coral sand dredging on fish fauna in
the l a g o o n of the "G r a n d Cul de Sac M a r i n ", Guadalupe,
French West Indies. Proc. Int. Coral Reef Simposium.
G l a d f e l t e r , W . E . and E . H . G l a d f e l t e r . 1978. F i s h community
structure as a function of habitat structure on West Indian
patch reefs. Revista de Biologia Tropical, 26(1): 65-84.
H o b s o n , E.S. 1965. Diurnal-noctur-:al activity of some inshore
fishes in the Gulf of California. Copeia, 3: 291-302.
H o b s o n , E.S. 1972. Activity of hawdiian reef fishes during the
e v e n i n g and m o r n i n g t r a n s i t i o n s between dayligth and
darkness. Fish. Bull., 70: 715-740.
H o b s o n , E.S. 1 9 8 2 . The s t r u c t u r e of f i s h communities on
warm-temperate and tropical reefs. In: G.R. Huntsman et al.
The biological bases for reef fishery management. NOAA Tech.
Nemo., NPIFS-SEFC-80.
Hocutt, C.h. et al. 1982. Observations of behavioral responses of
fishes to environmental stress in situ. J. Applied Ecology,
19: 443-451.
J o h n s t o n , D . D . and D . J . W i l d i s h . 1982. Effects of suspended
s e d i m e n t on f e e d i n g by l a r v a l h e r r i n g (Clupea harengus
harengus). Bull. Env. Cont. Toxicol., 24: 261-267.
- 31 -
J o n e s , R . S . and J . A . C h a s e . 1 9 7 5 . C o m m u n i t y s t r u c t u r e and
d i s t r i b u t i o n of f i s h e s in an e n c l o s e d lagoon in Guam.
Micronesica, 2: 127-148.
Jones, R.S. and M.J. Thompson. 1978. Comparison of Florida reef
fishes assemblages using a rapid visual technique. Bull. Mar.
Sci., 28:159-172.
Kimmel, J.J. 1985. A new species-time method for visual assessment
of fishes and its comparison with established methods. Env.
BIOL . Fish., 12(1): 23-32.
Marshall, S.M. and A.P. Orr. 1931. Sedimentation on Low Isles Reef
and its relation to coral growth. Sci. Rep. Brit. Mus., 1:
94-133.
Martin, F.U. and J.W. Patus. 1973. A comparison of fish faunas in
a highly stressed and less stressed tropical bay; Guayanilla
and J o b o s B a y , P.R., 27th. Annual Conf. Southeastern Div.
Amer. Soc., Hot Springs, Ark.
M c F a r l a n d , W . N . et al. 1979. The i n f l u e n c e of light in the twilight
migrations of grunts. Env. Biol. Fish., 4: 9-22.
Medina, E. et al, 1986. Assessment of the seagrass beds of Cayo
Berberia and Cayo Ratones. Second part of this report.
Ogden, J.C. and Buckman, N.S. 1973. Movements, foraging groups and
d i u r n a l m i g r a t i o n s of the s t r i p e d p a r r o t f i s h e s Scarus
croicencis (Scaridae), Ecology, 54(3): 589-596.
Ogden, J.C. and P.R. Ehrlich. 1977. The behavior of heterotipic
r e s t i n g s c h o o l s of j u v e n i l e g r u n t s (Pomadasyidae). Mar.
BIOL., 42: 273-280.
P i e l o u , E.C. 1978. Population and community ecology. Principles
and methods. pp. 289-315.
- 32 -
R a n d a l l , J . E . 1 9 6 3 . An a n a l y s i s of the fish populations of
artificial and natural reefs in the Virgin Islands. Carib. J.
Sci., 3(1): 31-47.
R i s k , M.J. 1972. Fish d i v e r s i t y on a coral reef in the Virgin
Islands. Atoll Res. Bull., 193: 1-6.
S a l e , P . F . 1975. P a t t e r n s of use of space in a guild of
territorial reef fishes. Mar. Biol., 29: 89-97.
Sale, P.F. 1977. Maintenance of high diversity in coral reef fish
communities. Am. Naturalist. 111: 337-359.
S a l e , P . F . and W.A. D o u g l a s . 1 9 8 1 . Precision and accuracy of
visual census technique for fish assemblages on coral patches
reefs. Env. Biol. Fish., 6(3-4): 333-339.
S a l e , P . F . and B.J. Sharp. 1983. Correction for bias in visual
t r a n s e c t c e n s u s e s of c o r a l reef fishes. Coral Reefs, 2:
37-42.
Sanderson, S.L. and A.G. Solonsky. 1980. A comparison of two visual
survey t e c h n i q u e s for fish populations. Student-Originated
Studies Program. National Science Foundation.
Seelye, J.G., R.J. Hesselberg and M.J. Mac. 1982. Accumulation by
fish of c o n t a m i n a n t s released from dredged sediments. Env.
Sci. Technol., 16: 459-464.
Shannon, C.E. 1948. A mathematical theory of communication. Bell
System Tech. J., 27: 379-423, 623-656.
S m i t h , C . L . and J . C . T y l e r . 1972. Space resource sharing in a
coral reef fish community. Los Angeles Co. Natur. Hist. Mus.
Sci. Bull., 14: 125-170.
Smith, C.L. and J.C. Tyler. 1975. Succession and stability in fish
of d o m e s h a p e d patch r e e f s in the West Indies. Amer. Mus.
Nov., 2572: 1-18.
- 33 -
S o r e n s o n , T. 1 9 4 8 . A m e t h o d for establishing groups of equal
a m p l i t u d e in plant society based on similarity of species
content. K. Dansk Vidensk. Selsk, 5: 1-34.
Talbot, F.H., B.C. Russell and G.R.V. Anderson. 1978. Coral reef
fish c o m m u n i t i e s : unstable, high diversity systems. Ecol.
Monogr., 49: 425-440.
W a l s h , W . J . 1983. S t a b i l i t y of a coral reef fish community
following a catastrophic storm. Coral Reefs. 2: 49-63.
W e i n s t e i n , M.P. and K . L . H e c k . 1979. Ichthyofauna of seagrass
meadows along the Caribbean Coast of Panama and in the Gulf
of M e x i c o : c o m p o s i t i o n , structure and community ecology.
Marine Biology, 50: 97-107.
Williams, D. McB. 1980. Dinamics of the pomacentrid community on
small patch reefs in One Tree Lagoon. Bull. of Mar. Sci., 30:
159-170.
W i l l i a m s , D . M c B . 1982. P a t t e r n s in the distribution of fish
c o m m u n i t i e s a c r o s s the c e n t r a l Great Barrier Reef. Coral
Reefs, 1: 35-43.
W i l l i a m s , D. M c B . and A.I. H a t c h e r . 1983. Structure of fish
communities on outer slopes of inshore, mid-shelf and outer
shelf reefs of the slope Great Barrier Reef. Marine Ecology,
10: 234-250.
- 34 -


Appendix 1. Scientific, English and Spanish Names of the Fishes Included in the Censuses
Scientific Name English Name Spanish Name
Acanthurus bahianus Ocean surgeon Medico
Acanthurus chirurgus Doctorfish Medico
Acanthurus coeruleus Blue tang Medico
Anisotremus surinamensis Black margate Vieja
Anisotremus virginicus Porkfish Sargento
Balistes vetula Queen triggerfish Peje puerco
Calamus spp. Porgy Pluma
Caranx bartholomaei Yellow jack Guavmen amarillo
Caranx crysos Blue runner Cojinua
Caranx hippos Crevalle jack Jurel
Caranx latus Horse eye jack Jurel ojon
Caranx ruber Bar jack Cojinua
Epinephelus adscensionis Rock hind Cabra mora
Epinephelus cruentatus Graysby Cabrilla
Epinephelus fulvus Coney Mantequilla
Epinephelus guttatus Red hind Cabrilla
Epinephelus itajara Jewfish Judio
Epinephelus striatus Nassau grouper Cherna
Haemulon aurolineatum . Tomtate Mulita
Haemulon album Margate Ronco blanco
- 55
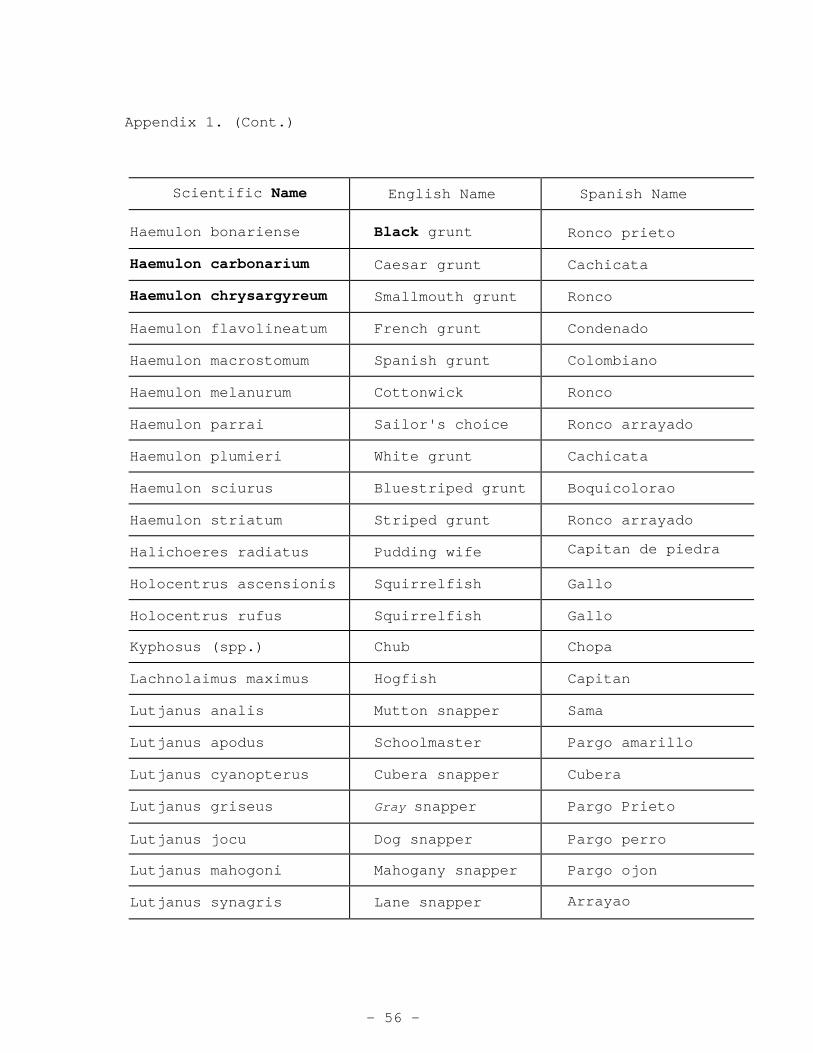
Appendix 1. (Cont.)
Scientific Name English Name Spanish Name
Haemulon bonariense Black grunt Ronco prieto
Haemulon carbonarium Caesar grunt Cachicata
Haemulon chrysargyreum Smallmouth grunt Ronco
Haemulon flavolineatum French grunt Condenado
Haemulon macrostomum Spanish grunt Colombiano
Haemulon melanurum Cottonwick Ronco
Haemulon parrai Sailor's choice Ronco arrayado
Haemulon plumieri White grunt Cachicata
Haemulon sciurus Bluestriped grunt Boquicolorao
Haemulon striatum Striped grunt Ronco arrayado
Halichoeres radiatus Pudding wife Capitan de piedra
Holocentrus ascensionis Squirrelfish Gallo
Holocentrus rufus Squirrelfish Gallo
Kyphosus (spp.) Chub Chopa
Lachnolaimus maximus Hogfish Capitan
Lutjanus analis Mutton snapper Sama
Lutjanus apodus Schoolmaster Pargo amarillo
Lutjanus cyanopterus Cubera snapper Cubera
Lutjanus griseus Gray snapper Pargo Prieto
Lutjanus jocu Dog snapper Pargo perro
Lutjanus mahogoni Mahogany snapper Pargo ojon
Lutjanus synagris Lane snapper Arrayao
- 56 -
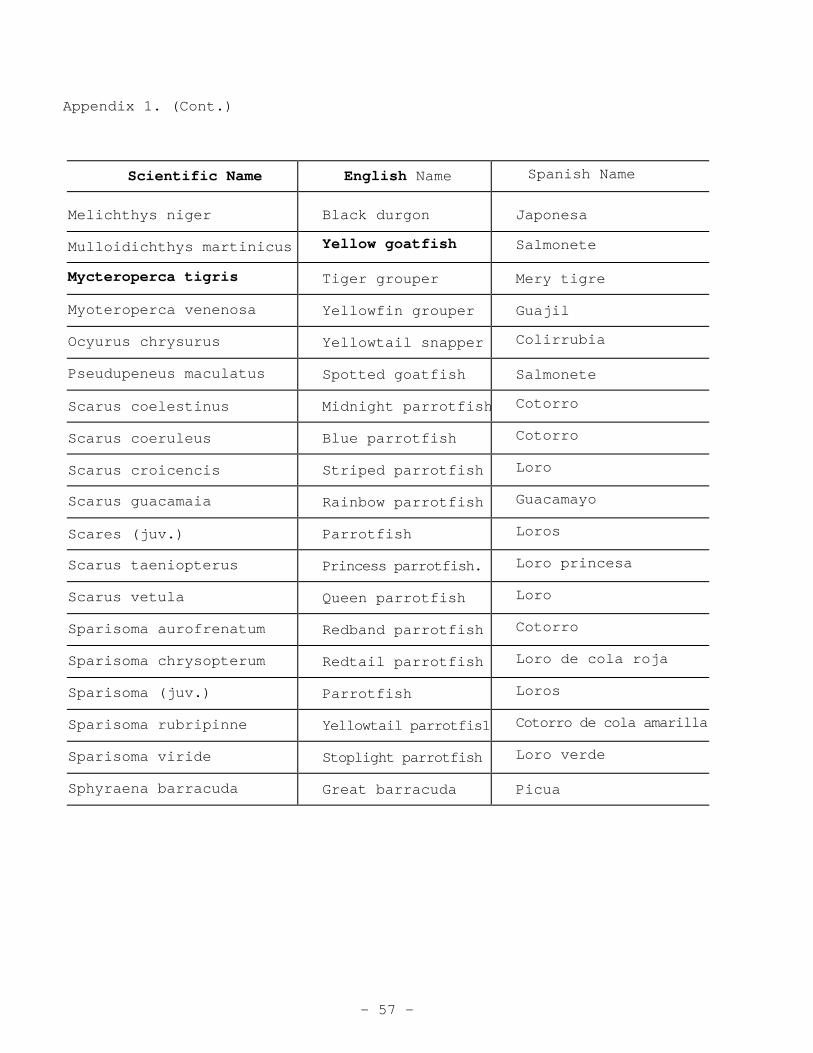
Appendix 1. (Cont.)
Scientific Name English Name Spanish Name
Melichthys niger Black durgon Japonesa
Mulloidichthys martinicus Yellow goatfish Salmonete
Mycteroperca tigris Tiger grouper Mery tigre
Myoteroperca venenosa Yellowfin grouper Guajil
Ocyurus chrysurus Yellowtail snapper Colirrubia
Pseudupeneus maculatus Spotted goatfish Salmonete
Scarus coelestinus Midnight parrotfish Cotorro
Scarus coeruleus Blue parrotfish Cotorro
Scarus croicencis Striped parrotfish Loro
Scarus guacamaia Rainbow parrotfish Guacamayo
Scares (juv.) Parrotfish Loros
Scarus taeniopterus Princess parrotfish. Loro princesa
Scarus vetula Queen parrotfish Loro
Sparisoma aurofrenatum Redband parrotfish Cotorro
Sparisoma chrysopterum Redtail parrotfish Loro de cola roja
Sparisoma (juv.) Parrotfish Loros
Sparisoma rubripinne Yellowtail parrotfis1 Cotorro de cola amarilla
Sparisoma viride Stoplight parrotfish Loro verde
Sphyraena barracuda Great barracuda Picua
- 57 -

58
Commonwealth of Puerto Rico Department of Natural Resources
Scientific Research Area Marine Resources Division
ASSESSMENT OF CORAL REEFS AT CAYO BERBERIA AND CAYO RATONES
HOWARD FERRER HANSEN MIGUEL CANALS MORA
FISH POPULATION STUDIES OF THE SEAGRASS BEDS AND CORAL REEFS OF CAYO BERBERIA AND CAYO RATONES, PONCE, P.R.
JOSE M. BERRIOS DIAZ. JAIME K. GONZALEZ AZAR ISRAEL DIAZ RODRIGUEZ
THALASSIA TESTUDINUM BEDS ASSESSMENT IN CAYO BERBERIA AND CAYO RATONES
Emilia I. Medina Colon Luz M. Cruz Torres Jorge Rodriguez Echegaray
Antonio Rios Diaz Gerardo Ortiz Miller