Fish Passage Effectiveness of Recently Constructed...
16
Fish Passage Effectiveness of Recently Constructed Road Crossing Culverts in the Puget Sound Region of Washington State DAVID M. PRICE,* TIMOTHY QUINN, AND ROBERT J. BARNARD Washington Department of Fish and Wildlife, 600 Capitol Way North, Olympia, Washington 98501, USA Abstract.—Fish passage barriers at road–stream crossings are widely recognized as salmon Oncorhynchus spp. habitat restoration priorities in Washington State and throughout the Pacific Northwest of the USA. More than 3,500 fish passage barriers (mostly culverts) have been repaired in Washington streams since 1999, costing more than US$139 million. We evaluated fish passage at 77 randomly selected culverts (new and repaired) that were issued permits during three time periods (1998, 2003, and 2007). This sample represents approximately 85% of the fish passage culverts permitted in the Puget Sound region of Washington State during the last 10 years. All study culverts were permitted for fish passage under the Washington Department of Fish and Wildlife’s (WDFW) hydraulic project approval (HPA) permitting process and evaluated using physical criteria in the WDFW’s fish passage barrier standard. Our results indicate that 30% of culverts (23 of 77) permitted under the HPA process for fish passage were, in fact, barriers. Culverts permitted as no-slope (one of the most common design types) or as an unknown design type were barriers in 45% of cases. Most culvert failures were due to noncompliance with permit provisions, particularly culvert slope, and a lack of critical evaluation of proposed plans in the context of site conditions by permitting biologists. We found no relationship between barrier status and permit date, experience of permitting biologists, quality of permit, or project sponsor type (private, public, or restoration entity). These results indicate the need for mechanisms to ensure better compliance from project sponsors and an improved process to critically evaluate the adequacy of proposed plans in the context of project site conditions. Road crossings at rivers and streams are widely known to pose potential barriers to fish movement when fish passage structures such as culverts are improperly designed or installed (Bates et al. 2003). The consequences to fish populations associated with barriers at road crossings include the loss of habitat access for various life history stages, such as spawning or juvenile rearing (Beechie et al. 2006; Sheer and Steel 2006); genetic isolation (Reiman and Dunham 2000; Wofford et al. 2005; Neville et al. 2009); inaccessibility to refuge habitats from disturbance events such as floods, debris torrents, and fire (Dunham et al. 1997; Reeves et al. 1995; Lamberti et al. 1991); and extirpation (Winston et al. 1991; Kruse et al. 2001). Because of their low cost relative to bridges, culverts are the most common fish passage structures at road crossings. Maintaining fish passage through culverts at road crossings is a substantial challenge because culverts are a fixed feature in a dynamic stream environment (Gubernick et al. 2003). As stream channels meander laterally and undulate vertically under shifting flow, sediment, and wood influences, unyielding culverts can become impediments to fish migration (Bates et al. 2003). Floods can magnify the influence of stream flow on culverts (Furniss et al. 1998). Recent studies underscore the magnitude of the challenge presented by culverts both in terms of the sheer number of structures across the landscape and in their effectiveness in passing fish upstream. For example, the U.S. Forest Service and Bureau of Land Management reported that over 10,000 culverts exist on fish-bearing streams in federal lands of Washington and Oregon, and they estimated that at least half may be fish passage barriers (GAO 2001). The Washington State Department of Transportation alone owns 3,175 fish passage structures, of which 60% (1,893) were barriers (WDFW 2009). In Canada, Langill and Zamora (2002) found that 58.5% of the randomly selected new culverts in four counties of Nova Scotia were barriers while Gibson et al. (2005) found that 53% of culverts over a 210-km, newly constructed road network were barriers to fish in southern Labrador. The importance of restoring fish passage at road crossings in Washington was heightened with the passage of the Salmon Recovery Act (1998) and the Forests and Fish Act (1999). All regional recovery plans for salmon Oncorhynchus spp. in Washington emphasize the importance of restoring fish passage at road crossings as a priority mechanism for rebuilding Endangered Species Act–listed salmon and steelhead O. mykiss populations. Likewise, Washington forest * Corresponding author: [email protected] Received January 12, 2010; accepted June 28, 2010 Published online September 13, 2010 1110 North American Journal of Fisheries Management 30:1110–1125, 2010 Ó Copyright by the American Fisheries Society 2010 DOI: 10.1577/M10-004.1 [Article]
Transcript of Fish Passage Effectiveness of Recently Constructed...

Fish Passage Effectiveness of Recently Constructed Road CrossingCulverts in the Puget Sound Region of Washington State
DAVID M. PRICE,* TIMOTHY QUINN, AND ROBERT J. BARNARD
Washington Department of Fish and Wildlife, 600 Capitol Way North, Olympia, Washington 98501, USA
Abstract.—Fish passage barriers at road–stream crossings are widely recognized as salmon Oncorhynchus
spp. habitat restoration priorities in Washington State and throughout the Pacific Northwest of the USA. More
than 3,500 fish passage barriers (mostly culverts) have been repaired in Washington streams since 1999,
costing more than US$139 million. We evaluated fish passage at 77 randomly selected culverts (new and
repaired) that were issued permits during three time periods (1998, 2003, and 2007). This sample represents
approximately 85% of the fish passage culverts permitted in the Puget Sound region of Washington State
during the last 10 years. All study culverts were permitted for fish passage under the Washington Department
of Fish and Wildlife’s (WDFW) hydraulic project approval (HPA) permitting process and evaluated using
physical criteria in the WDFW’s fish passage barrier standard. Our results indicate that 30% of culverts (23 of
77) permitted under the HPA process for fish passage were, in fact, barriers. Culverts permitted as no-slope
(one of the most common design types) or as an unknown design type were barriers in 45% of cases. Most
culvert failures were due to noncompliance with permit provisions, particularly culvert slope, and a lack of
critical evaluation of proposed plans in the context of site conditions by permitting biologists. We found no
relationship between barrier status and permit date, experience of permitting biologists, quality of permit, or
project sponsor type (private, public, or restoration entity). These results indicate the need for mechanisms to
ensure better compliance from project sponsors and an improved process to critically evaluate the adequacy of
proposed plans in the context of project site conditions.
Road crossings at rivers and streams are widely
known to pose potential barriers to fish movement
when fish passage structures such as culverts are
improperly designed or installed (Bates et al. 2003).
The consequences to fish populations associated with
barriers at road crossings include the loss of habitat
access for various life history stages, such as spawning
or juvenile rearing (Beechie et al. 2006; Sheer and
Steel 2006); genetic isolation (Reiman and Dunham
2000; Wofford et al. 2005; Neville et al. 2009);
inaccessibility to refuge habitats from disturbance
events such as floods, debris torrents, and fire (Dunham
et al. 1997; Reeves et al. 1995; Lamberti et al. 1991);
and extirpation (Winston et al. 1991; Kruse et al.
2001).
Because of their low cost relative to bridges, culverts
are the most common fish passage structures at road
crossings. Maintaining fish passage through culverts at
road crossings is a substantial challenge because
culverts are a fixed feature in a dynamic stream
environment (Gubernick et al. 2003). As stream
channels meander laterally and undulate vertically
under shifting flow, sediment, and wood influences,
unyielding culverts can become impediments to fish
migration (Bates et al. 2003). Floods can magnify the
influence of stream flow on culverts (Furniss et al.
1998).
Recent studies underscore the magnitude of the
challenge presented by culverts both in terms of the
sheer number of structures across the landscape and in
their effectiveness in passing fish upstream. For
example, the U.S. Forest Service and Bureau of Land
Management reported that over 10,000 culverts exist
on fish-bearing streams in federal lands of Washington
and Oregon, and they estimated that at least half may
be fish passage barriers (GAO 2001). The Washington
State Department of Transportation alone owns 3,175
fish passage structures, of which 60% (1,893) were
barriers (WDFW 2009). In Canada, Langill and
Zamora (2002) found that 58.5% of the randomly
selected new culverts in four counties of Nova Scotia
were barriers while Gibson et al. (2005) found that
53% of culverts over a 210-km, newly constructed road
network were barriers to fish in southern Labrador.
The importance of restoring fish passage at road
crossings in Washington was heightened with the
passage of the Salmon Recovery Act (1998) and the
Forests and Fish Act (1999). All regional recovery
plans for salmon Oncorhynchus spp. in Washington
emphasize the importance of restoring fish passage at
road crossings as a priority mechanism for rebuilding
Endangered Species Act–listed salmon and steelhead
O. mykiss populations. Likewise, Washington forest
* Corresponding author: [email protected]
Received January 12, 2010; accepted June 28, 2010Published online September 13, 2010
1110
North American Journal of Fisheries Management 30:1110–1125, 2010� Copyright by the American Fisheries Society 2010DOI: 10.1577/M10-004.1
[Article]

landowners are required to repair all fish passage
barriers prior to 2016 in an agreement codified under
Washington State law (Revised Code of Washington
76.09). Between 1999 and 2008, 3,500 fish passage
barrier culverts were replaced with fish-passable
structures, reportedly opening nearly 5,955 km of fish
habitat in Washington streams (Governor’s Salmon
Recovery Office 2008). However, these estimates
assume that the culverts were designed, permitted,
and constructed to pass fish and that they will continue
to pass fish through time.
Road Crossing Designs for Fish Passage
There are many accepted structures for fish passage,
each with its own physical design criteria (Hotchkiss
and Frei 2007). In Washington State, bridges, stream
simulation culverts, hydraulic design culverts, and no-
slope design culverts are the primary design types
(Bates et al. 2003). Bridges are preferred because they
allow most natural stream channel dynamics (lateral
migration is a common exception) to occur. Stream
simulation culverts are designed to mimic natural
stream channels by creating a channel within the
culvert that is similar to adjacent natural channels. By
design, stream simulation culverts should present no
more of an obstacle to fish and other aquatic organisms
than the adjacent natural channel (Bates et al. 2003;
Jackson 2003; Clarkin et al. 2005; Hotchkiss and Frei
2007). Hydraulic design culverts are engineered for the
passage of specific target species and life stages
(CDFG 2002). This type of culvert design is becoming
increasingly rare in Washington because it relies on
information about the physical swimming and leaping
capabilities of specific fish species and life stages,
which is generally unavailable for all but the strongest
swimmers (Robison et al. 1999; CDFG 2002; Bates et
al. 2003; Coffman 2005). No-slope culverts are
designed to be installed in low-gradient streams
(,3%) and are desirable if stream conditions are
appropriate because the engineering requirements are
simpler and the costs lower for this type than other
design options (Bates et al. 2003). Bottomless culverts,
which are relatively common across the landscape, are
not considered a specific design type but can be
constructed under a stream simulation or no-slope
design. Regardless of design type, all culverts permit-
ted for fish passage in Washington are supposed to
accommodate 100-year flood events.
Fish Passage Regulation in Washington Streams
The Washington Department of Fish and Wildlife
(WDFW) administers the ‘‘hydraulic code’’ (Revised
Code of Washington 77.55), which regulates work that
uses, obstructs, diverts, or changes the natural flow or
bed of state waters for the protection of fish life. The
WDFW implements the law via the hydraulic project
approval (HPA) permit process. Permits issued by the
WDFW include a list of provisions unique to the
permit type and physical setting that attempts to avoid,
minimize, or mitigate for activities that may affect fish
life in Washington’s lakes, streams, rivers, and marine
environments. Annually, the WDFW issues approxi-
mately 4,500 HPA permits, of which some 400 relate
to fish passage structures in streams (WDFW 2006).
The department’s HPA jurisdiction does not extend to
tribal lands, and HPA permits are not typically issued
on U.S. Forest Service lands.
In 2007, the results of a WFDW pilot study
suggested that there were inconsistencies in compli-
ance, implementation, and effectiveness of five HPA
permit types, including fish passage structures (Quinn
et al. 2007). Prior to the completion of that qualitative
study, the capacity of the HPA program to protect
aquatic resources had not been examined.
In Washington State, unimpeded fish passage is
mandatory where roads cross fish streams (Revised
Code of Washington 77.57), and HPA permit provi-
sions are intended to ensure that new or replacement
road crossings meet fish passage standards. Almost all
fish passage HPA permit requests receive a field review
from a WDFW biologist to help ensure that designs for
road crossings meet the requirements for fish passage.
In spite of their importance to fish and cost to
landowners, the effectiveness of fish passage culverts
have not been quantitatively evaluated to determine
whether they are appropriately permitted, designed, or
installed to maintain fish passage through time.
Although substantial research has been conducted on
the design of culverts (Bates et al. 2003; Coffman
2005; Hotchkiss and Frei 2007), assessments of fish
passage after culverts are installed is less common,
probably because of the cost associated with compli-
ance and effectiveness monitoring, as has been the case
in Washington State. We evaluated culverts permitted
for fish passage in 2007, 2003, and 1998 to determine
their ability to pass fish and to retain the physical
characteristics for which they were designed. We were
also interested in understanding how the permitting
process may have contributed to the installation of
culverts resulting in fish passage barriers.
Study Area
The Puget Sound landscape of Washington State has
been extensively shaped by the Wisconsin glaciations
and tectonic activity over the past 10,000 years (Booth
et al. 2003). Immature soils over expansive layers of
glacial outwash and glacial till support large tracts of
commercial and federal temperate forests in headwater
FISH PASSAGE EFFECTIVENESS 1111
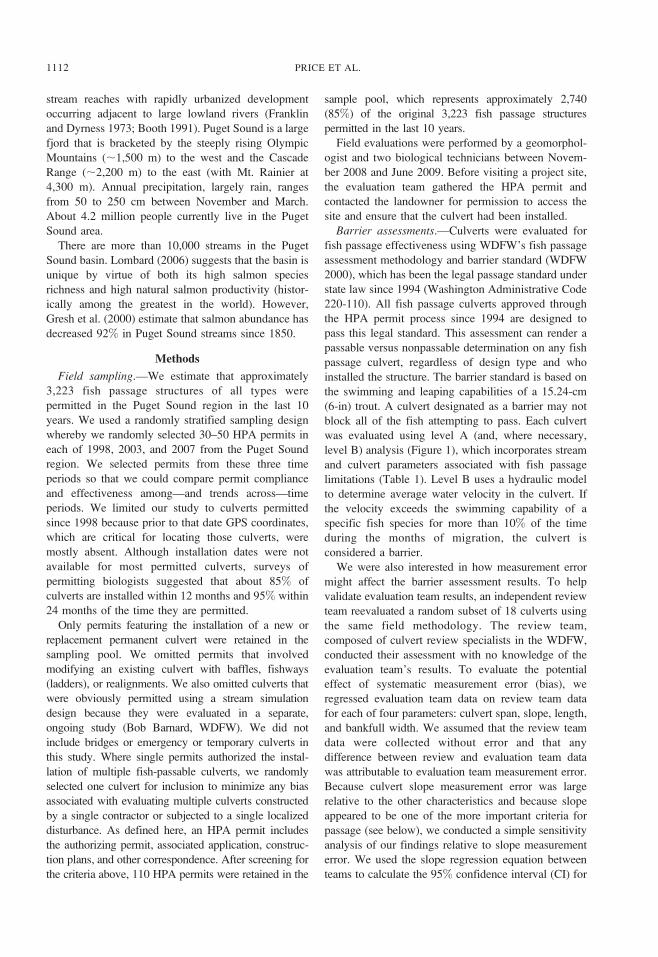
stream reaches with rapidly urbanized development
occurring adjacent to large lowland rivers (Franklin
and Dyrness 1973; Booth 1991). Puget Sound is a large
fjord that is bracketed by the steeply rising Olympic
Mountains (;1,500 m) to the west and the Cascade
Range (;2,200 m) to the east (with Mt. Rainier at
4,300 m). Annual precipitation, largely rain, ranges
from 50 to 250 cm between November and March.
About 4.2 million people currently live in the Puget
Sound area.
There are more than 10,000 streams in the Puget
Sound basin. Lombard (2006) suggests that the basin is
unique by virtue of both its high salmon species
richness and high natural salmon productivity (histor-
ically among the greatest in the world). However,
Gresh et al. (2000) estimate that salmon abundance has
decreased 92% in Puget Sound streams since 1850.
Methods
Field sampling.—We estimate that approximately
3,223 fish passage structures of all types were
permitted in the Puget Sound region in the last 10
years. We used a randomly stratified sampling design
whereby we randomly selected 30–50 HPA permits in
each of 1998, 2003, and 2007 from the Puget Sound
region. We selected permits from these three time
periods so that we could compare permit compliance
and effectiveness among—and trends across—time
periods. We limited our study to culverts permitted
since 1998 because prior to that date GPS coordinates,
which are critical for locating those culverts, were
mostly absent. Although installation dates were not
available for most permitted culverts, surveys of
permitting biologists suggested that about 85% of
culverts are installed within 12 months and 95% within
24 months of the time they are permitted.
Only permits featuring the installation of a new or
replacement permanent culvert were retained in the
sampling pool. We omitted permits that involved
modifying an existing culvert with baffles, fishways
(ladders), or realignments. We also omitted culverts that
were obviously permitted using a stream simulation
design because they were evaluated in a separate,
ongoing study (Bob Barnard, WDFW). We did not
include bridges or emergency or temporary culverts in
this study. Where single permits authorized the instal-
lation of multiple fish-passable culverts, we randomly
selected one culvert for inclusion to minimize any bias
associated with evaluating multiple culverts constructed
by a single contractor or subjected to a single localized
disturbance. As defined here, an HPA permit includes
the authorizing permit, associated application, construc-
tion plans, and other correspondence. After screening for
the criteria above, 110 HPA permits were retained in the
sample pool, which represents approximately 2,740
(85%) of the original 3,223 fish passage structures
permitted in the last 10 years.
Field evaluations were performed by a geomorphol-
ogist and two biological technicians between Novem-
ber 2008 and June 2009. Before visiting a project site,
the evaluation team gathered the HPA permit and
contacted the landowner for permission to access the
site and ensure that the culvert had been installed.
Barrier assessments.—Culverts were evaluated for
fish passage effectiveness using WDFW’s fish passage
assessment methodology and barrier standard (WDFW
2000), which has been the legal passage standard under
state law since 1994 (Washington Administrative Code
220-110). All fish passage culverts approved through
the HPA permit process since 1994 are designed to
pass this legal standard. This assessment can render a
passable versus nonpassable determination on any fish
passage culvert, regardless of design type and who
installed the structure. The barrier standard is based on
the swimming and leaping capabilities of a 15.24-cm
(6-in) trout. A culvert designated as a barrier may not
block all of the fish attempting to pass. Each culvert
was evaluated using level A (and, where necessary,
level B) analysis (Figure 1), which incorporates stream
and culvert parameters associated with fish passage
limitations (Table 1). Level B uses a hydraulic model
to determine average water velocity in the culvert. If
the velocity exceeds the swimming capability of a
specific fish species for more than 10% of the time
during the months of migration, the culvert is
considered a barrier.
We were also interested in how measurement error
might affect the barrier assessment results. To help
validate evaluation team results, an independent review
team reevaluated a random subset of 18 culverts using
the same field methodology. The review team,
composed of culvert review specialists in the WDFW,
conducted their assessment with no knowledge of the
evaluation team’s results. To evaluate the potential
effect of systematic measurement error (bias), we
regressed evaluation team data on review team data
for each of four parameters: culvert span, slope, length,
and bankfull width. We assumed that the review team
data were collected without error and that any
difference between review and evaluation team data
was attributable to evaluation team measurement error.
Because culvert slope measurement error was large
relative to the other characteristics and because slope
appeared to be one of the more important criteria for
passage (see below), we conducted a simple sensitivity
analysis of our findings relative to slope measurement
error. We used the slope regression equation between
teams to calculate the 95% confidence interval (CI) for
1112 PRICE ET AL.

each of the 77 slopes collected by the evaluation team
(Zar 2009). We then subtracted half the width of the
95% CI from each slope value measured in the field by
the evaluation team and reassessed all culverts. In
effect, subtracting the measurement error in this way
assumes that the evaluation team consistently overes-
timated culvert slope and thus the percentage of
culverts determined to be barriers.
Culvert design assessment.—Culverts permitted in
Washington State are supposed to follow one of three
FIGURE 1.—Level A analysis (WDFW 2000) for determining the fish barrier status of culverts in Washington State.
TABLE 1.—Culvert characteristics associated with possible
fish passage barrier types (modified from Coffman 2005).
Culvert characteristic Possible barrier
Culvert outlet drop Jump barrierCulvert slope Velocity barrierCulvert slope and length Exhaustion barrierNatural stream substrate Depth or velocity barrierCulvert span : stream width ratio Velocity and depth barrier
FISH PASSAGE EFFECTIVENESS 1113

design types: no-slope, hydraulic, or stream simulation.
Each design type includes specific criteria or physical
standards (Table 2) that, if met, are assumed to pass
fish (Bates et al. 2003; Hotchkiss and Frei 2007).
Design type and design criteria, which are often in the
form of permit provisions, are supposed to be made
explicit in HPA permit paperwork.
We were interested in understanding how fish
passage structures of different design types—alone
and in combination with design criteria—performed
through time. Design type and criteria information is
important for two reasons: (1) the failure of an
appropriate (to the site) design type installed with the
correct design criteria indicates that the design type
may not have been as robust to stream dynamics as
previously believed and (2) even with a suitable design
type, culverts installed with substandard design criteria
are more likely to form fish passage barriers in the
future.
Bottomless culverts were not judged according to a
specific design type because there was no way to
classify them to one of the three types based on permit
provisions. Instead, we classified bottomless culverts as
if they were an independent culvert design type.
Where the design type was not explicit in the permit
paperwork, we assigned a design type based on the
provisions (design criteria) contained in the permit
using the following process. If the permit described the
culvert as bottomless, it was assigned to the ‘‘bottom-
less’’ culvert type (as described above). If the permit
contained all three no-slope provisions or all three
stream simulation provisions, the culvert was classified
as a no-slope or stream simulation type, respectively.
Culverts with permit provisions that did not meet
TABLE 2.—Design criteria for no-slope and stream simulation culvert design types.
Criterion No-slope design Stream simulation design
Culvert slope 0 6 0.5% Equal to stream slopeSpan Streambed width inside the culvert ¼ bankfull width (1.2 3 channel width) þ 0.61 mCountersunk �20% at outlet and �40% at inlet 30–50%
TABLE 3.—Variables used in the classification and regression tree analysis.
Category Independent variables Data type Count (categorical) or range (continuous)
Human Biologist experience Continuous 71–5,567 d (mean ¼ 1,670)Project sponsor
Public Categorical 27Private Categorical 39Restoration Categorical 11
Environmental Latitude Continuous 46.700–49.0008NLongitude Continuous �123.700 to �121.8008WLand Use
Urban Categorical 17Rural Categorical 32Agriculture Categorical 2Forestry Categorical 10Highway Categorical 16
Channel width Continuous 0.8–11.3 m (mean ¼ 3.3)Provisional Provision score Continuous 0–100
Slope violation Bivariate Yes/NoSpan violation Bivariate Yes/NoLength violation Bivariate Yes/No
Culvert type Culvert shapeRound Categorical 32Squash Categorical 11Elliptical Categorical 3Box Categorical 5Arch Categorical 24
MaterialAluminum Categorical 2Concrete Categorical 27Plastic Categorical 3Corrugated metal Categorical 43
Time Permit year1998 Categorical 252003 Categorical 322007 Categorical 20
1114 PRICE ET AL.

bottomless, no-slope, or stream simulation designs
were assigned to an ‘‘unknown design’’ type.
After culverts were assigned a design type, we
evaluated the physical characteristics of the fish
passage structures in the field against the design
criteria for that type (Table 2). The characteristics of
culverts of unknown design type and those identified as
no-slope were compared with the no-slope criteria to
better understand what attributes may have contributed
to deviations from known design standards.
Assessing permit provisions.—We conducted analy-
ses of permit provisions to better understand how
guidance in the permit might be related to barrier
status. We assessed each permit for the presence of five
HPA provisions that are important in all fish passage
permits: minimum culvert span (width), maximum
culvert length, maximum culvert slope, countersinking
the culvert outlet to at least 20% of culvert height, and
sizing the streambed width inside the culvert relative to
the streambed width of the stream channel. A provision
was considered present only if it was explicitly written
in the HPA permit, associated permit application, or
referenced construction plans. Presence of a provision
received a value of 1, and absence of a provision
received a value of 0. Provision score was defined as
the sum of provisions present in a permit divided by
total number of provisions possible (up to five) in that
HPA permit. Provision rate was defined as the number
of permits that had a particular provision divided by
total number of permits for which that provision was
applicable. There is a provision score for each permit
and a provision rate for each of the five provisions. We
did not conduct assessments on specific provisions
when those provisions were likely to have been
included in missing paperwork.
Compliance analysis.—We evaluated whether com-
pliance with HPA provisions was associated with
culvert barrier status. Compliance assessments com-
pared HPA permit provisions with physical conditions
measured in the field. Compliance assessments were
only conducted for culvert span, length, and slope
differences, that is, characteristics that could not
change due to postconstruction stream dynamics. A
culvert slope with more than a 1% difference between
the measured slope and the permitted slope was defined
as noncompliant. Likewise, a measured culvert span
that was less than 10% of the permitted span and a
measured culvert length that was more than 10% of the
permitted length were defined as noncompliant.
Explaining barrier status.—We analyzed 13 param-
eters using a classification and regression tree (CART)
to help determine which culvert attributes not consid-
ered in the level A or B assessment might best explain
culvert failure rate (Table 3). The classification tree
process iteratively determines the most explanatory
path in describing barrier status from predictor
variables. The classification stops when there is no
additional predictive value among variables (Systat
2007).
Statistical analysis.—We examined continuous var-
iables for normality using a Shapiro–Wilk test before
conducting statistical comparisons. When variables
were not normally distributed (P , 0.05), we used
nonparametric tests. All determinations of statistical
significance were made at the 0.05 level. We compared
differences in the proportion of passable to impassible
culverts by time period using a chi-square goodness-of-
fit test. A Mann–Whitney rank-sum test was used to
test the hypothesis that fish passage barriers were more
common among the least experienced permitting
biologists. A Fisher’s exact test was used to determine
whether fish passage was different among project
sponsors. Mean provision scores were compared
among permit years using a Kruskal–Wallis test.
Results
Of the 110 HPA permits retained in the original
sample pool, we excluded 33 for a variety of reasons,
including that the culvert (re)placement was not
completed (n ¼ 16), the culvert was located on a
non-fish-bearing stream (n ¼ 6), we were unable to
locate the site (n ¼ 6), data collection was incomplete
(n¼ 3), and the landowner denied us access to the site
(n¼ 2; Table 4). There were six permits that contained
multiple culverts (mean ¼ 2.6 culverts/multiculvert
permit; SD ¼ 0.82) from which we randomly selected
one culvert from each permit for inclusion in this study.
We evaluated the remaining 77 culverts, including 25
from 1998, 32 from 2003, and 20 from 2007.
Barrier Analysis
Of the 77 culverts evaluated through level A and B
assessments, 23 (30%) were fish passage barriers
(Figure 2). Two culverts ‘‘washed out’’ between
installation and our study and were considered barriers
because they represented failed culverts. Two culverts
TABLE 4.—Sample pool of hydraulic project approval
(HPA) permits by year and reasons for excluding permits
from fish passage effectiveness study.
Permit review 1998 2003 2007 Total
Initial HPA sample pool 32 45 33 110Landowner denied access 0 2 0 2Existing culvert not replaced 2 3 11 16Nonfish stream 0 5 1 6Data collection incomplete 2 1 0 3Site not found 3 2 1 6Permits reviewed for analyses 25 32 20 77
FISH PASSAGE EFFECTIVENESS 1115
were classified as barriers solely because their outfall
drop exceeded fish jumping capability standards
(.0.24 m), and all eight structures with an outfall
drop of 0.10 m or more were ultimately classified as
barriers due to lack of stream substrate in the culvert
and excessive culvert slope.
Culverts were classified as barriers primarily for two
interrelated reasons: they were not countersunk at least
20% into the streambed, and they were placed at a
greater than 1% slope (Figure 3). The presence of
stream substrate to at least 20% of the culvert rise was a
good indicator of passability. All 50 culverts counter-
sunk at least 20% (or that were bottomless) were fish
passable, while 23 of 27 (85%) of the culverts
countersunk less than 20% were barriers.
There was no statistical difference between the
proportions of passable to impassible culverts by year
for the full data set (v2 ¼ 1.81, df ¼ 2, n ¼ 77, P ¼0.404), although the oldest culverts tended to have
slightly higher barrier proportions than newer culverts
(Table 5).
The evaluation and review teams independently
identified the same 7 culverts as barriers out of the 18
culverts reviewed. Data collected by the evaluation
team and the review team were most similar for culvert
length and span, whereas bankfull widths and culvert
slopes were more divergent (Table 6). Barrier status did
not change for any culvert after adjusting for 95% CI
slope measurement error (Figure 4).
Noncompliance with slope provisions was the only
significant variable identified in the CART analysis (P
¼ 0.003) that was related to barrier status. The CART
analysis suggested that culverts installed with slopes
that exceeded the permitted slopes by 1% or more had
a 69% chance of becoming fish passage barriers even
when percent slope alone did not qualify them as
impassable in the level A and B barrier analysis. Of the
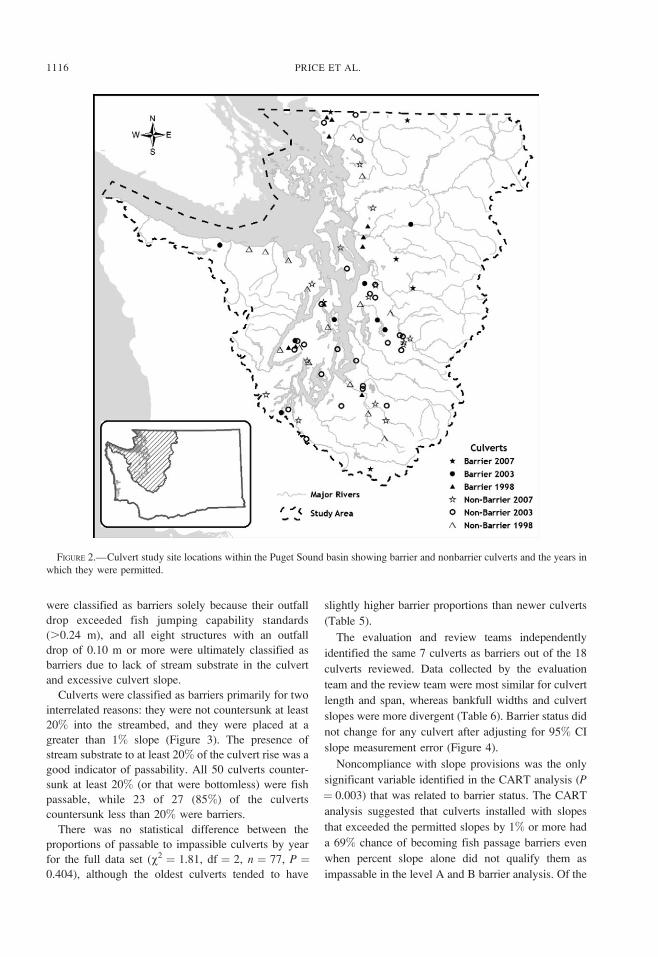
FIGURE 2.—Culvert study site locations within the Puget Sound basin showing barrier and nonbarrier culverts and the years in
which they were permitted.
1116 PRICE ET AL.

14 no-slope culverts that were barriers, 9 (64%) were
noncompliant with slope provisions.
The CART results were consistent with some
individual comparison results. Permitting biologist
experience was not associated with barrier status
(Mann–Whitney U ¼ 564.0, P ¼ 0.529). Median
biologist experience and its interquartile range were
similar between projects classified as barriers (median
FIGURE 3.—Flow chart showing the results for 77 culverts assessed for passability in the Puget Sound basin in 2008–2009.
FISH PASSAGE EFFECTIVENESS 1117

¼ 855 d, range ¼ 1,934 d, n ¼ 23) and those not
classified as barriers (median¼ 921 d, range¼ 2,714 d,
n ¼ 54; Figure 5). Likewise, there was no statistical
difference in barrier status between culverts installed
by restoration sponsors and nonrestoration sponsors
(Fisher’s exact test; P ¼ 0.490). Excluding the two
culverts that washed out did not change this result (P¼0.266), although the small sample size for restoration
sponsors may limit the ability to distinguish among
project sponsors (Figure 6).
Culvert Design Assessment
We determined that 31 culverts were permitted with
provisions for the no-slope design, 2 were permitted for
the stream simulation design, 24 were permitted as
bottomless structures, and 20 were permitted with no
apparent design (unknown design). There was no
evidence (i.e., reference to fish species, swimming or
jumping ability, or water velocity measurements) to
suggest that the hydraulic design was used in any of the
HPA permits. Of the 31 culverts permitted with
provisions for the no-slope design, 26 (84%) did not
meet the no-slope design criteria as measured in the
field and 14 (45%) resulted in fish passage barriers
(Table 7). All bottomless structures (n ¼ 24) were
classified as fish passable. Two culverts permitted
under the stream simulation design (and inadvertently
included in the study) were passable. Although U.S.
Forest Service culverts are not normally permitted
under the HPA permit system, one such culvert was
nevertheless included in the study and it was not
passable.
Of the 20 culverts in the unknown design category, 2
met the stream simulation design criteria as determined
by field measurement and were passable. The other 18
culverts in the unknown design category were
inconsistent with the no-slope and stream simulation
design criteria, and 9 (50%) were fish passage barriers.
Culverts identified as no-slope but failing to meet the
design criteria for that type (n ¼ 26; Table 7) plus
unknown culvert designs (n¼18; Table 7) tended to be
narrow relative to channel width. As measured in the
field, the mean span-to-bankfull width ratio for stream
simulation design culverts was 1.56:1, that for
bottomless design culverts was 1.17:1, and that for
no-slope and unknown design culverts was 0.72:1.
Inadequate countersinking (i.e., ,20%) and excessive
slope (.1% slope difference) were also common in
unknown designs. Culverts never failed to meet design
criteria solely because they were inadequately coun-
tersunk, and only two failed solely because of
excessive slope (Figure 7).
Compliance Assessment
Culvert installation was in compliance with the
culvert slope provision in 32 of 49 (65%) cases (Figure
8). Culverts with noncompliant slopes (i.e., .1% slope
difference) were more likely to be barriers (11 of 17)
than culverts in compliance (5 of 32; Fisher’s exact
test; P ¼ 0.001). Slope was not measured at 17 of 24
bottomless culverts, and some HPA permits (n ¼ 12)
lacked a slope provision for comparison.
Compliance with culvert span provisions was 85%(Figure 9) and not associated with barrier status
(Fisher’s exact test; P ¼ 0.689). Of the nine culverts
that were installed at least 10% smaller than permitted
(noncompliance), three were barriers and six were
passable. Of the culverts that were at least 10% larger
than were permitted, three were barriers and 12 were
passable. Data for 18 sites were not included in the
span compliance analysis because span provisions were
not included in the HPA permits (n ¼ 4), referenced
plans were not available for review (n¼ 8), or the HPA
permit referenced ‘‘streambed width’’ without explicitly
including a value for span (n ¼ 6).
Compliance with culvert length provisions was 85%(Figure 10) and not associated with barrier status
(Fisher’s exact test; P¼ 0.343). Of seven culverts that
TABLE 5.—Number and percent of fish passage barriers by
year.
Permit year (n)
Bottomless included Bottomless excluded
Barriers (%) Nonbarriers Barriers (%) Nonbarriers
2007 (20) 5 (25) 15 5 (38) 82003 (32) 8 (25) 24 8 (40) 121998 (25) 10 (40) 15 10 (50) 10Total (77) 23 (30) 54 23 (43) 30
TABLE 6.—Comparisons between the mean (SD) measurements by the evaluation (ET) and review (RT) assessment teams and
regression equations for bankfull width and culvert slope, length, and span.
Variable (n) Evaluation team Review team Regression equation (r2)
Bankfull width (21) 3.7 m (2.7) 4.3 m (3.3) ET ¼ 0.575 þ 0.729 � RT (0.83)Culvert slope (18) 1.8 % (2.0) 1.7 % (1.8) ET ¼ 0.329 þ 0.898 � RT (0.66)Culvert length (22) 18.0 m (9.3) 18.6 m (9.3) ET ¼ �0.271 þ 0.981 � RT (0.97)Culvert span (22) 2.9 m (2.5) 2.8 m (2.3) ET ¼ �0.124 þ 1.049 � RT (0.99)
1118 PRICE ET AL.

were at least 10% longer than permitted (noncompli-
ance), three were barriers. One of five culverts that was
10% shorter than permitted was a barrier. Culvert
length provisions were not included in 10 HPA
permits, and some paperwork was not available for
14 HPA permits.
Provision Assessment
The proportion of important provisions contained in
an HPA permit (i.e., provision score) among HPA
permits ranged from 0 to 100 (median¼90). There was
no significant difference in provision scores between
barrier and fish-passable culverts (Mann–Whitney U¼573.0, P ¼ 0.560), although barrier culverts tended to
have slightly lower provision scores (Figure 11).
Provision scores were significantly different among
permit years (Kruskal–Wallis test; H¼ 6.967, df¼ 2, P, 0.031). Median provision scores were 80, 100, and
80 for permits written in 1998, 2003, and 2007,
respectively (Figure 12).
The proportion of HPA permits that included all
three of the most important provision types (counter-
sunk depth, culvert slope, and culvert span) was 71%
(52 of 73), and there was no significant difference in
the proportion of barriers with and without these three
provisions (Fisher’s exact test; P ¼ 0.777). The
proportion of HPA permits containing an important
provision (i.e., provision rate) varied among the five
permit provisions and through time (Table 8). The
provision requiring ‘‘substrate width inside the culvert
to equal substrate width outside the culvert’’ was
present in 74% of HPA permits overall but decreased
through time from 84% in 1998 to 55% in 2007.
Culvert length was the only provision included in all
permits during a single time period (2003).
FIGURE 4.—Regression line between the slope measurements of the evaluation and review teams for 18 culverts. The dashed
lines depict the 95% confidence limits. The lower confidence limits were applied to the slopes measured by the evaluation team
to correct for potential measurement error.
FISH PASSAGE EFFECTIVENESS 1119

Discussion
In this study, 30% of HPA permitted culverts on
fish-bearing streams in the Puget Sound area of
Washington State were determined to be barriers to
fish. These results were consistent across three time
periods and across different land-use types. Moreover,
these results were robust to sampling error. The
evaluation and review teams independently identified
the same 7 culverts as barriers out of the 18 culverts
reviewed. Even the simple sensitivity analysis, which
reduced the evaluation team’s culvert slope measure-
ments by half of the 95% confidence interval, had no
effect on the proportion of passable to impassible
culverts. Although certain culverts were excluded from
the study (i.e., stream simulation designs, emergency
and temporary culverts, and retro fixes), we estimate
that our study sample represents approximately 85% of
fish passage culverts permitted in the Puget Sound
region of Washington State during the last 10 years.
Barrier status varied by culvert design type. Of the
31 culverts identified as no-slope from HPA permit
paperwork, 14 (45%) were fish passage barriers.
Similarly, of the 18 culverts identified as unknown
TABLE 7.—Permitted culvert design types and their current
status in meeting design criteria and the level A and B barrier
standards (see text). Twenty permits did not include specific
provisions to allow classification as either no-slope or stream
simulation and are referred to as of ‘‘unknown design’’.
DesignNumber
permitted
Number (%)currently failing tomeet design criteria
Number(%) barriers
No-slope 31 26 (84) 14 (45)Stream simulation 2 0 0Bottomless 24 0 0Unknown 20 18 (90)a 9 (50)
a Two culverts permitted with unknown designs ultimately met
physical criteria for stream simulation.
FIGURE 6.—Number of culverts by barrier/nonbarrier status
and type of permit applicant.
FIGURE 5.—Relationship between biologist experience (d) in writing HPA permits and barrier/nonbarrier status of culverts.
1120 PRICE ET AL.
designs, 9 (50%) were fish passage barriers. Bottom-
less culverts were considered independently of other
design types because it was frequently impossible to
determine the intended design (no-slope versus stream
simulation) from HPA permits alone, and results
suggested that fish passage effectiveness differs
between bottomless culverts and other designs. All
24 bottomless structures assessed in this study were
passable. Although we attempted to exclude stream
simulation culverts from this study, the four that were
inadvertently included were fish passable structures.
Appropriate culvert design must consider human
safety, cost, and fish passage (Bates et al. 2003). The
fact that all bottomless culverts were passable may be a
by-product of engineering safety margins designed into
these structures since these types of culverts are more
susceptible to road failure than other design types
(Kerenyi and Pagan-Ortiz 2007). In this study,
bottomless culverts were installed with spans that
commonly exceeded bankfull steam width whereas no-
slope culverts tended to be undersized. Although no
bottomless culverts were classified as barriers in this
study, we observed scour of the culvert footings in
several structures, which could ultimately undermine
the integrity of the road prism associated with these
culverts.
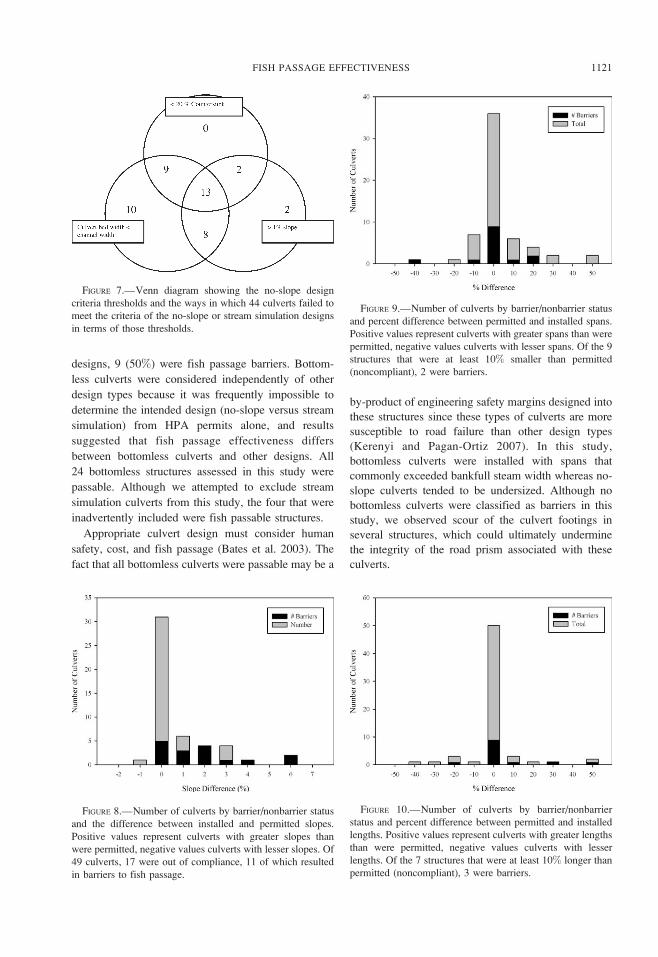
FIGURE 8.—Number of culverts by barrier/nonbarrier status
and the difference between installed and permitted slopes.
Positive values represent culverts with greater slopes than
were permitted, negative values culverts with lesser slopes. Of
49 culverts, 17 were out of compliance, 11 of which resulted
in barriers to fish passage.
FIGURE 9.—Number of culverts by barrier/nonbarrier status
and percent difference between permitted and installed spans.
Positive values represent culverts with greater spans than were
permitted, negative values culverts with lesser spans. Of the 9
structures that were at least 10% smaller than permitted
(noncompliant), 2 were barriers.
FIGURE 7.—Venn diagram showing the no-slope design
criteria thresholds and the ways in which 44 culverts failed to
meet the criteria of the no-slope or stream simulation designs
in terms of those thresholds.
FIGURE 10.—Number of culverts by barrier/nonbarrier
status and percent difference between permitted and installed
lengths. Positive values represent culverts with greater lengths
than were permitted, negative values culverts with lesser
lengths. Of the 7 structures that were at least 10% longer than
permitted (noncompliant), 3 were barriers.
FISH PASSAGE EFFECTIVENESS 1121

Providing fish passage at road–stream crossings is an
important salmon recovery tool in the Pacific North-
west of the United States and Canada. Washington’s
State of the Salmon in Watersheds Report accounts for
fish passage barriers corrected and provides an estimate
of stream miles opened as a result of those efforts.
Between 1999 and 2008, more than 3,500 fish passage
barriers have been replaced with fish-passable struc-
tures (Governor’s Salmon Recovery Office 2008).
Prior to the current study, quantitative efforts to assess
the effectiveness of fish passage installations have not
been conducted in Washington State. Since 1999, at
least US$139 million has been spent on salmon
recovery efforts in Washington in which fish passage
barrier correction was the targeted restoration activity
(D. Caudill, Washington Recreation and Conservation
Office, personal communication). Fish passage projects
that fail to correct fish passage barriers are not only a
waste of money, in cases where there is no monitoring
they may result in blockages that remain for the life of
the structure, which in some cases is up to 50 years.
Comparable studies evaluating fish passage at road–
stream crossings where culverts were individually
permitted for fish passage are uncommon. Quinn et
al. (2007) observed that the implementation rate of
culvert size and installation requirements was approx-
imately 50% for 14 recently constructed culverts in
western Washington. Gibson et al. (2005) found that
53% of the culverts examined on a newly constructed
road in Labrador were barriers and failed to follow
required Department of Fisheries and Oceans guide-
lines. Broad-scale compliance and effectiveness studies
of aquatic habitat restoration are rare despite the need
for cost-effective feedback on expensive and time-
consuming actions (Roni et al. 2005; Reeve et al.
2006).
Determining why a high proportion of relatively new
structures failed the fish passage barrier threshold is
complex. The 35% rate of noncompliance with culvert
slope provisions in HPA permits was a statistically
FIGURE 11.—Provision scores (proportion of important provisions contained in an HPA permit) by barrier/nonbarrier status.
FIGURE 12.—Provision scores for 77 HPA permits by year.
1122 PRICE ET AL.
significant attribute in predicting fish passage barrier
status. Also, 12 culverts were judged impassable
because they did not retain adequate sediment in
addition to excessive slope. It is unlikely that cost-
cutting measures by project sponsors are responsible
for slope noncompliance, as has been observed in
Canada (Gibson et al. 2005). Reducing culvert size
relative to permit provisions is a more effective means
of reducing cost, but compliance for culvert span and
length were each 85% and neither was significantly
associated with fish passage barrier status. We believe
that improper installation in regards to slope is a major
factor in the construction of fish passage barriers,
especially for the no-slope culvert design. In contrast,
low span : bankfull width ratios appeared to contribute
to high failure rates despite the fact that those culverts
were often compliant with the permit provision for
span. In other words, culvert span was inadequately
designed by applicants and subsequently approved by
the WDFW.
The HPA permits issued by the WDFW contain
provisions tailored to specific site conditions. Howev-
er, we found no association between provision scores
and barrier status. In other words, the quality of the
HPA permit as measured by provision scores was not a
predictor of barrier status. Likewise, permitting biolo-
gist experience (days employed in the HPA permit
program) was not a useful predictor of barrier status,
although experienced biologists tended to have slightly
fewer fish passage barriers associated with their HPA
permits than inexperienced biologists.
Culvert span, countersunk depth, and slope criteria
are the most important dimensions of culvert specifi-
cation (Bates et al. 2003). The proportion of HPA
permits that included all three of these necessary
provision types was low (71%), although the inclusion
of all three provisions was not related to barrier status.
Culvert span was provisioned in 94% of permits,
comparable to the observations of Quinn et al. (2007),
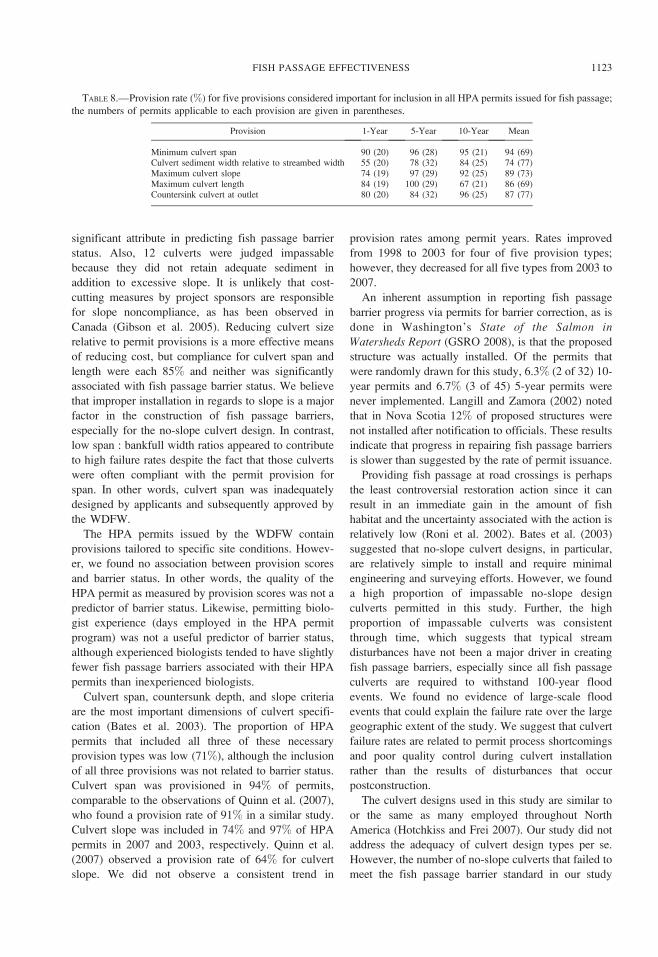
who found a provision rate of 91% in a similar study.
Culvert slope was included in 74% and 97% of HPA
permits in 2007 and 2003, respectively. Quinn et al.
(2007) observed a provision rate of 64% for culvert
slope. We did not observe a consistent trend in
provision rates among permit years. Rates improved
from 1998 to 2003 for four of five provision types;
however, they decreased for all five types from 2003 to
2007.
An inherent assumption in reporting fish passage
barrier progress via permits for barrier correction, as is
done in Washington’s State of the Salmon inWatersheds Report (GSRO 2008), is that the proposed
structure was actually installed. Of the permits that
were randomly drawn for this study, 6.3% (2 of 32) 10-
year permits and 6.7% (3 of 45) 5-year permits were
never implemented. Langill and Zamora (2002) noted
that in Nova Scotia 12% of proposed structures were
not installed after notification to officials. These results
indicate that progress in repairing fish passage barriers
is slower than suggested by the rate of permit issuance.
Providing fish passage at road crossings is perhaps
the least controversial restoration action since it can
result in an immediate gain in the amount of fish
habitat and the uncertainty associated with the action is
relatively low (Roni et al. 2002). Bates et al. (2003)
suggested that no-slope culvert designs, in particular,
are relatively simple to install and require minimal
engineering and surveying efforts. However, we found
a high proportion of impassable no-slope design
culverts permitted in this study. Further, the high
proportion of impassable culverts was consistent
through time, which suggests that typical stream
disturbances have not been a major driver in creating
fish passage barriers, especially since all fish passage
culverts are required to withstand 100-year flood
events. We found no evidence of large-scale flood
events that could explain the failure rate over the large
geographic extent of the study. We suggest that culvert
failure rates are related to permit process shortcomings
and poor quality control during culvert installation
rather than the results of disturbances that occur
postconstruction.
The culvert designs used in this study are similar to
or the same as many employed throughout North
America (Hotchkiss and Frei 2007). Our study did not
address the adequacy of culvert design types per se.
However, the number of no-slope culverts that failed to
meet the fish passage barrier standard in our study
TABLE 8.—Provision rate (%) for five provisions considered important for inclusion in all HPA permits issued for fish passage;
the numbers of permits applicable to each provision are given in parentheses.
Provision 1-Year 5-Year 10-Year Mean
Minimum culvert span 90 (20) 96 (28) 95 (21) 94 (69)Culvert sediment width relative to streambed width 55 (20) 78 (32) 84 (25) 74 (77)Maximum culvert slope 74 (19) 97 (29) 92 (25) 89 (73)Maximum culvert length 84 (19) 100 (29) 67 (21) 86 (69)Countersink culvert at outlet 80 (20) 84 (32) 96 (25) 87 (77)
FISH PASSAGE EFFECTIVENESS 1123

suggests that greater scrutiny of the no-slope design
type and applicable stream conditions is warranted.
Likewise, the number of ‘‘unknown’’ or ‘‘hybrid’’culvert design types that resulted in fish passage
barriers suggests that deviation from established design
types should be avoided or that greater engineering
review is needed for these structures with respect to on-
site stream conditions.
The implications of this study are somewhat unclear.
Although we know which design types are most likely
to become fish passage barriers and the proximal cause
of those failures (i.e., particular substandard design
criteria), we do not know what process led to those
failures. Nonetheless, based on our experience we can
offer some reasonable measures to improve the
performance of fish passage programs. Currently,
WDFW biologists receive little initial or ongoing
training in fish passage assessment or stream geomor-
phology associated with fish passage restoration.
Training, like monitoring, is often sacrificed in times
of lean budgets. Given the costs of fish passage
structures and high failure rates observed in this and
other studies (Langill and Zamora 2002; Gibson et al.
2005; Quinn et al. 2007), we suggest that training
become a regular part of all programs aimed at
providing fish passage. At a minimum, this training
should include applied aspects of stream geomorphol-
ogy and hydrology and culvert design. We also
conclude that greater field effort by permitting
biologists is necessary. This field time should be spent
assessing preconstruction stream conditions and com-
pliance conditions immediately after construction but
before construction equipment is moved from the site
(i.e., ‘‘as-built’’ compliance). As-built compliance
inspections would limit the cost associated with
moving heavy construction equipment. Finally, there
is a critical need for compliance and effectiveness
monitoring.
Despite the call for ongoing compliance and
effectiveness monitoring of fish passage restoration,
most of our knowledge of restoration failures comes
from individual case studies (Roni et al. 2002; Pess et
al. 2003, 2005; this study). Given the substantial
investment of public and private dollars to recover
salmon and the importance of providing fish passage in
meeting conservation and recovery goals, policy
makers should provide better mechanisms to ensure
compliance from project sponsors and improve the
process by which they evaluate the proposed plans in
the context of project site conditions.
Acknowledgments
Field work was conducted by Renee Healy, Alan
Wald, Sandy Schexnayder, Amber Palmeri-Miles,
Damon Romero, Nick Hoening, Melissa Erkel, Ron
Whitney, Dan Phinney, and Joel Ingram. David Collins
and Mike Barber provided logistical support of field
crews. Ken Pierce assisted with statistical analysis.
Thoughtful reviews were provided by Marc Daily, Pat
Chapman, Brian Benson, Jeff Davis, and three
anonymous reviewers.
References
Bates, K., B. Barnard, B. Heiner, J. P. Klavis, and P. D.
Powers. 2003. Design of road culverts for fish passage.
Washington Department of Fish and Wildlife, Olympia.
Beechie, T. J., M. Ruckelshaus, E. Buhle, A. Fullerton, and L.
Holsinger. 2006. Hydrologic regime and the conservation
of salmon life history diversity. Biological Conservation
130(4):560–572.
Booth, D. B. 1991. Urbanization and the natural drainage
system: impacts, solution, and prognosis. Northwest
Environmental Journal 7:93–118.
Booth, D. B., R. A. Haugerud, and K. Goetz Troost. 2003.
The geology of Puget lowland rivers. Pages 14–45 inD. R. Montgomery, S. Bolton, D. B. Booth, and L. Wall,
editors. Restoration of Puget Sound rivers. University of
Washington Press, Seattle.
CDFG (California Department of Fish and Game). 2002.
Culvert criteria for fish passage. Available: http://www.
dfg.ca.gov. (June 2010).
Clarkin, K., A. Connor, M. J. Furniss, B. Gubernick, M. Love,
K. Moynan, and S. Wilson Musser. 2005. National
inventory and assessment procedure for identifying
barriers to aquatic organism passage at road-stream
crossings. U.S. Forest Service, San Dimas, California.
Coffman, J. S. 2005. Evaluation of a predictive model for
upstream fish passage through culverts. Master’s thesis.
James Madison University, Harrisonburg, Virginia.
Dunham, J. B., G. L. Vinyard, and B. E. Rieman. 1997.
Habitat fragmentation and extinction risk of Lahontan
cutthroat trout. North American Journal of Fisheries
Management 17:1126–1133.
Franklin, J. F., and C. T. Dyrness. 1973. Natural vegetation of
Oregon and Washington. U.S. Forest Service General
Technical Report PNW-80.
Furniss, M. J., T. S. Ledwith, M. A. Love, B. A. McFadin, and
S. A. Flanagan. 1998. Response of road-stream crossings
to large flood events in Washington, Oregon, and
northern California. U.S. Forest Service, 9877 1806-
SDTDC, San Dimas, California.
GAO (General Accounting Office). 2001. Restoring fish
passage through culverts on Forest Service and BLM
lands in Oregon and Washington could take decades.
GAO, Report GAO-02-136, Washington, D.C.
Gibson, R. J., R. L. Haedrich, and C. M. Wernerheim. 2005.
Loss of fish habitat as a consequence of inappropriately
constructed stream crossings. Fisheries 30(1):10–17.
Governor’s Salmon Recovery Office. 2008. State of the
salmon in watersheds report. Governor’s Salmon Recov-
ery Office, Olympia, Washington.
Gresh, T., J. Lichatowich, and P. Schoomaker. 2000. An
estimation of historic and current levels of salmon
production in the Northeast Pacific ecosystem: evidence
1124 PRICE ET AL.

of a nutrient deficit in the freshwater systems of the
Pacific Northwest. Fisheries 25(1):15–21.
Gubernick, B., K. Clarkin, and M. J. Furniss. 2003. Design
and construction of aquatic organism passage at road-
stream crossings: site assessment and geomorphic
considerations in stream simulation culvert design. Pages
30–41 in C. L. Irwin, P. Garrett, and K. P. McDermott,
editors. Proceedings of the 2003 International Confer-
ence on Ecology and Transportation. Center for Trans-
portation and the Environment, North Carolina State
University, Raleigh.
Hotchkiss, R. H., and C. M. Frei. 2007. Design for fish
passage at roadway-stream crossings: synthesis report.
Federal Highway Administration, Publication FHWA-
HIF-0-033, McLean, Virginia.
Jackson, S. D. 2003. Design and construction of aquatic
organism passage at road-stream crossings: ecological
considerations in the design of river and stream
crossings. Pages 20–29 in Proceedings of the Interna-
tional Conference of Ecology and Transportation. Center
for Transportation and the Environment, North Carolina
State University, Raleigh.
Kerenyi, K., and J. Pagan-Ortiz. 2007. Testing bottomless
culverts. Public Roads 70. Available: http://www.tfhrc.
gov/. (February 2010).
Kruse, C. G., W. A. Hubert, and F. J. Rahel. 2001. An
assessment of headwater isolation as a conservation
strategy for cutthroat trout in the Absaroka Mountains of
Wyoming. Northwest Science 75:1–11.
Lamberti, G. A., S. V. Gregory, L. R. Ashkenas, R. C.
Wildman, and K. M. S. Moore. 1991. Stream ecosystem
recovery following a catastrophic debris flow. Canadian
Journal of Fisheries and Aquatic Sciences 48:196–208.
Langill, D. A., and P. J. Zamora. 2002. An audit of small
culvert installations in Nova Scotia: habitat loss and
habitat fragmentation. Canadian Technical Report of
Fisheries and Aquatic Sciences 2422.
Lombard, J. 2006. Saving Puget Sound: a conservation
strategy for the 21st century. American Fisheries Society,
Bethesda, Maryland.
Neville, H., J. B. Dunham, A. Rosenberger, J. Umek, and B.
Nelson. 2009. Influences of wildfire, habitat size, and
connectivity on trout in headwater streams revealed by
patterns of genetic diversity. Transactions of the
American Fisheries Society 138:1314–1327.
Pess, G. R., T. J. Beechie, J. E. Williams, D. R. Whitall, J. I.
Lange, and J. R. Klochak. 2003. Watershed assessment
techniques and the success of aquatic restoration
activities. Pages 185–201 in R. C. Wissmar and P. A.
Bisson, editors. Strategies for restoring river ecosystems:
sources of variability and uncertainty in natural and
managed systems. American Fisheries Society, Bethesda,
Maryland.
Pess, G., S. Morley, and P. Roni. 2005. Evaluating fish
response to culvert replacement and other methods for
reconnecting isolated aquatic habitats. Pages 267–276 inP. Roni, editor. Monitoring stream and watershed
restoration. American Fisheries Society, Bethesda, Mary-
land.
Quinn, T., S. Kalinowski, R. Bicknell, C. Olds, M. Schirato,
D. Price, C. Byrnes, D. Kloempken, and R. Barnard.
2007. A pilot study of hydraulic permit compliance,
implementation, and effectiveness in Region 6. Wash-
ington Department of Fish and Wildlife, Olympia.
Reeve, T., J. Lichatowich, W. Towey, and A. Duncan. 2006.
Building science and accountability into community-
based restoration: can a new funding approach facilitate
effective and accountable restoration? Fisheries 31:17–
24.
Reeves, G. H., L. E. Benda, K. M. Burnett, P. A. Bisson, and
J. R. Sedell. 1995. A disturbance-based ecosystem
approach to maintaining and restoring freshwater habitats
of evolutionarily significant units of anadromous salmo-
nids in the Pacific Northwest. Pages 334–349 in J. L.
Nielsen, editor. Evolution and the aquatic ecosystem:
defining unique units in population conservation. Amer-
ican Fisheries Society, Symposium 17, Bethesda,
Maryland.
Reiman, B. E., and J. B. Dunham. 2000. Metapopulations and
salmonids: a synthesis of life history patterns and
empirical observations. Ecology of Freshwater Fish
9:51–64.
Robison, E. G., A. Mirati, and M. Allen. 1999. Oregon road/
stream crossing restoration guide: spring 1999. Oregon
Department of Fish and Wildlife, Salem.
Roni, P., T. J. Beechie, R. E. Bilby, F. E. Leonetti, M. M.
Pollock, and G. R. Pess. 2002. A review of stream
restoration techniques and a hierarchical strategy for
prioritizing restoration in Pacific Northwest watersheds.
North American Journal of Fisheries Management 22:1–
20.
Roni, P., M. C. Liermann, C. Jordan, and E. A. Steel. 2005.
Steps for designing a monitoring and evaluation program
for aquatic restoration. Pages 13–34 in P. Roni, editor.
Monitoring stream and watershed restoration. American
Fisheries Society, Bethesda, Maryland.
Sheer, M. B., and E. A. Steel. 2006. Lost watersheds: barriers,
aquatic habitat connectivity, and salmon persistence in
the Willamette and lower Columbia River basins.
Transactions of the American Fisheries Society
135:1654–1669.
Systat. 2007. Systat 12, statistics 1. Systat Software, San Jose,
California.
WDFW (Washington Department of Fish and Wildlife). 2000.
Fish passage barrier and surface water diversion
screening assessment and prioritization manual. WDFW,
Olympia.
WDFW (Washington Department of Fish and Wildlife). 2006.
Status of the hydraulic project approval administration:
report to the Office of Financial Management. WDFW,
Olympia.
WDFW (Washington Department of Fish and Wildlife). 2009.
WSDOT fish passage inventory: progress performance
report, July 2009. WDFW, Olympia.
Winston, M. R., C. M. Taylor, and J. Pigg. 1991. Upstream
extirpation of four minnow species due to damming of a
prairie stream. Transactions of the American Fisheries
Society 120:98–105.
Wofford, J. E. B., R. E. Gresswell, and M. A. Banks. 2005.
Influence of barriers to movement on within-watershed
genetic variation of coastal cutthroat trout. Ecological
Applications 15:628–637.
Zar, J. H. 2009. Biostatistical analysis, 5th edition. Pearson
Prentice-Hall, Upper Saddle River, New Jersey.
FISH PASSAGE EFFECTIVENESS 1125