Fish and fish-eating birds at the Salton Sea: a century of ...
31
469 Lake and Reservoir Management 23:469-499, 2007 © Copyright by the North American Lake Management Society 2007 Fish and fish-eating birds at the Salton Sea: a century of boom and bust Allen H. Hurlbert 1,a , Thomas W. Anderson 2,3 , Kenneth K. Sturm 2,b and Stuart H. Hurlbert 3 1 Department of Biology, University of New Mexico, Albuquerque, NM 87131, USA 2 Salton Sea Authority, Sonny Bono Salton Sea National Wildlife National Wildlife Refuge, Calipatria, CA 92233, USA 3 Department of Biology and Center for Inland Waters, San Diego State University, San Diego, CA 92182, USA Abstract Hurlbert, A.H., T.W. Anderson, K.K. Sturm and S.H. Hurlbert. 2007. Fish and fish-eating birds at the Salton Sea: a century of boom and bust. Lake Reserv. Manage. 23:469-499. We reconstruct historical trends in both fish and fish-eating bird populations at the Salton Sea, California since the Sea’s formation in 1905. The fish community has undergone dramatic shifts in composition, from freshwater spe- cies present in the initial wash-in to stocked marine species to dominance by an unintentionally introduced cichlid. Historical catch records, creel censuses, and gill-netting studies suggest that total fish biomass in the lake increased dramatically throughout the 1970s, crashed in the late 1980s, recovered in the mid-1990s, and crashed again in the early 2000s. We speculate that crashes in fish populations are primarily due to three physiological stressors—ris- ing salinity, cold winter temperatures, and high sulfide levels and anoxia associated with mixing events. The trends in fish biomass are mirrored in population trends of both breeding and wintering fish-eating birds, as indexed by a number of independent bird surveys. In contrast, most non-piscivorous birds at the Salton Sea show no indication of these temporal dynamics. We discuss possible explanations for the observed trends in fish-eating bird populations, including decline in organochlorine insecticide use and fluctuations in prey abundance at the Salton Sea. Finally, we speculate on the future prospects of both fish and fish-eating birds at the Salton Sea given the environmental chal- lenges the Sea currently faces. Key words: Aechmophorus occidentalis, Ardea herodias, Aythya affinis, Casmerodius albus, Christmas Bird Counts, Circus cyaneus, DDT, Egretta alba, Egretta thula, Fulica americana, hydrogen sulfide, Hydroprogne caspia, long- term trends, Nycticorax nycticorax, Oreochromis mossambicus, organochlorine insecticides, Oxyura jamaicensis, Pandion haliaetus, Pelecanus erythrorhyncos, Pelecanus occidentalis, Phalacrocorax auritus, Podiceps nigricollis, Recurvirostra americana, saline lakes, salinity a Current address: National Center for Ecological Analysis and Synthesis, 735 State St., Suite 300, Santa Barbara, CA 93101, USA, [email protected] b Current address: Canaan Valley National Wildlife Refuge, U.S. Fish and Wildlife Service, HC 70 Box 200, Davis, WV 26260, USA Introduction In the spring of 1905 the Colorado River broke through a temporary structure built for diverting water to agriculture in the Imperial Valley in the southern California desert (Sykes 1937; Dowd 1960; Hely et al. 1966; Cohen et al. 1999). For about 16 months the entire river flowed into a below sea level depression known as the Salton Sink located on the northern edge of the Colorado River delta. By February 1907, when the river had been diverted back into its regular channel by a massive rock-dumping effort by the Southern Pacific Rail- road, the sink held a 1348 km 2 lake, the Salton Sea. In April 1908, the later famous California naturalist, Joseph Grinnell, with Chas. Richardson, Jr. and a boatman called “Donham,” set out to survey the bird life of this new water
Transcript of Fish and fish-eating birds at the Salton Sea: a century of ...

469
Lake and Reservoir Management 23:469-499, 2007© Copyright by the North American Lake Management Society 2007
Fish and fish-eating birds at the Salton Sea: a century of boom and bust
Allen H. Hurlbert1,a, Thomas W. Anderson2,3, Kenneth K. Sturm2,b and Stuart H. Hurlbert3
1Department of Biology, University of New Mexico, Albuquerque, NM 87131, USA
2Salton Sea Authority, Sonny Bono Salton Sea National Wildlife National Wildlife Refuge, Calipatria, CA 92233, USA
3Department of Biology and Center for Inland Waters, San Diego State University, San Diego, CA 92182, USA
Abstract
Hurlbert, A.H., T.W. Anderson, K.K. Sturm and S.H. Hurlbert. 2007. Fish and fish-eating birds at the Salton Sea: a century of boom and bust. Lake Reserv. Manage. 23:469-499.
We reconstruct historical trends in both fish and fish-eating bird populations at the Salton Sea, California since the Sea’s formation in 1905. The fish community has undergone dramatic shifts in composition, from freshwater spe-cies present in the initial wash-in to stocked marine species to dominance by an unintentionally introduced cichlid. Historical catch records, creel censuses, and gill-netting studies suggest that total fish biomass in the lake increased dramatically throughout the 1970s, crashed in the late 1980s, recovered in the mid-1990s, and crashed again in the early 2000s. We speculate that crashes in fish populations are primarily due to three physiological stressors—ris-ing salinity, cold winter temperatures, and high sulfide levels and anoxia associated with mixing events. The trends in fish biomass are mirrored in population trends of both breeding and wintering fish-eating birds, as indexed by a number of independent bird surveys. In contrast, most non-piscivorous birds at the Salton Sea show no indication of these temporal dynamics. We discuss possible explanations for the observed trends in fish-eating bird populations, including decline in organochlorine insecticide use and fluctuations in prey abundance at the Salton Sea. Finally, we speculate on the future prospects of both fish and fish-eating birds at the Salton Sea given the environmental chal-lenges the Sea currently faces.
Key words: Aechmophorus occidentalis, Ardea herodias, Aythya affinis, Casmerodius albus, Christmas Bird Counts, Circus cyaneus, DDT, Egretta alba, Egretta thula, Fulica americana, hydrogen sulfide, Hydroprogne caspia, long-term trends, Nycticorax nycticorax, Oreochromis mossambicus, organochlorine insecticides, Oxyura jamaicensis, Pandion haliaetus, Pelecanus erythrorhyncos, Pelecanus occidentalis, Phalacrocorax auritus, Podiceps nigricollis, Recurvirostra americana, saline lakes, salinity
a Current address: National Center for Ecological Analysis and Synthesis, 735 State St., Suite 300, Santa Barbara, CA 93101, USA, [email protected]
b Current address: Canaan Valley National Wildlife Refuge, U.S. Fish and Wildlife Service, HC 70 Box 200, Davis, WV 26260, USA
IntroductionIn the spring of 1905 the Colorado River broke through a temporary structure built for diverting water to agriculture in the Imperial Valley in the southern California desert (Sykes
1937; Dowd 1960; Hely et al. 1966; Cohen et al. 1999). For about 16 months the entire river flowed into a below sea level depression known as the Salton Sink located on the northern edge of the Colorado River delta. By February 1907, when the river had been diverted back into its regular channel by a massive rock-dumping effort by the Southern Pacific Rail-road, the sink held a 1348 km2 lake, the Salton Sea.
In April 1908, the later famous California naturalist, Joseph Grinnell, with Chas. Richardson, Jr. and a boatman called “Donham,” set out to survey the bird life of this new water

Hurlbert, Anderson, Sturm and Hurlbert
470
body (Grinnell 1908). They launched a small motorboat at the northern end of the lake and traveled nine hours southwest-ward, covering about 65 km (40 miles) before attaining their first objective, Echo Island. During the trip they observed Eared Grebes, Western Grebes, Common Loons, Double-crested Cormorants, Caspian Terns, and Ring-billed Gulls (scientific names of all bird and fish species mentioned are given in Appendix 1). Landing on Echo Island they found 980 White Pelican nests with eggs and others under construc-tion thus documenting the southernmost recorded nesting colony of the species. No other bird species were observed nesting there. The following day they visited Pelican Island, “a small rocky ledge three miles from Echo Island”, and recorded egg-occupied nests of Double-crested Cormorant (their “Farallone cormorant”) (147 nests), Great Blue Herons (7 nests) and White Pelicans (3 nests). Donham claimed that “two and three years ago” (i.e., presumably in the springs of 1905 and 1906), when the Salton Sea was still filling, this Pelican Island was “the nesting ground of the pelicans.”
Thus from its earliest days, the Salton Sea seems to have been an attractive feeding and nesting area for piscivorous waterbirds. Large numbers of fish undoubtedly were carried into the lake as the Colorado River filled it. A few species, finding it a congenial environment—murky, warm year round, nutrient-rich, and with few predators—were able to increase rapidly in abundance. Over the past century the Salton Sea has undergone marked changes in its size, salin-ity, fish assemblage, and other characteristics. This would lead one to predict that large changes in the bird assemblage associated with it have also occurred. With a present area of ca. 980 km2, the Salton Sea is the largest lake in California and has a salinity of about 47 g l-1.
The primary objectives of the present study are twofold. First, we reconstruct the historical changes in the Salton Sea fish fauna since the lake’s formation using all of the published data, unpublished creel censuses and gill net surveys, and anecdotal information available. Second, we examine and interpret trends in the abundance of fish-eating birds at the Salton Sea since the 1950s using data from the Audubon Christmas Bird Counts, colonial nesting bird surveys con-ducted by the Sonny Bono Salton Sea National Wildlife Refuge (1987-1999), and a monthly wildlife surveillance program (2000-2004). Trends are related both to changes in Salton Sea fish populations and to regional environmental change and temporal patterns documented for the same bird species over western North America by the North American Breeding Bird Survey. We also speculate on the future of the Salton Sea as habitat for piscivorous birds in light of changes taking place there and elsewhere in the Colorado River delta region.
Methods and data setsThe data and information sources that form the basis of this paper, together with our methods of analyzing them, are as follows.
Fish and environmental dataInterpretation of trends in fish-eating birds would be facili-tated by information on how the kinds, population densities, and sizes of fish in the Salton Sea have changed over time. Unfortunately, hard information of this sort is mostly lack-ing. Aside from the detailed studies of the 1950s (Walker 1961) and recent gillnet surveys (Costa-Pierce and Riedel 2000; Riedel et al. 2002, 2007; Caskey et al. 2007), most historical information on the fish populations is found in a few unpublished reports of creel censuses (Hulquist 1981; Black 1988), earlier gillnet surveys (Black 1979-1980, 1982, 1988), and monitoring of the planktonic eggs and larvae of fish (Matsui et al. 1991). The popularity of the Salton Sea sport fishery, however, has resulted in many articles in the popular press, many references to fishing conditions and fish kills in unpublished records of the Salton Sea National Wildlife Refuge (SSNWR) and Salton Sea State Recreation Area (SSSRA), and many memories in the minds of both agency personnel and local residents. Individuals who have been especially helpful in providing information include Glenn Black, California Department of Fish and Game seasonal aide (1971, 1972) and fisheries biologist (1978-1983); Norman Niver, shoreline resident in Salton City (1979-present); Steve Horvitz, successively Superintendent of the Salton Sea State Recreation Area and Director of State Parks Southeastern Region (1991-2000); James “Tex” Rit-ter, Chief Ranger, Salton Sea State Park (1975-1983); and Mickey Jensen, staff member, SSSRA (1971-present). We draw on all of these sources in our attempt to reconstruct historical change in fish abundance and assess its causes. Table 1 summarizes the sparse quantitative information obtained since 1958 on composition of fish catches taken by hook and line and gillnetting. Figure 1 summarizes this and more anecdotal pre-1958 information on composition of the fish fauna. It also presents a frankly speculative estimate of how the total fish standing crop may have changed in the lake during 1905-2004. We have dared to indicate absolute values on the axis scaling standing crop, even in the absence of a single empirical estimate of fish standing crop for the lake. These values are not unrealistic given that for eutrophic lakes in the temperate zone, standing crops of 130-430 kg ha-1 are typical (Carlander 1955), that the dominant fish, tilapia, is fairly omnivorous but feeds principally on phytoplankton, and that the lake is warm. The relative changes in abundance over time, however, are those we will be attempting to relate to fluctuations in the fish-eating bird populations.

Fish and fish-eating birds at the Salton Sea: a century of boom and bust
471
Figure 1.-Historical changes in fish biomass (A), fish species composition (B), and salinity (C) in the Salton Sea, 1907-2004. Salinity data for the years 1907-1916, 1923, 1929, and 1945-1996 are measured values, while other years reflect calculated values (Tostrud 1997, Watts et al. 2001). Fish biomass values are speculative, and information on species composition is from various sources (see text).

Hurlbert, Anderson, Sturm and Hurlbert
472
Table 1.-Historical trends in composition of catch by fishermen (hook and line) and fish biologists (multi-panel gill nets), 1958-2004. Data for 1958-1969 from Hulquist (1981), for 1975 from Adamson (1975), for 1979-1980 from Black (1979-80), for 1982 from Black (1982), for 1983 from Black (1985), for 1999-2000 from Costa-Pierce and Riedel (2000) and Riedel et al. (2002), for September 2002 from Caskey et al. (2006), and for 2002-2004 from J. Crayon, California Department of Fish and Game. Rare catches of mullet, threadfin shad, and other species are not included here.
Percentage of total catch Year Months sampled Fishing methoda Total catch Corvina Sargo Bairdiella Tilapia
1958 Oct, Nov, Dec, Jan HLB 276 18 0 82 0 HLS 99 71 11b 18 0
1963 Feb HLB 99 32 68 0 0 HLS 43 0 100 0 0
1964 Apr, May, Sep, Nov HLB 16,605 92 5 3 0 HLS 3873 32 20 48 0
1965 Apr, May, Jun, Sep, Oct HLB 51,391 79 9 12 0 HLSc 6529 8 49 43 0
1966 Apr, May, Jun, Sep, Oct HLB 29,870 26 29 45 0 HLS 10,660 6 37 57 0
1967 Apr, Jun, Sep, Oct, Nov HLB 44,866 33 25 42 0 HLS 24,912 7 29 64 0
1969 Apr, May, Jun, Sep, Oct, Nov HLB 33,404 18 27 55 0 HLS 10,915 4 17 79 0
1975d Oct, Nov MPG-26 318 25 6 65 4
1979e,f Oct, Nov, Dec MPG-69 3,576 2 6 27 65
1980e,f All except Feb, Apr, May, Oct MPG-134 9,102 12 9 17 62
1982f,g Aug MPG -26 1,838 2 9 22 67
1983h All months HLB 29,564 6 29 20 45 HLS 73,035 2 28 32 38
1999i Feb, Apr, Jun, Aug, Oct, Dec MPG-168 7,548 3.6 1.2 46 49
2000j Apr, Jul, Oct, Dec MPG-104 2,261 2.6 0.31 62 35
2002 Sepk MPG-8 60 7 0 86 7
“ten months” l MPG-?? 198 8 3 58 31
2003l Apr, May, Jun, Jul, Aug, Oct MPG-102 996 2 0 18 80
2004l All except May, Jun, Sep MPG-154 3198 0 0 0 100
a HLB = Hook and line from boat, HLS = hook and line from shoreline or jetty, MPG = multi-panel gillnets. Total number of gill-net sets is given for each year or data set.
b First record of capture of sargo in the sport fishery, though three specimens were caught in gill-netting studies in 1956-57; it was introduced into Salton Sea in 1951 (Walker et al. 1961).
c Based only on catches from jetties; data set for shoreline catches in Appendix 7 of Hulquist (1981) contains errors and missing data and so is not used here.
d Data from unpublished class report by Calif. State Univ. Los Angeles ecology student, T.R. Adamson; gill nets of unspecified number and nature set at five locations - south of 81st drain, south of Whitewater drain, off Salt Creek mouth, and at ‘Sunken City’. We estimated total number of net-hours at about 240.
e Data from almost monthly gill-netting operations from March 1979 to December 1980. Numbers of net sets and net hours often not precisely stated. Tilapia catches for June, August and September 1979 have been adjusted for under-reporting or non-reporting, using other information given in Black (1979-1980).
f Multi-panel gill nets with 7.6 m panels of 3.8, 6.3, 8.8, 12.6, and 16.3 cm mesh.g Data from gill nets operated August 2-6, 1982 at northwestern corner (Desert Shores) of sea (10 nets) and various locations along eastern shoreline;
net sets set generally within 0.5 km from shoreline.h Data from monthly creel censuses from Oct 1982 to September 1983 (Black 1988).i Multi-panel gill nets with 10 m panels of 1, 2, 7, 10, and 12.5 cm stretched mesh; during each sampling month, nets were set at 3 midlake stations, 2
near shore stations ca 2 km from shoreline, and 2 stations just off mouths of rivers. Tilapia catch reported by Costa-Pierce and Riedel (2000) has been corrected for over-reporting by 1100 individuals.

Fish and fish-eating birds at the Salton Sea: a century of boom and bust
473
Starting in December 1999, the Salton Sea Authority funded wildlife biologists, including one of us (TA), based at the Salton Sea National Wildlife Refuge to closely monitor fish kills at the Sea. The attempt was made to visit, usually by airboat, any kill involving more than ~5000 fish and to estimate the numbers of each species in it.
We also attempt to decipher the causes of changes in fish populations. Two physical variables strongly influencing fish reproduction, growth and survival are salinity and water temperature. There is a fairly complete long term record of lake salinity available from Hely et al. (1966) and unpublished records of the Imperial Irrigation District (IID, Imperial, California) that have been partially summarized by Tostrud (1997). Since 1983 IID has made water quality measurements at five stations around the margin of the Sea. We have used only salinity values checked for cation-anion balance. In their study of ichthyoplankton, Matsui et al. (1991) also determined total dissolved solids at each of 20 stations in the Salton Sea at two to four week intervals dur-ing 1987-1989.
Strong influences on salinity are precipitation and lake el-evation, and we also present information on how these have changed since 1968. Data on the latter two variables are provided by IID and the U.S. Geological Survey. Monthly
precipitation values for two locations, one ~ 26 km northwest of the Sea (‘Indio Fire Station’) and one ~19 km southeast of the Sea (‘Brawley 2 SW’), were obtained from the Na-tional Climatic Data Center website at http://www.wrcc.dri.edu/climsum.html.
Water temperature is of special significance to the dominant fish in the lake, a tilapia that appears to be an Oreochromis mossambicus x O. urolepis hornorum hybrid (Costa-Pierce and Doyle 1997). Winter temperatures are close to its lower temperature tolerance limits and are thought to sometimes be responsible for winter tilapia die-offs (Sardella et al. 2004a,b; Caskey et al. 2007). Water temperatures are determined largely by insolation, air temperature, and wind conditions (Watts et al. 2001). Spot surface water temperature measure-ments have been made in various monitoring programs, but the only meaningful water temperature data available are for 1954-1956 (Carpelan 1958, 1961b) and 1997-1999 (Watts et al. 2001; Holdren and Montaño 2002). For assessment of how winter water temperature may have changed since 1968 we have obtained for the two weather stations mentioned above, values for mean January air temperature.
Bird data
Christmas Bird Counts
The Audubon Society’s Christmas Bird Counts (CBCs) are the oldest continuous wildlife survey in North America (Bock and Root 1981). The survey was first conducted in 1900 in a few scattered locations and has since expanded to approximately 1700 CBCs throughout North America. Not until the 1950s, however, were standardized survey proce-dures adopted to ensure some comparability between CBCs and between years. According to current CBC methodology, each CBC is carried out within a 15-mile (24 km) diameter circle chosen initially by the local compiler. The count is conducted during a single calendar day within two weeks of Christmas. The number of participants in a given count is unlimited, and there are no minimum qualifications for bird identification skills.
Portions of the Salton Sea are included in two separate CBC circles (Fig. 2). One circle is located at the southeastern end of the sea (Salton Sea South), centered 3.5 km ESE of the
Table 1.-(cont.)
j Nets as in (i) above, set at 3 midlake stations, 4 nearshore stations, and 3 stations off river mouths. Tilapia catch reported for 1999-2000 in Riedel et al. (2002) has been corrected for over-reporting by 1384 (1100 + 284) individuals.
k Nets as in (i) above, set at 3 nearshore stations and 3 stations off river mouths.l Data from Draft Quarterly Reports of Salton Sea Long-term Monitoring program of the California Department of Fish and Game, provided courtesy
of J. Crayon. Multi-panel gill nets with 9.1m panels of 1.2, 2.5, 7.5, and 10 cm stretched mesh, set, as possible, at 3 midlake stations, 8 nearshore stations, and 3 stations off river mouths.
Figure 2.-Map of the Salton Sea area and the two Christmas Bird Count circles. For the Colonial Nesting Bird Surveys, traditional census areas lie between the Alamo and New River deltas. Newer census areas are indicated by stars (see Table 5).

Hurlbert, Anderson, Sturm and Hurlbert
474
Salton Sea National Wildlife Refuge headquarters. In ad-dition to a small portion of the Sea, the circle also includes portions of the New and Alamo rivers and their delta areas, Ramer Lake, wetland habitats managed by the U.S. Fish and Wildlife Service and California Department of Fish and Game, and several drains or drainage canals which carry ag-ricultural wastewater to the Sea. Counts were first conducted for Salton Sea South from 1955 to 1957. After a seven-year lapse, Salton Sea South was next surveyed in 1965, and, after another short break, from 1968 to the present. During the first three years, the center of the census circle was 5.4 km south of the post-1964 location, overlapping it in area by 71.6 percent and covering the same major habitats. Parts of the 1956 and 1957 surveys were conducted by plane; the data are included merely as rough indices of abundance at that time.
The second circle is located at the northwestern end of the sea (Salton Sea North), and is centered 6.4 km SSW of Mecca. Other significant wetland habitats in this circle include the Coachella Canal and the Whitewater River delta. Salton Sea North was censused in 1965, 1969 to 1982, 1985, and 1987 to the present. Each circle included approximately 24 km of Salton Sea shoreline, and the Sea comprised approximately 20 percent of the survey area for each circle.
Sampling effort varied between years and between count circles (Fig. 3), preventing rigorous statistical analyses of any potential trends. However, we assume that yearly counts include the same primary birding spots (e.g., the river deltas, main canals, Ramer Lake, wildlife refuge areas) each year regardless of the number of surveying parties, and thus the general trends reflected by these data are probably repre-sentative.
The CBC data we use in this report are from the Christmas Count summaries published in American Birds (formerly Audubon Field Notes) volumes 10-12, 20, and 23-53. The raw data are also available on the world wide web at http://www.audubon.org/bird/cbc/.
Colonial Nesting Bird Surveys
Colonial nesting bird surveys were conducted annually by the Salton Sea National Wildlife Refuge from 1987 through 1999. Surveys were conducted on foot, by boat, and, less regularly, with the assistance of aerial counts (see Molina and Sturm 2004 for detailed methodology). The number of nests of Brown Pelicans, Double-crested Cormorants, Great Blue Herons, Great Egrets, Snowy Egrets, Cattle Egrets, and Black-crowned Night Herons has been documented each year at various locations along the shoreline of the Sea. From 1987 to 1990, census locations included only the southeastern end of the Sea from Red Hill to the New River delta. From 1991 on, these traditional areas continued to be censused while other locations from around the rest of the shoreline
were added to the survey. The Refuge’s unpublished annual reports on colonial nesting bird surveys contain nesting data for some sites additional to those considered here. These, however, were not visited on two or more years during 1987-1999. Thus their counts are not included in the data we report, as this would have added noise to the temporal trends. The duration of each annual survey varied from two to more than eight months, depending upon the duration of nesting activity of the focal bird species. This variability and changes in survey personnel and details of field survey procedures undoubtedly introduced some variability—and, potentially, spurious patterns—into the data set. We use the data, however, to document only the gross trends. One of us (KS) was responsible for conduct of the 1994-1999 surveys, during which period major changes in nesting by fish-eating birds took place.
Breeding Bird Survey
The North American Breeding Bird Survey (BBS) is another continent-wide avian monitoring program initiated in 1966 by Chandler Robbins and the Migratory Bird Population Station (now the Patuxent Environmental Science Center; Bystrak 1981). From about 600 survey routes at the program’s inception, the BBS has expanded to over 4000 active routes throughout the U.S. and Canada, approximately 3000 of which are surveyed annually in May or June. Each survey route is 24.5 miles (39.2 km) long, and 3-minute point counts are conducted at 0.5 mile (0.8 km) intervals for a total of 50 point count stops per route. Observers record all birds heard or seen within 0.25 mile (0.4 km) of each stop. Data from the BBS (Sauer et al. 2004) were used to depict regional population trends over western North America, placing the observed trends at the Salton Sea in a larger context.
Figure 3.-Sampling effort for Christmas Bird Counts at the Salton Sea South and Salton Sea North survey circles, 1955-2004.

Fish and fish-eating birds at the Salton Sea: a century of boom and bust
475
Salton Sea Authority monthly censuses
As part of the Wildlife Disease Surveillance Program funded by the Salton Sea Authority, monthly estimates of abundance were made for American White Pelican, Brown Pelican, Double-crested Cormorant, Eared Grebe and total waterfowl populations on the Salton Sea from December 1999 through December 2004. Abundance estimates represent the sum of individuals observed at 27 sites distributed around the Salton Sea shoreline. An airboat was also used for estimating bird numbers around the Alamo, New and Whitewater River deltas, as well as open water habitat in the mid-Sea.
In counting large aggregations of birds, the average number of birds within a single viewing field of either binoculars or spotting scope was calculated based on three to five viewing fields. This average was then multiplied by the number of fields required to cover the concentration of birds at that site. For sites visited more than once during a reporting period, an average number of the counts was used for that site.
Analysis of the CBC data
For analysis we selected the nine most abundant piscivorous bird species and seven non-piscivores commonly found using the Salton Sea and other habitats nearby. The piscivorous species include Double-crested Cormorant, American White Pelican, Brown Pelican, Great Blue Heron, Great Egret, Snowy Egret, Black-crowned Night Heron, Osprey, and Caspian Tern. The seven non-piscivores include Eared Grebe, Cattle Egret, Lesser Scaup, Ruddy Duck, American Coot, American Avocet, and Northern Harrier. Temporal patterns in numbers of non-piscivores are presented mainly to inform interpretation of trends in the piscivorous species.
Counts span a few orders of magnitude for many species, so log scales have been used in plotting the raw count data. Only in this way are patterns of variation over the low to intermediate scales of abundance made evident. We have also combined the two data sets for each species into a single graph that plots smoothed mean counts on an arithmetic scale. This allows clearer depiction of some of the smaller (e.g., two- to four-fold) long term changes in abundance, as well as providing a summary of the data from what can be regarded as two replicate sampling units, the CBC circles. These mean values are geometric means of the smoothed data for the two count circles. They were calculated by adding 1 to each datum and then replacing it with its three-point moving average (i.e., the arithmetic mean of it, the datum (x+1) for the preceding year and the datum for the following year). Then, for each year, the geometric mean of the three-point moving averages for the Salton Sea North and Salton Sea South circles was calculated. This smoothing and averaging helps prevent large year-to-year fluctuations from obscuring the long-term trends that are the object of this analysis.
Lack of counts for Salton Sea North for 1983, 1984, and 1986 resulted in missing mean values for 1983, 1984 and 1985. This results from calculating geometric means only when the needed three-point moving average was available for both CBCs. Instead of a three-point moving average, a two-point moving average was calculated when counts were available for only two of the three relevant years. Where only one of the three counts was available, no moving average was calculated and no data point was plotted.
Historical change in fish populationsFrom wash-in to stocking (1905-1958)There are now a number of extended accounts of the histori-cal changes in the Salton Sea (Sykes 1937; Hely et al. 1966; Tostrud 1997; Walker 1961; Cohen et al. 1999). Following its initial filling, the Sea shrank from 1348 km2 to 944 km2 by 1924, then gradually albeit erratically increased to its present size of ~980 km2. These changes were due to the very high evaporation rate (~1.6 m yr-1) in the hot, arid climate and a gradual increase over the first half of the century in the volume of agricultural wastewaters that flowed into and constituted the primary water supply of the Sea.
Salinity changes over the early years were also dramatic. It was initially presumably close to that of the Colorado River (~ 0.5 g l-1) but by 1907 stood at 3.5 g l-1. Dissolution of salt deposits on the floor of the depression (lowest point of lake bottom, ca. 85 m below sea level) occupied by the lake and evaporative concentration of mildly saline (2-4 g l-1) agri-cultural inflow waters brought salinity to ocean water levels (35 g l-1) by 1920 (Fig. 1).
During these first 15 years the Salton Sea fish assemblage would have changed dramatically as the fish standing crop first increased to some high level and then crashed as the rapid rise in salinity eliminated most of the predominantly freshwater species that had been carried in by the 1905-1907 floodwaters. Every fish species, native and exotic, then liv-ing in the lowermost reaches of the Colorado River can be presumed to have been washed in during this event.
Feeding at the base of the food chain, the herbivorous common carp and striped mullet may have been the most abundant species in these early years. The latter supported a small-scale commercial fishery from 1915 to 1921 and then again from 1943 to 1953 (Thompson and Bryant 1920; Dill 1942; Hendricks 1961b; Whitney 1967). Evermann (1916) reported numerous freshwater forms still abundant in 1915 when salinity was already up to 13 g l-1. By 1929 when salin-ity was 33 g l-1, Coleman (1929) mentioned the humpback sucker as being common and mosquito fish, desert pupfish and rainbow trout as abundant in particular locations, but

Hurlbert, Anderson, Sturm and Hurlbert
476
total fish standing crop was probably much lower than it was during the Sea’s first decade (Fig. 1).
Stocking of the Sea with various marine fish species was initiated by the California Department of Fish and Game in 1929-1930 (Walker et al. 1961). The only species that established itself as a result of these first efforts was the small, bottom-dwelling longjaw mudsucker. During much of the 1930s salinity was in the range 45-50 g l-1 (Fig. 1), as a result of reduced wastewater inflows in the early 1930s. The fish assemblage at this time presumably was species-poor, highly stressed and with the lowest standing crop of the century, though there is not even anecdotal information on fish for the period. In the early 1940s after salinity had declined, the machete was reported as numerous, the mullet was sufficiently abundant for reestablishment of a small-scale commercial fishery, as mentioned, and other fish species were absent or extremely scarce (Dill and Woodhull 1942). In 1949 only four species of fish were present–desert pup-fish, mullet, mosquitofish, and longjaw mudsucker (Walker 1961)–all presumably in very low numbers and restricted to the shallowest parts of the Sea.
A major increase in fish standing crop followed the 1950-1951 stocking of the lake with many marine species from the Gulf of California (Fig. 1). Three of these species–bairdiella, sargo, and orangemouth corvina–successfully established large populations. Bairdiella and corvina spawned success-fully in 1952, sargo possibly with a delay, and “by 1958, an-glers were taking fair numbers of all three” (Hulquist 1981). These became the basis for a very successful sport fishery, greatly increasing recreational use of the Sea and, in part, inspiring the development of new residential communities along parts of the shoreline of the lake (Walker et al. 1961; Hulquist 1981; Mathews 1982; Karr 1985; Black 1988).
Massive periodic crashes of the greatly increased fish stock occurred beginning almost immediately. They are not sug-gested in Fig. 1 for lack of even rough estimates of their magnitudes and timing. But Whitney (1961) noted that “mortalities [of bairdiella] occurred in late summer or early fall of each year from 1953 to 1956,” and systematic counts along numerous sections of shoreline suggested a lake-wide kill of bairdiella in 1954 of about 12,000,000 individuals with the fall of 1956 seeing another “severe kill.” Starvation as a result of reduced summertime abundance of the pileworm (Neanthes succinea Frey and Leuckart) combined with high water temperatures was thought to be the cause.
Threadfin shad, a normally freshwater species, was intro-duced from Tennessee into the Colorado River in March 1955 and was found in the Salton Sea, and in corvina stomachs there, by September of the same year (Hendricks 1961a). Then and now it is caught by gill nets in very small numbers near points of inflow and does not appear to reproduce in the Sea itself (Riedel et al. 2002; J. Crayon, pers. comm.).
The fish standing crop in the 1950s and 1960s probably was lower than during the Salton Sea’s first decade (Fig. 1), as the newly introduced marine species fed primarily on benthic invertebrates, pre-existing fish populations, and each other. Herbivorous fish, in particular the carp and mullet, had disap-peared or were scarce. The abundant zooplankton—barnacle larvae and cyclopoid copepods in particular—was heavily utilized by juveniles (e.g., up to 30 mm) of both bairdiella and corvina, but larger fish fed almost entirely on the pileworm. Most of the planktonic production was assumed to enter the upper parts of the food web mainly via its contribution to the organic detritus food supply of the pileworm, which was restricted during the warm part of the year to a small portion of the Sea (water depths < ~8m) by anoxia in deep water areas (Carpelan 1961a; Walker et al. 1961).
From heyday to tilapia invasion (1958-1975)The late 1950s and the 1960s were a heyday for the Salton Sea with generally excellent fishing for corvina, sargo and bairdiella, increased use of the Sea for boating and water sports, and expansion of recreational facilities and shoreline residential areas. Twelve marinas were in operation around the Sea in 1963 (Hulquist 1981). Creel censuses in 1958, 1963, 1964, 1965, 1966, 1967, and 1969 (Hulquist 1981) provided some of the best fishery information obtained dur-ing the Sea’s history. Sargo were first reported in the sport fishery in 1958. Between 1964 and 1969 estimated annual catches by anglers ranged from 557,648 to 1,178,270 fish, with corvina strongly dominating the catch in the first years and bairdiella in the later ones (Table 1). Long time shoreline residents like Dick Shaw of North Shore recall that there were frequent small fish kills and occasional large ones even in the 1960s. SSSRA staff developed shoreline cleanup procedures for dead fish that washed up on the shorelines near its camp-grounds. No regular records were kept, but its unpublished Annual Summaries mention 6 tons of fish, mostly bairdiella, being hauled away in 1968 and 50 tons of bairdiella and corvina being picked up in 1970.
Mollies (Poecilia spp., Poeciliopsis spp.), small cyprinodont fish usually < 6 cm in length, colonized the lake on two or more occasions. Hulquist (1981) reported them becoming established in 1963 after escaping or being released from nearby commercial tropical fish hatcheries, and they also may have been washed by flash floods out of a tropical fish farm near Bombay Beach in 1965. These are a good forage fish both for larger fish in the sea and for smaller fish-eating birds. Normally they are scarce in the Sea itself, but they become exceptionally abundant, along with water boatmen (Trichocorixa reticulata Guérin-Menéville: Corixidae), whenever there is a major crash of the populations of larger fish, according to many long time observers (S. Horvitz, N. Niver, T. Ritter, pers. comm.).
Fish and fish-eating birds at the Salton Sea: a century of boom and bust
477
Two tilapia species, Tilapia zillii and the hybrid Oreochromis mossambicus x O. urolepis hornorum, may have invaded the lake in the 1960s but were not detected until the 1970s. Tilapia were unrepresented among more than 40,000 fish tallied in a 1969 creel census (Table 1). Costa-Pierce (1997) and Costa-Pierce and Doyle (1997) have summarized much of the information on the arrival of these species and their origins. Because the two species are fairly similar in appear-ance, early reports by non-fish biologists specifying one or the other species may often have been in error. T. zillii may have arrived in the Salton Sea region from neighboring Arizona where it was abundant in canals and drains in the early 1960s, but it also was directly introduced into canals and drains in the Imperial and Coachella valleys where it was being tested for its ability to reduce flow-obstructing aquatic vegetation (Hoover and St. Amant 1970; Pelzman 1973; Hauser 1975a,b; Legner and Pelsue 1977; Legner and Fisher 1980). On August 7, 1974, Salton Sea State Recreation Area rangers reported finding three tilapia (species not specified) in Whitefield
Creek, probably within 100 m of Varner Harbor, into which it empties, on the northeastern corner of the Sea (SSSRA, unpubl. records). T. zillii now appears to be mostly restricted in the Salton Sea area to drains emptying into the Sea where it is suspected of having greatly reduced populations of the endangered desert pupfish (Schoenherr 1988). Desert pupfish in many drains increased in abundance after extremely cold winter weather in the late 1980s (Fig. 4) killed most of the T. zillii in them (K. Nicol, California Dept. Fish and Game, pers. comm.). These drains are heavily used by herons and egrets (Hurlbert 1996).
T. zillii once may have been more abundant in the Salton Sea than it is now. In March 1975 SSSRA Chief Ranger Ritter (pers. comm.) saw for the first time someone catch a tilapia (species unspecified) in Varner Harbor. In October-Novem-ber 1975, fish claimed to be T. zillii constituted 4 percent of the catch in gill nets set nearshore in the northern part of the Sea (Table 1); they measured 10-18 cm in standard length. On December 23 of that year one person was observed to have caught 116 tilapia near SSSRA headquarters and T. Ritter recorded that “[t]he recently introduced fish Tilapia zillii has reproduced at incredible rates and has now become an actively sought food fish by both fishermen and corvina” (unpubl. SSSRA 1976 Annual Report). Black (1988) noted that “[b]y the mid 1970s, occasional creel census[es] showed that a substrate-breeding cichlid, the redbelly tilapia, Tila-pia zillii, was present in the Sea [and that]…[i]n 1979, it became apparent that another cichlid…the Mozambique mouthbrooder, Tilapia [Oreochromis] mossambica…had established a breeding population in the Sea and also was providing a sportfishery.”
The O. mossambicus x O. u. hornorum hybrid that consti-tutes all or most of the present cichlid population in the lake (Costa-Pierce and Doyle 1997) and which we will henceforth refer to simply as tilapia, was being cultured and released into Arizona waters starting in 1965, was being illegally cultivated in a small pond a few miles from the southeastern shoreline of the Sea in 1964, and was found in a stream leading into but a few km away from that corner of the Sea in 1965 (St. Amant 1966). It also was being tested as an agent for aquatic vegetation control in the region.
SSSRA annual reports during the 1970s mention many fish kills along the northeastern shoreline under its management, mostly of bairdiella and occasionally corvina and mollies, but their first specific mention of a large fish kill dominated by tilapia was of one on September 29, 1979. These same records note for February 25, 1977, however, a “Large fish die-off in [Varner] harbor. One of the largest fish die-offs on record.” This may be presumed to have been a tilapia die-off, as such have been frequent during February over recent decades whereas die-offs of corvina, bairdiella or
Figure 4.-Historical change in mean January air temperature at a weather station in Brawley with respect to the long term mean for the period 1968-2005 (dotted line) (A), lake elevation (end of year) and salinity (late October or early November) (B), and monthly precipitation at two locations just south (Brawley) and north (Indio) of the Sea (C, D), for 1968-2004. No monthly precipitation data are available (*) for Indio for the periods: Jun 1982-Jun 1985; Aug, Nov-Dec 1987; Jan 1988; Aug-Oct 1991; Jan 1992; Aug-Sep 1997; Jan-Jun, Oct 1998; Oct 2000; Mar-Apr 2001; and Apr 2002. No precipitation data are available for Brawley for Jan 2001 and Jul 2002.

Hurlbert, Anderson, Sturm and Hurlbert
478
sargo during January and February are essentially unheard of at the Sea.
It is too late to resolve the nature, timing, and interactions of these separate cichlid invasions. It seems likely, however, that the tilapia population of the Salton Sea, whichever spe-cies dominated it, had been growing exponentially since the early 1970s.
First tilapia peak (1976-1986)By the late 1970s and early 1980s tilapia had become the most abundant fish in the Sea, brought the total standing stock of fish in the Sea to what surely was an all time high, had become a major sport fish in its own right, and was a major contributor, as a forage fish, to a robust corvina population and sport fishery (Table 1, Fig. 1). It may even have stimulated the bairdiella population. That species has been observed with juvenile tilapia in its stomach (Caskey et al. 2007). The primary factor permitting this explosion was that this tilapia is an opportunistic feeder on “phyto- and zooplankton, benthos, periphyton, and detritus, with smaller fish using predominantly animal matter and larger fish, algae” (Hart et al. 1998, summarizing information from other lakes, in Neil 1966; Whitfield and Blaber 1978; Pullin and Lowe-McConnell 1982; Trewavas 1983; Maitipe and De Silva 1985; de Moor et al. 1986). Stomachs of adult Salton Sea tilapia collected during 2000 were found to contain dia-toms, dinoflagellates, ciliates, nematodes, rotifers, copepods, barnacle larvae, and pileworms, the relative proportions of these varying markedly with season (R. Riedel and B. Costa-Pierce, unpubl. data). Bairdiella, sargo, and corvina, on the other hand, utilize zooplankton only as juveniles, and utilize phytoplankton probably not all. As the only fish species con-suming both phyto- and zooplankton during both juvenile and adult stages of its life cycle, tilapia thus was able to achieve much higher standing biomass than those species that are so heavily dependent on pileworms.
Heavy precipitation accompanying tropical storms in the late 1970s is a second factor to which increases in tilapia and other fish populations were popularly attributed, with decreases in salinity suggested as the operative factor. Dur-ing the first half of the 1970s the lake level rose gradually and salinity remained stable at about 39 g l-1 (Fig. 4). Then in September 1976 tropical storm Kathleen came roaring in and dropped more than 60 mm of rain in the area (Table 2), causing flash floods, a rise in lake level of about 15 cm, and inundation of shoreline properties. Additional storms followed and before the end of the year there was extensive inundation of additional shoreline properties, and 37 prop-erty owners filed a lawsuit against the local water agency, the Imperial Irrigation District. The plaintiffs claimed that wastage by IID of over-ordered irrigation water into the Sea
had been excessive and a major contributor to property losses (Matthews 1982).
The best record of these events is found in the SSSRA 1976 Annual Report (unpublished):
The Salton Sea’s inherent problems continued in 1976. The most obvious problem was the continued rising trend of the water. …While Northern California is suffering from a terrible drought, the Coachella Valley has had about three times normal rainfall. Most of the rain came in storms that blew in from Mexico. The largest, Tropi-cal Storm Kathleen, dumped 1.55 inches [39 mm] of rain at Headquarters in about five hours [on September 10]…Two weeks after Kathleen came another tropical disturbance [on September 23]. This storm brought 0.99 inches [25 mm] of rain in a few hours. Since the ground was still saturated from the previous storm, the runoff was fast and heavy. Salt Creek rose to within 10 feet of the highway bridge, and caused choppy water more than 100 yards into the Sea. …Both storms added an incred-ible amount of water to the Sea. Its level raised about 8.5 inches [22 cm] from September 1 to September 30. …The level of the Sea was 18 inches [45 cm] higher in
Table 2.-Rainfall totals for storms delivering > 35 mm to at least one of two meteorological stations near the Salton Sea, 1968-2003. nd = no data available.
Precipitation (mm) Indio Fire Date Brawley 2SW Station
1974 Jan 5-9 31.8 60.5
1976 Feb 6-10 35.3 51.6
1976 Sep 10-11 60.2 67.8
1976 Sep 24-25 12.7 39.6
1977 Aug 16-18 122.9 98.3
1979 Jul 12-20 11.7 41.6
1980 Feb 13-21 48.5 99.8
1982 Dec 8-11 43.4 5.6
1983 Mar 2-4 39.1 nd
1983 Aug 9-10 35.8 nd
1986 Oct 10 55.9 17.8
1991 Feb 28 – Mar 2 32.8 49.8
1992 Mar 27-28 37.3 nd
1993 Jan 13-19 48.0 74.7
1995 Jan 3-5 20.1 64.5
Mean annual 66.8 79.5 (1927 – 2003)

Fish and fish-eating birds at the Salton Sea: a century of boom and bust
479
December [1976] than it was in the previous [1976] January. This is much more than the expected rise. The major increase has been due to several factors. Precipi-tation in the last one and one-half years has been about 300% more than average. …New fields are being irri-gated in the Coachella and Imperial valleys. This adds to the agricultural runoff which in turn raises the Sea level. Evaporative loss was lower due to the relatively cool summer. All of these factors combined to raise the Sea to its highest level since 1914.
SSSRA Chief Ranger Ritter (pers. comm.) observed a dra-matic phenomenon the following spring:
The croaker [= bairdiella] spawn was very large. Bil-lions of tiny croaker would be an understatement. When they got up to about an inch long they had consumed most of the plankton in the water. You could wade out into four feet of water and count your toes. The tiny croaker starved to death, had large heads with paper thin bodies. If you stood still in the water hundreds would attack the hair on your chest and legs. When they died off there was a berm about a foot wide and 8 inches tall along the eastern shore.
Then tropical storm Doreen came through in August 1977 and dumped almost twice as much rain as Kathleen had, causing much further damage (Table 2). Interestingly, just before that storm, on August 8, there was a fish die-off along the shoreline between Bombay Beach and North Shore estimated at between 750,000 and 4,000,000 fish, mostly bairdiella (unpubl. SSSRA 1977 Annual Report). In January 1978 two other big storms dropped about 30 mm of rain each in the region (Table 2). In reviewing the first half century of the Salton Sea, Dowd (1960) noted “there have been a number
of instances when the runoff from a single storm has raised the elevation of the sea from 0.75 of a foot to 1.5 feet.”
The effect of the 1976, 1977, and 1978 storms on salinity was limited and brief. For the Sea as a whole, salinity dropped by less than 1 g l-1 between 1976 and 1978 (Fig. 4). It is nevertheless conceivable that temporary freshening of river mouth, nearshore and shallow water areas stimulated heavy late summer spawning by some or all fish species or improved survival rates of juvenile fish already spawned. Salinities of 38-39 g l-1 are above the physiological optimum for every one of the fish present.
Whether it was due to the tropical storms or simply to continued exponential growth of the tilapia population, fish abundance increased in the late 1970s and early 1980s. A 1978 California Department of Fish and Game publication notes “the Salton Sea remains California’s largest and per-haps best inland fishery” (Hulquist et al. 1978), even though it makes no mention of the recently exploded tilapia popula-tion. During the colder months of 1978-1979, T. Ritter and N. Niver (pers. comm.) saw big tilapia pushing on shore “like beaching whales,” and joked about walking across the Sea on their backs. SSSRA Chief Ranger T. Ritter (pers.comm.) guessed that during 1981 somewhere between five and 10 million fish, mostly tilapia, were caught at the Sea. Then SSSRA Superintendent Bob Foster (pers. comm.) recalls tilapia as being very abundant during 1982-1983. Notes for January 23, 1982 in the SSSRA daybook mention “Lots of fish beaching themselves due to colder water. They’re wish-ing it was summertime again!!” On sunny days with calm weather and especially in harbors or embayments, daytime water temperatures would be higher than in the open waters of the lake.
By coincidence the most intensive monitoring of fish popula-tions ever carried out at the Sea was initiated by the California Department of Fish and Game just when tilapia was becoming the dominant fish there, at least as indicated by catch rates. Monthly gill-net surveys were carried out between March 1979 and December 1980 (Black 1979-1980). We have estimated catch per unit effort for the four species starting in October 1979, the first date on which complete catch data were recorded (Fig. 5). Black (1979-1980) noted that starting in March 1979, tilapia were “netted in every area of the Salton Sea that we have caught fish” and that they were caught in “great [but unrecorded] numbers” in September of that year. The boom hit in October 1979 when, for the first time, total catches were recorded and 24 net-sets yielded a tilapia catch per unit effort (CPUE) of 21.6 fish per net-hour, which accounted for about two-thirds of total catch. In 1980, tilapia was caught in greater numbers than any other species every month except January, with highest catch rates—12 tilapia per net-hour—in September.
Figure 5.-Fish catch per unit effort at the Salton Sea based on monthly gill-net surveys conducted by the California Department of Fish and Game in 1979-1980.

Hurlbert, Anderson, Sturm and Hurlbert
480
The large seasonal and even month-to-month fluctuations in CPUEs were partly due to changing patterns of activity and distribution, reflecting the influence of temperature, reproduc-tive behavior, and migration to nearshore waters during the warm season (Walker 1961; Riedel et al. 2002; Caskey et al. 2007). The CPUE values also contain a fair bit of ‘noise’ as numbers, locations, and soak times of net-sets varied over time, and as total net-hours per sampling period usually had to be estimated from incomplete information.
Visitation to the SSSRA was greater during 1980 to 1983, ranging from 350,000 to 420,000 visitor-days per year, than at anytime during the preceding decade or following two decades (Redlands Institute 2002), and the majority of visitors come for fishing. Cleland (1983) quoted information from T. Ritter on how and when to fish for each of the four spe-cies and noted that, “Among fisheries in California, it has no rival. Veterans tell stories of boats overflowing with fish, of chests and trunks full of fish on the shore. And the stories are true. An average catch in the summer–the most productive season–is 50 to 100 fish per day. Even now [February], an-glers fill their buckets after a morning of work.” The SSSRA daybook for 1984 contains copious entries, many referring to ‘green tides’ and fish kills or poor fishing associated with either of these. But equally plentiful are entries recording good fishing that year. A small sampling: February 3: “the fishing is slow but they’re still catching good sized tilapia and sargo;” April 10: “the fishing has been very good – large tilapia, sargo and corvina caught from the jetty. Three people caught corvina limit [9 fish] Sunday in boats and ashore at Corvina Beach;” May 28: “croaker [bairdiella] and tilapia have been biting offshore real well;” August 21-22: “Corvina being caught at Salt Creek – lots of good-sized ones too! Also good size tilapia! …Someone caught 11 huge corvina from 12 to 19 lbs, then lined them up on the jetty and left them there to rot!”
The numerous 1984 references to sargo are consistent with its abundance in a 1983 creel census (Table 1) and its preference for nearshore waters with underwater structures (sunken buildings, jetties, bushes, trees) or beds of aquatic vegetation (Hulquist et al. 1978; Karr 1985). Sargo has much lower representation in gill net catches, e.g., those of 1982 or 1999. Such nets are usually set in deeper water—and preferably at some distance from underwater structures to avoid entanglement. Sporadic gillnet surveys conducted by different groups in 1975, 1979, 1980, and 1982 reflect the dramatic increase in total catch over this period (Fig. 6, Table 1). These surveys are not directly comparable as they differed in survey locations, number and size of nets used, and yet the gross trend is consistent with the anecdotal observations reported above.
Scant information exists on changes in fish abundance in the mid 1980s. SSSRA daybooks with notes on water condition
and fishing were not maintained after 1984. Motivated by the ultimately successful lawsuit against it, the Imperial Irriga-tion District began implementing strong water conservation measures in the late 1970s, and storm events declined in frequency and magnitude as well (Table 2). This slowed the continuing rise in lake level but initiated, in 1981, a gradual rise in salinity that continued into the early 1990s (Fig. 4). All fish species would have experienced increased stress from that salinity increase, and populations may have tended to decline. Two heavy rainstorms in August 1983 (Table 2) briefly reversed the salinity increase (Fig. 4), and may or may not have stimulated increased reproduction or survival rates in one or more of the fish species.
Although fish kills were frequent during 1984-1985 (M. Jensen, D. Imhoff, pers. comm.), that in itself was evidence only of large populations but not necessarily of declining ones. Former Salton Sea fishing guide Bill Karr recalls fishing being good to excellent for all species up until he left in 1985 (Karr, 1985 and pers. comm.). Former SSSRA Superintendent R. Foster recalls no major kills in 1986-1987 (pers. comm.).
The 60 percent decrease in visitor-days at the SSSRA from the early 1980s to 1987 (Redlands Institute 2002) might have reflected a decline in fish abundance and catch rates, but it might also have reflected avoidance of the Sea by fishermen and other visitors annoyed or perturbed by windrows of dead fish and the news stories these generated in the popular press. The decrease in visitors took place before the issuance in May 1986 of an advisory by the California Department of Health stating that persons should not consume more than 4 ounces (114 g) of Salton Sea fish every two weeks because of its high selenium levels. Thus the decrease cannot be blamed on that advisory.
Figure 6.-Total fish catch per unit effort and estimated piscivorous bird biomass in December. Fish data from Table 1 and bird biomass based on Christmas Bird Count data and mean species masses given in Appendix 3. Dotted lines are rough fits by eye (see text).

Fish and fish-eating birds at the Salton Sea: a century of boom and bust
481
Crash of the late 1980s (1987-1993)Fish populations crashed in the late 1980s probably in response to the conjunction of two environmental factors: continued increase in salinity to levels higher than had oc-curred since the 1930s, and a series of very cold winters (Fig. 4). These factors operated both by stressing each species physiologically and, for the larger species, by way of food web sequelae of the especially large decline of tilapia, the least cold tolerant species (Sardella et al. 2004b). Salinity rose from about 40 g l-1 to 43 g l-1 between 1986 and 1991. Mean January air temperature was < 12 °C during 1987-1990 whereas it was 13-15 °C during most of the preceding decade. In December and/or January in each of those cold winters, there were periods when the daily minimum air temperature dropped below freezing for several days in a row.
Though many observers recall the crash of the Salton Sea fishery in the late 1980s, documentation of its early stages is sparse. In November 1988 outdoor writer R. Williams (1988) recorded, “Salton Sea catches slumped close to zero. Only the occasional 1- to 2-pound corvina were caught, and the air temperature, carried on a wind, slid to 36 [°F]. The low temperatures threaten a rebuilding tilapia population there. Tilapia are barely recovering from 12 successive days of 23-degree [–5 °C] weather last winter. When the water edges under 54 degrees [12 °C] for a week or so, tilapia die.” In April 1989, it was noted that “tilapia failed to regenerate in anticipated numbers after a massive die-off that occurred during a cold snap in December. …Then in January, un-precedented swarms of insects called water boatmen fled the sea’s brackish [sic] waters, took wing and descended on homes and vehicles for miles around” (Sahagun 1989). Abundance of such favored fish prey as these water boatmen is one of the surest signs of a very low fish stock. In July 1989 it was reported that, “a series of unusual biological events has given denizens of the inland sea an alarming taste of what an environmental collapse here might be like. First there was the tilapia. As often happens, water temperatures dipped below 50 degrees [10 °C] over the last two winters, killing thousands of the small game fish. This year, though, the usually prolific fish failed to bounce back. So far, they have not reappeared in their usual teeming numbers in the warm waters of the agricultural drains, where they raise their young” (LaRue 1989). In February 1991, Williams (1991) wrote, “These are hard times for the Salton Sea. This storied saltwater fishing lake…has won recognition as the best fish-ing hole in the West. Now it is in crisis. …The tilapia…, the Gulf croaker [bairdiella] and the Orangemouth corvina…are not recovering from the seasonal cold and salty water, as they have in the past.”
Changes in abundance of corvina, sargo, and bairdiella during 1987-1992 are more difficult to assess from the anecdotal information available. Number of visitor-days at the SSSRA declined to the lowest levels since the early 1950s (Redlands
Institute 2002, pp. 32-33). Former SSSRA Superintendent S. Horvitz recalls that fishing for all species was poor during his first years (1991-1994) at the Sea. But the Sea was also, and not for the first time, the victim of some unwarrantedly negative press in 1986, and that likely reduced visitation. Negative press was generated by the selenium advisory re-ferred to earlier and by a television report. Williams (1991) noted that, “Fishermen have lost interest in the sea, mainly because of Department of Health Services warnings that advise that no more than four ounces of Salton Sea fish can be eaten safely every four weeks. Primarily, children and pregnant women are warned, but adults are scared off, too. …Selenium is the bugaboo, and the argument still rages about how dire and deadly this non-metallic element is…” Ironically, recent reevaluations show selenium levels in fish to pose negligible risk to human consumers of Salton Sea fish (Moreau et al. 2007).
Then in 1986 the CBS television program Sixty Minutes presented a special report on one of the two major inflows to the Salton Sea, the New River, titled “America’s Dirtiest River.” It accurately portrayed this river, at the point where it crosses the U.S.-Mexico border, as a sewer full of patho-gens, industrial pollutants, and untreated human wastes. It also left the impression that the Salton Sea was in a similar condition, whereas in fact there is no indication that the Salton Sea waters are unhealthy for any human activities. Natural biogeochemical processes operating in the New River over its 70 km run from the U.S.-Mexico border to the Salton Sea, and in the Sea itself, apparently function as efficient purifiers.
Information on abundances of eggs and larvae of corvina, sargo, and bairdiella during 1987-1989 was obtained by Matsui et al. (1991) who made ichthyoplankton tows at 21 stations in the Sea once or twice a month over this three-year period. This massive data set was never fully analyzed, but annual means for three larval stages suggest that each species responded differently to environmental change during this period (Fig. 7). Between 1987 and 1989, abundance of late eggs decreased greatly for bairdiella and corvina, but not for sargo. This might indicate a decrease in per female egg production by corvina and bairdiella populations over this period, or simply decreases in their populations. In contrast, mean abundance of late larval stages decreased tremendously for sargo and slightly for corvina over this period, while increasing moderately for bairdiella. If we take the ratio of late larvae to late eggs as an index of survival rate between the two stages, then we would conclude that survival in 1989, as compared with 1987, was much better for bairdiella, much worse for sargo, and about the same for corvina.
These late larval data suggest that at least the sargo and corvina populations were heading downhill fast by 1988, and that is consistent with the poor overall fishery that con-

Hurlbert, Anderson, Sturm and Hurlbert
482
tinued into the early 1990s. What might have been causes? Low winter water temperatures are unlikely to have affected these three marine species as they did tilapia. Salinity did increase abruptly during this period, but by 1989 it was no higher than it was during the booming tilapia, bairdiella and corvina fisheries of the late 1990s. The crash of the corvina population is most reasonably attributed simply to the crash of the tilapia population, which probably had become the major item in its diet. Creel census data suggest that tila-pia was the dominant fish in the Sea in 1983 (Table 1); its population biomass may have exceeded that of all the other fish species present. Complex food web relations make it difficult to assess other causal mechanisms that may have operated. Juveniles of all four species and adults of all but corvina compete with each other for food. They all can prey on each other and also likely engage in cannibalism to some extent. In the 1950s, for example, Quast (1961) found that of bairdiella < 30 mm in length (n=69), 25 percent contained bairdiella eggs and 13 percent contained bairdiella larvae. Tilapia would seem very likely to feed on ichthyoplankton, and the greatly improved survival of bairdiella in 1988-1989 to the late larval stage might have resulted from the demise of the tilapia population prior to that time (Fig. 7).
Increased raiding of fish farms in the Salton Sea region in 1989 by fish-eating birds was one dramatic consequence of the collapsed fishery. SSNWR wildlife biologist Bill Henry suggested that absence of juvenile tilapia, as a result of heavy mortality of adults during preceding cold winters, was responsible both for lack of nesting of cormorants and Great Blue Herons at the SSNWR that year and for “an unusual at-tack of pelicans and cormorants on a state-run fish hatchery, where they flew off with catfish weighing up to five pounds [sic]” (LaRue 1989). This was the California Department of Fish and Game State Warm Water Fish Hatchery just north of Niland. Located on the eastern shore of the Sea this had supplied catfish to recreational fisheries at lakes and reser-voirs throughout southern California since 1970. The bird raids, along with other economic considerations, caused the state to close it in the fall of 1990. Hatchery manager Wayne Parker recounted, “The birds have run out of food on the Salton Sea so they started to come here. We had 27,000 fish in one pond, and when we drained the pond there was not one fish left. The cormorants would dive in and then the pelicans would eat [the fish as they came to the surface]” (Borders 1990).
At a commercial catfish operation, Valley Fish Farms in Brawley, 30 km southeast of the Sea, “birds devoured about 300,000 fish [in 1989], nearly forcing the company out of business” (Polakovic 1993). In the same year, operators of another fish farm, Fish Producers of California, in Niland, trying to stem bird-related losses of about $30,000 a year, “illegally shot 225 fish-eating birds, including Brown Peli-
cans, an endangered species,” were caught and paid $42,000 in penalties (Polakovic 1993).
Even when not exacerbated by the collapse of a major re-gional lake fishery, raiding of fish farms by fish-eating birds is a serious problem, and “fish farmers who never engage in illegal bird control appear to be about as common as truckers who never speed” (Williams 1992). The heavy hand of the law coming down on Fish Producers, however, stimulated fish farmers in the Salton Sea region to start requesting “dep-redation permits” from the U.S. Fish and Wildlife Service that allow them to kill specified numbers of particular fish-eating bird species legally. Between 1987 and January 1993, authorization was given for killing of 3,287 birds in the region under such permits (Polakovic 1993). The number actually reported killed during 1986-2003 was 6,199, excluding gulls, with only 2-4 fish farmers reporting having killed any birds in any given year (Appendix 2).
Strong recovery in the 1990s (1994-2000)The latter part of the 1990s saw some of the best fishing ever seen at the Salton Sea, and this seemed related to heavy winter rainstorms in January 1993 and 1995 (Table 2). N. Niver (pers. comm.) recalls that subsequent to the rainstorms of 1993, water boatmen disappeared from the Sea and the corvina fishery improved. S. Horvitz (pers.comm.) does not
Figure 7.-Larval fish abundance and salinity (total dissolved solids) at the Salton Sea during 1987-1989. Each TDS value is the mean for 20 stations distributed around the periphery of the lake. Each value for larval abundance represents the mean abundance for day and night tows at 21 stations sampled monthly (1987) or twice monthly (1988, 1989). Both early and late larvae are included. Tows were ca. 100 m in length; net diameter not specified, but if one assumes it to have been ca. 0.3 m and assuming 100 percent net efficiency, the volume of water filtered per tow would have been about 7000 liters. Data from Table 2 and Figure 26 in Matsui (1991).
Fish and fish-eating birds at the Salton Sea: a century of boom and bust
483
recollect seeing anyone catching large numbers of tilapia until 1996. One of us (SH) observed small tilapia adults to be abundant in the Sea at the time we began monitoring of plankton and water quality at the Sea in late 1996 and early 1997 (e.g., Watts et al. 2001; Tiffany et al. 2002).
It is unclear to what extent the fish populations may have responded to the 1993 storms. However, the 1995 year class of tilapia was either exceptionally large or showed unusually high survival over its first year, or both (Riedel et al. 2002; Caskey et al. 2007). These were the fish that we observed in 1996-1998 and that completely dominated catches during 1999-2000 gill net surveys of the Sea. There was no or almost no successful recruitment of the 1996, 1997, 1998, or 1999 tilapia year classes. The other fish species in the 1999-2000 collections were represented by almost no individuals from their 1995 year classes, perhaps with the exception of corvina, but by substantial numbers from their 1996-1998 year classes (Riedel et al. 2002). These other species seemed less suscep-tible to high year-to-year fluctuations in recruitment, at least in the 1990s. The highly sporadic recruitment of tilapia year classes seems the major factor driving the large variations in fish biomass in the Sea witnessed in recent decades.
Absolute abundances of the species in 1999-2000 were re-flected in values for catch per unit effort. These varied mark-edly from season to season and from one habitat to another. Highest means were 12 kg net-1 h-1 for tilapia (spring, near rivermouths), 5 kg net-1 h-1 for corvina (winter, other near-shore areas), and 1.6 kg net-1 h-1 for bairdiella (spring, other nearshore areas) (Riedel et al. 2002; Caskey et al. 2007). Corvina fishing was excellent during this period, with many
fish in the 6-8 kg size range being caught. Tilapia, often weighing > 1 kg, were easy to catch with hook and line.
Though tremendously successful from the point of view of recreational fishing, the Salton Sea fishery of the late 1990s was always on the edge. Salinity was creeping upward again (Fig. 4), most years tilapia was failing to produce a successful new cohort, and periodic massive fish die-offs (Table 3) foreshadowed leaner days to come. Moreover, if heavy rainstorms, by mechanisms still unclear, stimulate the fishery overall, the effect of the storms of 1976, 1977, and 1978 may have been greater than those of 1993 and 1995. We thus have guessed that in the late 1990s Salton Sea fish standing stock peaked at lower levels than it did in the late 1970s and early 1980s (Fig. 1).
Millenium crash (2001-2004)A major decline in fish populations occurred between 2000 and 2002, when mean catch per unit effort at four reference gill netting stations in the Sea dropped by 99.6 percent for tilapia and by 96.3 percent for bairdiella (Figs. 6 and 8). Mean CPUE for corvina actually doubled but numbers caught both years were few, and variability among stations precluded any firm conclusion as to the nature of a trend (Caskey et al. 2007).
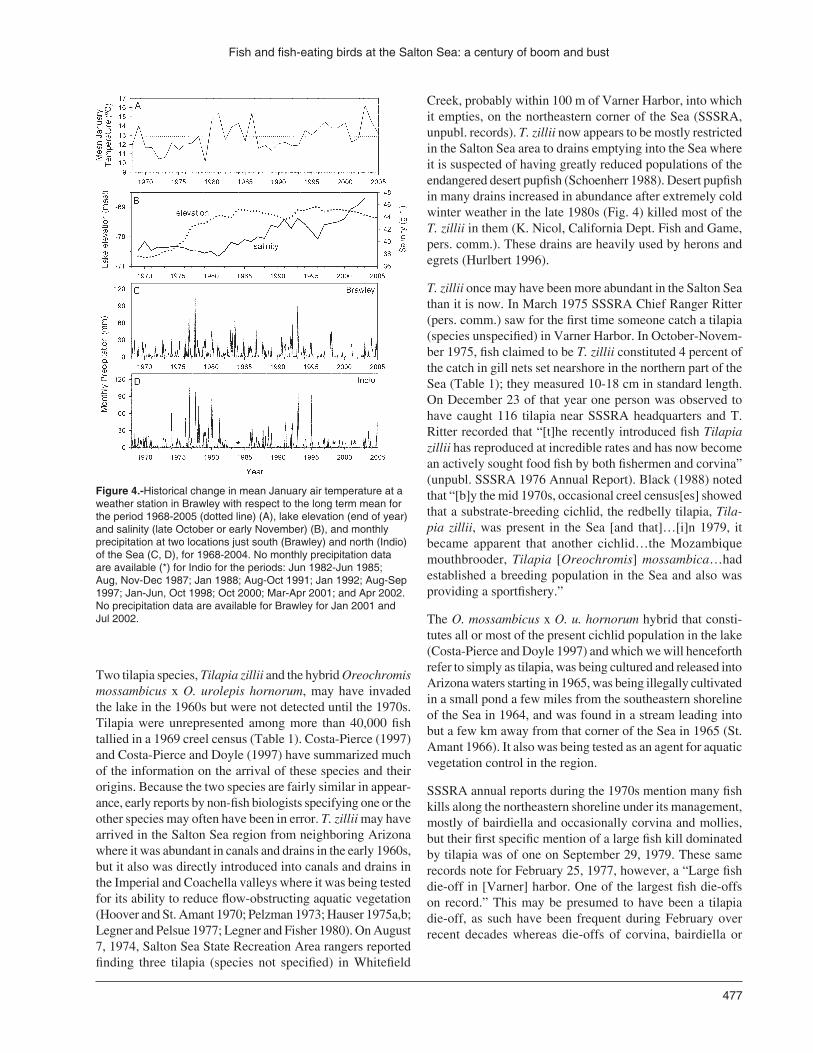
Systematic monitoring of fish kills initiated by the Salton Sea Authority in 2000 suggested the major decrease took place between 2001 and 2002. Total numbers observed in fish kills dropped from about 21,000,000 in 2001, to 333,000 in 2002, to 12,000 in 2003 (Table 3). Percentage decline in total kills from 2001 to 2002 was 98 percent, similar to the 2000-2002
Table 3.-Fish kills monitored by Salton Sea National Wildlife Refuge (1997-1999) and Salton Sea Authority (2000-2004)a.
Number of fish Number Percentage of total kill Year kill events of fish Corvina Sargo Bairdiella Tilapia
1997 > 10 > 2,160,000 + 0? 20? 80?
1998 > 10 > 2,000,000 + 0? 1? 99?
1999b > 3 > 10,000,000 + 0? 2? 98?
2000 17 14,242,500 0.009 0 2.2 97.8
2001 15 21,028,230 0.12 0.15 57 43
2002 8 333,060 0.65 0 77 22
2003 2 11,612 5.2 0 94 0.10
2004 4 10,295,000 0 0 0 100
a Estimates for 1997-1999 were based on more sporadic, less intensive monitoring efforts than those for 2000-2004, so the two sets of numbers are not directly comparable.
b Biggest kill in 1999 occurred on August 4 and was estimated by one of us (KS) at 7.6 million tilapia, as reported in Marcum (1999). An aerial survey of birds at the Salton Sea on February 19, 1999 discovered a very large die-off of tilapia with “thousands and thousands” floating on the surface of the Sea, often in drift lines and large mats, especially at the north end and all along the western shoreline (D. Shuford, Point Reyes Bird Observatory, in letter to Salton Sea researchers, February 22, 1999); such a description might suggest the kill involved at least 2 million fish.

Hurlbert, Anderson, Sturm and Hurlbert
484
decline in gill net CPUE. So we believe the decline in size of fish die-offs reflects primarily the decline in fish stocks. No monitoring of water quality at the lake was carried out during 2000-2003, but we have no reason to believe that this decline in size of fish die-offs was a result of decreased frequency or magnitude of the mixing events and associated anoxia and high sulfide levels that cause most of these die-offs. Indeed, as estimated from satellite imagery, the frequency and intensity of sulfide events were much greater in 2003 than in 2000, 2001, or 2002 (Tiffany et al. 2007b). There was a winter kill of about 2,750,000 tilapia at the north end of the Sea between mid-January and mid-February in 2000, but otherwise fish kills during 2000-2003 were restricted to the warmer months (Salton Sea Authority, unpubl. records). These mass mortality events combined with consistent post-1995 failure of the tilapia population to produce successful new year classes resulted in the ‘millenium crash.’
Although studies of sulfur biogeochemistry in the Sea are just beginning, these sulfide events and the tremendous mortality they periodically cause to plankton, benthos and fish have been discussed in several papers (Watts et al. 2001; Tiffany et al. 2002, 2007a,b; Anderson et al. 2007; Caskey et al. 2007; Dexter et al. 2007). Briefly, whenever this eutrophic polymictic lake becomes stratified, organic matter decom-position and sulfate reduction create anoxic conditions and very high sulfide levels in bottom waters. When a subsequent wind event causes strong upwelling or mixing of the water column, even the surface waters can become strongly hypoxic and have toxic levels of sulfide that persist for days.
More recent gillnet surveys suggest that corvina and bairdi-ella populations are still at extremely low numbers, and sargo has not been caught since 2002 (J. Crayon, pers. comm.). Tilapia appear to have rebounded slightly in 2003 and 2004, although numbers still represent a 90% reduction in catch per unit effort from 1999. The rebound in tilapia populations is also reflected in the size of a fish kill event in July 2004, the largest such mortality event since 2001 (Table 3). Based on the average size (13 cm), these fish were likely from the 2003 year class.
In sum, based on the all of the available evidence that we have presented, we believe that Figs. 1 and 6 are good ap-proximations of the changes in fish standing stock over time at the Salton Sea. For the purposes of relating these to bird populations, the most salient features are the dramatic increase in fish biomass throughout the 1970s after the in-troduction of tilapia, the population crash of the late 1980s, recovery in the mid-1990s, and another major crash in the early 2000s. We have discussed the ways in which salinity, sulfide levels, winter temperatures and major rainfall events may have influenced fish populations. We now summarize some information on the feeding ecology and seasonal oc-
currence of fish-eating birds at the Sea as background for interpreting historical changes in their numbers.
Ecology of fish-eating birds at the Salton SeaDiet and foraging ecologyPiscivorous bird species may be classified by their foraging technique and preferred foraging habitat, as well as by the size of prey that they typically take. By classifying species in this way, we can more clearly see which groups would be expected to respond in similar ways to changes in the avail-ability of habitat or prey size classes.
The four piscivorous herons are largely sit-and-wait preda-tors, although they may actively pursue prey to varying degrees. They typically forage around the three main river deltas, along agricultural drains, within the freshwater wild-life-management areas (e.g., Ramer Lake, Wister Unit), and along the lake’s shoreline (Patten et al. 2003). The other species forage over open water: Ospreys, Brown Pelicans and Caspian Terns dive from the air to catch prey near the surface; American White Pelicans typically scoop up prey while floating on the surface; and Double-crested Cormorants dive and pursue prey underwater.
While no diet studies on these species have been carried out at the Salton Sea, we may make inferences on preferred prey size based on studies conducted elsewhere. Ospreys likely catch the largest fish of all other bird species at the Sea. They have been known to take prey over 1 kg, although one to several hundred grams (25 – 35 cm in length) is more typical, and smaller prey may also be taken (Poole et al.
Figure 8.-Catch per unit effort for late summer gill net sampling at the Salton Sea, 1999-2002. Values plotted are geometric means of CPUE for 4 nearshore sampling stations. Adapted from Figure 7 in Caskey et al. (2006).

Fish and fish-eating birds at the Salton Sea: a century of boom and bust
485
2002). Based on fish size data collected at the Salton Sea in 1999 and 2000 (Riedel et al. 2002, 2007), Ospreys are thus capable of preying on adult tilapia, bairdiella, and sargo, as well as young-of-year orangemouth corvina (Table 4). Body shape, of course, also determines the size of fish that can be eaten (Riedel et al. 2007). A 20-30 cm long tilapia, for example, weighs 5-6 times more than does a corvina of the same length.
A maximum prey size of ~30 cm has been documented for American White Pelicans (Evans and Knopf 1993), Brown Pelicans (Shields 2002), Double-crested Cormorants (Hatch and Weseloh 1999), and Great Blue Herons (Butler 1992). However, prey < 15 cm make up the majority of the diet for all of these species, as well as for Caspian Terns (Cuthbert and Wires 1999). Available prey then should primarily be made up of first and second year tilapia, bairdiella and sargo (Table 4).
A study of Great Egret diets in California found that 84% of fish captured were < 5 cm in length, with only 2% > 10 cm (Schlorff 1978). The most important prey of birds sampled in New Jersey ranged from 6 – 10 cm (Recher and Recher 1980). Black-crowned Night Herons have been reported to take many fish and non-fish prey (Davis 1993), and have been observed to concentrate opportunistically on tilapia and trout species reared in pisciculture operations and weighing up to 90 g (Spanier 1980). Snowy Egrets are the smallest of the piscivorous birds we treat here, and diet studies have found mean prey size to range from < 1 to 3 cm in length (Parsons and Master 2000). At the Salton Sea, these smaller ardeid species are most likely to forage on first year tilapia, mollies, and especially in the case of the Snowy Egret, newly hatched fry, which often congregate in shallow areas along the shoreline.
Seasonal use of the Salton SeaSalton Sea piscivorous birds can be divided into three broad categories on the basis of their seasonal occurrence. The first group includes species that are present in large numbers year round and are known to breed there, although some indi-viduals may migrate into the area to winter or may leave the area before or after breeding. This group includes the four ardeid species and the Double-crested Cormorant (Patten et al. 2003). Ospreys are also present at the Sea throughout the year, but they have not been observed to breed there (Patten et al. 2003).
The second group includes breeding season migrants. Cas-pian Terns, along with Black Skimmers and Gull-billed Terns, come to the Salton Sea in the spring to breed, and large numbers of non-breeders may accumulate during the summer months as well (Small 1994, Shuford et al. 2002). Only small numbers of Caspian Terns remain at the Sea throughout the winter (Small 1994). A handful of Brown Pelicans success-fully nested at the Sea for the first time in 1996 (Sturm 1998) and bred there irregularly in subsequent years. However, the majority of Brown Pelicans come to the Salton Sea during post-breeding dispersal in July and August from nesting sites in the Gulf of California (Small 1994; Shields 2002). Again, only a small fraction of these post-breeding visitors remain throughout the winter.
Finally, the American White Pelican primarily uses the Salton Sea as a wintering area. While several hundred birds may be observed at other times of year, during the winter months as much as 30% of the entire North American breeding popula-tion migrates into the area and numbers may reach 30,000 or more (Shuford et al. 2002).
Historical changes in bird populationsThe first half centuryObservations by Grinnell (1908) indicate that almost immedi-ately after the Salton Sea’s formation, it was used by nesting American White Pelicans, Double-crested Cormorants, and Great Blue Herons, as well as non-breeding Caspian Terns. Van Rossem (1911) noted Black-crowned Night Herons as “fairly common,” and observed a single Osprey on several occasions. Pemberton (1927) documented Gull-billed and Caspian Tern colonies on small islands in the Sea. He specu-lated that the colonies might have first appeared as early as 1921. In April 1940, the Caspian Tern colony was reported to be only five or six nesting pairs (Abbott 1940). At the same time, hundreds of Gull-Billed Terns were reported foraging over agricultural fields nearby (Abbott 1940).
Table 4.-Sizes of fish, by species and age class, at the Salton Sea. Data from Caskey et al. (2006; tilapia) and Riedel et al. (2002; other species). Two other occasionally abundant species, mosquito fish and sailfin mollies, have maximum lengths of 5-6 cm.
Total length (cm) Mean (standard deviation) Age Orangemouth Class Tilapia Bairdiella Sargo corvina
0+ 11.3 (2.8) 13.0 (2.2) 15.6 (1.5) 28.4 (8.0)
1+ 22.7a 18.6 (2.0) 18.5 (0.4) 46.1 (11.6)
2+ 28.4 (2.9) 21.2 (2.0) 27.5 (1.4) 65.9 (6.0)
3+ 28.7(1.9) 22.4 (2.3) - 69.6 (4.9)
4+ 30.2 (2.6) 28.5 (5.3) - -
5+ 32.0 (2.9) - - -
a Estimated from values for other age classes, using the von Bertalanffy growth function.

Hurlbert, Anderson, Sturm and Hurlbert
486
Both Great and Snowy Egret numbers were exceedingly low during the early 1900s as a result of persecution by the feather trade (Grinnell and Miller 1944). Numbers began rebounding in California during the 1910s, and by 1930 Willett (1933) observed Great Egrets to be common and possibly breeding at the Salton Sea. Snowy Egrets had not been documented at the Sea as of 1944, although they had been seen in the nearby Colorado River valley (Grinnell and Miller 1944). By the mid-1950s, however, they were finally recorded in sizeable numbers on Christmas Bird Counts at the Sea’s southern end (Fig. 9).
The number of nests of breeding piscivorous birds declined until the late 1950s (Remsen 1978, cited in Shuford et al.
1999). This may have been due in part to the loss of suitable islands for nesting as the surface elevation of the Sea rose. American White Pelicans last attempted to nest at the Salton Sea in 1956 and 1957, and in both years were unsuccessful (Lies and Behle 1966). Caspian Terns also ceased nesting during this period. Nevertheless, non-breeding adults of the four piscivorous ardeid species, American White Pelican, and Double-crested Cormorant were regularly observed winter residents at the southern end of the Sea from 1955 to 1957 (Fig. 9).
During this first half century, the availability of fish was surely as strong an influence on piscivorous bird populations as it seems to have been in recent decades. We might have
Figure 9.-Annual Christmas Bird Counts from Salton Sea South and Salton Sea North for nine species of piscivorous birds. Data for 1955-1957 are not directly comparable to data from other years (see text). Abbreviations as follows: AWPE – American White Pelican; BCNH – Black-crowned Night Heron; BRPE – Brown Pelican; CATE – Caspian Tern; DCCO – Double-crested Cormorant; GBHE – Great Blue Heron; GREG – Great Egret; OSPR – Osprey; SNEG – Snowy Egret.

Fish and fish-eating birds at the Salton Sea: a century of boom and bust
487
expected great numbers of fish-eating birds during the peak of the freshwater fish assemblage during the first decade after formation of the Sea and very low numbers of such birds during the 1930s and 1940s when salinity peaked at close to 50 g l-1 and stocking with marine species had not begun in earnest (Fig. 1). Rapid changes in species composition during these early decades, together with large year-to-year fluctuations in reproductive success and mortality and, hence, in size and age structure of the individual fish populations, probably created equally abrupt and dynamic changes in the piscivorous bird assemblage at the Sea.
Rebound from organochlorine insecticide poisoningChristmas Bird Counts indicate that dramatic changes oc-curred at the Salton Sea during the 1950s, 1960s, and 1970s, and one of these may have been the recovery of many fisheat-ers from organochlorine insecticides. Extensive use of these in the Imperial and Coachella valleys, as elsewhere, began following World War II. DDT was banned in the U.S. in 1972, and within a few years dieldrin, aldrin, and most of the other organochlorine insecticides very harmful to wildlife were banned as well (Peterle 1991).
Censuses in 1955-57 consistently recorded pelicans, cor-morants and the four piscivorous ardeids in the southern count circle (Fig. 9). In 1965 no pelicans or cormorants were noted in either circle, and the other piscivorous birds were present only in low numbers. During the 1970s, piscivorous bird numbers increased dramatically by two to four orders of magnitude (Figs. 9 and 11). This increase began at the south end starting around 1970, and at the north end starting several years later. The four ardeid species were the first to increase, and being year round residents in the region, they would be expected to respond most rapidly to changes in resource availability or other local conditions. Cormorant and American White Pelican counts increased over this period from zero or a few individuals to several thousand. Starting in the late 1970s, Caspian Terns and Ospreys became regu-lar winter visitors to the Salton Sea after only rarely having been observed there in the previous decade. Brown Pelicans, typically only summer visitors to the Sea, were not recorded on CBCs until 1986 and 1990 at the southern and northern ends, respectively, but were regularly recorded thereafter. Because these migratory species were not regularly using the Salton Sea in the 1960s and early 1970s, they apparently lagged behind the resident ardeid species by a few years in discovering the Sea as a suitable seasonal destination.
In contrast to the dramatic increase in piscivores during the 1970s, the numbers of non-piscivorous bird species occurring on or near the Salton Sea showed fluctuations in abundance but with little evidence of an increasing trend (Figs. 10 and 11). These species, feeding lower on the food chain, would
have been exposed to lower concentrations of organochlorine residues than the piscivores. One exception was the Cattle Egret, which at the southern end increased dramatically in number in 1970 and at the northern end shows a more gradual increase throughout the 1970s. The Cattle Egret has undergone a dramatic range expansion since its initial colo-nization of North America in the 1950s (Telfair 1994). Cattle Egrets were first observed in California in 1962 and the first recorded breeding in California was in 1970 (Telfair 1994), thus the increase in their numbers may mostly reflect their range expansion, as the growing Cattle Egret range first met the edge of the Salton Sea and later enveloped it. In the Salton Sea region, however, Cattle Egrets do most of their feeding in agricultural fields. Prior to the 1970s their invertebrate prey likely had higher levels of organochlorine insecticides than did the aquatic invertebrates used by invertebrate-eating waterbirds, and Cattle Egrets may have experienced corre-spondingly greater reproductive impairment.
A second exception was the Northern Harrier, which showed roughly a doubling in numbers during the 1970s and almost another doubling since then (Figs. 10 and 11). This bird feeds high on the food chain, seeking its prey (mostly small vertebrates) in the drainage canals, agricultural fields, and riparian habitats into which agricultural wastewaters of the region empty.
North American Breeding Bird Survey (BBS) data show a difference between piscivorous and non-piscivorous species across western North America that parallels that found at the Salton Sea during the 1970s and early 1980s (Fig. 12). For most piscivorous species the average number of birds observed per survey route increased steadily by one half to one order of magnitude from 1968 to 2002. Numbers of Snowy Egrets increased only slightly and numbers of Great Blue Herons remained fairly constant over this period. Non-piscivorous species, with the exception of the Eared Grebe and Cattle Egret, have not shown upward trends in abundance over the last thirty years (Fig. 12). The range expansion of the Cattle Egret we have already commented on. For the Eared Grebe, some authors have suggested that mean trends based on BBS data are more likely to indicate shifts in range than changes in abundance because of the highly clumped nature of grebe distributions and the small fraction of BBS locations that sample grebe habitat (Cullen et al. 1999; Anderson et al. 2007).
The increase in abundance of fish-eating birds throughout western North America is likely due in large part to the decline in use of organochlorine insecticides. Piscivorous birds, generally occupying a higher trophic level than non-piscivores, are exposed to greater concentrations of pesticides through bioaccumulation, and are thus more sen-sitive to the presence of pesticides in the environment. The decline of many species of fish-eating and raptorial birds

Hurlbert, Anderson, Sturm and Hurlbert
488
Figure 10.-Annual Christmas Bird Counts from Salton Sea South and Salton Sea North for seven species of non-piscivorous birds. Data from 1955-1957 are not directly comparable to data from other years (see text). Abbreviations as follows: AMAV – American Avocet; AMCO – American Coot; CAEG – Cattle Egret; EAGR – Eared Grebe; LESC – Lesser Scaup; NOHA – Northern Harrier; RUDU – Ruddy Duck.

Fish and fish-eating birds at the Salton Sea: a century of boom and bust
489
Figure 11.-Smoothed CBC abundance trends for the 16 bird species under study. Each time series in Figs. 9 and 10 was smoothed by calculating three-point moving averages. Yearly geometric means of the resultant values for North and South census circles are shown here. Means for some years could not be calculated due to missing counts. Abbreviations as in Figures 9 and 10.

Hurlbert, Anderson, Sturm and Hurlbert
490
through the 1950s and 1960s has been attributed to DDT and other organochlorine insecticides, which may cause eggshell thinning or direct mortality (Keith 1966; Peterle 1991). Strong evidence exists for the impact of insecticides on the reproductive success of Brown Pelicans (Anderson and Anderson 1976; Blus 1982), Double-crested Cormorants (Weseloh et al. 1983) and Ospreys (Wiemeyer et al. 1988), and evidence is suggestive for such effects on the four ardeid species considered here (Custer 2000). Population recovery from the effects of these pesticides during the late 1970s and through the 1980s has been documented for many different waterbird species including Brown Pelicans (Shields 2002), Double-crested Cormorants (Carter et al. 1995) and Ospreys (Poole 1989) in various lakes and wetland areas throughout North America.
Responses to fish population dynamicsWhile rebound from pesticide poisoning by the regional and continent-wide populations of piscivorous birds may account for some of the upward trends of numbers at the Salton Sea, local and species-specific factors must account for most of the complex, boom and bust patterns shown at this lake (Figs. 9 and 11). For example, during the 1970s and early 1980s, these species showed in the western U.S. increases of less than 3-fold yet at the Salton Sea they showed 10- to 1000-fold increases. The regional trends also do not show large population crashes and recoveries like those seen at the Salton Sea.
There have been two clear periods of increase and decline in piscivorous birds over the past thirty-five years (Figs. 6 and 11). The first period of increase in the late 1970s and early 1980s was most prominent in the four piscivorous ardeid species, all of which reached all-time high numbers between 1979 and 1982. Snowy Egret and Black-crowned Night Heron numbers began to decline around 1980, while the two larger ardeids continued to increase into the early 1980s. Wintering numbers of all nine piscivorous species declined during the mid to late 1980s, reaching lows between 1990 and 1992.
The second period of increase began in the early 1990s, and was most dramatic for the species that prey on larger fish in open water (Fig. 11). Ospreys, American White Pelicans, Brown Pelicans, Double-crested Cormorants and Caspian Terns all reached unprecedented winter numbers in the mid to late 1990s. The two large ardeids also increased substantially but did not surpass peak numbers from the 1980s, while the two smaller ardeid species showed only minor increases dur-ing this period. Presumably the increase of herons and egrets in the 1970s and early 1980s reflects many consecutive years of successful fish reproduction, and thus a fairly consistent supply of small juvenile forage fish during that period. In contrast, fish availability during the recovery in the late 1990s
Figure 12.-Average number of piscivorous birds (A, B) and non-piscivorous birds (C, D) per survey route in the Western BBS region (west of and including the Rocky Mountains) from North American Breeding Bird Survey data. For information on the calculation of these weighted averages, see Sauer et al. (2004). Abbreviations as in Figures 9 and 10.
was made up primarily by the 1995 tilapia cohort (Caskey et al. 2007). After one year, these fish had grown in size enough to largely escape predation by these smaller piscivores, and thus ardeid numbers did not increase as much or for as long as the larger fish-eating bird species.
During 1999-2002, and perhaps during much of the 1990s, bairdiella was as abundant or more abundant than tilapia, as far as can be assessed from gillnet catches (Table 1). Bairdi-ella feeds primarily on the pileworm and lives deeper while tilapia feeds primarily on plankton and is more abundant in shallow or surface waters. This would make the latter more available to piscivorous birds. In 1990-2000, CPUEs for tilapia were about three times higher in surface set gillnets than in bottom set gillnets, while CPUEs for bairdiella were more than 50 percent lower in surface set gill nets than in bottom set gill nets (Fig. 3 in Riedel et al. 2002).
The decline of piscivorous birds in the late 1980s and early 1990s and their subsequent recovery in the late 1990s is reflected independently by colonial nesting bird surveys con-ducted by the Salton Sea National Wildlife Refuge (Table 5). While sampling effort varied between years, especially prior to 1991, the number of nests clearly reached a minimum in the early 1990s. The increase in the number of nesting birds lagged several years behind the increase in winter numbers, but was equally impressive. In 1996, the total number of nests of piscivorous birds increased four-fold over the year before, and Brown Pelicans nested at the Sea for the first time ever. Double-crested Cormorants began nesting exten-sively on Mullet Island, forming one of the largest breeding colonies in the western U.S. (Carter et al. 1995, Shuford et al. 2002). The number of breeding pairs of Caspian and

Fish and fish-eating birds at the Salton Sea: a century of boom and bust
491
Tabl
e 5.
-Num
ber o
f nes
ts o
f col
onia
l nes
ting
bird
s ob
serv
ed a
t the
Sal
ton
Sea
by
Sal
ton
Sea
Nat
iona
l Wild
life
Ref
uge
pers
onne
l. nd
= n
o da
ta a
vaila
ble.
Are
as a
nd S
peci
es
1987
19
88
1989
19
90
1991
19
92
1993
19
94
1995
19
96
1997
19
98
1999
4
Tra
diti
onal
Cen
sus
Are
as1
Cat
tle E
gret
13
73
850
98
0 0
0 0
0 0
100
2500
25
00
G
reat
Blu
e H
eron
24
6 20
8 0
15
11
15
12
17
17
6 12
1 74
Bla
ck-c
row
ned
Nig
ht H
eron
nd
nd
nd
nd
0
0 0
0 0
40
400
230
G
reat
Egr
et
85
8 53
4
36
36
11
16
1 5
250
74
Sn
owy
Egr
et
9 3
80
0 0
0 0
0 0
24
50
100
D
oubl
e-cr
este
d C
orm
oran
t 63
57
0
0 0
0 0
0 0
150
6006
5006
B
row
n Pe
lican
0
0 0
0 0
0 0
0 0
0 3
0
Tot
al n
ests
(ex
clud
ing
Cat
tle E
gret
) 40
3 27
6 13
3 19
47
51
23
33
18
22
5 14
24
978
Tra
diti
onal
+ N
ewer
Are
as2
Cat
tle E
gret
nd
nd
nd
nd
12
5 55
35
0
0 12
0 25
06
3646
66
60
Gre
at B
lue
Her
on
nd
nd
nd
nd
61
90
54
30
131
115
202
367
888
Bla
ck-c
row
ned
Nig
ht H
eron
nd
nd
nd
nd
20
0 11
7 12
1 10
0
83
448
280
102
Gre
at E
gret
nd
nd
nd
nd
37
1 20
9 17
0 49
0 27
9 96
0 43
9 18
5 16
5 Sn
owy
Egr
et
nd
nd
nd
nd
135
198
456
300
250
494
80
309
170
Dou
ble-
cres
ted
Cor
mor
ant
nd
nd
nd
nd
0 0
0 0
56
758
2577
6 32
776
5425
B
row
n Pe
lican
nd
nd
nd
nd
0
0 0
0 0
3 5
05 0
Tot
al n
ests
(ex
clud
ing
Cat
tle E
gret
) nd
nd
nd
nd
76
7 61
4 80
1 83
0 71
6 24
13
3751
44
18
6750
Surv
ey D
urat
ion
(mon
ths)
?
? ?
2 5
4.5
5 ?
? 5
8 8.
5 6
SSN
WR
Sur
vey
Bio
logi
st3
WH
W
H
JM/W
H
WR
W
R
WR
W
R
KS
KS
KS
KS
KS
KS
1 T
radi
tiona
l cen
sus
area
s co
vere
d lo
catio
ns b
etw
een
Red
Hill
and
the
New
Riv
er d
elta
at t
he s
outh
east
ern
end
of th
e Se
a. T
hese
incl
uded
: Red
Hill
/Hea
dqua
rter
s, H
azar
d L
ake,
Obs
idia
n B
utte
, Lin
dsey
/L
ack
Roa
ds, V
ail-
Ran
ch d
rain
, Tri
foliu
m #
1 dr
ain,
and
New
Riv
er d
elta
.2
New
er c
ensu
s ar
eas
cove
red
loca
tions
fro
m a
roun
d th
e en
tire
shor
elin
e ou
tsid
e th
e tr
aditi
onal
cen
sus
area
s. T
hese
incl
uded
: Poe
Roa
d, 8
1st A
venu
e, 7
6th
Ave
nue,
Joh
nson
Roa
d, B
omba
y B
each
, Mul
let
Isla
nd, W
iste
r Sh
orel
ine,
and
Ala
mo
Riv
er D
elta
. 81s
t Ave
nue
and
Mul
let I
slan
d w
ere
not c
ensu
sed
in 1
991.
3 B
iolo
gist
s in
dica
ted
as f
ollo
ws:
WH
= W
illia
m H
enry
, JM
= J
eff
Mac
kay,
WR
= W
illia
m R
adke
, KS
= K
en S
turm
4 D
ata
from
Tab
le 6
of
Shuf
ord
et a
l. 20
02; s
urve
y ar
eas
incl
ude
entir
e Sa
lton
Sea
shor
elin
e an
d R
amer
Lak
e.5
Bro
wn
Pelic
ans
wer
e ob
serv
ed d
ispl
ayin
g, c
opul
atin
g, a
nd n
est-
build
ing,
but
the
1-4
nest
s co
nstr
ucte
d w
ere
dest
roye
d be
fore
or
soon
aft
er e
ggs
wer
e la
id.
6 D
oubl
e-cr
este
d C
orm
oran
ts, m
ostly
nes
tling
s an
d ju
veni
les,
suf
fere
d hi
gh m
orta
lity
from
New
cast
le D
isea
se w
ith ~
1500
dea
d in
199
7 an
d ~6
000
dead
in 1
998
(Stu
rm, u
npub
lishe
d re
port
s).

Hurlbert, Anderson, Sturm and Hurlbert
492
Gull-billed Terns at the Salton Sea also peaked in 1996 and 1997 (Molina 2004). These data from the colonial nesting bird surveys show that the increase in numbers during the 1990s, and presumably also the increase of the 1970s and early 1980s, was due to increased reproductive success as well as increased immigration into the area.
Since the late 1990s, use of the Salton Sea by piscivorous birds has dropped off precipitously. Winter numbers of Brown Pelicans, Caspian Terns, Great Egrets and Snowy Egrets began declining as early as 1997, while Ospreys, American White Pelicans, Double-crested Cormorants, and Great Blue Herons began declining in 1999 or 2000 (Fig. 11). Since the last major cohort of tilapia was produced in 1995, this suggests that the bird species depending on small first year fish began declining first, while the species capable of catching larger fish were able to continue to take advan-tage of the 1995 tilapia cohort for several more years. The American White Pelican, with nearly twice the mass of the next largest fish-eater at the Salton Sea, was the last species to start declining in number (Fig. 11).
As part of the Wildlife Disease Surveillance Program, the Salton Sea Authority began making monthly estimates of the number of certain bird groups starting in December 1999 (Fig. 13). While total waterfowl numbers, consisting mostly of Ruddy Ducks and Northern Shovelers, have been relatively constant over these past four years, the winter peaks in American White Pelican and Double-crested Cormorant numbers decreased by 93-97% from 2000 to 2003. The summer peak in Brown Pelicans dispersing from the Gulf of California decreased by more than 80% over this period. The massive die-offs of an estimated 35 million fish in 2000 and 2001 (Table 3) almost certainly contributed to this decline in fish-eating bird numbers. Numbers for these three piscivorous species rebounded slightly in 2004, reflecting the rebound in the tilapia population evident from the 2004 fishkill (Table 3) and the most recent gillnet surveys (Fig. 6).
In summary, data over the past forty years suggest that fish-eating bird populations have closely tracked fluctuations in fish availability. Total fish-eating bird biomass, based on Christmas Bird Count data and mean species masses (Ap-pendix 3), shows two distinct cycles of boom and bust (Fig. 6), and this pattern parallels the rough trends in fish abun-dance estimated from gillnet surveys together with popular accounts of the fish crash of the late 1980s. The first pulse in avian biomass was primarily due to the local response of herons and egrets, while the second pulse in the late 1990s reflected a dramatic increase in species, such as cormorants and pelicans, capable of catching larger prey.
Surprisingly, Eared Grebe numbers at the Salton Sea also may have been negatively influenced by fish population crashes. This grebe probably did not appear in large numbers at the Sea until the 1950s or 1960s, after its main prey, the
Figure 13.-Numbers of waterfowl, Double-crested Cormorants, American White Pelicans, and Brown Pelicans observed at the Salton Sea on monthly surveys from December 1999 through December 2004.
pileworm, had become abundant (Carpelan and Linsley 1961; Jehl and McKernan 2002). When the phytoplanktivorous tila-pia population crashed in the late 1980s and early 2000s, the pileworm population is thought to have crashed as well, as a result of increased sulfide and decreased oxygen levels result from greatly increased plankton production, and Eared Grebe numbers followed (Fig. 11F) (Anderson et al. 2007).
Conclusion and future prospectsThe Salton Sea fishery has undergone dramatic changes since the lake’s formation, and in the past 35 years these dynamics have been driven largely by tilapia, an accidentally introduced species that is able to achieve high densities by virtue of its lower trophic position. Fish-eating bird popula-tions have responded rapidly to the major fluctuations in resource availability over this time period. Other factors that have contributed to the boom and bust dynamics of fish and fish-eating birds at the Salton Sea over the past century include decreased organochlorine pesticide use, high nutri-ent inputs (Bain et al. 1970; Holdren and Montaño 2002),

Fish and fish-eating birds at the Salton Sea: a century of boom and bust
493
fish and bird diseases and parasites (Kuperman and Matey 1999; Friend 2002; Kuperman et al. 2001; Kuperman et al. 2002; Rocke et al. 2004), the interaction of all these with the complex physical dynamics of the lake (Watts et al. 2001; Holdren and Montaño 2002), and, in the case of birds, events and phenomena occurring in other parts of their geographic range.
Periods of high fish abundance at the Salton Sea attract many more fish-eating birds to the area, as well as stimulate nest-ing in much greater numbers. During periods when fish are scarce, the birds presumably go elsewhere, or attempt to do so. Details on their movements and survival rates remain un-known. Shuford and Molina (2004) recently demonstrated the importance of the Salton Sea to both migratory and resident waterbirds—in 1999 at least half a million waterbirds inhab-ited this wetland oasis in the desert. Here, we have shown that the use of the Sea by fish-eating birds over the past 40 years has been extremely dynamic and strongly coupled to the biology of the lake itself.
The future of the Salton Sea is uncertain. The current salinity of 47 g l-1 is well above the optimum for all fish in the Sea and is rising. Though salinity is not the only major stress on fish, we predict there will be no significant recovery from the Millenium Crash until salinity is lowered. With current inflows of 1.60 billion m3 y-1 (1.3 million acre-ft y-1), salin-ity will continue rising by about 1 g l-1 every three years. If inflows are reduced, the lake will shrink, and salinity will increase more rapidly.
Core elements of the rehabilitation plan currently favored by the Salton Sea Authority are a 15 km long causeway across the waist of the Sea, maintenance of the northern portion of the Sea as a deepwater lake at 35-40 g l-1 salinity, with the southern basin serving as receptor of overflow water from the northern one (SSA 2004). This southern basin would gradu-ally shrink in size and increase greatly in salinity. Especially if overflow waters from the northern basin can also be used to feed hundreds of hectares of shallow constructed wetlands, the diversity of habitat available to piscivorous birds will be increased though total lake area and total fish production are likely to be reduced by more than fifty percent.
Such an ambitious plan would cost on the order of a billion dollars. It would work only if high inflows into the Sea con-tinued indefinitely into the future. However, there is strong pressure for measures that would reduce inflows—fallowing of land and desalination of wastewaters—in order to make more water available to cities elsewhere in California. Cur-rent inflows are not considered “beneficial use” of the water and so have no legal protection. Unfortunately, the Califor-nia Department of Water Resources, the Imperial Irrigation District, and the Coachella Valley Water District all oppose creating legislation that would guarantee for the long term any minimum inflows to the Sea. Without such legislation,
it may be difficult to justify a billion dollar project. So it is conceivable that only a much smaller rehabilitation project, one of much less value to piscivorous birds and other wildlife, will eventually be undertaken.
Despite uncertainty over future plans for the Salton Sea, there are a few specific suggestions that can be made if a large, deep lake in the northern basin is part of the future of this system. A more stable fishery—with the same four dominant species that have dominated it over the past thirty-five years—would result from a salinity lowered to 35 g l-1, reduced net nutrient loading, and delivery of inflows in a manner that facilitated their rapid mixing with lake waters. Reduced nutrient levels in the lake are especially critical. External loadings are already being achieved by improved water management practices on agricultural lands. Additionally, as the proposed lake in the northern basin will have an outflow, there will be more or less continuous export of nutrients from the lake. Rapid mixing of inflows will be important in that it reduces the likelihood of density stratifications that inhibit vertical mixing and de-livery of oxygen to bottom waters. These steps should favor less fish disease, fewer die-offs due to high sulfide levels and anoxia, and fish populations with multiple year classes and size classes represented. These in turn would favor a reliable food supply for a moderately diverse assemblage of piscivorous birds.
ReferencesAbbott, C.G. 1940. Notes from the Salton Sea, California. Condor
42:264-265.Adamson, T.A. 1975. Report on field data. Unpublished report
of field activities, submitted to Dr. D. Seltz, California State University, Los Angeles. 14 pp.
Anderson, D.W. and I.T. Anderson. 1976. Distribution and status of Brown Pelicans in the California Current. American Birds 30:3-12.
Anderson, T.W., M.A. Tiffany and S.H. Hurlbert. 2007. Stratification, sulfide, worms and decline of the eared grebe (Podiceps nigricollis) at the Salton Sea, California. Lake Reserv. Manage. 23:500-517.
Bain, R.C., A.M. Caldwell, R.H. Clawson, H.L. Scotten and R.G. Willis. 1970. Salton Sea California: Water Quality and Ecological Management Considerations. U.S. Department of the Interior, Federal Water Quality Administration, Pacific Southwest Region, 54 pp.
Black, G. 1979-1980. Monthly memoranda to Fisheries Management, Region 5, Long Beach, October 1979 – December 1980. California Department of Fish and Game, Long Beach, California.
Black, G.F. 1982. Gill-netting at the Salton Sea, August 2-6, 1982. Monthly memoranda to Fisheries Management, Region 5, Long Beach, August 1982. California Department of Fish and Game, Long Beach, California.

Hurlbert, Anderson, Sturm and Hurlbert
494
Black, G.F. 1985. The Salton Sea sport fishery. Region 5 Informational Bulletin 0010-5-1985, Long Beach, May 1985. California Department of Fish and Game, Long Beach, California. 43 pp.
Black, G.F. 1988. Description of the Salton Sea sport fishery, 1982-1983. Inland Fisheries Administrative Report No. 88-9. California Department of Fish and Game, Long Beach, California. http://www.sci.sdsu.edu/salton/SSSportFishery1988.html
Blus, L.J. 1982. Further interpretation of the relation of organochlorine residues in Brown Pelican eggs to reproductive success. Environmental Pollution (Ser. A) 28:15-33.
Bock, C.E. and T.L. Root. 1981. The Christmas Bird Count and avian ecology. In C.J. Ralph and J.M. Scott [eds.]. Estimating Numbers of Terrestrial Birds. Studies in Avian Biology, No. 6:17-23.
Borders, A. 1990. Salton Sea bird count dips steeply. The Press-Enterprise, Riverside, California, 31 December 1990, pp. B-1,3.
Butler, R.W. 1992. Great Blue Heron (Ardea herodias). In A. Poole and F. Gill [eds.]. The Birds of North America, No. 25. The Academy of Natural Sciences, Philadelphia, PA, and The American Ornithologists’ Union, Washington, DC.
Bystrak, D. 1981. The North American Breeding Bird Survey. In C.J. Ralph and J.M. Scott [eds.]. Estimating Numbers of Terrestrial Birds. Studies in Avian Biology 6:34-41.
Carlander, K.D. 1955. The standing crop of fish in lakes. Journal of the Fisheries Research Board of Canada 12:543-570.
Carpelan, L.H. 1958. The Salton Sea: Physical and chemical characteristics. Limnology and Oceanography 3:373-386.
Carpelan, L.H. 1961a. The pile worm, Neanthes succinea (Frey and Leuckart). P. 63-76 In B.W. Walker [ed.]. The Ecology of the Salton Sea, California in Relation to the Sportfishery. California Fish and Game, Fish Bulletin 13:1-204.
Carpelan, L.H. 1961b. Physical and chemical characteristics. P. 17-32 In B.W. Walker [ed.]. The Ecology of the Salton Sea, California in Relation to the Sportfishery. California Fish and Game, Fish Bulletin 13:1-204.
Carpelan, L.H. and R.H. Linsley. 1961. The pile worm Neanthes succinea (Frey and Leuckart). P. 63-76 In B.W. Walker [ed.]. The Ecology of the Salton Sea, California, in Relation to the Sportfishery. California Department of Fish and Game, Fish Bulletin 113:1-204.
Carter, H.R., A.L. Sowls, M.S. Rodway, U.W. Wilson, R.W. Lowe, G.J. McChesney, F. Gress and D.W. Anderson. 1995. Population size, trends, and conservation problems of the Double-crested Cormorant on the Pacific coast of North America. Colonial Waterbirds 18 (Special Publ. 1):189-215.
Caskey, L.L., R.R. Riedel, B. Costa-Pierce, J. Butler and S.H. Hurlbert. 2007. Population dynamics, growth, and distribution of tilapia (Oreochromis mossambicus) in the Salton Sea, 1999-2002, with notes on orangemouth corvina (Cynoscion xanthulus) and bairdiella (Bairdiella icistia). Hydrobiologia 576:185-203.
Cleland, N. 1983. Salton Sea’s resources drowning in salt. The Tribune, San Diego, California, February 1, 1983.
Cohen, M.J., J.I. Morrison and E.P. Glenn. 1999. Haven or Hazard: The Ecology and Future of the Salton Sea. Pacific Institute for Studies in Development, Environment, and Security, Oakland, California.
Coleman, G.A. 1929. A biological survey of the Salton Sea. California Fish and Game 15:218-227.
Costa-Pierce, B. 1997. Tilapias of the Salton Sea, a marine lake in California. P. 584-590 In K. Fitzsimmons [ed.]. International Symposium on Tilapia in Aquaculture. Northeast Regional Agriculture Engineering Service, Cornell University, Ithaca, New York.
Costa-Pierce, B. and R. Doyle. 1997. Genetic identification and status of tilapia region strains in southern California. P. 1-17 In B. Costa-Pierce and J. Rakocy [eds.]. Tilapia Aquaculture in the Americas. World Aquaculture Society Books, Baton Rouge, Louisiana.
Costa-Pierce, B. and R. Riedel. 2000. Fisheries ecology of the tilapias in subtropical lakes in the United States. P. 1-20 In B. Costa-Pierce and J. Rakocy [eds.]. Tilapia Aquaculture in the Americas (Vol. II). World Aquaculture Society Books, Baton Rouge, Louisiana.
Cullen, S.A., J.R. Jehl, Jr. and G.L. Nuechterlein. 1999. Eared grebe. In A. Poole and F. Gill [eds.]. The Birds of North America, No. 433. American Ornithologists’ Union, Washington, DC.
Custer, T.W. 2000. Environmental contaminants. P. 251-267 In J.A. Kushlan and H. Hafner [eds.]. Heron Conservation. Academic Press, San Diego, California.
Cuthbert, F.J. and L.R. Wires. 1999. Caspian Tern (Sterna caspia). In A. Poole and F. Gill [eds.]. The Birds of North America, No. 403. The Academy of Natural Sciences, Philadelphia, Pennsylvania, and The American Ornithologists’ Union, Washington, DC.
Davis, W.E. 1993. Black-crowned Night Heron (Nycticorax nycticorax). In A. Poole and F. Gill [eds.]. The Birds of North America, No. 74. The Academy of Natural Sciences, Philadelphia, Pennsylvania, and The American Ornithologists’ Union, Washington, DC.
Dexter, D.M., J.S. Dainer, P.M. Detwiler, M.F. Moreau and S.H. Hurlbert. 2007. Decline of springtime abundance of the pileworm Neanthes succinea in relation to hydrographic conditions at the Salton Sea, California. Lake Reserv. Manage. 23:570-581.
Dill, W.A. 1942. The inland mullet fishery of California. Rep. No. 2, California Division of Fish and Game, unpubl. manuscript. 45 pp.
Dill, W.A. and C. Woodhull. 1942. A game fish for the Salton Sea, the ten-pounder, Elops affinis. California Fish and Game 28:171-174.
Dowd, M.J. 1960. Historic Salton Sea. Office of Public Information, Imperial Irrigation District, Imperial, California. 35 pp.
Evans, R.M. and F.L. Knopf. 1993. American White Pelican (Pelecanus erythrorhyncos). In A. Poole and F. Gill [eds.]. The Birds of North America, No. 57. The Academy of Natural Sciences, Philadelphia, Pennsylvania and The American Ornithologists’ Union, Washington, DC.
Evermann, B.W. 1916. Fishes of the Salton Sea. Copeia 34:61-62.
Friend, M. 2002. Avian disease at the Salton Sea. Hydrobiologia 473:293-306.
Grinnell, J. 1908. Birds of a voyage on Salton Sea. Condor 10:185-191.
Grinnell, J. and A.H. Miller. 1944. The distribution of the birds of California. Pacific Coast Avifauna, vol. 27. The Club, Berkeley, California.

Fish and fish-eating birds at the Salton Sea: a century of boom and bust
495
Hart, C.M., M.R. Gonzalez, E.P. Simpson and S.H. Hurlbert. 1998. Salinity and fish effects on Salton Sea microecosystems: zooplankton and nekton. Hydrobiologia 381:129-152.
Hatch, J.J. and D.V. Weseloh. 1999. Double-crested Cormorant (Phalacrocorax auritus). In A. Poole and F. Gill [eds.]. The Birds of North America, No. 441. The Academy of Natural Sciences, Philadelphia, Pennsylvania, and The American Ornithologists’ Union, Washington, DC.
Hauser, W. 1975a. Can Tilapia replace herbicides? Cal-Neva Wildlife Transactions 6:44-50.
Hauser, W. 1975b. Tilapia as biological control agents for aquatic weeds and noxious aquatic insects in California. Proceedings of the Annual Conference, California Mosquito Vector Control Association 43:51-53.
Hely, A.G., G.H. Hughes and B. Irelan. 1966. Hydrologic regimen of Salton Sea, California. U.S. Geological Survey Professional Paper 486-C, 32 pp.
Hendricks, I.J. 1961a. The threadfin shad, Dorosoma petenense (Gunther). P. 93-94 In B.W. Walker [ed.]. The Ecology of the Salton Sea, California, in Relation to the Sportfishery. California Fish and Game, Fish Bulletin 113:1-204.
Hendricks, I.J. 1961b. The striped mullet, Mugil cephalus Linnaeus. P. 95-103 In B.W. Walker [ed.]. The Ecology of the Salton Sea, California in Relation to the Sportfishery. California Fish and Game, Fish Bulletin 113:1-204.
Holdren, G.C. and A. Montaño. 2002. Chemical and physical characteristics of the Salton Sea, California. Hydrobiologia 473:1-21.
Hoover, F. and J. St. Amant. 1970. Establishment of Tilapia mossambica Peters in Bard Valley, Imperial County, California. California Fish and Game 56:70-71.
Hulquist, R.G., J. St. Amant, A. Pickard, G. Black and R.L. Young. 1978. The Salton Sea: fishing the great inland sea – foster home to the orangemouth corvina. California Department of Fish and Game, Long Beach, California. 8 pp.
Hulquist, R.G. 1981. A summary of Salton Sea creel censuses, 1958, 1963 through 1967, and 1969. California Department of Fish and Game, Inland Fisheries, Region 5 Information Bulletin 0004-3-1981. http://www.sci.sdsu.edu/salton/Hulquist1981SSCreel.html.
Hurlbert, A.H. 1996. Wildlife use of agricultural drains in the Imperial Valley, California. U.S. Fish and Wildlife Service Report, Salton Sea National Wildlife Refuge.
Jehl, J.R., Jr. and R.L. McKernan. 2002. Biology and migration of Eared Grebes at the Salton Sea. Hydrobiologia 473:245-253.
Karr, B. 1985. Fishing Salton Sea. Karr Enterprises, North Shore, California. 51 pp.
Keith, J.O. 1966. Insecticide contaminations in wetland habitats and their effects on fish-eating birds. Journal of Applied Ecology 3 (Suppl.):71-85.
Kuperman, B.I. and V.E. Matey. 1999. Massive infestation by Amyloodinium ocellatum (Dinoflagellida) of fish in a highly saline lake, Salton Sea, California, USA. Diseases of Aquatic Organisms 39:65-73.
Kuperman, B.I., V.E. Matey and S.H. Hurlbert. 2001. Parasites of fish from the Salton Sea, California, USA. Hydrobiologia 466:195-208.
Kuperman, B.I., V.E. Matey and S.B. Barlow. 2002. Flagellate Cryptobia branchialis (Bodonida: Kinetoplastida) ectoparasite of tilapia from the Salton Sea. Hydrobiologia 473:93-102.
LaRue, S. 1989. Time is running out for the Salton Sea. San Diego Union-Tribune, San Diego, California. July 17, 1989, pp. B-1, 4.
Legner, E. and F. Pelsue. 1977. Adaptations of Tilapia to Culex and chironomid midge ecosystems in South California. Proceedings of the Annual Conference, California Mosquito Vector Control Association 45:95-97.
Legner, E. and T. Fisher. 1980. Impact of Tilapia zillii (Gervais) on Potamogeton pectinatus L., Myriophyllum spicatum var. exalbescens Jepson, and mosquito reproduction in lower Colorado Desert irrigation canals. Acta Oecologia et Oecologia Applicata 1:3-14.
Lies, M.F. and W.H. Behle. 1966. Status of the White Pelican in the United States and Canada through 1964. Condor 68:279-292.
Maitipe, P. and S.S. De Silva. 1985. Switches betweeen zoophagy, phytophagy and detritivory of Sarotherodon mossambicus (Peters) populations in man-made Sri Lankan lakes. Journal of Fish Biology 26:49-61.
Marcum, D. 1999. 7.6 million fish die in a day at the Salton Sea. The Los Angeles Times, August 12, 1999, pp. A1, A22.
Matthews, N. 1982. The old woman and the sea. California Magazine, March 1982, pp. 84-90, 158-161.
Matsui, M., A. Bond, G. Jordan, R. Moore, P. Garrahan, K. Iwanaga and S. Williams. 1991. Abundance and distribution of ichthyoplankton in the Salton Sea, California in relation to water quality. California Fish and Game Report on Sport Fish Restoration Federal Aid Project F-51-R.
Molina, K.C. 2004. Breeding larids of the Salton Sea: trends in population size and colony site occupation. Studies in Avian Biology 27:92-99.
Molina, K.C. and K.K. Sturm. 2004. Annual colony site occupation and patterns of abundance of breeding cormorants, herons, and ibis at the Salton Sea. Studies in Avian Biology 27:42-51.
de Moor, F.C., R.C. Wilkinson and H.M. Herbst. 1986. Food and feeding habits of Oreochromis mossambicus (Peters) in hypertrophic Haartbeestpoort Dam, South Africa. South African Journal of Zoology 21:170-176.
Moreau, M.F., J. Surico-Bennett, M. Vicario-Fisher, D. Crane, R. Gerards, R.M. Gersberg and S.H. Hurlbert. 2007. Contaminants in tilapia (Oreochromis mossambicus) from the Salton Sea, California, in relation to human health, piscivorous birds and fish meal production. Hydrobiologia 576:127-165.
Neil, E.H. 1966. Observations on the behaviour of Tilapia mossambica (Pisces, Cichlidae) in Hawaiian ponds. Copeia 1:50-56
Parsons, K.C. and T.L. Master. 2000. Snowy Egret (Egretta thula). In A. Poole and F. Gill [eds.]. The Birds of North America, No. 489. The Academy of Natural Sciences, Philadelphia, Pennsylvania, and The American Ornithologists’ Union, Washington, DC.
Patten, M.A., G. McCaskie and P. Unitt. 2003. Birds of the Salton Sea: Status, Biogeography, and Ecology. Univ. California Press, Berkeley.
Pelzman, R.J. 1973. A review of the life history of Tilapia zillii with a reassessment of its desirability in California. California Department of Fish and Game, Inland Fisheries Administrative Report 74-1: 9 pp.
Pemberton, J.R. 1927. The American Gull-billed Tern breeding in California. Condor 29:253-258.
Hurlbert, Anderson, Sturm and Hurlbert
496
Peterle, T.J. 1991. Wildlife Toxicology. Van Nostrand Reinhold, New York.
Polakovic, G. 1993. When birds become pests, it’s ready, aim, fire! The Press-Enterprise, Riverside, California, January 7, 1993.
Poole, A.F. 1989. Ospreys: A Natural and Unnatural History. Cambridge Univ. Press, Cambridge, United Kingdom.
Poole, A.F., R.O. Bierregaard and M.S. Martell. 2002. Osprey (Pandion haliaetus). In A. Poole and F. Gill [eds.]. The Birds of North America, No. 683. The Academy of Natural Sciences, Philadelphia, Pennsylvania, and The American Ornithologists’ Union, Washington, DC.
Pullin, R.S.V. and R.H. Lowe-McConnell [eds.]. 1982. The biology and culture of tilapias. International Centre for Living Aquatic Resources Management, Manila: 434 pp.
Recher, H.F. and J.A. Recher. 1980. Why are there different kinds of herons? Transactions of the Linnean Society of New York 9:135-158.
Redlands Institute. 2002. Salton Sea Atlas. The Redlands Institute, University of Redlands, Redlands, California. ESRI Press, Redlands California. 127 pp.
Remsen, J.V., Jr. 1978. Bird species of special concern in California. Nongame Wildlife Invest., Wildlife Management Branch Administrative Report 78-1, California Dept. Fish and Game, Sacramento.
Riedel, R., L. Caskey and B.A. Costa-Pierce. 2002. Fish biology and fisheries ecology of the Salton Sea, California. Hydrobiologia 473:229–244.
Riedel, R., L. Caskey and S.H. Hurlbert. 2007. Length-weight relations and growth rates of dominant fishes of the Salton Sea and implications for predation by fish-eating birds. Lake Reserv. Manage. 23:528-535.
Rocke, T.P., P. Noll, C. Pelizza and K. Sturm. 2004. Type C botulism in pelicans and other fish-eating birds at the Salton Sea. Studies in Avian Biology 27: 136-140.
Sahagun, L. 1989. Death knell may have sounded for Salton Sea. Los Angeles Times, Los Angeles, California, April 3, 1989.
[SSA] Salton Sea Authority. 2004. Salton Sea restoration: Final preferred project report: Executive summary. Salton Sea Authority, La Quinta, California, July 2004. http://www.saltonsea.ca.gov/ media/ppr_summary.pdf.
Sardella, B.A., V. Matey, J. Cooper, R. Gonzalez and C.J. Brauner. 2004a. Physiological, biochemical and morphological indicators of osmoregulatory stress in “California” Mozambique tilapia (Oreochromis mossambicus x O. urolepis hornorum) exposed to hypersaline water. Journal of Experimental Biology 207:1399-1413.
Sardella, B.A., J. Cooper, R. Gonzalez and C.J. Brauner. 2004b. The effect of temperature on the salinity tolerance of juvenile Mozambique tilapia hybrids (Oreochromis mossambicus x O. urolepis hornorum). Comparative Biochemistry and Physiology Part A 137: 621-629.
St. Amant, J.A. 1966. Addition of Tilapia mossambica to the California fauna. California Fish and Game 52:54-55.
Sauer, J.R., J.E. Hines and J. Fallon. 2004. The North American Breeding Bird Survey, Results and Analysis 1966 - 2003. Version 2004.1. USGS Patuxent Wildlife Research Center, Laurel, Maryland. http://www.mbr-pwrc.usgs.gov/bbs/bbs.html.
Schlorff, R.W. 1978. Predatory ecology of the Great Egret at Humboldt Bay, California. In A.J. Sprunt, C. Ogden and S. Winckler [eds.]. Wading Birds. Res. Rep. No. 7, National Audubon Society, New York.
Schoenherr, A. 1988. A review of the life history of the desert pupfish, Cyprinodon macularius. Bulletin of the Southern California Academy of Science 87:104-134.
Shields, M. 2002. Brown Pelican (Pelecanus occidentalis). In A. Poole and F. Gill [eds.]. The Birds of North America, No. 609. The Academy of Natural Sciences, Philadelphia, PA, and The American Ornithologists’ Union, Washington, DC.
Shuford, W.D. and K.C. Molina [eds.]. 2004. Ecology and Conservation of Birds of the Salton Sink: An Endangered Ecosystem. Studies in Avian Biology 27:1-169.
Shuford, W.D., N. Warnock and K.C. Molina. 1999. The avifauna of the Salton Sea: a synthesis. Report to the Salton Sea Science Subcommittee and Salton Sea Authority. Point Reyes Bird Observatory, Stinson Beach, California. 48 pp.
Shuford, W.D., N. Warnock, K.C. Molina and K.K. Sturm. 2002. The Salton Sea as critical habitat to migratory and resident waterbirds. Hydrobiologia 473:255-274.
Small, A. 1994. California Birds: Their Status and Distribution. Ibis Publishing, Vista, California.
Spanier, E. 1980. The use of distress calls to repel night herons (Nycticorax nycticorax) from fish ponds. Journal of Applied Ecology 17:287-294.
Sturm, K. 1998. From summer range to home range? Endangered Species Bulletin 23:22-23.
Sykes, G. 1937. The Colorado Delta. American Geographical Society, Special Pub. No. 19, 193 pp.
Telfair, R.C. 1994. Cattle Egret. In A. Poole and F. Gill [eds.]. The Birds of North America, No. 113. American Ornithologists’ Union, Washington, DC.
Thompson, W.F. and H.C. Bryant. 1920. The mullet fisheries of Salton Sea. California Fish and Game 6:60-63.
Tiffany, M.A., B. Swan, J. Watts and S.H. Hurlbert. 2002. Metazooplankton dynamics of the Salton Sea, 1997-1999. Hydrobiologia 473:103-120.
Tiffany, M.A., M.R. González, B.K. Swan, K.M. Reifel, J.M. Watts and S.H. Hurlbert. 2007a. Phytoplankton dynamics in the Salton Sea, California, 1997-1999. Lake Reserv. Manage. 23:582-605.
Tiffany, M.A., S.L. Ustin and S.H. Hurlbert. 2007b. Sulfide irruptions and gypsum blooms in the Salton Sea as detected by satellite imagery, 1979-2006. Lake Reserv. Manage. 23:637-652.
Tostrud, M.B. 1997. The Salton Sea 1906-1996: computed and measured salinities and water levels. Draft Report, Colorado River Board of California, 84 pp.
Trewavas, E. 1983. Tilapiine Fishes of the Genera Sarotherodon, Oreochromis and Danakilia. British Museum of Natural History, London.
Van Rossem, A. 1911. Winter birds of the Salton Sea region. Condor 13:129-137.
Walker, B.W. [ed.]. 1961. The Ecology of the Salton Sea, California in Relation to the Sportfishery. California Department of Fish and Game, Fish Bulletin 113:1-204.

Fish and fish-eating birds at the Salton Sea: a century of boom and bust
497
Walker, B.W., R.R. Whitney and G.W. Barlow. 1961. The fishes of the Salton Sea. P. 77-91 In B.W. Walker [ed.]. The Ecology of the Salton Sea, California, in Relation to the Sportfishery. California Department of Fish and Game, Fish Bulletin No. 113:1-204.
Watts, J.M., B.K. Swan, M.A. Tiffany and S.H. Hurlbert. 2001. Thermal, mixing, and oxygen regimes of the Salton Sea, 1997-1999. Hydrobiologia 466:159-176.
Weseloh, D.V., S.M. Teeple and M. Gilbertson. 1983. Double-crested Cormorants of the Great Lakes: egg-laying parameters, reproductive failure and contaminant residues in eggs. Canadian Journal of Zoology 61:427-436.
Whitfield, A.K. and S.J.M. Blaber. 1978. Resource segregation among iliophagous fish in Lake St. Lucia, Zululand. Environmental Fish Biology 3:293-296.
Whitney, R.R. 1961. The bairdiella, Bairdiella icistius (Jordan and Gilbert). P. 105-152 In B.W. Walker [ed.]. The Ecology of the Salton Sea, California, in Relation to the Sportfishery, California Department of Fish and Game, Fish Bulletin 113:1-204.
Whitney, R.R. 1967. Introduction of commercially important species into inland mineral waters, a review. Contributions in Marine Science 12:262-280.
Wiemeyer, S.N., C.M. Bunck and A.J. Krynitsky. 1988. Organochlorine pesticides, polychlorinated biphenyls, and mercury in Osprey eggs—1970-79—and their relationships to shell thinning and productivity. Archives of Environmental Contamination and Toxicology 17:767-787.
Willett, G. 1933. A revised list of the birds of southwestern California. Pacific Coast Avifauna 21. The Club, Berkeley, California.
Williams, R. 1988. Chilly, windy days may limit harvest. San Diego Union Tribune, San Diego, California, November 18, 1988.
Williams, R. 1991. Fish and bird life are in peril as the Salton Sea gets saltier. San Diego Union Tribune, San Diego, California, February 17, 1991.
Williams, T. 1992. Killer fish farms. Audubon, March/April 1992, pp. 14-22.

Hurlbert, Anderson, Sturm and Hurlbert
498
Appendix 1.-Scientific names of fish and bird species referred to in text.
Common name Scientific name Family
Fish
Desert pupfish Cyprinodon macularius Baird and Girard CyprinodontidaeCommon carp Cyprinus carpio Linnaeus CyprinidaeHumpback sucker Xyrauchen texanus Abbot Catostomidae Western mosquitofish Gambusia affinis Baird and Girard Poeciliidae Striped mullet Mugil cephalus Linnaeus MugilidaeRainbow trout Oncorynchus mykiss Walbaum Salmonidae Sailfin molly Poecilia latipinnna Lesueur PoeciliidaeLongjaw mudsucker Gillichthys mirabilis Cooper GobiidaeMachete Elops affinis Regan ElopidaeOrangemouth corvina Cynoscion xanthulus Jordan and Gilbert SciaenidaeBairdiella Bairdiella icistia Jordan and Gilbert SciaenidaeSargo Anisotremus davidsoni Steindachner HaemulidaeMozambique tilapia Oreochromis mossambicus Peters CichlidaeWami River tilapia Oreochromis urolepis hornorum (Trewavas) CichlidaeRedbelly tilapia Tilapia zillii Gervais CichlidaeThreadfin shad Dorosoma petenense (Günther) Clupeidae
Birds
Common Loon Gavia immer (Brünnich) GaviidaeEared Grebe Podiceps nigricollis Heermann PodicipedidaeWestern Grebe Aechmophorus occidentalis (Lawrence) PodicipedidaeWhite Pelican Pelecanus erythrorhynchos (Gmelin) PelecanidaeBrown Pelican Pelecanus occidentalis Ridgway PelecanidaeDouble-crested Cormorant Phalacrocorax auritus Ridgway PhalacrocoracidaeGreat Blue Heron Ardea herodias Ridgway ArdeidaeGreat Egret Egretta alba Gmelin ArdeidaeSnowy Egret Egretta thula (Molina) ArdeidaeCattle Egret Bubulcus ibis (Linnaeus) ArdeidaeBlack-crowned Night Heron Nycticorax nycticorax (Gmelin) ArdeidaeNorthern Shoveler Anas clypeata Linnaeus AnatidaeLesser Scaup Aythya affinis (Eyton) AnatidaeRuddy Duck Oxyura jamaicensis (Wilson) AnatidaeOsprey Pandion haliaetus (Gmelin) AccipitridaeNorthern Harrier Circus cyaneus (Linnaeus) PandionidaeAmerican Coot Fulica americana Gmelin RallidaeAmerican Avocet Recurvirostra americana Gmelin RecurvirostridaeCaspian Tern Hydroprogne caspia Pallas SternidaeGull-billed Tern Gelochelidon nilotica Bancroft SternidaeBlack Skimmer Rynchops niger Linnaeus RynchopidaeRing-billed Gull Larus delawarensis Ord Laridae

Fish and fish-eating birds at the Salton Sea: a century of boom and bust
499
Appendix 2.-Numbers of fish-eating birds reported shot or otherwise killed during 1986-2003 under U.S. Fish and Wildlife Service depredation permits issued to fish farming operations in the vicinity of the Salton Sea. Data from “Reports of migratory birds taken” filed by farm operators with the U.S. Fish and Wildlife Service, Portland, Oregon. A few White Pelicans (11 in 2002, 9 in 2003) and Caspian Terns (8 in 1990, 2 in 1992) were also reported killed. Reports for 1987-1989 are missing from USFWS files or were not submitted by permitees.
Number of permitees filing Bird species Year reports TOTALa DCCO GBHE BCNH SNEG GREG GRHE AMBI GULLb
1986 170
1990 2 72 49 12 3
1991 3 233 135 98
1992 3 447 230 104 60 15 32 4 105
1993 2 396 187 63 125 5 14 2 88
1994 2 224 63 35 75 10 34 7 34
1995 2 66 18 4 37 7 29
1996 2 276 62 26 156 3 27 2 12
1997 4 438 151 30 200 5 42 5 5
1998 2 420 134 17 216 9 27 6 11 3
1999 4 485 262 43 149 6 20 3 2 5
2000 2 663 385 75 166 5 21 5 6 2
2001 3 859 459 90 260 14 23 5 8 126
2002 3 867 480 75 223 7 59 5 7 16
2003 3 753 465 69 154 12 37 5 2 116
Totals 6199 3080 741 1821 98 339 49 41 706a Exclusive of gulls, but inclusive of White Pelicans and Caspian Terns. Gulls are shot because they, as well as Ruddy Ducks and American Coots, eat
fish food when this is distributed to the fish (G. Ray, Niland, pers. comm.).b Gulls rarely identified by species in early years; sometimes reported as Western Gulls in later years, but Ring-billed Gulls are also abundant in the
region.
Appendix 3.-Mean body mass for piscivorous bird species given in Birds of North America accounts.
Species Body mass (g) Source
American White Pelican 7200 Evans and Knopf 1993
Brown Pelican 3750 Shields 2002
Double-crested Cormorant 2300 Hatch and Weseloh 1999
Great Blue Heron 2300 Butler 1992
Osprey 1700 Poole et al. 2002
Black-crowned Night Heron 870 Davis 1993
Great Egret 854 McCrimmon et al. 2001
Caspian Tern 656 Cuthbert and Wires 1999
Snowy Egret 369 Parsons and Master 2000