Social Engagement, Building Customer Brand Alliance Through Sustainable Conversations

Fiscal Year 2019 Customer Conversations Final Report
Drinking Water Quality and Annual Water Quality Report

Acknowledgements
Albuquerque Bernalillo County Water Utility Authority Board Councilor Trudy E. Jones, Chair Commissioner Debbie O'Malley, Vice Chair
Mayor Timothy Keller Councilor Pat Davis Councilor Klarissa Peña Commissioner Steven Michael Quezada Commissioner Lonnie Talbert Trustee Pablo Rael, Ex Officio Member
Mark S. Sanchez, Executive Director
Technical Customer Advisory Committee Melissa Armijo Andrew Bernard Janie Chermak Mike Hightower Dave Hill Amy Miller Ege Richardson Ron Schwarzwalder Scott Verhines
Water Authority Staff | Mark Kelly, Compliance Division Manager Elizabeth Anderson, Water Quality Manager Michael Richardson, Water Quality Supervisor Cassia Sanchez, Water Quality Senior Engineer Bill Sanderson, Water Quality Data Analyst Nick Jernigan, Water Quality Specialist Diane Agnew, Water Quality Hydrologist Kate Mendoza, Water Resources Specialist Frank Roth, Senior Policy Manager David Morris, Public Affairs Manager Erin Keck, Education Coordinator
Elizabeth Lynch Phillips – Lead Facilitator Thank you for an exceptional job in planning and organizing the meetings as well as preparing and training the sub‐group facilitators, and leading the facilitation of the meetings.
Small Group Facilitators Keith Carlson Heidi Howley Sharon Gonzalez‐Alei Karen Kline Leslie Kryder Kymberly Johnson Ed McCorkindale Ildi Oravecz Sara Sanasac Kathleen Oweegon
Table Recorders | Paulina Aguilera‐Eaton Kelsey Bicknell Cole Garcia Tom Heller Mo Hobbs Dipendra Humagain Finn Knutson Kendra Kozel Kiera McNary Meagan Oldham Jay Pacheco‐Chino Jenny Potter Juliet Smith David Stager Tristan VanCleave

Table of Contents Page Introduction 1 Overview of Water Quality Issues & Activity 2 Regulatory Water Quality Requirements & Activity 6 Conclusions 10 Appendices A – Common Questions from Water Quality Information Line 12 B – Presentation Slides 13 C – Customer Comments 24

{Page Left Intentionally Blank}

Executive Summary
The purpose of the Customer Conversations effort, begun in FY14, is to engage Water Authority customers through topic forums. The FY19 program focused on obtaining customer input on drinking water quality matters. In Albuquerque, thorough treatment and frequent testing ensure that your water is safe to drink according to federal standards enforced by the U.S. Environmental Protection Agency under the Safe Drinking Water Act. The Water Authority maintains its own quality testing lab to ensure that treatment processes are working properly and that water is safe to drink.
Safe drinking water standards are maintained whether the water originates from groundwater obtained from the aquifer beneath Albuquerque, or from surface‐water obtained via the San Juan‐Chama Drinking Water Project. While groundwater generally requires little treatment other than disinfection via chlorination, surface water must undergo additional purification and filtration. Making sure that treatment processes are working correctly requires careful monitoring, and every year the Water Authority collects and tests thousands of water samples from wells, storage tanks, customer taps and the community’s arsenic‐removal and surface‐water treatment plants. Since the passage of the Safe Drinking Water Act, the Water Authority has met all of the federal health standards for safe drinking water. In spite of this, however, a recent opinion survey of Water Authority customers indicated a small, but statistically significant, decline in satisfaction with local water quality. This was a major factor in the decision to focus on water quality in the FY19 Customer Conversations program.
Customer Conversations participants, in a series of table‐top exercises, explored the aesthetic and regulatory components of their drinking water quality. Aesthetic components include taste, odor, appearance and pressure. On the regulatory side, participants were briefed on federally‐mandated purity standards and how those are monitored and achieved. Based on the input provided by customers on the aesthetic qualities of their drinking water, the majority do not have any issues, or are satisfied, with their drinking water quality. It was recommended that the Water Authority educate customers more frequently on ways to mitigate issues when there is an issue and to call the Water Quality Information Line for assistance. Customers also provided input on the Water Quality Report. They appreciated the transparency of water quality information in the report, and the utility’s commitment to meeting and exceeding EPA standards. According to participant feedback, these attributes of the report help build and sustain trust and confidence in the safety of the local drinking water supply. Customers provided several recommendations to improve the format and content of the report and to make it more interesting and easier to understand. Water Authority staff will review these recommendations and incorporate them where possible into the redesign of the 2018 Water Quality Report. Other customer suggestions included increasing the frequency of utility communications about drinking water quality.
Overall feedback on the Customer Conversations meetings themselves was positive. Customers commented that meetings were well organized, informative, and productive and felt that their input was truly welcomed. They also commented positively on the innovative tabletop activities that helped facilitate the discussion and feedback process.

{Page Left Intentionally Blank}

1
INTRODUCTION The purpose of the Customer Conversations effort, begun in FY14, is to engage Water Authority customers through topic forums. Through the FY19 Goals and Objectives, the governing board directed staff to continue the initiative for a sixth year, this time as a means of obtaining customer input on drinking water quality matters.
Water Authority staff established a steering committee to oversee the development and implementation of four scheduled meetings following a format used in previous Customer Conversations forums. The Water Authority hired a facilitator to assist in the planning, organizing, and running the four Customer Conversations meetings.
All four of the meetings were held in October and November 2018. Participants, all Water Authority customers, were recruited through email, the Water Authority website, and the NextDoor neighborhood social network. The two‐hour meetings were held throughout the community at locations in all four quadrants of the service area: 1) Manzano Mesa Multigenerational Center (SE); 2) Don Newton/Taylor Ranch Community Center (NW); 3) South Valley Senior Center (SW); and 4) Sid Cutter Pilot's Pavilion at Balloon Fiesta Park (NE).
The utility’s Technical Customer Advisory Committee (TCAC) hosted each meeting and members of the TCAC attended these meetings to observe the process and listen to customer feedback. The TCAC’s attendance is consistent with its mandate to assist and facilitate public review and discussion on Water Authority policies, plans and programs.
A total of 177 customers attended the four Customer Conversation meetings. Participants received a $20 credit (per household) on their water/sewer bill for attending. All attendees had to pre‐register online. A confirmation letter was sent to pre‐registered customers a week before the meeting to confirm their registration and as a reminder to attend the event. MEETING FORMAT Participants were assigned to tables to ensure a balanced male‐to‐female ratio. Typically, there were two‐thirds female to one‐third male. At each meeting, there were eight tables. Each table had a group facilitator and a recorder. The facilitator sat at the table to assist with the program, discussion and activities. The recorder stood near the table with an easel pad to record comments or questions from the participants. About five staff members attended the meetings to answer questions during the discussion and activities. The meeting consisted of two segments. The first segment focused on the aesthetic values of drinking water such as taste, odor, appearance and pressure. The second segment explored regulatory aspects of drinking water safety. Two activities were developed to obtain feedback on each segment.

2
OVERVIEW OF WATER QUALITY ISSUES As a precursor to Activity 1, staff reviewed three of the most common questions from customers calling the utility’s Water Authority Information Line. In this segment, called “Ask Mike,” Water Quality Supervisor Mike Richardson shared these queries with the audience and provided answers and explanations. The questions and answers can be found in Appendix A.
Michael Richardson, Water Quality Supervisor, presenting information on common water quality questions
Following the “Ask Mike” segment, Mark Kelly, Compliance Division Manager, discussed a phenomenon the utility has dubbed the Water Quality Conundrum: increasing dissatisfaction with drinking water quality but decreasing reported water quality complaints. As shown in Figure 1, the number of complaints per 1,000 customer accounts1 has decreased from a ratio of 8 to 2 in the last ten years. This performance compares favorably compared to the recent United States median of 11. On the other hand, customers are reporting more dissatisfaction with their drinking water quality. Dissatisfaction has increased from 18% in 2006 to 29% in 20182. More importantly, there was an 8 percent point increase in dissatisfaction from 2016 to 2018. Presentation slides can be found in Appendix B.
1 The Water Quality Complaint Rate is a metric tracked annually in the Utility Benchmarking Survey from the American Water Works Association. It is calculated from the number of technical complaints such as taste, appearance, odor, and pressure divided by 1,000 customer accounts. The data is presented in quartiles and median value. 2 Satisfaction with Quality of Drinking Water is one of the questions asked in the utility’s biennial customer opinion survey conducted by Research and Polling.

3
Figure 1: “The Water Quality Conundrum:” Reported Complaints versus Reported Dissatisfaction
ACTIVITY 1 – DISCUSSION OF WATER QUALITY CONUNDRUM This activity’s purpose was to explore customers’ aesthetic concerns of their drinking water quality. Customers were asked the question “What issues have you experienced with drinking water quality at your home in the last year?” For Part 1 of this activity, a large diagram was placed in the center of the table that contained four areas of concern – taste, odor, appearance, and pressure. Each customer was provided six dots: four green dots, one orange dot, and one blue dot. The green dots represented satisfaction or no issues; the orange dot represented a primary concern and the blue dot represented a secondary concern. Customers were instructed to place these dots into the four areas of concern. If a customer had a primary or secondary concern, they would place these dots into one of the four areas. The customer had the option of placing green dots into the other two areas of concern. Alternatively, a customer could place green dots in each area if they did not have primary or secondary concerns. After completing the activity, table facilitators led a table discussion on the placement of dots for customer concerns in the four areas. Recorders captured comments from customers as they talked about their experiences related to the placement of dots.
8.07.7
6.6 6.6
3.62.8 2.7 2.6 2.6 2.7
2.1
18% 19%21% 22% 21%
29%
0%
5%
10%
15%
20%
25%
30%
35%
0
1
2
3
4
5
6
7
8
9
2008 2009 2010 2011 2012 2013 2014 2015 2016 2017 2018
Reported Dissatisfaction
Reported Complia
nts per 1000 Customers
Water Quality Complaints Reported Dissatisfaction

4
Customers placing their dots during Activity 1
TCAC Member Ron Schwarzwalder talking with customers during Activity 1
For Part 2 of this activity, table facilitators asked “What other aesthetic concerns are you experiencing with your water quality?” During this part of the activity, customers were encouraged to discuss any other concerns that they have about aesthetic water quality. Recorders again captured customer comments during this part of the discussion. Activity 1 Results From data collected during Activity 1 at the four meetings, the greatest primary concern was taste at 20%, followed by pressure at 16%. Taste and odor were the main secondary concern, both at 12%. However, the majority of customers did not have any issues in these four aesthetic areas. Figure 2 shows the summary results from all four meetings on Activity 1. Even though the percentages of concern were small, the table discussion provided insight on the specific issues customers have in these four areas.

5
Figure 2: Activity 1 Summary Results
For those customers who had issues with taste, chlorine was the main concern. Many customers commented that they filter their tap water for drinking purposes. Chlorine was also the main concern for odor. Customers noted that they understand the purpose for adding chlorine to the water system for disinfection purposes, but many felt that the amount of chlorine added is too much.
For those customers who prefer to drink bottled water, many felt that bottled water has a certain flavor and consistency and some customers expect those attributes in their tap water. Staff explained that tap water taste may vary depending on the water source and the ratio of surface water to groundwater in the blend.
Besides the strong chlorine smell, customers also mentioned a swampy, stale smell that is most noticeable in the morning. Staff responded that this is most likely the result of algae or fungus buildup in kitchen drain (sewer) pipes. Often people smell odor coming from their drain and think that the odor is coming from the water. Staff recommended that in these cases, rinsing drains with bleach to kill mold and algae will help reduce the odor problem.
Customers discussed some concerns regarding appearance of tap water. When it comes to the appearance of tap water, the most common complaint was cloudiness or “milkiness”. This milky appearance is attributed to dissolved air in the water which is released when water is depressurized at the tap. The dissolved air comes out as tiny air bubbles, which make the water “milky”. These bubbles will rise up out of the water if it sits out for a few minutes and the water will be clear again. “Milky” water occurs more often in the winter time, because dissolved air stays in the water longer when the water is cold. Some customers had issues with brownish or “rusty” colored water related to sediment being stirred up in the distribution line. This is most likely caused by water moving quickly through the pipeline during fire hydrant testing. Customers also expressed concern regarding the hardness of the water and the resulting
20%
8%
9%
16%
12%
12%
6%
6%
67%
80%
85%
79%
0% 20% 40% 60% 80% 100%
Taste
Odor
Appearance
Pressure
Primary Secondary No Issues

6
mineral residue that forms on faucets, shower heads, sinks, and tubs. Many customers mentioned that they understand that the calcium buildup is not harmful but are annoyed with having to replace faucet or shower aerators and scrub buildup or stains in their sinks or tubs. Although Albuquerque’s water may be harder than other parts of the country, it is important to maintain a consistent water chemistry regardless of the source water. More importantly, changing the water chemistry may negatively affect corrosion in the water distribution system which could cause more appearance problems such as dirty water.
For those customers who had issues with pressure, participants noted that the pressure was either too high or too low. Some participants noted low pressure in the afternoon or evening. Many participants desired more consistent pressure throughout the day.
Some customers felt that the Water Quality Conundrum may be a result of the Flint Michigan Water Crisis3 and that this issue has caused more public awareness of potential water quality issues in the past two to five years. OVERVIEW OF REGULATORY WATER QUALITY REQUIREMENTS As a precursor to Activity 2, staff showed a short video to customers to educate them about the regulatory components of drinking water quality. This animated video, Protecting Our Drinking Water, was produced in 2015 by the Water Research Foundation (WRF)4 and speaks to the history of public health protection. The video explains potential sources of harmful substances in water and describes how federal regulations and water treatment technology are used to ensure safe drinking water supplies. Detection methodologies and contaminants of emerging concern (CECs) are also discussed5. The evolution of water quality detection from relatively high concentrations to the extremely low concentrations detected with present‐day technology is then described, with the idea that advanced detection is the first step in prevention of ill effects to public health, because it is through detection that we know what to study and, if necessary, control by regulation.
Following the video, Mark Kelly discussed a new Water Authority study6 on Pharmaceuticals and Personal Care Products (PPCPs) which is scheduled to be completed in 2019. The Water Authority completed a similar study in 2011, which is available on the Water Authority’s
3 The Flint Water Crisis was a public health crisis (April 2014–June 2016) involving the municipal water supply system of Flint, Michigan, where cost‐cutting measures led to tainted drinking water that contained dangerous levels of lead and other toxins. 4 Water Research Foundation (WRF) is an international non‐profit organization that specializes in researching topics that affect drinking water. The video shown to customers as a part of Project #4457 which provides guidance to water utilities regarding risk communication for different types of contaminants of emerging concern. The Water Authority was a participating utility in this project. 5 The WRF video also discussed four types of contaminants of emerging concern (CECs) and provided context about the targeted substances in drinking water without emphasizing one over the others. The four types discussed in the video include: hexavalent chromium, medicines and personal care products, Nitrosodimethylamine (NDMA), and volatile organic compounds (VOCs). 6 Results from voluntary monitoring of PPCPs and other substances by the Water Authority can be found online at http://www.abcwua.org/SWTP_Source_and_Finished_Water_Monitoring.aspx

7
website.6 He also mentioned a new website produced by the Water Authority, nmsourcewaterprotection.com, that provides information on the correct procedure for the disposal of pharmaceuticals and household chemicals.
Elizabeth Anderson, Water Quality Manager, discussed the analytical techniques used to monitor both natural and unnatural substances in the drinking water that were mentioned in the WRF video. She emphasized that the reason why utilities are seeing more substances in the drinking water is often due to improvements in the technologies that measure them. She pointed out that just because a substance is measured in the water doesn’t mean that it poses a health risk and that the EPA studies the occurrence of substances in water and potential health effects, using this information to determine whether the substances should be regulated. She also provided an analogy using M&M candies to help customers better understand the concentration of substances detected in water. She also reviewed the extensive regulatory and voluntary water quality monitoring conducted by the Water Authority. ACTIVITY 2 – DISCUSSION OF WATER QUALITY REPORT This activity’s purpose was to obtain feedback from customers on how to improve the utility’s annual Water Quality Report. The Water Quality Report or Consumer Confidence Report (CCR) is required by the Safe Drinking Water Act. Elizabeth Anderson provided an overview of the of the 2017 Water Quality Report reviewing all sections in the report including Albuquerque’s source water, information on contaminants, regulated substances, monitoring for unregulated substances, health effects, definitions, and information of lead and copper. Mark Kelly also provided information on regulatory and voluntary monitoring and how to view this information on the Water Authority’s Water Quality Information website – www.abcwua.org/waterquality.
This activity used the feedback capture grid technique, shown in Figure 3, to facilitate input from customers on the Water Quality Report. Facilitators asked customers what they liked or disliked about the report and what information they would like to know about water quality that may not be in the report. Customers also provided their ideas for improving the Water Quality Report.
Figure 3: Activity 2 Feedback Capture Grid
What do you like about the Water Quality Report…
What do you not like…
? What else would like to
know about water quality…
! Ideas to improve the Water
Quality Report…

8
Activity 2 Results Based on feedback noted during Activity 2 at the four meetings, it was noted that it is important to provide a variety of information, because what some customers liked, other customers did not like. In general, customers responded favorably to the visual graphics and diagrams showing how the water purification process works. The also liked the source water map and knowing where their water comes from. Many suggested that the use of infographics would be beneficial in understanding the complex material in the report. They also appreciated information about the Water Authority and current news or issues that affect customers. Similarly, customers valued the Water Authority’s transparency in providing water quality information. They liked the utility’s commitment to meeting and exceeding EPA standards. They also liked the section on the health effects of certain substances in the water. Some commented that, based on the information provided through the report, they had trust and confidence in the Water Authority. Customers appreciated hearing about the awards that the utility has received in drinking water quality and watershed protection. They liked that the current Water Quality Report is comprehensive and thorough with detailed information. Many liked the definition section so they can look up technical terms. Customers also liked the information on the Customer Involvement section, because they want to know how they can help support protection of our water supplies. Many customers believed that the report was too technical while others thought that it is effectively written for the customer in mind. Many commented that the current format is awkward and that the tables were difficult to read and understand. Many stated that the white text and dark background was hard to read. Some stated that the report would blend in with junk mail, making it less likely for people to pick up and read. Some stated they did not like the texture of the thin paper. Some customers were concerned about the environmental impact of using too much paper, while others felt that people would not go online to find this information if it were delivered electronically. Many stated that they did not like the folding design, small text, and how the report information was laid out. Others commented that the report was difficult to hold and navigate and that the document was simply too large and contained too much content. Customers felt that the front of the report should draw people’s attention and provide a basic overview of the contents of the report. They liked the idea of including a table of contents and executive summary. Customers suggested that the cover or front section could highlight the main points that customers need to know about their drinking water quality for those that don’t want to read the whole report. Some felt that the report should be laid out in sections or zones with a table of contents to orient the reader to areas of interest. Some suggested that the report could be more brief in order to communicate the most important aspects of drinking water quality, and that the utility could provide the more detailed information on the website so that it is always available to customers. Some suggested that the report be converted to standard paper size or in a brochure/booklet style format using more visible colors and a larger font size. With the new format, customers felt that the information could be easily provided in different color‐coded sections linked by a table of contents. Some suggested the use of smaller

9
versions of the report, written in layman’s terms and provided as inserts in the water bill. Others suggested quarterly reports in the Sunday paper. Customers provided feedback on other information they would like to know about their water. Customers said that they would like more information on micro‐plastics, pesticides or glyphosate in the water. Some suggested a section on current issues or concerns related to water quality or source water protection. There were also comments related to the current status of the Kirtland jet fuel plume and wanting to be updated on this issue. Others simply wanted to be notified of any water quality changes or changes in federal standards. Customers also wanted to know how Albuquerque’s water quality and pricing compares to other cities in the Southwest. There were several comments on benchmarking the Water Authority’s performance to other utilities or cities. One idea was to create an online water quality report quiz and provide credit to water bills for customers who answered questions correctly. Another idea was to provide drinking water fun facts in order to capture the attention of the reader. Customers suggested drawing readers in with headings like “Top 5 Water Quality Concerns … Answered”.
Customers discussing ideas on how to improve
the Water Quality Report
TCAC Members, Janie Chermak and Dave Hill, and Water Authority staff listening to customers discuss the Water Quality Report

10
Report Out Group facilitators reported out on the outcome from the group activities. After each activity, facilitators summarized their table's discussions and main take‐aways.
Group Facilitator, Kathleen Oweegon, reporting out results from activities and discussion
EVALUATIONS At the end of the meeting, staff asked the participants to complete an evaluation form for feedback on the meeting and process. Participants were asked to rate five statements on a scale of 1‐5 with 1 indicating no agreement and 5 indicating complete agreement. The five statements were:
My time was well spent I felt the Water Authority truly wanted my input I would participate in this type of session again The meeting structure allowed participants to provide feedback I learned something about drinking water quality From the cumulative score of the four meetings, participants rated these five areas 4.6 or higher on a scale of 1 to 5 as shown in Figure 4. Participants were also invited to provide additional comments on their evaluation form that can be found in Appendix C.

11
Figure 4 – Meeting Evaluation Scores
CONCLUSIONS Based on the input provided by customers on the aesthetic qualities of their drinking water, the majority do not have any issues or are satisfied with their drinking water quality. It was recommended that the Water Authority educate customers more frequently on ways to mitigate water quality issues when they arise and to call the Water Quality Information Line for assistance. Customers also provided input on the Water Quality Report. They appreciated the transparency of water quality information in the report, and the utility’s commitment to meeting and exceeding the EPA standards. These attributes help build and sustain trust and confidence in the Water Authority’s ability to provide safe drinking water. Customers provided several recommendations to improve the format and content of the report and to make it more interesting and easier to understand. These recommendations will be evaluated and incorporated where possible into the redesign of the 2018 Water Quality Report. Based on the feedback received, customers want the utility to continue with the customer outreach process. They recommend that the utility send out information several times per year to keep residents informed of their drinking water quality. Several customers commented that meetings were well organized, informative, and productive and felt that their input was truly welcomed. They also liked the innovative activities that helped facilitate the discussion and make it easier to provide feedback to the Water Authority.
4.76
4.83 4.824.78
4.66
4.0
4.1
4.2
4.3
4.4
4.5
4.6
4.7
4.8
4.9
5.0
My time was wellspent
I felt the WaterAuthority trulywanted my input
I would participatein this type ofsession again
The meetingstructure allowedparticipants to
provide feedback
I learned somethingabout drinking water
quality

12
AppendixAQuestionsReceivedbyWaterQualityInformationLine
1. If my water were to look “milky”, what would that be? A. Dissolved calcium B. Tiny air bubbles C. Dirty water Answer: B Solution: Let the water sit for a few minutes and the bubbles will go away
2. Why does my swamp cooler smell like a swamp? A. Swamp coolers can grow mold and algae B. River water smells swampy C. Check your warranty Answer: A Solution: Sanitize the swamp cooler. You might need to replace the filters. Pour a few tablespoons of bleach in the water holding basin at the bottom of the cooler. Run the cooler for an hour, then refill with fresh water
3. Why doesn’t my water always taste the same? A. Water comes from a variety of sources and each one tastes a little different B. Surface water temperature changes throughout the year with changes in
air temperature C. A and B Answer: C Solution: Keep a pitcher of water in the refrigerator for drinking. Those who are highly sensitive to the taste of chlorine may choose to let the water sit out in a pitcher for a few minutes

13
AppendixB–PresentationSlides

14

15

16

17

18

19

20

21

22

23

24
AppendixC–CustomerComments
Meeting Date: 10/18/18 Recorder: Kelsey Bicknell Facilitator: Keith Carlson Table #: 1
ACTIVITY 1: What Are Customers Experiencing With Their Tap Water? What customers were experiencing with regard to TASTE:
One customer noted an algae‐like taste, which they felt was possibly due to the San Juan Chama project.
One customer remarked that their water just tasted “bad” and they wouldn’t drink the tap as a result.
One customer noted that their water “tastes like groundwater”, but did not elaborate on what that meant.
The chlorine taste bothers some and they only drink filtered water as a result.
Customers felt that bottled water has a certain flavor and customers expect that in their tap water.
What customers were experiencing with regard to ODOR:
Odor was the least important concern for the table.
One customer marked it as an area of concern because they felt their water very occasionally smells like sewer gas.
What customers were experiencing with regard to APPEARANCE:
There were no issues with the appearance of the water itself, but customers were bothered by the residue left by the water on surfaces, specifically dark mineral rings that form around toilet bowl and sinks.
What customers were experiencing with regard to PRESSURE:
Customers were generally pleased with their water pressure.
One customer told the story of their coworker who has low pressure issues.
Another customer had low water pressure while watering the lawn or during certain times of the day.
In addition to the above categories, customers were ALSO experiencing the following with regard to their tap water:
Customers were generally pleased with how the water feels on their skin, though some felt it made skin feel dry.

25
Customers want the Water Authority to know:
Customers would like a map available to show where hard water and soft water regions are in the water utility service area.
ACTIVITY 2: Assessing & Improving the Water Quality Report 4 out of 6 customers read the Water Quality Report. Customers LIKED the following about the Water Quality Report:
Some customers like the visuals and felt they were easy to read and self‐explanatory. Customers did NOT LIKE the following about the Water Quality Report:
They felt that the tables are hard to read.
They did not like the look of the WQR, and felt that it looked like it would take a long time to read (i.e., the text looked ‘bulky’).
They did not like the white text on dark blue background as it was hard to read.
It wasn’t obvious what was most important to read by the layout and lack of other colors.
Customers wanted to know the following about Water Quality: They suggested that the following should be included in the WQR:
It should include notification of any water quality changes and why they are occurring.
It should include notification of any changes in standards (at state or federal level) due to administration changes.
They wanted to know more about the following in general (not necessarily that it be included in the WQR):
How is wastewater treated? Is this technology improving? If so, does this lead to better water?
How does wastewater influence homeowners and apartment dwellers?
They wanted to be alerted to planned outages or maintenance to lines. Customers had the following ideas for improving the Water Quality Report:
Black text on white background would be easiest to read.
Write the document for a younger audience so it can be easily read by anyone.
Simplify the graphics (like the water by the numbers program).
Add more colors to denote what is most important.
Compare our performance to major cities like Denver, Phoenix, and Las Vegas in categories like price of water and water quality performance.
A link to the report should be posted on local news websites and advertised by the local news stations to encourage reading of the report.

26
Meeting Date: 10/18/18
Recorder: Jenny Potter
Facilitator: Heidi Howley
Table #: 2
ACTIVITY 1: What Are Customers Experiencing With Their Tap Water?
What customers were experiencing with regard to TASTE:
● There were no complaints; customers said they liked the taste and complimented it
What customers were experiencing with regard to ODOR:
● This aspect of water quality was of primary concern to one customer who has issues with her water smelling like chlorine, even when she makes coffee. She is concerned there is too much chlorine in the water. She knows and understands why some chlorine is used for disinfection purposes but thinks it’s just too much. She lives around Spain/Eubank in the NE heights. She says sometimes the smell is more and sometimes it’s less.
What customers were experiencing with regard to APPEARANCE:
● There were no concerns about appearance. ● The table discussed the calcium stains on their dishes. That was an issue the whole table
related to. ● One customer who lives near Snow Heights notices calcium stains a lot of the time and
finds it inconvenient. ● Mike Richardson of the Water Authority came over to the table and talked about using
vinegar in the dishwasher to get rid of calcium buildup.
What customers were experiencing with regard to PRESSURE:
Customers were pleased with the water pressure all the way around.
In addition to the above categories, customers were ALSO experiencing the following with regard to their tap water:
● Customers had no other issues.

27
Customers want the Water Authority to know:
● They are pleased with the aesthetic qualities of their water.
ACTIVITY 2: Assessing & Improving The Water Quality Report
0 out of 6 customers read the Water Quality Report.
Customers LIKED the following about the Water Quality Report:
● The amount of information. ● They like knowing about the system and how it works. ● It gives them a better understanding of the water and what is in it. ● They like the first graph about water usage. ● They like that it provides specific URL’s, websites, and access to information.
Customers did NOT LIKE the following about the Water Quality Report:
● They felt it resembles junk mail which they said makes them less likely to read it, or even check to see what it is.
● They want it to be more brief; maybe people can log in to a website if they want more detailed information.
● They want to see the numbers and that the water is safe to drink. They want higher levels of information to be available for people to find on their own.
● One customer commented that reading the report “goes to my do list and then doesn’t happen”; another said “I’m engaged initially and then when I open it I have less attention”.
● The customers said they already have plenty of trust in the water authority and it takes too long to read.
Customers wanted to know the following about Water Quality:
Fluoride‐ is it in our water? Why did it ever get taken out? Mark Kelly of the Water Authority came and answered questions about fluoride.
Customers had the following ideas for improving the Water Quality Report:
More visuals, less text; infographics would be great.
Maybe include it with the bill; there was disagreement about this as some people pay online and don’t open their bills.
More graphs with easy to recognize data points.

28
Work with a graphic designer to make the information more visually appealing‐ perhaps a local art contest for artists to compete to be chosen to design it, etc.
One customer recommended the company “Acuity”, and suggested that the Authority look at their “stunningly beautiful” annual reports.
Make it more user friendly, something like the water conservation elephant commercials.
Maybe post a blurb on the news to educate Albuquerque on the excellent quality of their water.
Miscellaneous comments from Activity 2:
Our group discussed the timing of the survey with regard to the conundrum, and wondered whether there was a price hike or something else at this time.
One of the customers mentioned a “lack of engagement” in this day and age. It is easy for people to complain on a survey but not in real life.
Mark Kelly of the Water Authority informed us that the EPA regulates tap water more extensively than the FDA regulates bottled water.
The Water Authority should post a session like these customer conversations online; maybe offer a water credit/incentive for viewing short videos and taking a short “quiz” at the end; maybe offer $5 off bill.
You could let customers watch a 5 minute video online and ask 3 questions at end to confirm completion.
More people engage online and it would take less manpower than hosting an actual event like this Customer Conversation.
Meeting Date: 10/18/18 Recorder: Finn Knutson Facilitator: Sharon Gonzalez‐Alei Table #: 3
ACTIVITY 1: What Are Customers Experiencing With Their Tap Water? What customers were experiencing with regard to TASTE:
Customers noticed that the taste of their water seems worse now than it used to be.
Some customers also said that they don’t like the taste but don’t know why. What customers were experiencing with regard to ODOR:
Most customers said that on occasion they noticed a slight odor, but it was far from their primary concern.
Sometimes the water smells a little like chlorine.
This was not many people’s primary or even secondary concern.
29
What customers were experiencing with regard to APPEARANCE:
Every once in awhile, very rarely, one customer would notice that their water would come out brown.
Every once in a while, one customer’s water would look milky, but they said it was not because of air bubbles.
Often residue would collect on the underside of a few customers’ faucets and on their swamp coolers.
What customers were experiencing with regard to PRESSURE:
During certain times of the day water pressure would fall off.
This was the primary concern for many people at my table. Sometimes there is a huge lack of pressure, and other times the water pressure is fine.
This problem is worse in the summer. In addition to the above categories, customers were ALSO experiencing the following with regard to their tap water:
No additional concerns. Customers want the Water Authority to know:
Many of the green dots on the board are to indicate overall happiness.
One customer had no problems with any of the categories at all.
ACTIVITY 2: Assessing & Improving the Water Quality Report
Customers LIKED the following about the Water Quality Report:
Customers liked the amount of information provided to them through the Water Quality Report.
It has a good color scheme.
It contains good data.
It is good that the Water Authority is being transparent with their customers.
Customers did NOT LIKE the following about the Water Quality Report:
Customers really did not like how hard the report was to read.
They didn’t like the folding design, the small text, and the sheer number of things to look at.
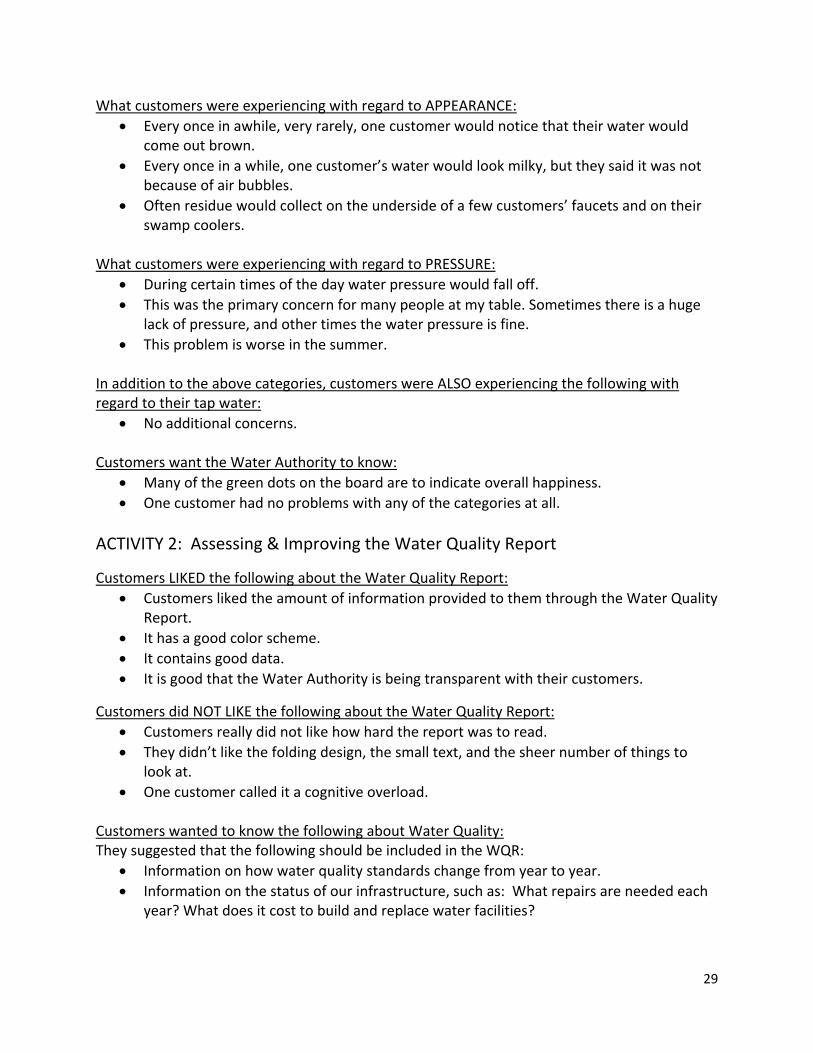
One customer called it a cognitive overload. Customers wanted to know the following about Water Quality: They suggested that the following should be included in the WQR:
Information on how water quality standards change from year to year.
Information on the status of our infrastructure, such as: What repairs are needed each year? What does it cost to build and replace water facilities?

30
Information on how our water compare to that of other cities (both from a quality and price standpoint).
Up to date information on the amount of chemicals (like fluoride) in our water.
Customers had the following ideas for improving the Water Quality Report:
Make it a booklet/book with a Table of Contents.
Must have a table of contents.
Make it easier to read and understand overall.
Customers suggested that the more important subjects and information should come first
Maybe it could have a few pages summarizing all of the hard‐to‐understand, overwhelming data.
Meeting Date: 10/18/2018 Recorder: Kendra Kozel Facilitator: Leslie Kryder Table #: 4
ACTIVITY 1: What Are Customers Experiencing With Their Tap Water? What customers were experiencing with regard to TASTE:
This was the biggest issue for the table.
Only 3/8 customers at the table drink straight from the tap.
Some customers were experiencing a chlorine and/or “strange” taste, on and off.
Some of the customers who experience a strange taste found that a Brita filter or water softening system seemed to help.
What customers were experiencing with regard to ODOR:
Some customers experienced a chlorine smell, on and off. These customers do not drink straight from the tap.
Two customers had called in about the odor and got advice which they found strange, like pouring Clorox down the drain.
One customer complained that her ice filter had a bad smell. What customers were experiencing with regard to APPEARANCE:
All customers reported clear, not milky, water! What customers were experiencing with regard to PRESSURE:
A few customers experienced occasional drops in shower pressure, usually in the morning.
Most customers agreed that the outside faucets had high pressure.

31
In addition to the above categories, customers were ALSO experiencing the following with regard to their tap water:
They were experiencing calcium deposits, calcium residue, and calcium‐related flavor.
Customers want the Water Authority to know:
They are satisfied with the Water Authority’s research in comparison to Tuscan, AZ.
They are mostly pleased with the aesthetics of the water!
ACTIVITY 2: Assessing & Improving the Water Quality Report 3.5 out of 7 customers read the Water Quality Report. Customers LIKED the following about the Water Quality Report:
The attention to detail and thoroughness.
The Lead and Copper program information.
The Customer Conversation section.
They like the physical paper that it is printed on.
The definition section for the terms used throughout the WQR.
One customer felt that it is effectively written, for customers to read, not researchers.
Customers did NOT LIKE the following about the Water Quality Report:
That there were no zones listed in regards to water quality.
It is overwhelming (too much information).
Some feel that it is wasting paper.
There was no information on plastic, pesticides, Round‐Up, or glyphosine in the water.
Customers wanted to know the following about Water Quality: They suggested that the following should be included in the WQR:
Information on all that the Water Authority has accomplished.
Information about whether the Water Authority going to commit to the groundwater program.
They wanted to know more about the following in general (not necessarily that it be included in the WQR):
Is the Water Authority going to use the same standards as the federal water authority? Customers had the following ideas for improving the Water Quality Report:
They suggested printing something with a smaller scale, such as an executive summary.
They suggested adding yearly trends.
Perhaps an electronic alternative to the paper version.
A different format would help.
Meeting Date: 10/18/18 Recorder: Kiera McNary

32
Facilitator: Kymberly Johnson Table #: 5
ACTIVITY 1: What Are Customers Experiencing With Their Tap Water? What customers were experiencing with regard to TASTE:
A majority of the customers reported that they enjoyed the taste of their water.
One customer described the taste of the water that comes from their tap as having a “pond water” like taste; this customer says that this problem with taste is often alleviated by refrigerating her water, or by filtering her water in a water bottle with “crystals”.
What customers were experiencing with regard to ODOR:
A majority of the customers reported that they had no problems with the odor of their water.
One customer described the odor of the water that comes from their tap as smelling like a “swamp” or like “pond water”; this customer is the one who also had the issue with the taste of the water and said that the taste and the odor seem to be related.
What customers were experiencing with regard to APPEARANCE:
All of the customers were pleased with/had no problems with the appearance of their water.
What customers were experiencing with regard to PRESSURE:
All of the customers were pleased with/had no problems with their water pressure.
In addition to the above categories, customers were ALSO experiencing the following with regard to their tap water:
Some customers were curious about the color of their tap water.
Some were concerned with the levels of chlorine, fluoride, and other chemicals in their tap water; some of these customers thought that fluoride in the water should be a choice, where customers can “opt in” or “opt out” to having fluoride added to their drinking water.
Customers were also wondering how “necessary” it is to filter their water. They wondered whether it was purely for aesthetic purposes, or if it had health benefits or gave their water a better taste.
Customers want the Water Authority to know:
They are slightly concerned about the chemicals being put in their drinking water.
ACTIVITY 2: Assessing & Improving the Water Quality Report 3 out of 5 customers read the Water Quality Report.

33
Customers LIKED the following about the Water Quality Report:
Customers liked the places where the fonts were bold because it was a great way for the reader to focus on specific information/topics on the report.
They liked the colors. One customer said that it was “visually appealing” and “soothing” to read.
They liked that it covered a lot of material.
They liked the graphics.
Customers did NOT LIKE the following about the Water Quality Report:
Customers thought that the report was too large and even a bit awkward to hold.
They felt it contained too much information.
The writing was a bit small.
Customers also thought that the cost of mailing may have been a bit high considering that only 40% of people read the WQ Report.
Customers wanted to know the following about Water Quality:
They wanted to know more about how ABQ water compares to other cities and states, or even other countries.
They wanted to know more about the standards for water quality.
Customers had the following ideas for improving the Water Quality Report:
Customers suggested that the WQ report should be smaller and highlight the most important aspects of the report, with the option to read more information on the ABCWUA website.
Use larger font.
Make the report smaller and easier to hold.
Provide a possible incentive for going online to read more about the WQ report (one customer said she would go online and read more for just $1 off her water bill).
Customers could have the option to “opt in” to receiving the WQ report.
The Report could be split up into small sections that could be included in monthly bills.
It should include more graphs.
It could include a personal spotlight on a person working in the company, as it would make it more personal.
Meeting Date: 10/18/18 Recorder: Cole Garcia Facilitator: Ed McCorkindale Table #: 6
ACTIVITY 1: What Are Customers Experiencing With Their Tap Water? What customers were experiencing with regard to TASTE:
Some customers said their water tasted metallic at their homes in the North Valley.

34
All other participants have no complaints with taste at their homes, though a few of the customers complained of a “Chlorine” taste in public fountains.
The table agreed that the taste was inconsistent with their high expectations. What customers were experiencing with regard to ODOR:
The same customers who complained of a foul taste also complained of a fishy/ swampy/”rivery” odor when the tap first turns on. The odor stops after running the tap for a few moments. This complaint came from the North valley region.
What customers were experiencing with regard to APPEARANCE:
A majority of customers claimed their water would precipitate particles when it sat in a stagnant container such as a pitcher, toilet, etc. These complaints came from customers in the North Valley region.
Customers also complained about the amount of calcium that was in their water, and one customer noted that they had “lots of calcium build up where water flowed.” This complaint came from the East Mountain area.
What customers were experiencing with regard to PRESSURE:
A majority of customers deemed the water pressure to be great.
North Valley customers said that their pressure was too high, and that it once caused their pipes to burst.
In addition to the above categories, customers were ALSO experiencing the following with regard to their tap water:
All other aspects of the customers’ water were agreed to be acceptable. Customers want the Water Authority to know:
Participants wanted the authority to know that that they all used filtered tap water.
ACTIVITY 2: Assessing & Improving the Water Quality Report Customers LIKED the following about the Water Quality Report:
The customers like the amount of information that was included, and how comprehensive it was. They appreciated that information they would not have thought to ask about was included, like the copper/ lead section and the fact that the Water Authority performs additional tests that are not required by the EPA.
They appreciated the visual diagrams.
They appreciated the “Definitions” section that was in the report. Customers did NOT LIKE the following about the Water Quality Report:
They complained that the report was too dense and difficult to digest. A customer stated, “We’re not scientists, I don’t know where to even start in this report.”

35
Participants did not like the size of the report, and claimed it was awkwardly large and uncomfortable to read. They felt that the paper is too large, word fonts are too small, paragraphs are too large, and word color makes it harder to read.
They did not like the charts/ tables, and said they did not contribute to their understanding of the report’s information.
Customers wanted to know the following about Water Quality: They suggested that the following should be included in the WQR:
Customers wanted to know what percentage of their water came from the river, a well, was imported, or reused.
They wanted to know more about the following in general (not necessarily that it be included in the WQR):
Customers wanted to know if there was a geographical difference that affected the taste, odor, and appearance of their water.
They wanted to know how consistent the water quality was throughout the city.
Participants wanted to see a location map that showed the quality of water in their area. (They later found out that the authority already provides this service.)
They wanted to know if the storage tank level affected the quality of water.
Customers wanted the Water Authority to know that readers will only get out what they put into reading the report, and that with the current format, readers are not putting much effort into reading it.
Customers had the following ideas for improving the Water Quality Report:
Customers wanted to see the report in a better format. They suggested converting it to standard paper size, and using more visible font colors and larger fonts.
They wanted to see more advertisement for the report, and thought the Authority should run ads on TV during the news, perhaps on radio, and in their bills.
The report should include more URL’s that would provide the reader with more opportunities to connect with information. They specifically asked for the “/waterquality” link to be included in the physical report.
Meeting Date: 10/18/18
Recorder: Juliet Smith
Facilitator: Kathleen Oweegon
Table #: 7
ACTIVITY 1: What Are Customers Experiencing With Their Tap Water?

36
What customers were experiencing with regard to TASTE:
● Two customers from the same household located in the Southeast quadrant reported that their water had a strong chlorine taste when they did not use a filter.
● One customer from the Northeast quadrant stated that they were used to the taste and felt neutral about it.
● A customer using a Brita filter reported that their water tasted better when there was a fresh filter as opposed to an old one.
● One customer found no difference in taste between her tap water and her refrigerator filtered water.
● One customer appreciated the taste of their unfiltered water over the taste of unfiltered water from other states (Arizona was the only specific state mentioned).
What customers were experiencing with regard to ODOR:
● The majority of customers reported a neutral opinion on the odor and said they never smelled anything unusual.
● The same customers from the Southeast household that reported the chlorine taste reported a slight odor of chlorine.
What customers were experiencing with regard to APPEARANCE:
● Every customer reported positive or neutral experiences with their water appearance. ● One customer noted that they never saw any discoloration or particulates.
What customers were experiencing with regard to PRESSURE:
● All customers reported having no issues with their water pressure.
In addition to the above categories, customers were ALSO experiencing the following with regard to their tap water:
● A customer wanted more information on what to do and who to call in a water emergency. This customer said they’d had an emergency with their private water and when they called the Water Authority they were told that since it was not city‐owned water it was not the Water Authority’s responsibility.
● There was a request for the Water Authority to alert customers when they are doing work nearby and may be shutting off the water.
● A customer wanted to know which household water filter was recommended by the Water Authority. A water expert came by and explained that the water is ready out of

37
the tap and no filter is needed. In fact they mentioned how some filters remove positive minerals from the water.
Customers want the Water Authority to know:
● Customers felt that the conundrum may be due to a general distrust of government or corporations because of recent events like Flint. They believe that the distrust comes from hearsay instead of people’s personal experiences with the water.
● A customer added that because people are more aware of current water issues, it could be that distrust is leading to dissatisfaction.
ACTIVITY 2: Assessing & Improving the Water Quality Report
2 out of 4 customers regularly read the Water Quality Report, and the other 2 skim it.
Customers LIKED the following about the Water Quality Report:
● A customer that reads it regularly liked how comprehensive it is. ● Two customers loved the visuals and graphics and say they start at the pictures when
they read the report. ● They like the Customer Involvement section, and how the report shows signs of follow‐
up from past discussions. ● The water conservation section. ● The large amount of information.
Customers did NOT LIKE the following about the Water Quality Report:
● Too much information that is hard to grasp. ● Too technical for the average person to understand. ● There is not enough explanation about why certain compound elements go up or down
between years/reports. ● There is no explanation about what the data means. ● Where the report indicates that higher amount of elements were found, nothing is said
about what the Water Authority did about it. ● There is no clear comparison between our water and the regulatory limit for various
elements and compounds. The report should say what the limit is and how we compare. ● It’s not clear what the numbers actually mean.
Customers wanted to know the following about Water Quality:
They suggested that the following should be included in the WQR:

38
Information on how our water compares to regulatory limits.
The awards and accomplishments that we have received.
How our water compares nationally and globally.
Customers had the following ideas for improving the Water Quality Report:
One customer remembers an older WQR that had a helpful diagram/chart and would like more of those included in the current WQRs.
To decrease the density of the reports, a customer suggested excluding the known facts and most basic information from the WQR, and offering those online instead.
Focus on new information.
Include a section on what customers can do to help keep the water clean, such as the proper disposal of pharmaceuticals.
Limit the amount information by referring people to the Water Authority website for the more dense information.
Meeting Date: 10/18/18 Recorder: Tristan Van Cleave Facilitator: Sara Sanasac Table #: 8
ACTIVITY 1: What Are Customers Experiencing With Their Tap Water? What customers were experiencing with regard to TASTE:
The primary concern for taste was a noticeable chlorine taste in the water.
One customer noted that her water tasted particularly heavily of chlorine in the North East Heights area.
One customer remarked that the taste of chlorine was more apparent in the mornings. What customers were experiencing with regard to ODOR:
Again, the primary concern was chlorine but this time the odor of chlorine.
One customer noted that at times her water would smell rather “foul” in addition to the smell of chlorine.
What customers were experiencing with regard to APPEARANCE:
Many customers noted that the “cloudy” or “milky” appearance was of concern, but agreed that it was less of a concern after it had been explained by the Water Authority during the presentation.
Two customers noted that they sometimes experienced sediment in their tap water. What customers were experiencing with regard to PRESSURE:
Some customers experienced pressure issues.

39
One customer noted that pressure would sometimes be lower in the mornings, and then improve in the afternoon; this prompted a Q&A with Mike Richardson of the Water Authority, who explained that water pressure is provided by gravity with the use of water tanks. These water tanks are refilled between the hours of 3:00AM and 8:00AM for use the next day, and water pressure is regulated for an average 70 psi. Mike explained that old piping can affect water pressure when multiple faucets are used at once.
In addition to the above categories, customers were ALSO experiencing the following with regard to their tap water:
Some customers expressed concern about the hardness of the water, and several customers said that they used water softeners at home to combat this issue.
One customer was concerned with the chemicals that the water authority adds to the water and expressed that they choose to purchase bottled spring water/sparkling water as an alternative.
Customers want the Water Authority to know:
Customers agreed that the a section for hardness of water should be added to the concern chart; they felt it was an important area of concern that was left out.
One customer felt that too much calcium carbonate was being added to the water supply which “builds up in swamp coolers and pipes”, and could be a cause for concern.
ACTIVITY 2: Assessing & Improving the Water Quality Report 4 out of 6 customers read the Water Quality Report. Customers LIKED the following about the Water Quality Report:
Customers like the level of detail.
The report “looks impressive”, due to how concise and well organized it is.
They noted that the font size was “good”.
They liked the amount of contact information listed.
They found the info‐graphics helpful. Customers did NOT LIKE the following about the Water Quality Report:
Some customers felt that there was “too much information”.
They unanimously felt that the Report was hard to navigate due to the fold‐out design.
Customers expressed that more color might make it easier to follow, because the current design is very mono‐colored.
Customers wanted to know the following about Water Quality: They suggested that the following should be included in the WQR:
One customer thought that the WQR should include a complete list of chemicals added to the water in the treatment process, and also information about what mistakes (if any) have been made in the water treatment process.

40
One customer suggested that data relating to the allocation of funds collected from the customers should be transparent. For instance, the amount of a customer’s bill that goes to each service, etc.
Customers had the following ideas for improving the Water Quality Report:
Many customers suggested that a booklet style format would be far better than the fold‐out design.
Some customers suggested that more charts and graphs should be used, particularly pie charts.
One customer suggested that the WQR should be “written at a fifth‐grade level” so that it would be more accessible to a greater number of people; for this same reason, another customer suggested that it should be condensed.
It was suggested again that a breakdown of “what the customer is paying for” should be included in the WQR.
Meeting Date: 10/24/2018 Recorder: Dipendra Humagain Facilitator: Sara Sanasac Table #: 1
ACTIVITY 1: What Are Customers Experiencing With Their Tap Water? What customers were experiencing with regard to TASTE:
One of the 4 customers at the table did not drink our water as a personal choice, so does not know how it tastes.
One rarely drank it and had no comment about the taste.
The two that do drink water from the tap had no issues with the taste. They would have liked it colder, if possible.
What customers were experiencing with regard to ODOR:
No issues regarding odor. Customers commented that it was great. What customers were experiencing with regard to APPEARANCE:
One of the customers was experiencing “rusty looking” water every time the fire department was at the hydrant across the street from their house. This was apparently happening once or twice a year, and the customer was curious about what was going on.
The other customers were satisfied with the water’s appearance. What customers were experiencing with regard to PRESSURE:
All customers were happy with their water pressure.

41
In addition to the above categories, customers were ALSO experiencing the following with regard to their tap water:
Customers mentioned the hardness of water; two of them have been using softener and one is using a filter at their house.
Customers want the Water Authority to know:
They wondered if there is a way they could find how much of their water was used each week to avoid an unexpectedly high water bill at the end of the month.
With regard to solving the Water Quality Conundrum, they were interested in finding out how our customer surveys were carried out. They wanted to know how the survey worked and how the data was collected. The felt that perhaps the survey did not target the right customers.
ACTIVITY 2: Assessing & Improving the Water Quality Report 0 out of 4 customers read the Water Quality Report. Customers LIKED the following about the Water Quality Report:
They liked the idea of WQR and the detail explanation it contained.
They liked the presentation and the slides on WQR during the customer conversation which helped them understand WQR better.
They liked the Authority’s commitment to meeting/exceeding the EPA standards and to their water quality.
Customers did NOT LIKE the following about the Water Quality Report:
The Report is too big and has too much information.
The data and information provided are difficult to understand.
Customers wanted to know the following about Water Quality:
They would like us to keep up with the EPA’s standard. They are fine with a reasonable increase in cost to maintain the quality of water while following the EPA standard.
They wanted to know if we are responsible for the water supply in Corrales. One of the customers did not like the water’s appearance from Corrales, and said that “it looked dirty”.
They would like the Authority to have more customer conversations. They were more likely to drink our water now as their questions had been answered and they understand WQR better.
Customers had the following ideas for improving the Water Quality Report:
They would like the information easily accessible to them. They would prefer information on where to go and look for the report/data whenever they want to, rather than having it sent it to them.
They would like the report to be more condensed.

42
They would prefer each water bill come with some part of WQR (a different category every month) instead of having to read such a huge amount of information at one time; i.e., create 12 bulletins for WQR and send it with water bill every month.
Invite the media to the Customer Conversations to help get word out to people about the Authority’s good work; perhaps run some ads on TV/radio to show all of the efforts regarding water quality.
The Authority should represent itself at other events and organizations, and let the community know more about their good work.
Meeting Date: 10/24/18 Recorder: Kelsey Bicknell Facilitator: Kathleen Oweegon Table #: 2
ACTIVITY 1: What are customers experiencing with their tap water? What customers were experiencing with regard to TASTE:
Everyone was pleased with their taste; it was described as “good”.
One customer noted that they had had no issues in the 20 years they had been in their home.
One person had an issue with a strong chlorine taste at the gym (Define Fitness on Coors and Montano).
What customers were experiencing with regard to ODOR:
Customers were pleased with the smell overall.
One customer reported occasionally (not even once a year) experiencing a sewer gas smell from the faucet.
The same gym noted above had an issue with the chlorine smell.
What customers were experiencing with regard to APPEARANCE:
Some customers have had the milky (very bubbly) water every once in awhile. No specific timeframe for this was mentioned.
What customers were experiencing with regard to PRESSURE:
No concerns were reported; everyone was pleased with their water pressure. In addition to the above categories, customers were ALSO experiencing the following with regard to their tap water:
Some customers were slightly concerned with the hardness of their water, and wanted to know what they can do about it.
One customer wanted to know where hard water areas are in Albuquerque.
They would like to know that the Wastewater Division is responding to complaints filed by the community.

43
Customers want the Water Authority to know:
The tap water is great in their homes.
They’re very happy with their service.
ACTIVITY 2: Assessing & Improving the Water Quality Report 1 out of 4 customers read the Water Quality Report. Customers LIKED the following about the Water Quality Report:
They liked the size of the headings on the document; this made it easy to identify what was important.
Good information was provided.
They liked the section on the health effects of certain substances in the water.
They liked the fact that the Water Authority provides the report at all.
Customers did NOT LIKE the following about the Water Quality Report:
Acronyms were not clearly defined in at least one section, and their meaning was not fully explained.
There was too much text.
The layout of the report was awkward.
Customers wanted to know the following about Water Quality:
They would like to see local water quality reports (by district or zip).
They would like to know about local hardness issues (by district or zip).
They’d like to hear more about the history of water quality, i.e., what did the quality look like five, ten years ago?
They wanted to know whether water quality information was on the water bill.
Customers had the following ideas for improving the Water Quality Report:
An executive summary should be provided at the beginning so customers would know what was most important in the entire document.
Include a comparison of ABQ vs. national standard water quality.
They think that information about and a link to the report should be obvious on website.
Create localized reports, either online or hardcopy, so that the report could be tailored, at least in aspects like water quality, to the area in which the customer lives.
The report could be sent via email.
Add a reference table for units and abbreviations and explain the meaning of them.
Add a map that can be used to see water quality in all of ABQ.
Add historical information about water quality (last five to ten years).
Provide large stacks for apartment dwellers/non‐homeowners.
Make the report briefer and more condensed.
Add landmarks to the maps.

44
Most of the text should be located on the website, and most of the figures with captions should be on report; that way people can read more if they want to.
Write it in layman’s terms so it anyone could read and understand it.
If this design is what will be used again, add arrows to indicate how to open pamphlet.
Change it to a booklet form.
Offer an app for water quality information and access to the report.
Customers should be able to opt‐in on the Authority’s website to receive the report via email, mail or both.
Put water quality reports on the bill which would ensure that it is the first thing a customer sees when they open the bill.
Add a section describing where medications, electronics, and chemical waste can be taken and disposed of properly; this should be made obvious on bills and on the report.
Meeting Date: 10/24/18
Recorder: Cassia Sanchez
Facilitator: Ed McCorkindale
Table #: 3
ACTIVITY 1: WHAT ARE CUSTOMERS EXPERIENCING WITH THEIR TAP WATER?
What customers were experiencing with regard to TASTE:
One customer has noticed a chlorine/bleach taste; they use a Brita filter for their drinking water.
One customer mentioned that they do not ever buy bottled water, as they were happy with taste.
Some customers enjoy the taste of minerals in water.
3/7 use Brita filter or fridge filter for drinking water, as they felt it gives a “smoother” taste, and makes better tasting coffee.
What customers were experiencing with regard to ODOR:
A customer noted a chlorine/bleach smell; they used a Brita for drinking water, but notice the smell in the shower, the washer, and when brushing teeth.
What customers were experiencing with regard to APPEARANCE:
Some notice hard water staining on fixtures or shower.

45
Customers generally thought the water has a great appearance.
What customers were experiencing with regard to PRESSURE:
A customer noticed different pressure when living in a different part of the City; now they experienced low pressure.
A customer commented that they notice lower pressure as new construction occurred in neighborhood.
In addition to the above categories, customers were ALSO experiencing the following with regard to their tap water:
There was mention of hard water with white residue left on fixtures and shower doors.
Customers want the Water Authority to know:
One customer noticed a rate change and increase in water bill since new meter was installed.
With regard to the Water Quality Conundrum, customers wanted to know what the demographics were of the current complaint calls. They felt that sharing information with neighbors via social media on NextDoor or Facebook might improve the trend.
One participant has noticed better service since ABCWUA split from City of Albuquerque.
ACTIVITY 2: Assessing & Improving the Water Quality Report Of the 7 customers at the table, 3 read the entire Water Quality Report, 2 read some of it, and 2 do not read it.
Customers LIKED the following about the Water Quality Report:
Customer like the data drill down.
They like the unfolding concept if you prefer to “dig in”.
They liked the inclusion of the water source map, as knowing where their water comes from is interesting.
Customers did NOT LIKE the following about the Water Quality Report:
It takes a lot of time to get through the entire report.
The report is too chart‐intensive.
You have to read it in customer conversations in order to understand it.
It can seem boring.
It is too data intensive.
Some do not care for the format.
It’s overwhelming.

46
Customers wanted to know the following about Water Quality
They would like to see a comparison to other utilities.
Use Flint, MI as an example of what not to do.
Customers had the following ideas for improving the Water Quality Report:
Make the report more condensed, and make it clear that “here is where we start, where we get to, and it’s very safe water.”
Make it a better format to follow; perhaps use an advertising firm.
Put an attention grabber at beginning, with fun facts.
Post good news; shine attention on the ABCWUA by adding a section about awards and other recognitions received by the Authority.
Reduce the amount of information given, and refer customers to the website to get more detailed data and info if they want it; that way some customers could really “dig in” to required data that the average person may not be interested in.
Add a tagline to create draw‐in in order to reach all types of people; strategies to entice readers might be to include something like, “Did you know you are drinking award winning water?” Also, mention 3rd Place in Nation for best tasting water, etc.
Add a table of contents so readers can easily go to sections of interest.
Consolidate the report to 8.5”x11”.
The Water Quality Line should be more prevalent in the report.
Meeting Date: 10/24/18
Recorder: Cole Garcia
Facilitator: Kymberly Johnson
Table #: 4
ACTIVITY 1: What are customers experiencing with their tap water?
What customers were experiencing with regard to TASTE:
● Customers stated that their water tasted “old”, “stale”, and “soapy”; due to this, these customers complained that their water was not refreshing.
What customers were experiencing with regard to ODOR:
● All of the participants stated that their water had a raunchy smell in the morning.

47
What customers were experiencing with regard to APPEARANCE:
Customers did not like the residue left on fixtures as a result of hard water.
What customers were experiencing with regard to PRESSURE:
● A participant complained that their water had weak pressure.
In addition to the above categories, customers were ALSO experiencing the following with regard to their tap water:
● An overall complaint that everyone agreed on was the hardness of their water, as it caused shower heads, faucets, etc., to become clogged by the calcium build‐up.
Customers want the Water Authority to know:
● A member of our table felt as if the Authority was not communicating the water testing results adequately.
ACTIVITY 2: Assessing & Improving the Water Quality Report
Customers LIKED the following about the Water Quality Report:
Customers liked the information in the report about what was in our water.
They liked the “Current Concern” section showing our water levels as compared to what is legally required.
They liked the section that teaches us how to conserve.
They liked that it is a hard copy.
Customers did NOT LIKE the following about the Water Quality Report:
Our table did not like how dense the document was, and felt it was confusing.
They did not like the use of terminology of measurements such as “mg/L, parts per billion”, etc.
They felt that the tables as provided in the report were not helpful in conveying information because there was too much information in them.
Customers stated that the information was not conveyed in a continuous way, and that the report felt “chunky” to read.

48
Customers wanted to know the following about Water Quality:
Customers at the table wanted to know what their water levels are at their house, not just in their neighborhood or section of town.
They wanted to know when/where all of the testing was done.
They wanted to know what awards we won and when, and by how much we exceeded the standards.
They wanted to know how safe the water was and how much it costs to sustain our water quality.
They wanted to know what minerals are in their water and how those levels affect the overall quality of the water.
Customers had the following ideas for improving the Water Quality Report:
The reports could be communicated in a better way, possibly releasing a monthly, mini “bite sized” report in their bills.
Make it a smaller pamphlet (much like the Costco handout).
There was a suggestion that the WQR be expanded into video format that may be played on local TV.
Our water awards and water quality info could be included in the #NewMexicoTrue ads.
They wanted to see more photos/diagrams that are easier to understand for the general public.
Smaller, less dense pamphlets should be included in people’s bills (physical and digital).
They want to see a phone‐friendly version. This would not only be convenient but it would also satisfy one customer's request to go green.
To better convey the information, participants wanted to see an executive summary. In the summary, information should be listed in order of importance.
The customers wanted to see more of the Sherdrop Holmes droplet character, possibly in an educational cartoon or skit.
They want the entire report to be more fluid and continuous, to make it easier to read.
Meeting Date: 10/24/18 Recorder: Finn Knutson Facilitator: Leslie Kryder Table #: 5
ACTIVITY 1: What Are Customers Experiencing With Their Tap Water? What customers were experiencing with regard to TASTE:

49
There were comments about bad taste in general; it has gotten better over the years but is still of some concern.
A few said that they thought that it had a bad taste from chlorine.
Several of the customers don’t like the taste of the minerals in the water.
One customer said that they had no real issue with the taste at all.
One customer said that they thought the taste was extremely good. What customers were experiencing with regard to ODOR:
A few customers said that the smell of the water was bad due to the chlorine.
What customers were experiencing with regard to APPEARANCE:
No one had any concern with the appearance of the water. What customers were experiencing with regard to PRESSURE:
A few customers said that they had issues with low pressure throughout the house.
One of these customers said that he thinks it was due to low‐flow spigots.
Some customers said that they had no issues with their pressure and if anything, their pressure was too high.
Another customer said that they used to have very high pressure, but one day their pressure dropped and hasn’t been the same since.
In addition to the above categories, customers were ALSO experiencing the following with regard to their tap water:
One customer said that they had no issues with any of the categories above.
Four of the seven customers at the table regularly use a filter.
All customers are more concerned with the extreme hardness of the water than the odor, appearance, or pressure.
Customers want the Water Authority to know:
One customer said that they thought the water quality in general was better in the East side of town.
ACTIVITY 2: Assessing & Improving the Water Quality Report
Customers LIKED the following about the Water Quality Report:
Customers really liked that the report is extremely comprehensive, and they enjoy knowing about the extra steps the Water Authority is taking to ensure safe drinking water.
The customers said that the visuals are very good. Customers did NOT LIKE the following about the Water Quality Report:
It is too overwhelming; the information presented is too scientific for the average reader, and the information is too packed together and hard to read.

50
The report is too complex in general.
Customers did not care for the folding design format of the report, and said it was awkward.
They felt that some of the terminology was unclear. Customers wanted to know the following about Water Quality:
What parts of the report are required?
How many customers does the ABCWUA report to? Customers had the following ideas for improving the Water Quality Report:
Make the report easier to read and understand.
Make the report modular, or smaller.
Simplify the information so that it is less overwhelming and easier to grasp; maybe cut out some of the information.
Make it into a booklet, magazine, or in the format of a Costco flyer.
Give it page numbers and a table of contents.
Include summaries so it is easier to skim over while reading.
Include familiar cartoon figures.
Make it available in more languages.
Use larger font.
Put simple information up front and the more complex graphs in the back. Meeting Date: 10/24/18 Recorder: Tom Heller Facilitator: Sharon Gonzalez‐Alei Table #: 6
ACTIVITY 1: What Are Customers Experiencing With Their Tap Water? What customers were experiencing with regard to TASTE:
• One customer did not know what it was specifically, but they used to live in Colorado and felt that the water seemed more clean and fresh there.
• Several customers were concerned that the Kirtland spill might have something to do with water taste. Expert Diane Agnew informed them that the water from wells near Kirtland is very safe.
• One customer noted that there was a “different” taste, maybe from chlorine, that persists even after they use a filter.
• One customer thought that ice tasted funny when they made it from tap water. • One customer stated “I taste something regularly in the water.”
What customers were experiencing with regard to ODOR:

51
• A customer felt that dissolved solids were causing an odor, and said that they had noticed a big difference when they moved from the East side to the West side.
• Two customers noted there was a bad odor when the faucet is first turned on, and first thing in the morning.
What customers were experiencing with regard to APPEARANCE: • A customer noted that dissolved solids in the water cause a lot of buildup, and that they
notice it more on the West side since they moved from the East side. • One customer commented that there was a milky appearance.
What customers were experiencing with regard to PRESSURE:
• One customer who lives in Santa Fe Village said they have really poor pressure. • A customer who lives in the far Northwest said they have very high pressure, and that
they would consider getting a pressure reducing valve (PRV) if they weren’t so expensive.
• One customer suggested that there should be a rebate for installing a PRV. In addition to the above categories, customers were ALSO experiencing the following with regard to their tap water:
• Many at the table noticed that dissolved solids from hard minerals were causing calcium buildup. One customer said that they had installed an electric device to reduce scale.
• One customer had no aesthetic problems or issues with the tap water in his home.
ACTIVITY 2: Assessing & Improving the Water Quality Report Out of 6 customers, 2 actively read the report, 2 only scan it, and 2 only notice/glance at it. Customers LIKED the following about the Water Quality Report:
• They like that the report shows what’s in their water. • The ‘Securing our Water Future’ section. • The diagrams showing the water sources and distribution system.
Customers did NOT LIKE the following about the Water Quality Report:
• “It’s overwhelming”. • They felt it needs pie charts showing what is in their drinking water. • One customer said that “it’s not very readable” (though other customers said the
readability is fine). • It looks too much like junk mail, and might get thrown out. • They feel that some readers will not understand what it says. • The graphs could use more explanation.
Customers wanted to know the following about Water Quality: They suggested that the following should be included in the WQR:
• Information about water hardness and dissolved solids and minerals that contribute to hardness.

52
• Tips to help with taste and quality, such as what types of filters to use or other tricks. • Information about how to read water bills. • Updates on the status of the aquifer.
Customers had the following ideas for improving the Water Quality Report:
• The report should show everything in water, even if it’s not harmful. • The sections should be better differentiated, and set up more like a newspaper with
pages to flip. • Pie charts would be helpful rather than just numbers showing what’s in the water. • It could use more color. • The report should lead with the water quality awards and other accomplishments of the
water utility. • Indicate on the report why it’s important to read it, or better display what it’s about,
such as a picture. No one recognizes the Water 2120 diagram, and there isn’t enough on the front page to get people to care more about it.
• There should be some other kind of notice that the water quality report will soon be coming in the mail, like a TV ad or newspaper story. This will alert customers so they will be looking for it, and not just throw it out.
• There should be more of an incentive to read the report, such as: o Some kind of game, like find every water droplet through the report and enter to
win a prize. o Some kind of provocative statement up front, like “Top 5 Water Quality
Concerns… Answered!” Meeting Date: 10/24/18 Recorder: Paulina Aguilera‐Eaton Facilitator: Heidi Howley Table #: 7
ACTIVITY 1: What Are Customers Experiencing With Their Tap Water? What customers were experiencing with regard to TASTE:
The overriding sentiment was that there are no taste complaints.
One couple is accustomed to fresh spring water and prefers that taste to the taste of tap water. This couple also indicated they notice a chlorine taste to the water.
Four other customers indicated that they use some kind of filtration system (built in to faucet or pitcher style) and prefer the taste of filtered water to unfiltered.
What customers were experiencing with regard to ODOR:
No odor complaints as pertain to drinking water.
One couple wondered if the stinky water at the bottom of the water heater was due to the water as supplied or was due to the heater. An expert came by and discussed water heaters with the couple.

53
What customers were experiencing with regard to APPEARANCE:
No significant complaints about appearance were expressed at the table.
One participant indicated that when their water is first turned on, it does have a milky appearance which dissipates with time.
Most people used filters and indicated that this seemed to improve any milky appearance.
One participant indicated that when he leaves town for more than 7 days, he turns off the main valve. When he turns it back on, the water is quite milky, but improves with time.
What customers were experiencing with regard to PRESSURE:
One couple who lives in the Sawmill neighborhood complained of excessive pressure. A Water Authority expert explained the cause of high pressure and the role of pressure regulators. Another expert indicated that the couple could call customer service to learn more about what the pressure is at their home.
In addition to the above categories, customers were ALSO experiencing the following with regard to their tap water:
Customers expressed frustration with hard water. About half used a water softening system.
Customers want the Water Authority to know:
Overall, customers feel satisfied with their water and the accessibility of information.
ACTIVITY 2: Assessing & Improving the Water Quality Report 2 out of 6 customers read the Water Quality Report. Customers LIKED the following about the Water Quality Report:
The report is very thorough.
The report simplifies a complicated subject.
High level of detail.
The report addresses long term planning.
The graphics provide a good illustration of systems.
Customers did NOT LIKE the following about the Water Quality Report:
The layout (foldout format) is confusing and difficult to follow.
Customers wanted to know the following about Water Quality: They suggested that the following should be included in the WQR:
Customers would like to see a graphic that illustrates the relationship between what they pay and how the money is used – infrastructure, operations, etc.

54
Customers would like to know more about what the Water Authority does about watershed protection.
Customers would like more information about board meetings – when, where, and are they invited?
They wanted to know more about the following in general (not necessarily that it be included in the WQR):
Is the report available digitally?
Is there monitoring for pesticides, radioactive waste, and jet fuel?
Customers wanted to know the status of fracking?
Customers wanted to understand more about the “renewable” nature of the water supply.
Customers had the following ideas for improving the Water Quality Report:
Customers would prefer a booklet format over the foldout format.
It would be helpful to have tabs to delineate different sections.
Customers would like to see color used to mark different sections and ideas.
Include links to digital resources if they want to learn more about a certain subject.
Customers would like to understand how they relate to the plan; i.e., in the Water 2120 graphic, where do the customers fit in?
Explain how customers can help with water quality and water conservation. Let customers know about volunteer opportunities, and how they can get involved.
Include FAQ’s.
Offer translations or translation services to Native speakers. Languages highlighted were Navajo and Pueblo (Sandia, Isleta, and Santa Ana).
Meeting Date: 10/24/18
Recorder: Jenny Potter
Facilitator: Keith
Table #: 8
ACTIVITY 1: What Are Customers Experiencing With Their Tap Water?
What customers were experiencing with regard to TASTE:
● One customer was experiencing a minimal chlorine taste, but they just let the water sit for a minute and it was fine.
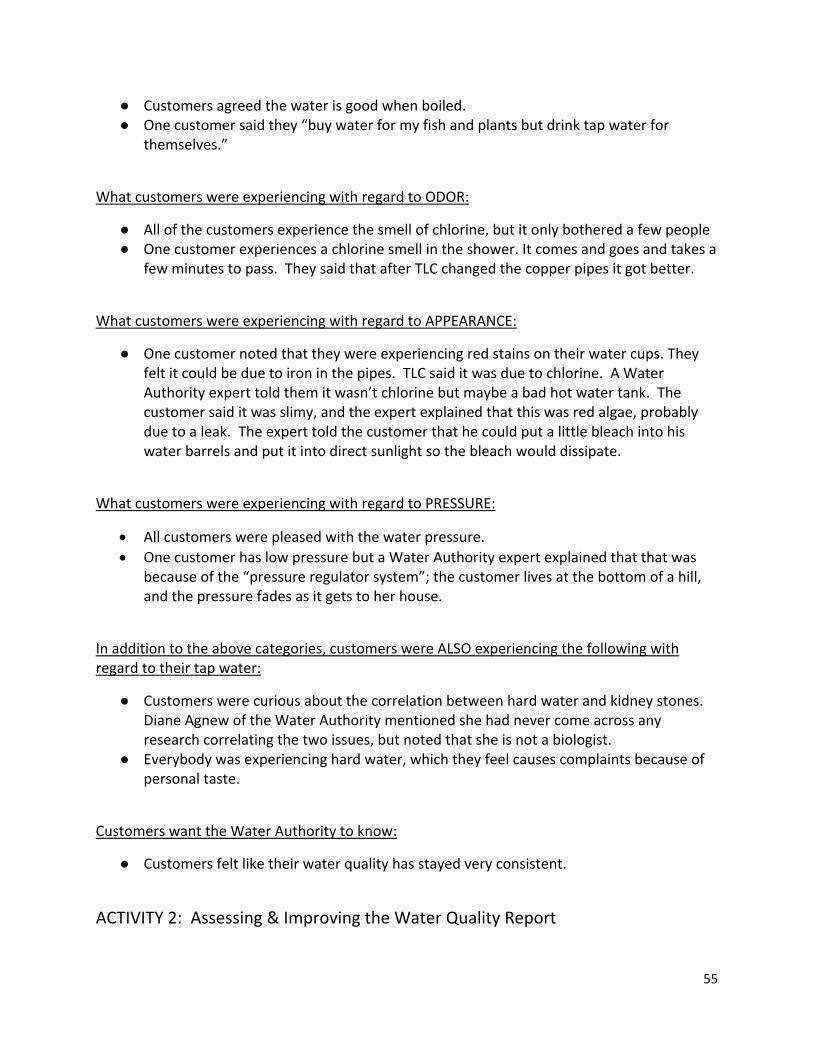
55
● Customers agreed the water is good when boiled. ● One customer said they “buy water for my fish and plants but drink tap water for
themselves.”
What customers were experiencing with regard to ODOR:
● All of the customers experience the smell of chlorine, but it only bothered a few people ● One customer experiences a chlorine smell in the shower. It comes and goes and takes a
few minutes to pass. They said that after TLC changed the copper pipes it got better.
What customers were experiencing with regard to APPEARANCE:
● One customer noted that they were experiencing red stains on their water cups. They felt it could be due to iron in the pipes. TLC said it was due to chlorine. A Water Authority expert told them it wasn’t chlorine but maybe a bad hot water tank. The customer said it was slimy, and the expert explained that this was red algae, probably due to a leak. The expert told the customer that he could put a little bleach into his water barrels and put it into direct sunlight so the bleach would dissipate.
What customers were experiencing with regard to PRESSURE:
All customers were pleased with the water pressure.
One customer has low pressure but a Water Authority expert explained that that was because of the “pressure regulator system”; the customer lives at the bottom of a hill, and the pressure fades as it gets to her house.
In addition to the above categories, customers were ALSO experiencing the following with regard to their tap water:
● Customers were curious about the correlation between hard water and kidney stones. Diane Agnew of the Water Authority mentioned she had never come across any research correlating the two issues, but noted that she is not a biologist.
● Everybody was experiencing hard water, which they feel causes complaints because of personal taste.
Customers want the Water Authority to know:
● Customers felt like their water quality has stayed very consistent.
ACTIVITY 2: Assessing & Improving the Water Quality Report

56
2 out of 6 customers read the Water Quality Report.
Customers LIKED the following about the Water Quality Report:
● They appreciated the definitions section. ● They like the information that is included.
Customers did NOT LIKE the following about the Water Quality Report:
● Customers felt that there was too much information is in the report. ● They felt that the title is boring, and felt people would be more likely to open it if it said
something like “What You Need To Know About Your Water Quality”. ● The report is not user friendly. ● Customers did not like the columns of data. ● They did not like the big fold‐out style. ● “Bureaucracy gone wild”. ● They felt that the report was disorganized. ● They did not care for the sections where the type was white on dark background.
Customers had the following ideas for improving the Water Quality Report:
Combine some categories that should go together, for instance, include conservation with Customer Involvement, etc.
One customer asked whether the EPA allows the report in email format; Rick from the Water Authority said yes.
In the “ASR” category, the information should be moved to a matching info‐graphic.
Simplify the report in general.
Cartoons/visuals would make it more relatable.
Include simple graphics/pie charts.
Put out small portions of the report with each bill instead of all at once‐ like a “new info” section.
Include a Table of Contents, and make the report more like a small book.
The report could come with the bill.
The Authority should “toot their own horn” more in the report; the report should mention the Water Authority’s accolades and achievements, and put these first to make people more interested.
Create visual breaks.
Rename categories, for instance, use “Tips” instead of “Customer Involvement”.
Meeting Date: 11/8/18 Recorder: Kiera McNary

57
Facilitator: Kymberly Johnson Table #: 1
ACTIVITY 1: What Are Customers Experiencing With Their Tap Water? What customers were experiencing with regard to TASTE:
Approximately half of the customers at the table reported that they either had no concerns with or that they enjoyed the taste of their water.
The other half of the customers reported that their water tasted “chlorinated.” One of this group reported that the chlorine taste was worse at room temperature. Another of these customers added that the taste of their water was “odd” when it came from the tap.
The customers that reported problems with taste in water also reported that the taste wasn’t terrible all the time, but merely part of the time.
What customers were experiencing with regard to ODOR:
Three of the six customers reported that they do not have an issue with the odor of their water.
A couple of customers said their tap water has a musky/sewage smell that is off‐putting. What customers were experiencing with regard to APPEARANCE:
All customers reported that they had no issues with the appearance of their water. What customers were experiencing with regard to PRESSURE:
Five of the six customers reported that they either liked their water pressure or they had no issues with it.
One customer reported that they live in Westgate Heights area, and that they had noticed that their water pressure had decreased as the area became more developed.
In addition to the above categories, customers were ALSO experiencing the following with regard to their tap water:
One customer reported that occasionally they get chunks of algae coming from their faucets.
ACTIVITY 2: Assessing & Improving the Water Quality Report 1 out of 6 customers read the Water Quality Report. Customers LIKED the following about the Water Quality Report:
Customers liked how informative it was.
They liked the graphs.
Customers reported that they liked that they could trust the Water Authority based on all of the awards and accolades it has won because of the water quality.

58
Customers did NOT LIKE the following about the Water Quality Report:
Customers thought that the WQR had too much information.
They disliked the newspaper/foldout format.
Most felt that the font was too small.
One customer did not like the color of the WQ Report, saying that “the color was off‐putting and not visually appealing”.
Customers wanted to know the following about Water Quality: They suggested that the following should be included in the WQR:
Customers suggested that a snippet listing contaminants should be included on the WQR because it helps educate customers about what they are drinking.
The report should contain reference to links online to more info/videos about the water purification process.
They wanted to know more about the following in general (not necessarily that it be included in the WQR):
They wanted to know what chemicals were being put in their water, and whether their tap water was safe to drink.
Customers had the following ideas for improving the Water Quality Report:
The report should be sent electronically, but with an option for customers to “opt‐in” to receiving a paper copy.
The report should be condensed into a small postcard or a flyer with only the most important information, and contain the option and information on how to find more information on the WUA website.
It should contain more pictures and graphics.
The Water Authority should draw attention to the WQR via media so that customers know what to look for in the mail.
Commercials could inform the public about the WQ awards that the Authority has won. Meeting Date: 11/8/18 Recorder: David Stager Facilitator: Leslie Kryder Table #: 2
ACTIVITY 1: What Are Customers Experiencing With Their Tap Water? What customers were experiencing with regard to TASTE:
One person said the tap water downtown tastes a little “dirtier”,
One person at the table never drinks tap water. What customers were experiencing with regard to ODOR:

59
Within the last two weeks, one customer smelled chlorine in their water (Tramway & Central).
One customer remembered having smelled chlorine. What customers were experiencing with regard to APPEARANCE:
One customer experienced a slight yellowish color (Northwest, Ladera & Ouray). What customers were experiencing with regard to PRESSURE:
One customer did experience some problems with pressure but pipes were the problem and it was fixed.
In addition to the above categories, customers were ALSO experiencing the following with regard to their tap water:
No other issues!
ACTIVITY 2: Assessing & Improving the Water Quality Report 1 out of 4 customers read the Water Quality Report. Customers LIKED the following about the Water Quality Report:
They liked the diagrams and maps themselves, as well as the color of them.
They like the visuals and pictures of how water is distributed, as well as the data tables.
The Customer Involvement section.
The section about water use per capita over time.
Some felt the format was easy to read.
Customers did NOT LIKE the following about the Water Quality Report:
They felt that the abbreviations on charts were unclear; the key should be more visible or easy to access.
More of the words used could use definitions.
The report itself is hard to distinguish from any other piece of mail, such as an advertisement.
Customers wanted to know the following about Water Quality: They suggested that the following should be included in the WQR:
More background information on the impact of what is in our water on human health.
What is the public advisory board referred to in the report? Who does it consist of and why should they care?
They wanted to know more about the following in general (not necessarily that it be included in the WQR):
They were curious about whether the ABCWUA is involved with water temperature.
Customers wanted to know the difference between hard & soft water, and wondered what kind ABQ has.

60
Customers had the following ideas for improving the Water Quality Report:
Use more color in the maps.
Add definitions for more of the words.
Use bold fonts to create more contrast.
Include an easy to find and easy to read summary of the overall report.
Create an attention grabbing cover, such as “Common myths debunked‐ fluoride”, etc.
Remove the water quality protection section; it has too much info, and most members of the general public would not care.
Meeting Date: 11/8/18 Recorder: Kendra Kozel Facilitator: Sarah Sanasac Table #: 3 ACTIVITY 1: What Are Customers Experiencing With Their Tap Water? What customers were experiencing with regard to TASTE:
Some customers reported a chlorine and bleach taste, on and off; customers commented that using a filter, water softener, or refrigerator filter helps.
It was noted that the taste varies among different locations within Albuquerque. One customer reported that his wife only drinks bottled water because of the taste.
What customers were experiencing with regard to ODOR:
The only concern raised was regarding the chlorine odor, as a result of which various customers had purchased filters or water softeners.
What customers were experiencing with regard to APPEARANCE: The only comment on appearance was by a customer who reported having bubbles
sometimes, but wasn’t concerned because he knew it was air bubbles. What customers were experiencing with regard to PRESSURE:
All customers at the table agreed that the pressure is GREAT!
In addition to the above categories, customers were ALSO experiencing the following with regard to their tap water:
Some customers experience calcium deposits on taps. Two out of the four customers at the table reported water hardness in their washing
machines.
Customers want the Water Authority to know:

61
They don’t like to call in to complain because it takes too much time, and they experience frustration with representatives, but would be satisfied with leaving a message and getting a call back.
They want the option to receive a personal water test kit upon request. They would like to get a paper survey in the mail to fill out and send back with postage
prepaid as a way to give the Water Authority some feedback on their satisfaction levels and concerns.
ACTIVITY 2: Assessing & Improving the Water Quality Report 2 out of 4 customers read the Water Quality Report. Customers LIKED the following about the Water Quality Report:
They felt that the imagery included in the form of pictures and charts made the information easy to understand.
The table appreciated the fact that the current format is inexpensive to make, a fact which was shared with them by Mark Kelly of the Compliance Division.
Customers appreciated the thoroughness of the report, and the amount of time and work that goes into producing and sending it out.
Customers did NOT LIKE the following about the Water Quality Report:
Customers felt the font was too small; they had a hard time reading it, even with reading glasses.
Customers were extremely overwhelmed by the size and amount of information packed into the report. They were reminded of work and their jobs when picking it up and reading it, which was discouraging to the whole table.
The paper the report is printed on is too thin; they did not like the texture. They felt the report is too large; they were concerned about the environmental impact
of using so much paper to send to every customer Using so much teal ink makes the various parts of the report “melt into themselves.” With the current design, the reader doesn’t know where to begin reading; they felt
“uninvited” upon opening the report.
Customers wanted to know the following about Water Quality: They suggested that the following should be included in the WQR:
They want a comparison of how the Water Authority is doing compared to the national average in the categories of cost, quality, and satisfaction.
Information about the quality of river water, not just tap water.
They wanted to know more about the following in general (not necessarily that it be included in the WQR):
Customers want to know more about the quality of the river water. Customers had the following ideas for improving the Water Quality Report:

62
They want to see an entirely different design and layout, one that has bigger font and a variety of brighter colors, and that is more welcoming.
The report should be more broken up so that it doesn’t “melt into itself.” It should have a more logical flow.
Customers suggested including what the Water Authority is legally required to send out, like the charts, on the water bills, and offer a link, such as, “if you want more information, you can find it at…”; OR the additional information could be in a newsletter or pamphlets, so the WQR could be broken up, easier to digest, more welcoming, etc.
They suggested a smaller scale for residents, such as a postcard, and larger scale for businesses so that it could be displayed for employees.
They want 2 sections, one being: “What We Have To Tell You” (charts, statistics, federal standards) and the other being: “What We Want To Tell You” (awards, national average vs. ABQ average, positive feedback, a reminder the chlorine taste and/or odor isn’t lethal, etc.).
Include Sherdrop Holmes! They want it to be more entertaining: they specifically suggested a maze, crossword puzzle, quiz, etc. They agree puzzles and games can be used as a way to learn about water quality.
Include a coupon or rebate as an incentive to open it up and read it.
Offer an online option, publishing information on Facebook, or through emails. Customers enjoyed the video and want the option to learn more about the Water Authority through their digital portals (phones, tablets, computers, etc.).
Put a Public Service Announcement on the television; this would be more effective in communicating what’s happening monthly, rather than annually, with the Water Authority, and would create and maintain a more interactive relationship between the customers and the Authority.
Include an explanation of what they are gaining by reading it; i.e., either a summary of the report, or an indication of what the main takeaways are.
Customers want to read about the awards and positive feedback that the Water Authority has received!
Meeting Date: 11/8/18 Recorder: Mo Hobbs Facilitator: Sharon Gonzalez‐Alei Table #: 4
ACTIVITY 1: What Are Customers Experiencing With Their Tap Water? What customers were experiencing with regard to TASTE:
One customer noted that when she moved here approximately 30 years ago, she noticed a chlorine taste. She stated that after a while she no longer noticed it, and has not tasted it for quite some time.

63
What customers were experiencing with regard to ODOR:
No issues with odor. What customers were experiencing with regard to APPEARANCE:
One customer was concerned about mineral build up on the faucet. This began a conversation about Albuquerque’s water being very hard.
What customers were experiencing with regard to PRESSURE:
One customer who lives in the foothills said his garden hose has very low pressure throughout the summer (he does not use it in winter). He has not issues inside the house.
In addition to the above categories, customers were ALSO experiencing the following with regard to their tap water:
Customers agreed that there should be a category added for hardness. One customer felt that the water is too hard to drink, so she purchases bottled water for drinking. She also felt the Water Authority should offer rebates for water softeners and filters.
ACTIVITY 2: Assessing & Improving the Water Quality Report 3 out of 4 customers read the Water Quality Report; of these 3, 1 scans it and the other 2 read it in depth. Customers LIKED the following about the Water Quality Report:
Customers liked the scientific information and associated graphs, and felt that they should continue to be included.
Customers liked that there was a substantial overview of water quality parameters, and that it answered questions they would not even have known to ask.
Customers did NOT LIKE the following about the Water Quality Report:
They did not like the newspaper/folding style.
Customers did not like the blandness of color; they felt that the lack of eye‐catching colors and directive font was one reason more people do not read the report.
Although they appreciated the scientific information and graphs, customers agreed that it was not user friendly. They felt that the WQ report was currently geared to people with scientific backgrounds, and should be geared more to the public.
Customers wanted to know the following about Water Quality: They suggested that the following should be included in the WQR:
Something about the status of the aquifer levels.
One customer adamantly wanted a section dedicated to a Kirtland Air Force Base Bulk Fuels Facility cleanup (this customer was asked whether a link to NMED would be

64
helpful, so that readers could look at all contamination sites, but this customer only wanted a Kirtland update).
They wanted to know more about the following in general (not necessarily that it be included in the WQR):
They wanted in depth information on why rates increase, and how rate increases are spent (e.g. whether it goes to infrastructure, for increasing personnel, or for conservation efforts, etc.).
Some wanted a breakdown of what proportion of Water Authority customers are high users, medium users, and low users.
They wanted more information on the status of new developments (e.g. Santolina).
They wanted a map that showed water right holders (although they agreed this fell outside of the WUA’s responsibility).
Customers had the following ideas for improving the Water Quality Report:
Make it more of a pamphlet or magazine style rather than its current foldout format.
Use a variety of colors, and make the most important information bold and brightly colored.
Add more illustrations or diagrams which would make the report easier to comprehend.
Make it an option for customers to request receiving the report via email, as some of the customers pay their bill online and do not like mail.
Make a Spanish version available upon request; information on how to request it should be included in Spanish on the WQR that already goes out.
Add a small section designated to explaining WQ results for children.
Include an “Ask Mike” section.
One customer suggested a quick summary section, while others felt the report was already a summary, but not user friendly.
Meeting Date: 11/8/18
Recorder: Cole Garcia
Facilitator: Ildiko Oravecz
Table #: 5
ACTIVITY 1: What Are Customers Experiencing With Their Tap Water?
What customers were experiencing with regard to TASTE:
● The participants stated that they have experienced no issue with taste, nor did they have any compliments about the taste; they were neutral.

65
What customers were experiencing with regard to ODOR:
● Customers had no issues with odor, but they did want to compliment the lack of odor. A customer compared our water to the water in California, and stated that ours was superior.
What customers were experiencing with regard to APPEARANCE:
● The customers had no issue other than the “milky” appearance. They said they dismissed this issue after Mike Richardson explained the cause of it in the slides.
What customers were experiencing with regard to PRESSURE:
All participants stated that the pressure was not strong enough for their liking. They noted that the water takes awhile to come to a reasonable pressure, and that immediately after turning the water on it seems to trickle out.
● All participants agreed that they have experienced the “water hammer” effect, hearing knocking from the pipes in the wall.
● Overall, the customers felt that the water pressure was inconsistent and disappointing.
ACTIVITY 2: Assessing & Improving the Water Quality Report
2 out of 4 customers read the Water Quality Report.
Customers LIKED the following about the Water Quality Report:
The customers liked the information that was provided in the WQR.
They liked that it was straight to the point and contained no fluff.
They liked the contact information and the Customer Involvement section, particularly the information about the programs and the rebates.
The participants liked the color of the font, and stated that it stood out from the rest of their mail.
Participants liked the vocabulary definition section.
Customers did NOT LIKE the following about the Water Quality Report:
The participants stated that they did not like the format of the document, and that it was too large and awkward to read.
They assumed the document was inefficient and expensive to make; everyone agreed that they would like to see a more efficient format that would save money.

66
Everyone agreed that the font was too small, and would be difficult for the visually impaired to read.
Customers wanted to know the following about Water Quality:
They suggested that the following should be included in the WQR:
Information about when, if ever, our water may have violated the designated safety parameters.
Information about whether there is anything in our water that we are unable to remove, especially if it was something harmful.
They wanted to know more about the following in general (not necessarily that it be included in the WQR):
Participants wanted to know more about recycling efforts, and stated that they would like to know how to recycle water in a useful and meaningful way. In conjunction with this, they mentioned that they wanted to promote a healthy lifestyle that encouraged drinking more water.
Customers wanted to know more about watershed protection and how they could contribute to the Water Authority’s efforts.
The participants wanted to know how our water compares to other states’ water.
Customers had the following ideas for improving the Water Quality Report:
Make it less dense; perhaps create smaller pamphlets that each contain a single piece of information from the WQR.
Change the document to be a booklet or a more traditional 8” X 11” packet.
Make the document easily accessible via their online bill; perhaps make the document fully digital, and available in hardcopy when requested.
The report should be advertised on local TV, with small engaging summarized segments for the public to see.
Produce it in multiple formats, one that is dense and business oriented and one that is simplified and more “user friendly”.
The Authority should advertise their awards and nominations!
Meeting Date: 11/8/18 Recorder: Finn Knutson Facilitator: Kathleen Oweegon Table #: 6
ACTIVITY 1: What Are Customers Experiencing With Their Tap Water?

67
What customers were experiencing with regard to TASTE:
Some customers experienced a bad taste due to what they believed to be an excess of chlorine.
Two of the customers who placed a green dot in this category use a filtration system; one of them uses a reverse osmosis filter because of inconsistencies in taste and odor, and the other uses a filter for no particular reason.
Most customers say that they have noticed that filtered water generally tastes better.
One customer doesn’t use a filter and likes the taste of the water. What customers were experiencing with regard to ODOR:
The customers had no issues in this category.
What customers were experiencing with regard to APPEARANCE:
One customer said that on a few occasions they had experienced milky water, and on one occasion dirty water.
Another customer had complaints about having lime scale on their cups and vases, and because lime has calcium in it they were concerned that it may be dofficult for their body to process.
What customers were experiencing with regard to PRESSURE:
The customers had no issues with pressure. In addition to the above categories, customers were ALSO experiencing the following with regard to their tap water:
The people at this table had the following inquiries about water temperature: o They wondered if the Water Authority regulates water temperature, and if so
how is it regulated? o They wondered if the Chlorine content in the water changes based on
temperature or season. o What is the temperature during the purification process?
ACTIVITY 2: Assessing & Improving the Water Quality Report
Customers LIKED the following about the Water Quality Report:
The graphs, charts, visuals, and pictures.
The fact that a hard copy is mailed to them, and that they can also get it as a digital report.
The fact that we are given more information than needed.
The information is good.
The fact that it includes contact information for the ABCWUA. Customers did NOT LIKE the following about the Water Quality Report:

68
The lack of color.
The text is too small.
It ends up raising more questions than it answers. Customers wanted to know the following about Water Quality: They suggested that the following should be included in the WQR:
A list of the most frequently asked questions of the year.
They wanted to know more about the following in general (not necessarily that it be included in the WQR):
Does rust form in pipes? If so, what is done about it?
Why is there a small amount of strontium in the water? Is it from nuclear waste?
Customers had the following ideas for improving the Water Quality Report:
Make the fonts bigger.
Create smaller reports at different times throughout the year with different information provided in each one.
Give customers the ability to specify their preference for how they receive the report (Email, Text, Mail, etc.).
Meeting Date: 11/8/18 Recorder: Meagan Oldham Facilitator: Keith Carlson Table #: 7
ACTIVITY 1: What Are Customers Experiencing With Their Tap Water?
What customers were experiencing with regard to TASTE:
Two customers said they had experienced a chlorine taste, but that they were no longer concerned about it after having heard in the presentation the reason that it is in the water.
What customers were experiencing with regard to ODOR:
The only concern raised in this category was raised by one customer who had noticed a smell to the water in a particular part of town a few times. Water Quality Program Manager Liz Anderson came to the table and told him to call either Water Authority or 311 to report it in order for it to be checked out. No one else had any concerns.
What customers were experiencing with regard to APPEARANCE:
One customer said that she noticed her water looking milky a couple of times. She was not as concerned after she learned in the presentation about why this happens, but it was still her main concern. Liz Anderson came to the table to discuss her concern and

69
suggested that she call the water quality hotline next time it happens to have samples taken just in case.
One customer said their water looked milky also, but did state that it was at the same time as construction was going on in the area. He was not overly concerned about it.
What customers were experiencing with regard to PRESSURE:
The only concern raised was with regard to a time when there was construction going on in the area, and the customer understood that it was connected to the construction.
In addition to the above categories, customers were ALSO experiencing the following with regard to their tap water:
There was discussion about the calcium build up that happened on appliances. The customers were told how the calcium and magnesium are mostly naturally occurring and the buildup actually helps the main pipes as a protective coating. A few tips and tricks were offered to keep appliances and fixtures running smoothly and how to clean them.
Customers want the Water Authority to know:
Everyone at the table was completely on City Water.
The table had a discussion with Liz Anderson about the chemicals that were, and were not, added to the water.
One customer brought up that she lives right over the KAFB plume, and while she was aware of what the issues were and what was being done to remediate the plume, many people were not aware of this. She felt it would be nice to have more/better information available about this and other affected areas in the city, and what the actual risks are to the public.
ACTIVITY 2: Assessing & Improving the Water Quality Report 3 out of 7 customers read the Water Quality Report. Customers LIKED the following about the Water Quality Report:
They liked that there was quite a bit of information being offered to the public.
They really enjoyed the graphics/diagrams showing where our water comes from and the processes with which our water is treated.
They appreciated that it was not “dumbed down” to a 4th grade level.
Customers did NOT LIKE the following about the Water Quality Report:
Others thought there was too much information, and that it was overwhelming.
The print was too small for the majority of the customers at the table.
The tables in the WQR were very dense and hard to figure out quickly.
The table in the report that had a teal background and white font was particularly difficult for a few of them to read.

70
Customers wanted to know the following about Water Quality: They suggested that the following should be included in the WQR:
A section entitled “Myths and Misconceptions” to go over topics that do not seem to get explained well such as: Fluoride (what healthy levels are, where it comes from, why it is being added, etc.), aquifer info, where our water comes from, etc.
Information about nano‐particles. They wanted to know more about the following in general (not necessarily that it be included in the WQR):
Are chromium or are other contaminants coming from Los Alamos and getting in our water?
Customers had the following ideas for improving the Water Quality Report:
Put it in a booklet form; the way it folds out was confusing and cumbersome.
Put the tables and extra information online for those who want to read even more.
Make the information in the tables easier to understand. For example having the numbers on a bar graph showing the maximum levels that are allowed, what was measured, etc.
Clarify the time period in which the data was gathered.
Have videos/podcasts/etc., for those who may not want to read all of the info. They really enjoyed the video shown during the meeting and said that it conveyed a lot of good info very well.
Keep in mind that people learn and take in information in different ways.
Meeting Date: 11/8/18 Recorder: Jenny Potter Facilitator: April Herren Table #: 8 ACTIVITY 1: What Are Customers Experiencing With Their Tap Water? What customers were experiencing with regard to TASTE:
● Members of the table had no complaints about taste. ● Most customers drank tap water; 1 customer would only drink bottled water and would
only use the tap when the water would be heated. ● 1 customer uses reverse osmosis because of toxin concerns. ● 1 customer uses well water and loves the taste.
What customers were experiencing with regard to ODOR:
● A customer had a one‐time experience with their bath water running brown into the tub. It smelled very bad and was experienced in all of the faucets in the house. They called the water line and the isolated incident was eventually resolved. It never came back. This prompted the table to wonder how often the pipes get replaced.

71
What customers were experiencing with regard to APPEARANCE:
● The customer that had experienced brown water noted that that same incident was in issue in this category.
● The calcium build up is very noticeable to all customers. What customers were experiencing with regard to PRESSURE:
Customers had no complaints, and described their water pressure as adequate.
One customer noticed that their pressure would vary. A Water Authority expert came to the table and explained how the gravity system works, and that in the summer, irrigation goes off and contributes to the pressure drop.
In addition to the above categories, customers were ALSO experiencing the following with regard to their tap water:
No additional issues noticed.
Customers want the Water Authority to know: ● The calcium build up is quite bad (customers listed all the surfaces/fixtures on which
they noticed it). ● Customers wanted to know how the studies are done to decide customer satisfaction.
Who is being interviewed? How many people? Does the invitation go to everybody? ● Is there an online chat service? Frank Roth of the Water Authority came to the table and
informed customers about the customer service portal with live chat.
ACTIVITY 2: Assessing & Improving the Water Quality Report 4 out of 6 customers read the Water Quality Report. Customers LIKED the following about the Water Quality Report:
● They found the color to be visually pleasing. ● They liked the map and graphics of our water area. ● They appreciated all of the information that is given. ● They liked that people have to have a basic level of education in order to read the
report. ● Customers liked the Customer Involvement section. ● They liked the lead testing option included in the report. ● They appreciated having a hard copy to read.
Customers did NOT LIKE the following about the Water Quality Report:
● They felt that it looks dull and boring from the outside. ● A customer said, “I see it in the mail and say “eh””. ● It needs more intrigue at the start, i.e., on the front cover. ● They felt that it was a waste of paper and waste of money.

72
Customers wanted to know the following about Water Quality:
They were curious as to where the testing is happening.
They wondered whether the data in the report is only gathered in Albuquerque, or if it is from outside the city as well.
Why are the water authority and waste management separate?
How many treatments does the Rio Grande water go through? Customers were concerned with pet waste and E coli. They wondered if there is a test for levels of pet waste, and/or E coli.
Are there other options for information delivery? Some customers pointed out that if the info was only available online a lot of people would not have access.
They asked whether the Water Authority tests for pH levels. Mark Kelly of the Water Authority came to the table and told customers that they do test Ph levels when the water comes out of the plant, and that the average is 7.
Customers had the following ideas for improving the Water Quality Report:
Make it more like a comic book with lots of graphics, especially on the front.
Split the information into 2 books‐ 1 for basic information, and 1 with more detail; “Different people want different things.”
Include a Table of Contents so readers can pick and choose the info they want to read, and so the information is easier to find.
Add a “Tips” section, (i.e., vinegar for removing calcium buildup, etc.). Having this info would make it more relatable.
Create a campaign like the water by the numbers; customers felt that that campaign was very successful.
Get on the news and announce that the WQR will be coming out and that customers should read it, etc.
Give people the option of receiving an electronic version of the report.
Meeting Date: 11/13/18 Recorder: Tristan Van Cleave Facilitator: Sarah Sanasac Table #: 1
ACTIVITY 1: What Are Customers Experiencing With Their Tap Water? What customers were experiencing with regard to TASTE:
One customer noted a taste of chlorine.
No other customers had any issues with taste. What customers were experiencing with regard to ODOR:

73
One customer noted the odor of chlorine as a primary concern, and another noted it as a secondary concern since she said she only notices the smell once per month. The other customers at the table had not noticed a chlorine smell.
One customer wondered whether the variations in chlorine smell and taste was caused by the ratio of San Juan and ground water in each location. It was explained by a Water Authority expert that chlorine is added to both ground and surface water, and that some areas receive more chlorine because the water authority must add enough chlorine to reach the end of a distribution path. Because of this, those closest to the distribution source will have slightly higher chlorine content than those at the end of the line, but that all levels are tested and within acceptable chlorine level range.
One customer wondered if the level of fluoride in the water could affect the smell. This question was answered in the negative by a Water Authority expert.
What customers were experiencing with regard to APPEARANCE:
No customers noted any issues with appearance.
What customers were experiencing with regard to PRESSURE:
While no customers at the table had any experienced any issues with pressure, one customer opined that pressure can be too high on occasion. This was explained by an expert who noted that pressure changes depending on location due to the fact that the water pressure is created through gravity.
In addition to the above categories, customers were ALSO experiencing the following with regard to their tap water:
All customers expressed a degree of concern with the overall hardness of the water. One mentioned hard water causing water heater damage and prompting premature replacement of a water heater unit.
There was some brief discussion about fluoride content in the water. An expert explained that there is a naturally occurring level of “0.5” and they only add enough fluoride to raise that value to “0.7”.
Customers want the Water Authority to know:
One customer reasoned that perhaps the smell and taste of chlorine could be the cause of the increasing dissatisfaction.
Another customer felt that the likely reason for the Water Quality Conundrum is because people are less likely to take time to call and complain, but far more likely to express long held concerns on a survey.
ACTIVITY 2: Assessing & Improving the Water Quality Report 0 out of 4 customers read the Water Quality Report. Customers LIKED the following about the Water Quality Report:
Customers liked the charts, graphs and maps.

74
One customer said “I like knowing that something is happening.”
Customers did NOT LIKE the following about the Water Quality Report:
Customers unanimously felt that it was far too long and there was too many things going on in the report at once.
Customers also felt that the design was generally poor, noting chiefly that the current foldout design is too large and unwieldy.
Some customers expressed concern at the amount of paper being wasted to print such a report.
Customers wanted to know the following about Water Quality: They suggested that the following should be included in the WQR:
One customer felt that the water authority should add information about microbes and bacteria and other potentially infectious microorganisms.
Some customers felt that the WQR should include the accolades and awards won by the Water Authority.
They wanted to know more about the following in general (not necessarily that it be included in the WQR):
The water conservation strategies that the water authority uses.
Why there has been a rate increase even for customers who are proactive about water conservation.
Customers had the following ideas for improving the Water Quality Report:
The customers felt that the WQR was written in such a way as to exclude average readers, noting that the average reading comprehension level is closer to 5th grade; they felt that it should be made much more simple in order to make it more accessible.
One customer suggested releasing the WQR in monthly installments along with the bill. He felt that having smaller amounts of information at a time would make it easier to read and more comprehensible.
Several customers noted that the WQR was simply inaccessible for a lay person due to the way it’s written, its length, and the generally large and hard to handle design.
The WQR should be simplified, and the design should change to either a booklet that people can page‐turn, or small monthly installments.
Meeting Date: 11/13/18 Recorder: Finn Knutson Facilitator: Ed McCorkindale Table #: 2
ACTIVITY 1: What Are Customers Experiencing With Their Tap Water? What customers were experiencing with regard to TASTE:

75
One customer said that while he used to like the taste of his tap water, he now hates it, and says that he needs to filter his water to be able to drink it.
Another customer said that he doesn’t notice a taste to the water when he drinks from the tap, but he rarely drinks from the tap because, as everyone at the table agreed, filtered water tastes better.
One customer said that the pipes in their neighborhood were recently replaced and now the taste of the water has improved dramatically.
Another couple of customers said that they are extremely satisfied with the taste. What customers were experiencing with regard to ODOR:
No one at the table had ever experienced a problem with odor. What customers were experiencing with regard to APPEARANCE:
Many customers complained about the extraordinary hardness of the water, and how it leaves white residue on cups, toilets and vases. This hard water is extremely hard to get off of everything.
What customers were experiencing with regard to PRESSURE:
The person whose pipes had been replaced has noticed a severe drop in pressure; they wondered whether it could be caused by larger pipes having been installed.
In addition to the above categories, customers were ALSO experiencing the following with regard to their tap water:
The hardness of water is problematic. Customers wanted to know whether the water could be treated at the source instead of their having to do it themselves.
Some customers are worried about the sustainability of our water, and wonder how long we will have accessible water in New Mexico. In conjunction with this, they wanted to know whether their drinking water was used for fighting fires and watering golf courses.
Customers want the Water Authority to know:
That they are fine with a slight raise in the water bill if it would mean that hard water could be treated before it comes out their taps.
ACTIVITY 2: Assessing & Improving the Water Quality Report Customers LIKED the following about the Water Quality Report:
They liked the maps, charts, graphs, and visuals that are provided.
They felt that it seemed to be relatively well thought out and well put together.
Customers did NOT LIKE the following about the Water Quality Report:
The fact that the report is extremely hard to read; “it’s overkill”. People simply want to know if their water is safe to drink.

76
It is hard to understand at a glance and it is simply too much to read.
It gives way more information than people really want.
It makes readers question their water instead of just assuming that the Water Authority is doing a good job.
It’s simply not interesting.
Customers wanted to know the following about Water Quality: They suggested that the following should be included in the WQR:
Information about what chemicals are added to the water and how much is added.
They wanted to know more about the following in general (not necessarily that it be included in the WQR):
What parts of the water quality report are required to be a part of it?
Is the “Water Quality Conundrum” that was mentioned in the presentation happening in other places or is it just in Albuquerque? If it is the former, it may just be a social trend, and may be that people are less trusting of their local government these days.
Customers had the following ideas for improving the Water Quality Report:
Customers want know right away that their water is good. Put that information up front and put it in bold letters.
Let people opt out of getting the report.
It should be put in a booklet or newsletter format.
Add more charts.
Make it easier to read and understand.
Putting the report in with the water bill will result in more readers.
Incentivize reading it somehow, maybe a discount on readers’ water bills.
Tell customers more about the awards the Water Authority has received.
Make the report smaller. Give it fewer pages.
Meeting Date: 11/13/18 Recorder: David Stager Facilitator: Sharon Gonzalez‐Alei Table #: 3
ACTIVITY 1: What Are Customers Experiencing With Their Tap Water? What customers were experiencing with regard to TASTE:
4 out of the 5 customers at the table do not drink tap water due to concerns about various things in the water (arsenic, radiation and chlorine levels).
What customers were experiencing with regard to ODOR:
One customer commented on a chlorine smell, but noted that it was at least 10 years ago.

77
What customers were experiencing with regard to APPEARANCE:
A customer commented about a milky appearance every once in a while.
Customers noticed a calcium buildup on surfaces due to hard water, and mentioned that this raised concerns with health.
Customers wondered how to deal with hard water stains on faucets.
What customers were experiencing with regard to PRESSURE:
A customer felt that pressure decreased as their area became more populated.
Some customers at the table said they experienced low pressure.
One customer said they’ve noticed air coming out of their faucet. In addition to the above categories, customers were ALSO experiencing the following with regard to their tap water:
They noticed calcium buildup from hard water (see Appearance section, above).
Customers want the Water Authority to know:
They would like information about the difference between hard & soft water.
ACTIVITY 2: Assessing & Improving the Water Quality Report 3 out of 5 customers read the Water Quality Report. Customers LIKED the following about the Water Quality Report:
The extensiveness of information.
They liked that it included information about dangerous toxins.
Customers felt it was very thorough.
They liked the charts, graphs, and maps.
Customers did NOT LIKE the following about the Water Quality Report:
There is no noticeable introduction or beginning – it’s hard to tell where to start reading.
Customers wanted to know the following about Water Quality: They suggested that the following should be included in the WQR:
A comparison of Albuquerque’s water quality with that of other cities the same size as Albuquerque.
Information about what big businesses are doing to help reduce the pollution they cause.
They wanted to know more about the following in general (not necessarily that it be included in the WQR):
They would like to know what specific location their water comes from (i.e., which well). Customers had the following ideas for improving the Water Quality Report:

78
Use laymen’s terms to be more customer focused and customer friendly.
Include a summary of important information someplace in the report.
Creating a way to hear and see the details (in addition to being able to read the report) would help, i.e., post a related video or recording online.
It should report on the Water Authority’s achievements and awards with regard to Albuquerque’s Water Quality.
Awards should be offered to businesses for good water quality practices, and those awards should be published in the report.
It should educate readers on the hazards of water before it is treated (for example, drain water).
Meeting Date: 11/13/18 Recorder: Jenny Potter Facilitator: Heidi Howley Table #: 4
ACTIVITY 1: What Are Customers Experiencing With Their Tap Water? What customers were experiencing with regard to TASTE:
A customer said she was experiencing a sodium flavor with her water. She puts filters in every water location in their house. They are from the East Coast so she thinks it might be a cultural issue in taste. She lives at Alameda and N. Rio Grande
A customer who lives off of Unser and I40 says he doesn’t like the flavor. He knows it is healthier with the minerals, but doesn’t like it, and thinks it tastes chemically.
A customer at Menaul and Juan Tabo uses filters for hard water.
The three customers at the table who found taste to be a primary concern were from the East Coast.
What customers were experiencing with regard to ODOR:
A customer noticed an occasional odor in the shower once every 3 months or so, and said it smells “sweet” right out of the faucet. Diane Agnew of the Water Authority came to the table and mentioned that since the smell is sweet, it is probably an organic issue and not a pipe issue.
What customers were experiencing with regard to APPEARANCE:
No complaints or issues. What customers were experiencing with regard to PRESSURE:
All the customers found the pressure inconsistent; Diane Agnew came over and explained how the gravity pipe system in place can affect pressure.
In addition to the above categories, customers were ALSO experiencing the following with regard to their tap water:

79
No additional issues were noted. Customers want the Water Authority to know:
One customer is very concerned with fluoride in the city water. She said she understands why it is there, but for her the amount triggers bad acid reflux. She went to an internal medicine doctor and he said to look into the amount of fluoride because he thinks she has an allergy. She wonders what she can do about it.
Of the customers at the table, 2 people drink bottled water, 1 uses reverse osmosis, 2 drink tap water, 1 drinks Brita filtered water, and 2 drink fridge filtered water.
ACTIVITY 2: Assessing & Improving the Water Quality Report 6 out of 7 customers read the Water Quality Report. Customers LIKED the following about the Water Quality Report:
● The visuals, pictures, charts and maps. ● Customers appreciate all of the information given. ● Some like the color. ● The report inspires confidence and trust in the Water Authority. ● It is very transparent. ● It contains a good explanation of water sources.
Customers did NOT LIKE the following about the Water Quality Report:
● Customers did not like the folding format; one customer said “I couldn’t figure out how to open it.”
● It is intimidating in that it contains so much information that is difficult to read and understand.
● It does not define “detection limits” in the definition box. ● It’s very dense, which makes it difficult to find specific information. ● It can’t be read in one sitting, and then it is hard to remember where you stopped
reading when you come back to it. ● A customer commented, “I don’t understand what it says”.
Customers wanted to know the following about Water Quality:
Is the Authority testing for micro‐plastics? It is a very new concept with no data.
Whether there are radioactive particles from Los Alamos in the water, and if we test for them. One customer heard about this issue on a radio program and felt concerned.
When the Authority says “great water”, what are they comparing it to? How is it better than bottled water? Mike Richardson of the Water Authority came to the table and explained that bottled water is municipal and does not go through as many filters as tap water, and that bottled water is regulated by the FDA rather than the EPA.
Customers had the following ideas for improving the Water Quality Report:
Make it a booklet with numbered pages.

80
Use larger print.
A customer suggested putting the information in the Sunday paper instead of in water bills. This sparked a large debate about access to information, and a discussion about how apartment dwellers do not pay water bills, and therefore do not see the report.
The Water Authority should put an ad about the report on the news.
Adding a summary at the beginning of the report would simplify it.
Include a Table of Contents.
Customers liked the M&M breakdown reference used in the presentation, and suggested using analogies like that in the report.
State what levels of what substances would be dangerous; “break the information down for the average Joe”.
State in the report why our water is better than bottled water.
Use intriguing information and add visual appeal.
Include information about home detection and the availability of home kits.
Add a “Things you can do to protect the water” section with info about pet waste, medicine disposal, etc.
Meeting Date: 11/13/18 Recorder: Cassia Sanchez Facilitator: Kathleen Oweegon Table #: 5
ACTIVITY 1: What Are Customers Experiencing With Their Tap Water? What customers were experiencing with regard to TASTE:
A customer noted that water had tasted better in other cities they had lived in; they dislike the mineral taste here.
A customer notices a chlorine taste at times.
One customer said they “Love it!”
The tap water does not taste as smooth as filtered or distilled water.
A customer said they boil their tap water. What customers were experiencing with regard to ODOR:
Most customers experience no issues with odor.
One comment was made about an occasional smell of chlorine. What customers were experiencing with regard to APPEARANCE:
One customer said they notice mineral deposits after water has sat for awhile.
Some customers notice stains from hard water.
Some customers felt that the water looks clear and great. What customers were experiencing with regard to PRESSURE:

81
One customer said they notice a sudden dripping in shower head upstairs at night, and that the faucet downstairs does the same at times.
Most customers commented that they are very happy with their pressure. In addition to the above categories, customers were ALSO experiencing the following with regard to their tap water:
A customer noted concerns with infrastructure age, and said they have noticed more pipeline and valve repairs in the City.
Customers want the Water Authority to know:
They have excellent water and they are happy with it.
Some have concerns about the Low Water Usage Rate and why it only applies if you are not consistently a low usage account.
ACTIVITY 2: Assessing & Improving the Water Quality Report 5 out of 8 customers read the Water Quality Report. Customers LIKED the following about the Water Quality Report:
They appreciated the data tables of ABQ water and MCL goals from the EPA.
They feel that it is very complete.
It’s nice that it is one compact document (which makes it easy to recycle).
Customers did NOT LIKE the following about the Water Quality Report:
The information is overwhelming; someone at the table needed help from a friend to go through it.
It is hard to tell where to start reading it.
There are too many different alignments, fonts, and text sizes.
Customers wanted to know the following about Water Quality: They suggested that the following should be included in the WQR:
Include a map of zones for the areas of the City.
Customers would like more information about the positives and bottom line.
More want information on arsenic and how the EPA standards are being met.
They wanted to know more about the following in general (not necessarily that it be included in the WQR):
The status of and efforts related to the Kirtland fuel spill.
Customers had the following ideas for improving the Water Quality Report:
Keep all contact information, numbers and websites on one page.
Include a feedback section (i.e., a questionnaire or comprehension survey) that can be mailed back to the Water Authority.

82
Translate a few key messages in other languages besides English and Spanish, for example, Chinese.
Include a front page headline announcing good news; the Authority should “toot their own horn!”
Create some type of recorded guided tour through the document in an internet format (social media or YouTube).
Each page should be reformatted to focus on a specific topic.
Include a one‐page executive summary, in addition to other required information, that references where to find the details in the report.
Add a Table of Contents
Make the alignment, font style and font size consistent throughout the report.
Simplify the report by using less scientific language.
Place some of the information on the internet and just stick to the facts for the printed version.
Change it to a booklet style. Meeting Date: 11/13/18 Recorder: Kendra Kozel Facilitator: Keith Carlson Table #: 6
ACTIVITY 1: What Are Customers Experiencing With Their Tap Water? What customers were experiencing with regard to TASTE:
Some customers reported a chlorine taste, and said it had been occurring more recently.
Some customers are experiencing a mineral taste.
Customers said using a Brita filter helps remove the chorine and mineral taste.
What customers were experiencing with regard to ODOR:
This issue was not of concern to this table!
What customers were experiencing with regard to APPEARANCE:
No complaints, appearance is great!
What customers were experiencing with regard to PRESSURE:
The pressure is usually strong, but in the summer it is too low and it varies.
A Water Authority expert explained to the table that gravity affects the pressure of their water, and had a greater or lesser impact depending on where they live in town.
In addition to the above categories, customers were ALSO experiencing the following with regard to their tap water:
Water hardness was of great concern to this table. Their dishwashers, toilets, and hot water heaters have hard water.

83
In response to questions about tracking how much water they are using, customers learned they can check their water meters to track this.
Customers want the Water Authority to know:
One customer who is a public health professional likes that the water has fluoride!
They think the Water Authority could try a bill insert for a survey or phone survey, and offer an incentive to fill it out.
ACTIVITY 2: Assessing & Improving the Water Quality Report 2 out of 4 customers read the Water Quality Report. Customers LIKED the following about the Water Quality Report:
They liked the blue accent/color scheme, and felt that this made the report aesthetically pleasing.
They appreciated how much data was included in the report.
Customers liked how comprehensive it was.
Customers did NOT LIKE the following about the Water Quality Report: They found that their eyes glaze over when they try and read the tables. They couldn’t tell what to read first because of the “newspaper” layout and design.
Customers wanted to know the following about Water Quality: They suggested that the following should be included in the WQR:
Customers want to read about the awards the Water Authority is receiving.
Include a comparison to other New Mexico neighborhoods, based on zones and even cities.
Add a section about trends: what’s getting better, what’s getting worse, etc.. Customers had the following ideas for improving the Water Quality Report:
Include an executive summary: “Here’s what you MUST know”.
One customer suggested including more precision, i.e., include the .00001% statistics.
Alternate the colors, especially on the tables.
Use bold font for items of significance.
Put the report online!
Prioritize it like a booklet, so that the crucial information comes first and so that it’s easier to read.
Put a different piece of information in each monthly bill as a way to break it up, and as a way to ensure that customers are reading/digesting the material.
Put a video online like the one shown during the evening’s presentation!
For the next set of customer conversations, advertise the $20 credit plus the free dinner in the upcoming report.
Meeting Date: 11/13/18

84
Recorder: Kelsey Bicknell Facilitator: Kymberly Johnson Table #: 7
ACTIVITY 1: What Are Customers Experiencing With Their Tap Water? What customers were experiencing with regard to TASTE:
The main concern from several customers was in regard to a chlorine taste.
One customer reported the water taste was slightly “off”.
What customers were experiencing with regard to ODOR:
One customer experienced a periodic stale odor from their water.
What customers were experiencing with regard to APPEARANCE:
No reported issues.
What customers were experiencing with regard to PRESSURE:
High pressure was reported in the Bear Canyon neighborhood. This has been a persistent problem, and many people have had to have pressure regulators installed to their home water lines.
In addition to the above categories, customers were ALSO experiencing the following with regard to their tap water:
The hardness of the water came up a few times as customers have had issues with their appliances as a consequence.
Customers want the Water Authority to know:
Most customers at the table drink out of refrigerator filter because they prefer the taste of that.
Many customers use a water softener to accommodate for the hard water.
ACTIVITY 2: Assessing & Improving the Water Quality Report 3 out of 4 customers read the Water Quality Report. Customers LIKED the following about the Water Quality Report:
Customers appreciated the effort to present all the data.
One customer liked the flow charts in the report.
Customers did NOT LIKE the following about the Water Quality Report:
They felt it contained too much information.
The foldout format is confusing to read and difficult to navigate.
Customers described the format as “puzzle‐like.”
The tables contain too much information that is not helpful to the non‐expert.

85
Customers wanted to know the following about Water Quality:
What has the utility been doing and what has it been doing well with regard to water quality? For example, why aren’t conservation and safety efforts and awards more publicized?
Are there equity issues in the city? Do certain populations experience different water quality than others?
Has the ABQ Journal done an article on the awards won by the Water Authority?
What would be the response of the Water Authority if there was a water quality issue?
What can customers do to continue to preserve our water quality?
What does our water future look like?
Customers had the following ideas for improving the Water Quality Report:
Put the report in a booklet format.
Put all awards won FRONT AND CENTER; the goal should be to highlight what the Water Authority does and does well.
Make sure conservation, health, and safety efforts are highlighted.
Important names and numbers should be on the front cover.
The front cover should make it clear where to look for important information in the report (i.e., which page number it is on, etc.).
Use social media (Twitter, Facebook) and traditional media (newspaper, TV, radio) to advertise the existence of the report and get it out to readers.
Meeting Date: 11/13/18 Recorder: Mo Hobbs Facilitator: Leslie Kryder Table #: 8
ACTIVITY 1: What are customers experiencing with their tap water? What customers were experiencing with regard to TASTE:
One customer notices a fishy taste that comes and goes, and said that this seems to be a common complaint in the Volcano Vista neighborhood. This customer said someone from the Water Authority came out to test the water, and found no issues.
Several of the customers said they prefer to drink filtered or bottled water; although none of them noted an issue with taste.
What customers were experiencing with regard to ODOR:
The customer from the Volcano Vista neighborhood said their water also has a fishy odor sometimes. This was a secondary concern compared to taste.
What customers were experiencing with regard to APPEARANCE:

86
A customer said that there was a pipe break that was connected to her line, and since then they can see sediment settling in a glass of water.
This customer also noted that when they filled their pool, there was a strange, greenish color at the water line.
What customers were experiencing with regard to PRESSURE:
One customer noted that their pressure is often low inside; they said they thought it could be due to calcium build up, but were unsure.
In addition to the above categories, customers were ALSO experiencing the following with regard to their tap water:
Customers at this table felt there should be a calcium, or hardness category. One customer noted that their hose nozzle becomes very difficult to remove due to calcium build up. Five out of six customers had calcium build up issues.
Customers want the Water Authority to know:
They appreciated the Water Authority taking the time to have these customer conversations.
ACTIVITY 2: Assessing & Improving the Water Quality Report 3 out of 6 customers read the Water Quality Report.
Customers LIKED the following about the Water Quality Report:
The customers liked that the report was comprehensive.
They also liked that it had a schematic showing where their water comes from.
Customers did NOT LIKE the following about the Water Quality Report:
They felt it was too overwhelming/busy and difficult to focus on or to know where to start.
Customers wanted to know the following about Water Quality: They suggested that the following should be included in the WQR:
A brief section that discusses the dos and don’ts of contaminant disposal.
They wanted to see long‐term and short‐term comparisons of previous years to see how we are doing.
They wanted to know more about the following in general (not necessarily that it be included in the WQR):
EPA information about which major contaminants are polluting rivers and aquifers (e.g. oil, batteries).
How the Water Authority finds and cleans up contaminants.
They want updates on other than just water quality.

87
Customers had the following ideas for improving the Water Quality Report:
They felt that the report it should be made simpler, but with more eye popping colors.
They liked the idea of getting online monthly updates.
They suggested moving the contact list to the front.
Add a Table of Contents.
Use a booklet format, and include an executive summary.
An online notification and PDF version for those who pay their bills electronically.
They recommended an advertisement (TV or radio) that alerted customers that the WQ report was coming out in the mail.
Be bold in letting customers know they are drinking award‐winning water!

88
CUSTOMER CONVERSATIONS EVALUATION FORM COMMENTS (Comments Provided on Evaluation Forms at the end of the meeting)
October 18 Always well organized and respectful of participants’ times. Thanks for the opportunity to be here – keep up the good work!! Our facilitator, Kymberly, did a great job! Very good session. Customer conversations are an excellent idea! Build trust in ABCWUA, while contributing to
improved customer service. Time well spent! 3 substances I believe should be tested in our water:1) glyphosate( main ingredient/
pesticide in round up) 2) chlorpyfiros( another common pesticide) 3) plastic( now detectable at the molecular level in water)
This is a great way to connect with our community. I think PNM should learn from the Water Authority. I enjoy these events.
Lively, interesting: enjoyed today. Make things more understandable. Continue forward, progress and process. Thank you. In general I might suggest more digital interactions. (Apps videos on websites,
YouTube channel, etc.) Thank you! Water distribution diagram needs to indicate which direction is uphill/ downhill. Please keep the public up to date on the addition of Fluoride to our water‐ when, where,
why, where meeting are being held, etc. Thank you for your caring and your interest! This was fun! Recycle food boxes. Inform consumers that chlorine will disappear if you let the water stand
for minutes or hours. Show graph. I like seeing that the input from these sessions actually appear to make a difference. The information about PPCP’s was very interesting. Problem: no one knew about the water quality phone No. may have a problem with
response back from group meetings. Did you really use an idea? How? Many people in city filter water by different means so they really don’t know how the “raw” water is.
Thank you very much! I like the activities so I can see what other people are experiencing. I learned something new at every meeting that I attend and want to attend more. October 24 Very good presentation. Very informative. Great discussion! Thank you for listening. The combination and structure of all work put together was organized well. Address hard water and how we might treat it. Thanks for the opportunity to make a change. Share your process with the public, service announcement. Enjoyed our facilitator. Make the water quality report smaller in size, scope.

89
While it was nice to have so many participants the room was a little noisy and it was hard to be heard.
Meeting today exceptional. SARA was great. Team was great. Really enjoy participating in customer conversations. In fact saw implementation of recommendation from the last one. Liked that experts walked around to answer more in depth questions. Really, really, really like that water being treated more than required. Keep EPA regs!! Please
Sara and Dipendra were fabulous. Sara and Dipendra was great! A great “tool” that ABCWUA already has is the elephant cartoon figure on TV commercials—
use in printed material also to educate and inform. Move into in Spanish. It gets very loud in the room. I am used to speaking loudly because I lecture in college daily,
but I could not speak loud enough to be heard. Thanks for dinner and for listening to us. I appreciate the water authority asking the public for comment and responding to our ideas
and concerns. Congratulations in the awards! Keep up the great work! The conversation about the report was very good. Great discussion involving the community. Difficult to hear each other over the noise of everyone talking at once. Watershed protection is very important and should be in the annual report! Today’s session was very noisy hard to hear other people at my table. Have another screen
at back of room so some people don’t have to turn around to watch presentation. Was informative and appreciate the meal that was provided. Since becoming a new home owner a year ago, I am appreciative of what the water
authority is doing for the city. This is my first contact with the water authority and I’m impressed. It is refreshing to know there are dedicated leaders who are passionate about the quality of water for the communities they serve. Dinner and water bottle freebie is a great adage and I’m interested in knowing how to volunteer for events or public information sessions.
November 8 I am concerned about regulations of the EPA being eliminated by the present
administration. I hope the water authority maintains its high standards. Multiple dates @ location. I came from Taylor Ranch because unavailable on the date and
time. Also for the one in spring wanted to attend but they filled up. Thank you! These are great. Thanks for being so responsive. Good information. Just awesome work!! I enjoy coming and learning new things and hear the great questions and feedback. I would
participate again Mineral white deposits, how to clean them(e.g., white vinegar) Went well, I did learn things here today. Facilitators are well spoken and organized. Elizabeth is very good at keeping meetings in
track. Information presented was great information. Experts being present was a great idea in the round table discussions for answering questions.

90
I’m glad there was a children’s station even though not many kids showed up! I really liked the group discussion style.
Thank you for taking time to put something like this together. It was very informational and it’s great to hear the communities input.
Thank you for the meal. The water report could have financial information on average billing for households.
Well worth over time. I really enjoyed and learned about water. How good our is. Very organized! People friendly! Great facilitator! Visual and handouts very informative!
Young helpers very personable! H2o authority is doing an excellent job. Proud to live in NM! Meal was excellent, thank you!
Love this process! Keep up the good work. Excellent facilitators‐ people that work for the water authority at this event answering
questions? Stellar! Appreciate this meeting thank you! Sewer talk. Very informative. I would participate again. Option to view annual report online or request a hard copy. Too much info on report. Very good presentation. M&Ms were appreciated! Had a great group of people at my table.
Thank you! I think the water authority is the most responsive utility we have, thank you. Consult young graphic design form for your water report. The 2 hours went by quickly and pleasantly. Facilitator was excellent (Leslie Kryder) thank
you! I liked the format a lot—it was moved quickly. I would have liked more information about
source water pollutants and how the water authority address them. Go digital Useful information that should be available to all residents not just for customer
conversations. Thank you for having reps to go around the tables listen, and respond. I felt they were
listening and taking notes/feedback. This was very informative and I appreciated the information and having questions answered and explanations!
Curious to know your response rate on surveys resorting ABQ water quality. Are the dissatisfied a small percentage of those who are sent survey?
Water effects on people with disabilities needs to be emphasized. It’s hard not to scare everyone but with people with autoimmune issues, how might they be effected.
November 13 Very informative! Time well spent. Appreciate listening and talking detailed impact from us customers! Facilitator here, please make the papers for center of table smaller exp. When we don’t
write on them. Thanks! Thanks for letting us help you!

91
I’m impressed! This was well run, well prepared and showed a strong dedication to educating and getting feedback from customers. Thank you!
Appreciate the personal touch. The food. Thank you for caring. Very well run and informative. Thank you for letting me participate. I will go home and read my water report‐ lots of new
info! This event was well put together. Keep up the good work you are doing. Great meeting. This was nice. 90 minutes instead of 120. Thanks for a productive meeting. Advertise your accomplishments on the bills/ website so
that your customers can see that their authority is serving them well. Very well organized! Well organized, thank you! Well organized! Good job( everybody) Thank you for schooling me on the what and how you care about our drinking water. I will
pass on the information to my neighbors. Our facilitator was excellent. Facilitators critical because some folks tend to dominate the conversation. An equal number of people at each table would be better. Thank you very much for doing the good job!! Well organized, good time control. Enable maximum information Well facilitated and structured appreciate this particular govt. agency, good impact! Fracking was just approved for Rio Rancho. Fracking is not included in clean water Act. The
New Mexico Tech study and the movie made by Dom Phillips and others states the Rio Grande aquifer will probably be polluted. The plans to see Rio Puerco brine water to frack and be reinjected into areas with multiple faults is frightening.
Extremely concerned about the new Sandoval county ordnance being passed at this moment – public comment Nov. 29 and this horrid ordnance will be passed and using franking (horizontal) in Rio Rancho map on Sandoval county website allowing thrust to frack! One accident and water will have to be purchased! And could pollute Rio Grande basin water flows down! Please be alert!
Very impressed with all aspects of the meeting. Examples are: making navigation to the meeting easy, providing a meal, providing a very good facilitator, providing a record keep for each table, having Water Authority experts circulating during exercises. My impression is that the Water Authority really cares and wants to be the best it can be. This was excellent!
This was a very enjoyable community team building experience. It was professionally done and very valuable. I learned a lot from the water authority and my table “ neighbors” Thank you
Get some millennials in here‐ for their input and edification. Let THEM put it on social media.
Really well done! From vehicles with arrows and flashlights to dinner to excellent facilitators and recorders. Great process!

92
I think we covered the material well. I enjoyed having a small group and being able to drill down a little bit farther
Sell bottled water! What are other cities doing? Do they have the same issue of quality reports/ testing/ surveys? Could be caused by changes in society, altitudes about our, competition/ ads from bottled water, consumption make, of flavored drinks.