Fiscal Status of Shizuoka Prefecture - chihousai.or.jp · Schindler Elevator Liechtenstein Triumph...
28
Fiscal Status of Fiscal Status of Shizuoka Prefecture Shizuoka Prefecture October October 2015 2015
Transcript of Fiscal Status of Shizuoka Prefecture - chihousai.or.jp · Schindler Elevator Liechtenstein Triumph...

Fiscal Status of Fiscal Status of Shizuoka PrefectureShizuoka Prefecture
OctoberOctober20152015

Presentation Highlights
2
1. Shizuoka has active industries and strong economic fundamentals
2. Shizuoka constantly performs administrative reform and sustains a healthy budget
3. Shizuoka prefectural bonds have received high credit ratings from two credit rating companies (A1 from Moody's and AA+ from R&I)
⇒ Overview of Shizuoka (P4 – P10)
⇒ Fiscal Position of Shizuoka (P11 – P15)
⇒ Bond Management of Shizuoka (P16 – P18)

3
1 Overview of Shizuoka
(1)Location and Scale 5
(2)Stable Economic Foundation 6
(3)Economic Scale 7
(4)Transportation Infrastructure 8
(5)A Vibrant Industrial District 9
(6)Abundant Tourism Resources 10
2 Fiscal Position of Shizuoka
(1)Change in Revenue Accounts 12
(2)Change in Expenditure Accounts 13
(3)Status of Debts and PB 14
(4)Current Conditions 15
3 Bond Management of Shizuoka
(1)Prefectural Bond Summary 17
(2)Prefectural Bond Issuance Plan 18
4 Reference Materials
Table of Contents

1 Overview of Shizuoka
Shizuoka Prefecture
World Heritage siteWorld Heritage site
Mt.FujiMt.Fuji
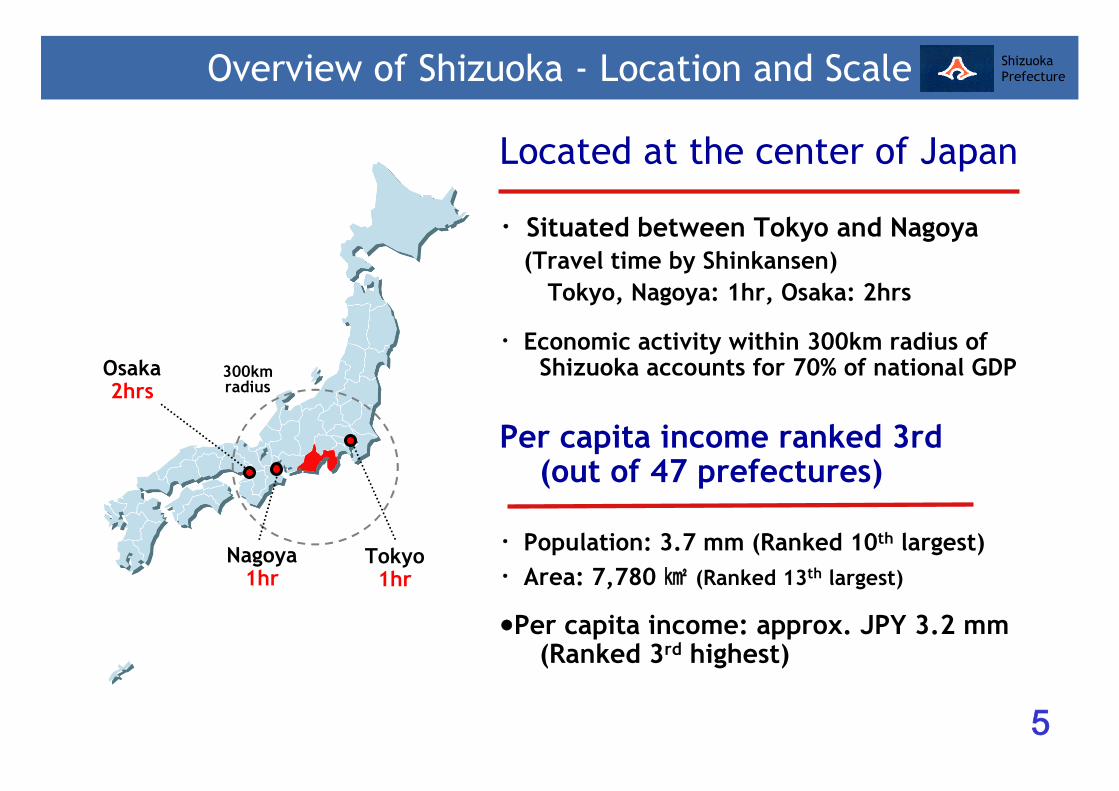
Located at the center of Japan
・Situated between Tokyo and Nagoya(Travel time by Shinkansen)
Tokyo, Nagoya: 1hr, Osaka: 2hrs
・Economic activity within 300km radius of Shizuoka accounts for 70% of national GDP
Per capita income ranked 3rd(out of 47 prefectures)
・Population: 3.7 mm (Ranked 10th largest)・Area: 7,780 ㎢ (Ranked 13th largest)
●Per capita income: approx. JPY 3.2 mm (Ranked 3rd highest)
Nagoya1hr
Tokyo1hr
Osaka2hrs
300km radius
5
Overview of Shizuoka - Location and Scale Shizuoka Prefecture

Revenue from manufactured products (Ranked 4th in Japan)Ranked 1st
Medical Equipment, Pulp & PaperRanked 2nd
Transportation Equipment, Electrical Machinery
The global brand name companies, HONDA, SUZUKI, and YAMAHA, were all founded in Shizuoka
The founders of HONDA, TOYOTA and YAMAHA are Shizuoka natives
Major Prefectural Companies
6
Total revenue from manufactured products (2013)
Leading domestic"Land of Manufacturers"Balanced Industrial Structure
Overview of Shizuoka - Stable Economic Foundation
15.7trillion yen
Beverages,Cigarettes,Foodstuff
Foods
Pulp & Paper
Plastic Products
Chemicals(incl. Medical Equipment)
ElectricalMachinery
General Machinery
28.1%22.3%
11.5%
10.4%
4.7%
7.1%7.5%
3.7%4.7%
Transportation Equipment
4th
Ranked
Piano Manufacturing
And Others

7
GDP about the same as that of Qatar・GDP: USD 186.4 billion
・Ranked 10th in Japan (out of 47 prefectures)
GDP of Shizuoka in relation to other countries (2012)Unit: USD bn
Overview of Shizuoka - Economic Scale
Shiz
uoka
Pre
f

Port of Shimizu
Port of Omaezaki
24.5 trips per week to China, South East Asia,
North America, etc.
Port of Shimizu
Tokaido Shinkansen
Tomei Expressway
New Tomei Expressway
Upgrade to the road traffic network with the opening of the New Tomei Expressway in April 2012 running parallel to the Tomei Expressway, a major artery of Japan.
8
Overview of Shizuoka - Transportation Infrastructure
Domestic Routes 4 routes 49 round-trips per weekInternational Routes 16 routes 53 round-trips per week<Destinations>Seoul, Shanghai, Wuhan, Taipei etc
Mt.Fuji Shizuoka Airport
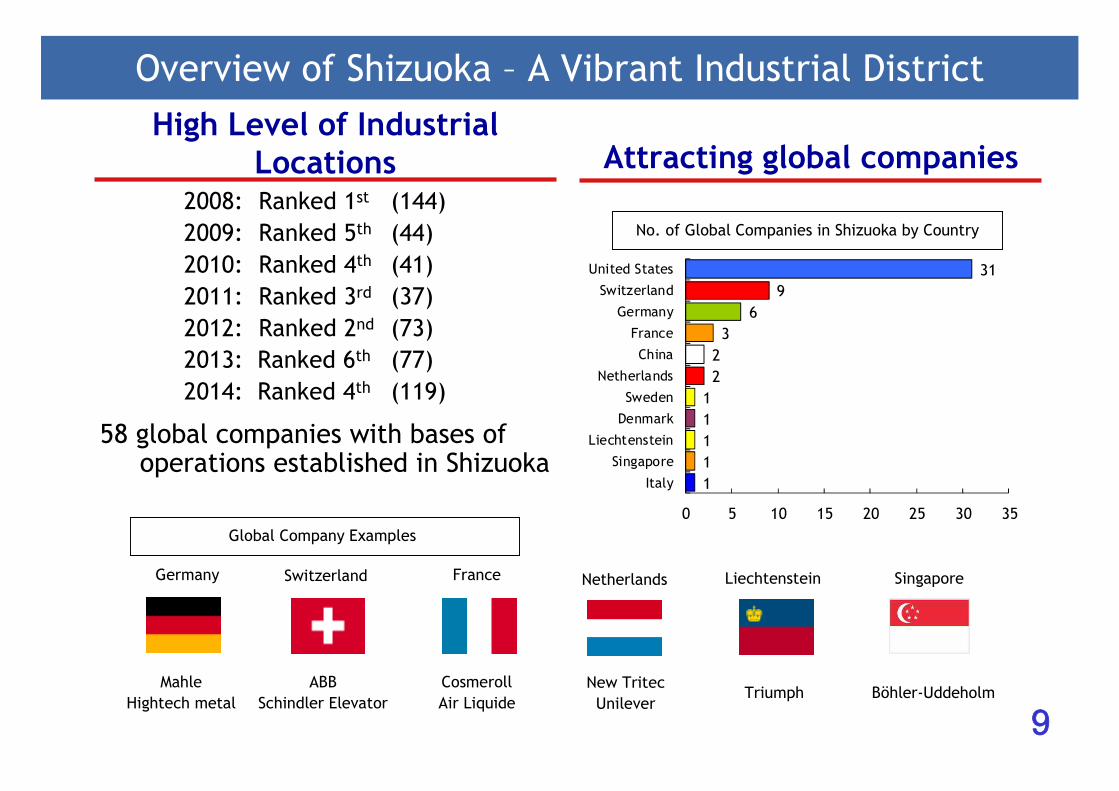
2008: Ranked 1st (144)2009: Ranked 5th (44)2010: Ranked 4th (41)2011: Ranked 3rd (37)2012: Ranked 2nd (73)2013: Ranked 6th (77)2014: Ranked 4th (119)
58 global companies with bases of operations established in Shizuoka
Attracting global companiesHigh Level of Industrial
Locations
Germany
MahleHightech metal
Netherlands
New TritecUnilever
France
CosmerollAir Liquide
Switzerland
ABBSchindler Elevator
Liechtenstein
Triumph
Singapore
Böhler-Uddeholm
9
Overview of Shizuoka – A Vibrant Industrial District
Global Company Examples
11111223
69
31
0 5 10 15 20 25 30 35
Italy
Singapore
Liechtenstein
Denmark
Sweden
Netherlands
China
France
Germany
Switzerland
United States
No. of Global Companies in Shizuoka by Country

10
Overview of Shizuoka - Abundant Tourism Resources
Hot springsShirakabe-soh
Asagiri Food Court and Mt. Fuji
●塩城塩城
石家荘石家荘●
Hefei
Mt. Fuji Shizuoka Airport
Shin-Chitose
(Hokkaido)
TianjinSeoul
Shijiazhuang
Xian Zhengzhou
Nanning Taipei
Naha
Kagoshima
FukuokaYancheng
ShanghaiNanjing
Wuhan
Changsha Wenzhou
NingboHangzhou●

“Diamond-Fuji” seen from the lakeside of Tanukiko
2 Fiscal Position of Shizuoka
Shizuoka Prefecture

12
Tax revenue has been recovering in the recent years
Fiscal Position of Shizuoka-Change in Revenue Accounts
Unit:JPY bn
estimate
13
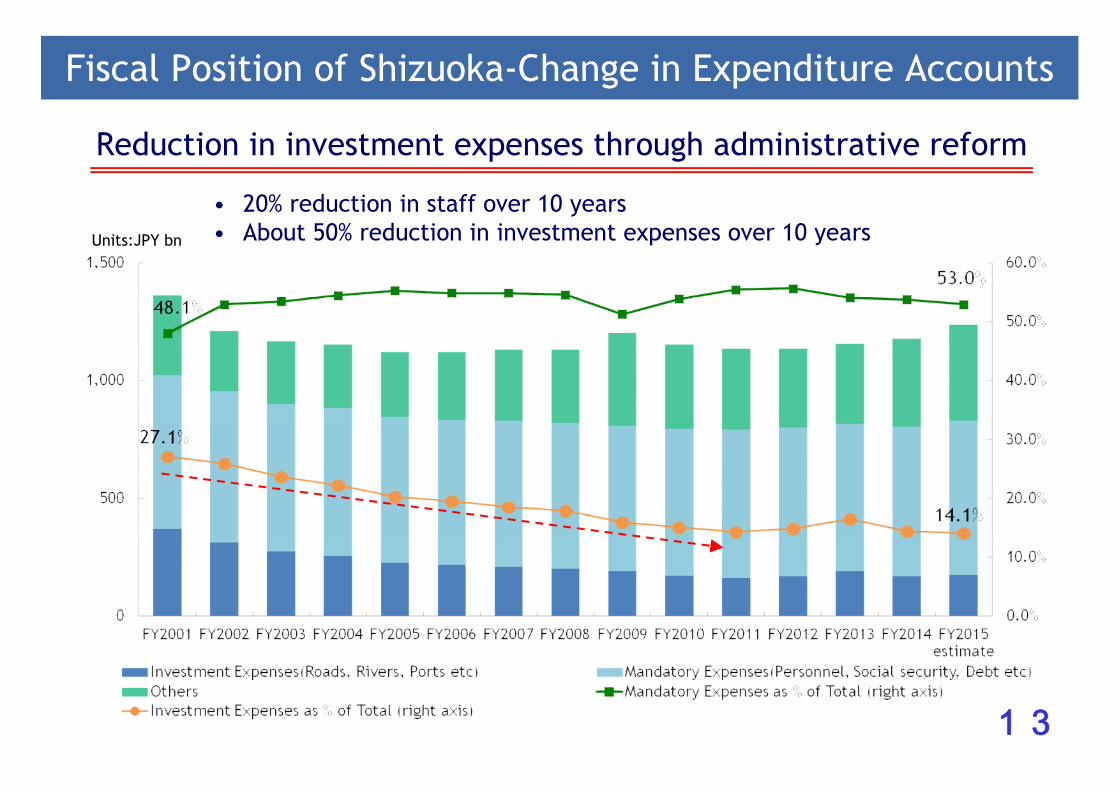
Fiscal Position of Shizuoka-Change in Expenditure Accounts
Reduction in investment expenses through administrative reform
• 20% reduction in staff over 10 years• About 50% reduction in investment expenses over 10 yearsUnits:JPY bn

Surplus maintained for primary balance
14
Category End of FY2014(JPY bn) Status
Prefectural bond balance
(General Account)2,709 Proportion of GDP (2012): approx. 17%
(Note: National figure approx. 149%)
CategoryEnd of FY2014
(JPY bn) Status
Primary balance 122 Surplus maintained
Fiscal Position of Shizuoka-Status of Debts and PB

All four indicators are performing better than the nationally established standards
National Standard
Early warning limit
Reconstruction limit
3.75% 5.0%
8.75% 15.0%
25.0% 35.0%
400.0% -
15* With the exception of the Future burden ratio, if national standards are exceeded, national government authorization and additional national government involvement is required to issue bonds
Fiscal Position of Shizuoka – Current Conditions
4 Indicators* Description Fiscal 2014
Real deficit ratio Amount of general account deficit as a proportion of fiscal scale
(Surplus)
Consolidated real deficit ratio
Amount of all account deficits as a proportion of fiscal scale
(Surplus)
Real debt payment ratio Public debt expenses as a proportion of fiscal scale 14.5%
Future burden ratio Prefectural bond balance as a proportion of fiscal scale 229.8%

Japanese paintings (Ukiyo-e) “Aka-Fuji”
3 Bond Management of Shizuoka
Shizuoka Prefecture

Local Government bond (LGB) creditworthiness
and Safety of Japanese LGB• There are strong financial
support system and check system for LGs by NG (National Government).
• LGs (Local Governments) and debt discharge of LGB cannot default under current Japanese legal system.
• Therefore, payment failure has NOT occurred to date.
• From these facts, Japanese financial authority assigned 0 % riskweight to LGB in the standardized approach of BIS regulations (Basel II).
17
Bond Management of Shizuoka - Prefectural Bond Summary
IssuancePolicy
IssuancePolicy
Format: Japanese domestic municipal bond
Maturity : 5y, 10y, 15y, 20y and 30y
BIS Risk Weight : 0%
Accumulation rule for Sinking FundAccumulation of 3.7% (1/27th) of total prefectural bond issuance
after 3 year deferral period (Lump sum payment at maturity)
Shizuoka Issued Bond Ratings - Same as JGB ratings
Rating and Investment Information, Inc.
Sound prefectural administration through well-balanced fiscal consolidation policy
Rating Company Comment (Dec 2014)
AA+ Stable
Moody’s
Reflect a slowly improving fiscal performance, a stable and strong regional economy and its prudent fiscal and operational management
Rating Company Comment (Mar 2015)
A1 Stable

● Shizuoka Prefectural BondsIssuance Plan - Fiscal 2015 (Unit: JPY bn)
18
Expected Issuance from November5-year: JPY 10bn (Mar: JPY 10bn)10-year: JPY 20bn (Nov: JPY 10bn, Mar: JPY 10bn)20-year: JPY 10bn (TBD)Total: JPY 40bn
Bond Management of Shizuoka - Prefectural Bonds Issuance Plan
※Non-residents and non-domestic entities are exempted from paying taxes on the interest of transfer local government bonds.The procedures have been simplified from June 2010.
5-year10-year15-year20-year30-year
Sub-Total
Total 331.5
30290Total Public Offering
Joint Issuarnces (10-year)
Others 41.5
ShizuokaPrefectural
Bond
260
40120
5030
Issue Amount
20
Coupon(%)
Spreads(JGB+bp)
Issue amount (JPY bn)
Launch
5yr
0.142 4.0 10 2015/4
0.157 5.0 10 2015/6
0.101 5.0 10 2015/10
10yr
0.425 7.0 10 2015/4
0.544 10.0 20 2015/5
0.578 9.0 20 2015/7
0.494 9.0 20 2015/8
0.515 12.0 10 2015/9
0.481 15.0 20 2015/10
15yr
1.062 3.0 20 2014/6
0.966 2.5 10 2014/10
0.828 2.5 10 2015/5
20yr
1.473 4.5 10 2014/6
1.253 3.5 20 2015/7
1.129 3.0 20 2015/10
30yr1.862 15.0 30 2014/6
1.539 14.0 30 2015/8
Recent New Issues

Address: Finance Division, Management Department9-6 Otemachi, Aoi-ku, Shizuoka-City,Shizuoka Prefecture 420-8601, JAPAN
TEL: +81-54-221-2036Email: [email protected]: http://www.pref.shizuoka.jp/a_foreign/english/index.htmlBloomberg: SHIZUP Govt <GO>
Shizuoka Prefecture

4 Reference Materials
Shizuoka Prefecture
● Japanese Local Government Bonds
● Fiscal Health Indicators
● General Accounts - Change in Revenues
● General Accounts - Change in Expenditures
● Change in Prefectural Bond Balance
● Change in Primary Balance
● Status of Sinking Fund Reserves
● Financial Statements (Fiscal 2013) Yokoyama Taikan,"Mt. Fuji Dyed Ultramarine“(Collection of the Shizuoka Prefectural Museum of Art)

Japanese local government bonds have a risk weight of zero as a result of powerful national fiscal backing, a tax system designed to prevent failure and other measures as described below.
From January 1, 2008, tax exemption measures apply with respect to the interest on transfer local government bonds for non-residents and non-domestic entities which satisfy the prescribed conditions outlined below. Prior to this date, a 15% source deduction was deducted from interest earned on Japanese local government bonds by non-residents etc.
Cases settled through the Japan Securities Depository Center, Inc. ■ In cases of non-residents, non-residents who hold the bonds through a qualified foreign intermediary or qualified account management institution etc.
Cases where appropriate tax exemption form is submitted
Effective June 2010, the following has been implemented to simplify the tax exemption procedures related to interest earned on transfer local government bonds by non-residents and expand those qualified for tax exemption status.Furthermore, it is now possible to settle with Euroclear.
Simplification of procedures by the elimination of separate individual bookkeeping under certain prescribed conditions, and a change from having to perform tax exemption procedures for each issuer (several) to just each transfer institution.Expansion of the range of qualified foreign securities investment trusts, and tax exemption status for redemption profit and loss
Non-residents/Non-domestic entities
Qualified foreign intermediary(including Clearstream, Euroclear)
Specified transfer institution (subcustodian)
Director of tax office with jurisdictionover the specified transfer institution
Simplification of tax exemption procedures
1.Local Issue Tax SystemWhen determining budgets for each fiscal year, the national government sets forth an estimate of revenues and expenditures for all local governments, and guarantees revenue shortfalls.As part of this system, the national government provides backing for the redemption of the principal and interest of local government bonds, thereby strengthening the repayment capacity of local government bonds by local governments.
2.Bond issuance approval system as an early correction measure■ Local governments must discuss with the national government before issuing bonds, and receive confirmation that the new bond issuance is
reasonable and will not negatively affect the local governments' future ability to repay principal and interest of local government bonds.
20
(Reference) Japanese Local Government Bonds

Real deficit ratio
Amount of general account based real deficit as a proportion of standard fiscal scale, serving as an indicator of the deficit level, and the extent of deterioration of fiscal management.
Consolidated real deficit ratio
Amount of all account (including public corporation accounts) based real deficit or amount of fund shortage as a proportion of standard fiscal scale, serving as an indicator of the deficit level and the extent of deterioration of fiscal management by combining the deficits and surpluses of all accounts.
Real debt payment ratio
Amount of redemption of principal and interest covered by general accounts as a proportion of fiscal scale, serving as an indicator of the amount payable for local government bonds and cash flow levels.
Future burden ratio
Real debt, including investment entities engaging in local public corporations and loss compensation, to be covered by general accounts as a proportion of fiscal scale, serving as an indicator of the current balance of local government bonds and bonds likely to be paid in the future by general accounts, and the extent of pressure on future finances.
With the implementation in April 2008 of the "Act on Assurance of Sound Financial Status of Local Governments," the fiscal status of local governments are objectively represented, and as a measure to evaluate the fiscal health or need for restructuring, the following four fiscal indicators have been set forth as Fiscal Health Evaluation Ratios, and accordingly, all local governments are required each fiscal year to have their Fiscal Health Evaluation Ratios as based on figures for the previous fiscal year, examined by an evaluation committee, and then report those results to the local assembly and local residents.If even one of the Fiscal Health Evaluation Ratios exceeds the early warning limit standard, in addition to an external audit, a Fiscal Improvement Plan must be prepared and improvement efforts will be encouraged; if the 3 indicators excluding the Future Burden Ratio worsens and any one of the indicators exceeds the reconstruction limit, additional national government involvement including the partial limitation on the issuance of bonds may be effected.
<<Illustration>>Healthy stage (attention paid to maintain indicators and information disclosure)●Evaluation by evaluation committee, reporting to
local assembly, public announcement
Early-warning stage(Fiscal improvement by voluntary effort)●Preparation of Fiscal Improvement Plan (approved
by local assembly), public announcement●Mandatory external audit●Reporting to local assembly of status of plan
implementation, public announcement
Fiscal reconstruction stage (reconstruction involving national government)●Preparation of Fiscal Reconstruction Plan
(approved by local assembly), public announcement●Mandatory external audit●Discussion with and approval of Fiscal
Reconstruction Plan by Minister for Internal Affairs and Communications● Reporting to local assembly of status of plan
implementation, public announcement
FiscallyHealthy
Fiscal Collapse
21
(Reference) Fiscal Health Indicators
Reconstruction limit
Early warning limit

22• Fiscal 2015 figures are initial budget estimates, actual figures provided up to Fiscal 2014
(Units: JPY bn, %)
(Reference) General Accounts – Change in Revenue
Categories FY2001
FY2002
FY2003
FY2004
FY2005
FY2006
FY2007
FY2008
FY2009
FY2010
FY2011
FY2012
FY2013
FY2014
FY2015
Prefectural Tax 468 418 425 438 457 488 567 541 418 402 398 406 423 448 482
% of Total 33.9 34.1 35.9 37.5 40.3 43.0 49.6 47.3 34.4 34.4 34.6 35.2 35.9 37.4 38.9
Local Allocation Tax 207 205 192 165 169 144 128 116 148 168 164 165 156 156 132
% of Total 15.0 16.7 16.2 14.1 14.9 12.7 11.2 10.1 12.2 14.4 14.3 14.3 13.2 13.0 10.6
National Treasury
Disbursements231 206 190 181 154 127 118 130 202 149 137 131 146 129 132
% of Total 16.8 16.8 16.0 15.5 13.6 11.2 10.3 11.4 16.6 12.8 11.9 11.4 12.3 10.8 10.7
Prefectural Bonds 210 194 186 168 135 125 143 184 234 220 195 205 199 186 166
% of Total 15.2 15.9 15.7 14.4 11.9 11.1 12.5 16.1 19.3 18.8 17.0 17.8 16.8 15.5 13.4
Others 264 201 192 216 218 249 188 172 212 230 256 246 257 278 328
% of Total 19.1 16.5 16.2 18.5 19.3 22.0 16.4 15.1 17.5 19.6 22.2 21.3 21.8 23.3 26.4
Total 1,380 1,224 1,186 1,167 1,133 1,134 1,143 1,144 1,215 1,169 1,150 1,153 1,180 1,197 1,240

23
(Reference) General Accounts – Change in Expenditures
Categories FY2001
FY2002
FY2003
FY2004
FY2005
FY2006
FY2007
FY2008
FY2009
FY2010
FY2011
FY2012
FY2013
FY2014
FY2015
Mandatory Expenses 656 642 626 629 621 617 622 619 618 623 630 633 626 635 657
% of Total 48.1 53.0 53.5 54.5 55.3 54.9 54.9 54.6 51.3 53.9 55.5 55.7 54.1 53.8 53.0
Personnel Expenses 410 404 390 390 391 392 393 386 377 373 372 368 356 358 363
% of Total 30.1 33.4 33.4 33.8 34.9 34.9 34.8 34.0 31.3 32.3 32.8 32.4 30.8 30.4 29.3
Social Aid Expenses 59 61 54 57 56 63 66 69 72 77 81 85 89 93 101
% of Total 4.3 5.0 4.6 4.9 5.0 5.6 5.8 6.1 6.0 6.7 7.1 7.5 7.7 7.9 8.1
Bond Expenses 179 168 173 174 165 158 159 161 168 170 172 171 178 180 184
% of Total 13.1 13.9 14.7 15.0 14.7 14.1 14.0 14.2 13.9 14.7 15.1 15.1 15.3 15.2 14.8
Disaster Recovery Expenses 8 9 9 9 8 4 4 3 1 3 6 8 4 4 9
% of Total 0.6 0.7 0.8 0.8 0.7 0.3 0.3 0.3 0.1 0.2 0.5 0.7 0.3 0.3 0.8
Investment Expenses 369 315 277 258 228 219 211 203 192 173 163 169 191 171 175
% of Total 27.1 26.0 23.7 22.3 20.3 19.5 18.6 17.9 16.0 14.9 14.1 14.9 16.3 14.5 14.1
Public/Direct 191 175 150 137 120 111 101 90 89 92 90 94 102 88 97
% of Total 14.0 14.5 12.8 11.9 10.7 9.9 8.9 7.9 7.4 8.0 8.0 8.3 8.9 7.5 7.8
Standalone 179 140 128 120 108 107 110 113 103 81 73 75 89 83 78
% of Total 13.1 11.5 10.9 10.4 9.6 9.6 9.7 10.0 8.6 6.8 6.2 6.6 7.5 7.0 6.3
Others 338 254 266 268 273 287 300 312 394 358 342 335 340 374 408
% of Total 24.8 21.0 22.8 23.2 24.4 25.6 26.5 27.5 32.7 31.3 30.4 29.4 29.5 31.7 32.9
Total 1,363 1,211 1,169 1,155 1,121 1,122 1,132 1,134 1,204 1,154 1,135 1,136 1,157 1,180 1,240
(Units: JPY bn, %)
*Fiscal 2015 figures are initial budget estimates, actual figures provided up to Fiscal 2014*Annual figures include carry over from previous year, and does not include carry over to next fiscal year.*Real balance is accounting balance less assets to be carried over

24
(Reference) Change in Prefectural Bond Balance
2,228 2,318 2,373 2,401 2,401 2,402 2,419 2,479 2,579 2,663 2,719 2,787 2,835 2,874 2,908
0
500
1,000
1,500
2,000
2,500
3,000
3,500
FY20
01
FY20
02
FY20
03
FY20
04
FY20
05
FY20
06
FY20
07
FY20
08
FY20
09
FY20
10
FY20
11
FY20
12
FY20
13
FY20
14
FY20
15es
timat
e
(Units: JPY bn)
General Account Special Account Corporate Account

25
(Reference) Change in Primary Balance

Accumulation of 3.7% (1/27th) of total prefectural bond issuance after 3 year deferral period
26
(Reference) Status of Sinking Fund Reserves
164183
211 216 208
237275
311
338367 386
0
50
100
150
200
250
300
350
400
450
FY2005 FY2006 FY2007 FY2008 FY2009 FY2010 FY2011 FY2012 FY2013 FY2014 FY2015
estimate
(Units: JPY bn)

27
(Reference) Financial Statements (Fiscal 2013)
Assets Amount Liabilities Amount1 Financial Assets 733.8 1 Current Liabilities 202.3
(1) Cash 94.9 (1) Accured expenses 11.2(2) Credits 71.0 (2) Advances received and
deferred income 0.3Taxes receivable 12.8Accounts receivable 20.6 (3) Bonus provisions 21.6Loans, Others 42.8 (4) Expected LGB redemption
next fiscal year 154.5Bad debt reserve -5.2
(3) Financial securities 27.0 (5) Others 14.7(4) Investments 540.9 2 Non-Current Liabilities 3,474.8
Investment capital 24.8 (1) Local government bonds 3,060.2Funds 486.3 (2) Loans 13.4Others 29.8 (3) Retirement benefit
reserves 354.42 Non-Financial Assets 4,082.8
(1) Business Assets 1,313.8 (4) Other reserves 12.9Tangible fixed assets 1,301.8 (5) Others 33.9Non-tangible fixed assets, inventory assets 12.0 TOTAL LIABILITIES 3,677.1
(2) Infrastructure Assets 2,769.0Public use land assets 871.9 NET ASSETS AmountPublic use facility assets 1,818.9 Total Net Assets 1,139.5Others 78.2
TOTAL ASSETS 4,816.6 TOTAL LIABILITIES AND NET ASSETS 4,816.6
● Balance Sheet
● Statement of Changes in Net Assets
Amount
Balance at end of previous period 1,178.6
I Change in revenue source -74.1II Revenue sources appropriated
for asset formation 119.8
III Other changes in net assets -84.8
Balance at end of current period 1,139.5
● Statement of Cash FlowAmount
1 Ordinary income and expenditure 136.2
2 Capital income and expenditure -154.8
3 Financial income and expenditure 27.4
Current period income and expenditure 8.8
Opening funds balance 86.1
Closing funds balance 94.9
Amount
1 Ordinary Business Expenses 634.2(1) Personnel expenses 376.7
Employee wages 268.0
Bonus reserves carried over 20.7
Retirement benefit expenses 9.6
Others 78.4
(2) Building expenses 105.3
Supply expenses 14.9
Maintenance expenses 22.7
Depreciation expenses 36.1
Others 31.6
(3) Expenses 50.1
Business expenses 4.2
Outsourcing expenses 32.2
Bad debt reserves carried over 0.3
Others 13.4
(4) Business related expenses 102.1
Public bond expenses (interest payable) 45.6
Interest on loans, Others 56.5
2 Moving expenses 323.7
Ordinary Expenses A 957.9
Business income 108.9
Business related income 28.4
Ordinary Income B 137.3
Net Ordinary Expenses A-B 820.6
● Statement of Administrative Costs(Units: JPY bn)