Fiscal Reform in Indonesia - mof.go.jp · Indonesia’s neighbors •Total infrastructure...
35
Fiscal Reform in Indonesia Mohamad Ikhsan University of Indonesia
Transcript of Fiscal Reform in Indonesia - mof.go.jp · Indonesia’s neighbors •Total infrastructure...

Fiscal Reform in IndonesiaMohamad Ikhsan
University of Indonesia

Presentation Structure
What is an Inclusive Fiscal Policy
Why inclusive fiscal reform needed
Is Indonesia’s fiscal policy inclusive?
Why Indonesia fiscal policy not inclusive?
How to make Indonesia fiscal policy to be more inclusive

Inclusive fiscal policy
Most of studies emphasize on distributive aspect of fiscal policy.
I would prefer to use a broader definition or scope of fiscal policy.
My inclusive fiscal policy should satisfy all three fiscal policy function ala Musgrave and Musgrave:
Allocation function to support growth
There are a strong correlation between growth and poverty. A reduction of poverty need an economic expansion. Hence, a better and efficient budget allocation [both from tax structure and spending] will lead to economic growth and a stronger impact on poverty reduction.
Distributive function
Stabilization function
A countercyclical budget would help the whole economic agents to smooth their consumption and to have a better business environment their planning. The poor would get more benefit because they lack of tools of protection against shocks and fluctuation [low saving and or no access to the insurance market]

For resource rich country like Indonesia: stabilization function is essential for meeting national aspiration
Aspiration of the country Greater national prosperity
Improved access to essential services and human development
Population safe and secure from poverty and “insecurities”
Realizing these aspirations is not possible if: GDP growth is volatile
Macroeconomic instability is frequent
Public spending in priority development areas is volatile
Resource‐rich countries face particular challenges Price of main exports volatile in global markets (booms and busts)
Foreign reserves and/or the exchange rate tend to follow boom and bust cycles
Government revenues directly affected by these cycles
Government revenues indirectly affected as private spending is squeezed
Solution: establishing a sound fiscal framework.
4
Stabilization matters for resource rich country

‐15%
‐10%
‐5%
0%
5%
10%
15%
1970
1971
1972
1973
1974
1975
1976
1977
1978
1979
1980
1981
1982
1983
1984
1985
1986
1987
1988
1989
1990
1991
1992
1993
1994
1995
1996
1997
1998
1999
2000
2001
2002
2003
2004
2005
2006
2007
2008
2009
2010
2011
2012
2013
2014
2015
2016
Why inclusive fiscal reform needed?
Need a 6+ % p.agrowth rate to :1.create 1,8 m new
entrants 1% growth = 250
k - 300 k jobs2.To reduce poverty
to below 10% and near poor and vulnerable to below 30% of population
1997‐1999:Asian Financial
Crisis
1974 1st Oil Boom
1979 2nd Oil Boom
Global Oil
Shock
First Structural Reform
1988 ‐ 1996: High Growth
periodGlobal
Saving Glut
2008 – 2009:Global Financial Crisis
2012 ‐ sekarangWeakening commodity price;
Rebalancing of china economy;US normalization;
Global Political Uncertainy
before AFC 1998‘70 – ’97 : 7,2% p.a
Sumber: BPS, BKF diolah
’02 – ’16 : 5,5% p.a
To support growth
Indonesia’s Growth Episodes
5

Despite improvement, poverty reduction decelerates while inequality increases 6
‐1.5
‐1
‐0.5
0
0.5
1
1.5
2
2.5
02468101214161820
Poverty Rate (LHS)
Change in Poverty, yoy (RHS)
‐1.5‐1‐0.500.511.522.533.5
20
25
30
35
40
45yoy change Gini
Poverty reduction in 2016, though greater than in recent years, remains slower than before 2011.
The Gini coefficient in 2016 dropped below 40 for the first time since 2011.
• In order to continue the acceleration of poverty reduction and sustain the trend of falling inequality, improvements in fiscal policy are needed.
• In particular, Indonesia must spend more on the programs that are most cost‐effective at reducing inequality, such as direct transfers to poor and vulnerable households
Note: 2011‐2016 uses March Susenas data

How inclusive Indonesia’s fiscal policy recently?

• During the good times, spending mostly allocated to energy subsidy leaving capital and social spending low.

Excluding transfers, personnel is now the largest CG spending category, followed by goods and services and then capital
9
Economic composition of public spending by level of government
20 24
52
29
14
29
18
1614
21
23
170
24
3
3
0
1 4
2
7
534
22
10 6
0%
10%
20%
30%
40%
50%
60%
70%
80%
90%
100%
Central Province District National
2012(before fuel subsidy reform)
24 20
48
30
20 30
20
20
18
25
23
190
242
3
1
1 6
38
516
1613
5
0%
10%
20%
30%
40%
50%
60%
70%
80%
90%
100%Interestpayments
Subsidies
SocialAssistance
Others
Grants
Capital
Goods andservices
Personnel
2015(after fuel subsidy reform)
Percent
Source: World Bank COFIS database using MoF data Note: Central level excludes transfers to regions. Subnational 2015 uses budget data
Even after fuel subsidy reform,Capital spending and socialAssistance received lower portion than personnel

Hybrid Indicator of Coverage and Quality of Infrastructure Networks
Average Efficiency Score
Emerging Market Economies {n=50} 0.74
Emerging and Developing Asia {n=13} 0.69
All Countries {n=107} 0.73
Indonesia 0.65
Sumber: IMF, Making Public Investment More Efficient, 2016
There are rooms for improvement on the efficiency of spending
10

To accelerate growth requires significant increase in public (and private) infrastructure investment…
2.1
0.6
2.73.3
1.8
7.8
0.7 0.81.5
0.6 0.5
4.1
0
2
4
6
8
10
Central G
ov.
Subn
ationa
l Gov
.
Total G
ov.
SOE
Private
Total
Average (1995‐97)Average (2010‐14)
Public, SOE and private infrastructure investment fell sharply post Asian financial crisis and is behind many of Indonesia’s neighbors
• Total infrastructure investment in Indonesia has remained at 4 percent of GDP over the past decade.
• This is far below the pre‐1997 Asian financial crisis period of above 7 percent of GDP. It is also below Indonesia’s peers (China, India, Vietnam, Thailand).
Source: World Bank staff estimates
Nominal infrastructure investment levels as a share of GDP, percent
Source: BPS; World Bank staff estimatesNote: infrastructure excludes housing
Low spending and bad allocation has made public infrastructure behind

There is an urgent need to reverse the decline in core infrastructure capital stock (relative to the size of the
economy)…
10
20
30
40
50
60
70
1995 1997 1999 2001 2003 2005 2007 2009 2011
Share of total capital stock
Share of GDP
12
Infrastructure capital stock share of total capital stock and GDP, percent
Source: BPS; World Bank staff estimatesNote: infrastructure excludes housing
The infrastructure deficit is significant in every infrastructure sub‐sector• Roads: Road length grew only by 35 percent in
last decade, while vehicle growth was 300 percent;
• Ports: Jakarta’s Tanjung Priok port (75 percent of total trade) handles 6 million TEUs/year, compared with 30 million TEUs/year in Singapore;
• Electricity: 74 percent of Indonesians have access to electricity, compared with close to 100 percent for most of its neighbors. Indonesia’s power demand is expected to double in 7 years;
• Water supply and Sanitation: 36 percent of Indonesians have access to improved piped water, compared with 99 percent of Malaysians. Only 1% of urban water is properly collected and treated;
• Housing: Indonesia currently has substantial unmet housing needs. Estimates of the backlog range from around 11.9 million units (BPS, 2010) to 13.5 million by 2014 (home ownership information).
Source: World Bank analysis

… and improve Indonesia’s competitiveness
Source: Global Competitiveness Report 2015‐2016
Inadequate supply of infrastructure is among the top three problematic factors for doing business in Indonesia

Higher infrastructure investment could have delivered seven percent growth compared to 5.4 percent over 2001‐2012
5.4 6.07.3
0.0
1.0
2.0
3.0
4.0
5.0
6.0
7.0
8.0
Actual(3.1 percent)
Scenario I(5 percent)
Scenario II(10 percent)
Average real GDP growth over 2001‐2012 under different infrastructure capital stock
growth scenarios, percent
Simulation analysis based on assumed elasticities of 0.15 of GDP growth (cross country estimate) with respect to infrastructure capital stock
Source: World Bank staff estimates
Elasticities of infrastructure stock to output (GDP) from selected empirical researches
Country / Region Authors
Elasticity on output with respect to
infrastructure
Infrastructure measure
USA Aschauer (1989) 0.39 Public capital
Developing
countries
Easterly and Rebelo (1993)
0.16 Transport and communication
Cross‐country
Calderon and Serven (2003)
0.16 Transport and communication
Cross‐country
Esfahani and Ramires (2003)
0.12 Physical capital stock
South Asia Sahoo and Dash (2008)
0.18 ‐ 0.22 Physical capital stock
Cross‐country(meta‐analysis)
Ligthart and Bom (2009)
0.15 Public capital
China Sahoo et al. (2010)
0.20 ‐ 0.41 Physical capital stock

Recent fiscal policy in Indonesia has done relatively little to reduce poverty and inequality
The total impact of Indonesian taxes and government spending from 2012‐14 has been to reduce poverty by 1.1‐1.4 percentage points and the Gini coefficient by 2.6‐3.3 points
These reductions are relatively small by international standards.
This is due partly to the low impact of potentially progressive policies:
personal income tax collection is low with poor compliance;
social assistance spending is low;
health spending is low and much of it is not on the primary care which most benefits poorer households;
education spending is high and has some impact on inequality, but not to the degree seen in other countries.
It is also partly due to high spending on energy subsidies which predominantly benefit richer households.
15
Baseline Fiscal Policy Impact on Poverty and Inequality 2012‐14*
Note: *The 2012 result is from a fiscal incidence paper (World Bank and Ministry of Finance 2015), and the 2013 and 2014 results are from a coming update to that paper. The analysis is based on the Commitment to Equity framework (commitmentoequity.org), and applies standard fiscal incidence analysis to the majority of GoI taxes and spending
‐3.5
‐3
‐2.5
‐2
‐1.5
‐1
‐0.5
0
Poverty (percentagepoints)
Inequality (points ofGini)
2012 2013 2014 Average

2012 Effectiveness at Reducing Inequality Relative to Spending Levels
Source: Susenas 2012, World Bank calculations.Note: Effectiveness Index is Change in Market Income Gini to Final Income Gini / Budget as % of GDP
0.0
0.5
1.0
1.5
2.0
2.5
3.0
3.5
4.0
0
20
40
60
80
100
120
DirectTransfers
Education Health Subsidies
Percent of GDP
Effectiven
ess Ind
ex
Effectiveness Index (LHS) Budget (RHS)
(all HH (energy only)
Direct social assistance transfers are the most effective at reducing poverty and inequality but total spending is below the average of peer countries and it receives a small budget
allocation, relative to education and energy subsidies
15
The most effective programs at reducing inequality receive the smallest budget
Source: World Bank Aspire 2016. MoF 2016 Revised Budget.
2.40%
1.50%1.20% 1.10%
0.70% 0.62% 0.60%
0.0%
0.5%
1.0%
1.5%
2.0%
2.5%
3.0%
Brazil 20
11
Lower M
iddle Income 20
08‐
2014
East Asia
Pacific 20
08‐201
4 (all
income levels)
Bang
lade
sh 201
4
India 20
14
Indo
nesia
201
6
Phillipines 201
3
National HH based SA spending as a share of nominal GDP

Why Indonesia national budget not inclusive

Total national public spending has been below 20 percent of GDP even during the commodity boom…
The resource envelope for public expenditure has been limited by weak state revenue collection and maintenance of low fiscal deficits (adherence to fiscal rule of 3% of GDP)
18
National public expenditure by level of government (% GDP)% of GDP
10.5 10.2 11.3 11.7 11.9 11.4 10.3
1.4 1.31.3 1.6 1.7 1.5
1.3
5.1 4.84.9
5.1 5.7 6.8
5.8
16.9 16.217.5
18.4 19.3 19.717.4
0
2
4
6
8
10
12
14
16
18
20
2009 2010 2011 2012 2013 2014 2015
District
Province (excl.transfers todistricts)
Central (excl.transfers to SNGs)
National
Source: World Bank COFIS database using MoF data Notes: 2015 data for province and district are Budget. Remainder is realized expenditure
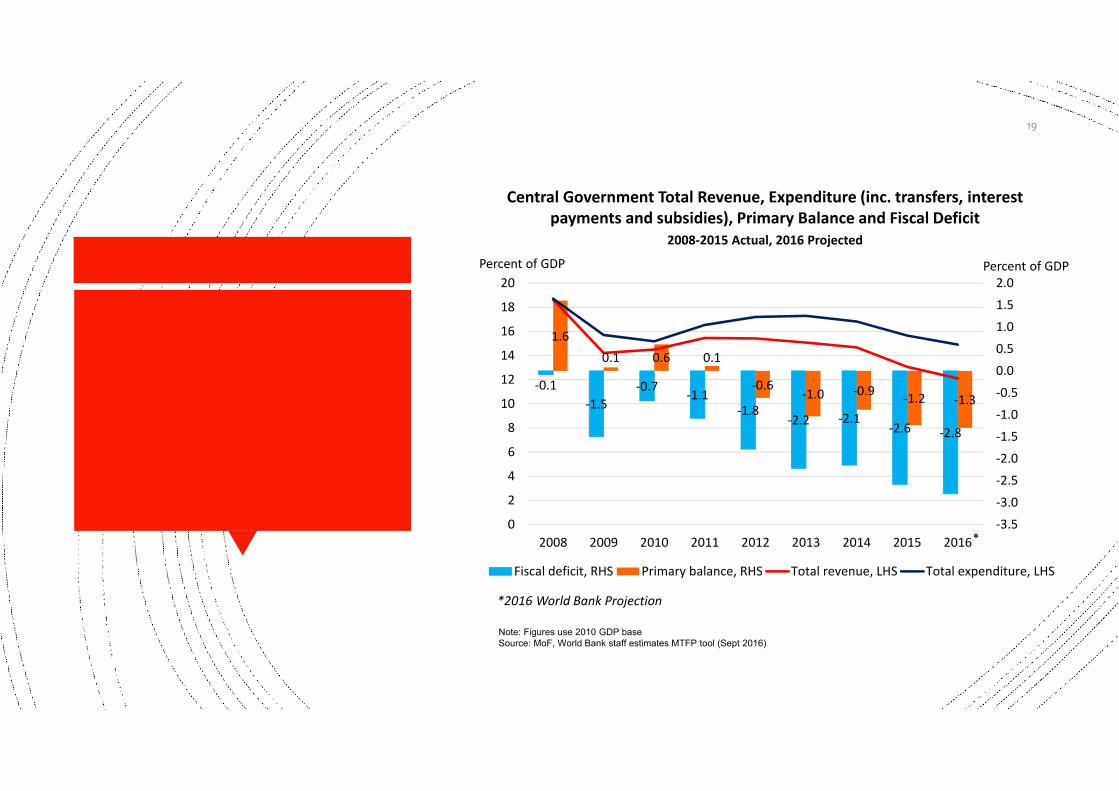
IDN: Post commodity boom: declining revenue & expenditure to GDP ratios and increasing primary & fiscal deficits (but within fiscal rule)
19
Central Government Total Revenue, Expenditure (inc. transfers, interest payments and subsidies), Primary Balance and Fiscal Deficit
2008‐2015 Actual, 2016 Projected
*2016 World Bank Projection
‐0.1‐1.5
‐0.7 ‐1.1‐1.8
‐2.2 ‐2.1‐2.6 ‐2.8
1.60.1 0.6 0.1
‐0.6‐1.0 ‐0.9 ‐1.2 ‐1.3
‐3.5
‐3.0
‐2.5
‐2.0
‐1.5
‐1.0
‐0.5
0.0
0.5
1.0
1.5
2.0
0
2
4
6
8
10
12
14
16
18
20
2008 2009 2010 2011 2012 2013 2014 2015 2016
Percent of GDPPercent of GDP
Fiscal deficit, RHS Primary balance, RHS Total revenue, LHS Total expenditure, LHS
*
Note: Figures use 2010 GDP baseSource: MoF, World Bank staff estimates MTFP tool (Sept 2016)

20122015
Brazil
ChinaEgypt
India
Indonesia,
MalaysiaMexicoPhilippines
Thailand
0
10
20
30
40
50
60
3.0 3.5 4.0 4.5 5.0
Expe
nditu
re as a
share of GDP
(%)
Log GDP per capita, 2012
Brazil
ChinaEgypt
India
Indonesia, Malaysia
Mexico
Philippines Thailand
0
10
20
30
40
50
60
70
3.0 3.5 4.0 4.5 5.0
Expe
nditu
re as a
share of GDP
(%)
Log GDP per capita, 2015
General Government Expenditure (% of GDP)
Indonesia’s level of expenditure (17.4% of GDP in 2015) is relatively low—nearly half of the average of emerging markets and middle‐income economies (32.3% of GDP)
…making Indonesia a small spender, in comparison with emerging markets and middle-income countries
Notes:(1) General government consists of central, state (province) and local (district) government(2) The sample of chosen countries are emerging markets and middle‐income economies, based on groupings by IMF Fiscal Monitor (April 2016)(3) There are 40 and 37 countries in the 2012 and 2015 sample(4) Horizontal axis: GDP per capita in respective years are in constant 2010 USD, then converted into logarithmic (log) form
Source: IMF Fiscal Monitor (April 2016) for fiscal data, WB COFIS Database for IDN expenditure data, and World Development Indicators for GDP per capita data

Caused by underperformanced revenues collections
y = 0.0005x + 21.803R² = 0.4799
0.0
10.0
20.0
30.0
40.0
50.0
60.0
70.0
0 10,000 20,000 30,000 40,000 50,000 60,000 70,000
Reve
nue Co
llection pe
r GDP
Per Capita GDP USD PPP
Tax collection per GDP and Per Capita GDP USD PPP, 2011
Indonesia
21

General Government Revenue (% of GDP)
BrazilChile
China
India
Indonesia, 14.8%
Libya
Malaysia
MexicoPhilippines
Thailand
0
10
20
30
40
50
60
3.0 3.5 4.0 4.5 5.0
Revenu
e as a sh
are of GDP
(%)
log GDP per capita (in 2010 US$)
Brazil
China
Egypt
Indonesia, 17.2%
Malaysia
Mexico
India
PhilippinesThailand
0
10
20
30
40
50
60
3.0 3.5 4.0 4.5 5.0
Revenu
e as a sh
are of GDP
(%)
log GDP per capita (in 2010 US$)
2012 2015
Among its emerging market and MIC peers, Indonesia has one of the lowest revenue-to-GDP ratios, pre and post commodity boom…
Notes:(1) General government consists of central, state (province) and local (district) government(2) The sample of chosen countries are emerging markets and middle‐income economies, based on groupings by IMF Fiscal Monitor (April 2016)(3) There are 40 and 37 countries in the 2012 and 2015 sample(4) Horizontal axis: GDP per capita in respective years are in constant 2010 USD, then converted into logarithmic (log) form
Source: IMF Fiscal Monitor (April 2016) for fiscal data, WB COFIS Database for IDN expenditure data, and World Development Indicators for GDP per capita data

20122015
Brazil
China
Egypt
India
Indonesia, ‐1.2%
MalaysiaMexicoPhilippines Thailand
‐25
‐20
‐15
‐10
‐5
0
5
10
15
3.0 3.5 4.0 4.5 5.0
Prim
ary ba
lance as a sh
are of GDP
(%)
log GDP per capita (in 2010 US$)
BrazilChina
Egypt
India
Indonesia, ‐0.4%
Malaysia
MexicoPhilippines
Thailand
‐10
‐5
0
5
10
15
20
25
30
3.0 3.5 4.0 4.5 5.0Prim
ary ba
lance as a sh
are of GDP
(%)
log GDP per capita (in 2010 US$)
*Primary balance is the overall fiscal balance excluding net interest paymentNotes:(1) General government consists of central, state (province) and local (district) government(2) The sample of chosen countries are emerging markets and middle‐income economies, based on groupings by IMF Fiscal Monitor (April 2016)(3) There are 40 and 37 countries in the 2012 and 2015 sample(4) Horizontal axis: GDP per capita in respective years are in constant 2010 USD, then converted into logarithmic (log) form
Source: IMF Fiscal Monitor (April 2016) for fiscal data, WB COFIS Database for IDN expenditure data, and World Development Indicators for GDP per capita data
General Government Primary Balance (% of GDP)
In 2015 IDN’s primary deficit (-1.2% of GDP) remains moderate relative to the average of emerging & MIC economies (-2.9% of GDP)…

2012 2015
BrazilChina
Egypt
India
Indonesia, ‐1.6%
Malaysia
MexicoPhilippines
Thailand
‐15
‐10
‐5
0
5
10
15
20
25
30
35
40
3.0 3.5 4.0 4.5 5.0
Fiscal balan
ce as a
share of GDP
(%)
log GDP per capita (in 2010 US$)
Brazil
China
Egypt
IndiaIndonesia, ‐2.5%
Malaysia
Mexico
PhilippinesThailand
‐25
‐20
‐15
‐10
‐5
0
5
3.0 3.5 4.0 4.5 5.0
Fiscal balan
ce as a
share of GDP
(%)
log GDP per capita (in 2010 US$)
Notes:(1) General government consists of central, state (province) and local (district) government(2) The sample of chosen countries are emerging markets and middle‐income economies, based on groupings by IMF Fiscal Monitor (April 2016)(3) There are 40 and 37 countries in the 2012 and 2015 sample(4) Horizontal axis: GDP per capita in respective years are in constant 2010 USD, then converted into logarithmic (log) form
Source: IMF Fiscal Monitor (April 2016) for fiscal data, WB COFIS Database for IDN expenditure data, and World Development Indicators for GDP per capita data
General Government Fiscal Balance (% of GDP)
…also IDN’s fiscal deficit (-2.5% of GDP) remains moderate relative to the average of emerging & MIC economies (-4.5% of GDP)

2012 2015
Brazil
China
Egypt
India
Indonesia, 27.2%
MalaysiaMexico
Philippines Thailand
0102030405060708090
100
3.0 3.5 4.0 4.5 5.0Gov
ernm
ent d
ebt a
s a sh
are of GDP
(%)
log GDP per capita (in 2010 US$)
Brazil
China
EgyptIndia
Indonesia, 23.0%
MalaysiaMexico
Philippines
Thailand
0
10
20
30
40
50
60
70
80
90
3.0 3.5 4.0 4.5 5.0Gov
ernm
ent d
ebt a
s a sh
are of GDP
(%)
log GDP per capita (in 2010 US$)
Similarly IDN’s public debt position (27.2% of GDP) remains solid relative to the average of emerging & MIC economies (45.4% of GDP)
General Government Debt (% of GDP)
Notes:(1) General government consists of central, state (province) and local (district) government(2) The sample of chosen countries are emerging markets and middle‐income economies, based on groupings by IMF Fiscal Monitor (April 2016)(3) There are 40 and 37 countries in the 2012 and 2015 sample(4) Horizontal axis: GDP per capita in respective years are in constant 2010 USD, then converted into logarithmic (log) form
Source: IMF Fiscal Monitor (April 2016) for fiscal data, WB COFIS Database for IDN expenditure data, and World Development Indicators for GDP per capita data

Finally ..Structural fiscal Reform is needed to
make Indonesia’s budget is inclusive

Addressing the Policy Gap is
Urgent
The fiscal deficit is structural not cyclical
The structural deficit is now near the 3% ceiling so little fiscal space left
In the face of an economic shock, fiscal policy will be pro‐cyclical
Structural measures needed not ad hoc/short‐term measures
Reforms can have lagged benefits and/or net cost up front (e.g., IT systems)
Fiscal credibility (lessons from Brazil)

Structural fiscal Reform is needed…
Triple Tracks strategy First Track : increase revenue collection through A comprehensive tax reform – particularly a tax administration reform
An integrated non tax reform strategy
Second track : Improve current spending practices both at central level and local level.
Third track : continue to improve sectoral allocation.

Indonesia has substantial tax revenue potential IMF (2013)1/ estimated
Indonesia’s tax effort between 0.42‐0.47 in 2011
IMF (2013)2/ also estimated Indonesia’s total revenue gaps of 5.0% of GDP
IMF (2011, 2014)3/ and Sugana‐Hidayat (2013)4/estimated VAT gaps between 47‐60% of the current revenue
Tax reform should focus on tax administration rather than policy
1 Fenochietto, R and Pessino, C, “Understanding Countries’ Tax Effort, Working Paper 13/244, IMF, November 2013
2 ___,”Taxing Times”, Fiscal Monitor, World Economic and Financial Surveys, IMF, October 20133 FAD, “Revenue Mobilization in Developing Countries”, IMF, March 2011; IMF Mission, “Tax Policy and Administration: Setting the Strategy for the Coming Years”, Fiscal Affairs Department, IMF, December 2014
4 Sugana, R and Hidayat A, “Analysis of VAT Revenue Potential and Gaps in Indonesia 2013”, Journal of Indonesian Economy and Development, University of Indonesia, July 2014.
Source: IMF2
Stochastic Frontier Analysis
Tax potential gap is substantial
Improving tax administration must be the first priority
Addresing tax policy should be conducted after tax admreform in place
First track: raising tax revenues

Despite current efforts on improving budget allocation, there is significant room to improve the allocative
efficiency of APBN spending
30
• Infrastructure: increase CG spend and DAK physical transfers
• Social Assistance Programs: increase CG spend
• Health: increase CG spend and DAK health transfers
• Subsidies: reduce energy (LPG, diesel, electricity) and non‐energy (fertilizers) subsidies
• Government administration: reduce personnel spending
• Education ‐ maintain• Agriculture ‐ maintain• DAU – base on realistic revenue
projections so not increase as share of revenues
• Dana Desa – more gradual expansion (relative to roadmap)
Improve relative allocation of CG/APBN spending by
Source: World Bank COFIS database using MoF data
375.5416.1
67.5104.0
350.3
77.3
177.9
387.3
0.0
50.0
100.0
150.0
200.0
250.0
300.0
350.0
400.0
450.0
2011 2012 2013 2014 2015 2016 2017
infrastructure
health
Energy subsidy
Before budget reformCommitment to reform
Budget Allocation (Rp tr)
education
Source: MOF
Second track: improvingBudget allocation

Improving allocative efficiency of CG/APBN spendingHigher infrastructure: increase CG spend & DAK physical
Increase CG and LG spending on infrastructures both for capital spending and O&M Improve the composition of infrastructures ‐ spend more on electricity, water and and sanitation, housing, transport and irrigation
Encourage PPP
31
Accelerating economic growth requires significant increase in public infrastructure investment to address the infrastructure deficit – from 2.3 percent to 5 percent of GDP GDP
0
20
40
60
80
100
Central SNG SOEs Private
Transport Energy TelecomIrrigation WSS
Composition of infrastructure investment by entity and sector (%), 2012

Improving allocative efficiency of CG/APBN spendingHigher health: increase CG spend and DAK health transfers
Health spending is low by international comparisons lowest in the world
To close half of the gap to the international average by 2020, Indonesia should double public health spending from 1.1 percent to 2.3 percent of GDP
Should be shared by central government and local government
Spend on supply side readiness
In addition to spending to Increase spending on JKN‐PBI to expand JKN coverage amongst the poor –covered in social assistance
32
Public expenditure on health as share of GDP vs income, 2014
Note: Both y‐ and x‐axes are loggedSource: World Development Indicators and COFIS

2.7%3.7%4.4%5.1%
6.0%7.2%8.8%
11.2%
15.7%
35.2%
0%
5%
10%
15%
20%
25%
30%
35%
40%
Poorest D
ecile 2 3 4 5 6 7 8 9
Richest D
ecile
Share of Ben
efits
Source: Susenas 2012, World Bank calculations.
2012 Fuel and Electricity SubsidiesShare of total benefits received by
decile
Most subsidies are not well targeted, regressive, and not cost effective
Improving allocative efficiency of CG/APBN spendingLower subsidies and Adopt a targeted and direct subsidy program
13.612.3
11.7 11.19.7
8.77.2
5.8
3.9
1.5
0
2
4
6
8
10
12
14
16
18
20
1 2 3 4 5 6 7 8 9 10
Incide
nce (%
)
Expenditure Decile
2015 Rastra (Raskin)Share of total benefits received by
decile
Source: Susenas 2015, World Bank calculations.
Target 25% poorest families

From technocracy to implementation:
institutional and political issues
ISSUES CHALLENGES
34
• Government policy ispolitical action
o How to get and involve mostof important stakeholders
• From policy perspective –except on revenue which isstill centralized, decisionand implementation onspending will be moredecentralized andfragmented.
• Many policies are designedand implemented notaccording to evidencebased and often reactiveto current circumtances
• Fragmented decision making processo There will no a dominant political party over next 10year
o There exist vested interest at all levels ‐ executive,legislative and judicative.
• Execution capacityo varies but generally weak.o Quality of project preparation generally declining
• Two big questionso How to ensure politician to conduct reforms under somany constraints
o How to upgrade implementation capacity at all levels.o Finally, budget is one of elements ofinclusive growth outcomes. Improvement ineconomic policies implementation andgovernance could be more important thanbudget to ensure a better inclusive growthoutcome.

Thank you