Fiscal Policy and Public Debt Sustainability in Nigeria
15
Journal of Economics and Sustainable Development www.iiste.org ISSN 2222-1700 (Paper) ISSN 2222-2855 (Online) Vol.10, No.19, 2019 6 Fiscal Policy and Public Debt Sustainability in Nigeria Inibehe Nya Regional Service Head, South- South/South- East, First City Monument Bank Limited 80, Olu Obasanjo Road, Port Harcourt, Rivers State Chukwuemeka O. Onyimadu* National Institute for Legislative and Democratic Studies, National Assembly, Abuja Abstract The study investigated fiscal policy and public debt sustainability in Nigeria between 1990 and 2017, by employing an error correction model and IMF/World Bank debt burden indicators such as solvency and liquidity ratios. The results from IMF/World Bank debt burden indicators revealed that Nigeria’s debt has been sustainable over the last 8- 10 years using the solvency ratios. Also, the liquidity indicator (debt service/export earnings) showed that Nigeria was able to meet its short term liabilities, as the debt burden indicators were below the indicative threshold of 20%. On fiscal policy sustainability, the empirical result using cointegration test revealed that the fiscal variables were cointegrated, indicative of the fact that fiscal policy in Nigeria was sustainable. However, it was further revealed by Wald coefficient restriction test that although fiscal policy in Nigeria was sustainable, it was found to be weakly sustainable. Thus, Nigeria could introduced debt ceilings in order to prevent explosion of the initial stock of debt arising from arbitrary borrowings by state governments. DOI: 10.7176/JESD/10-19-02 Publication date:October 31 st 2019 Introduction The growing challenge of high fiscal deficits and accelerating debt levels in most economies of the world, coupled with the debt crisis in the Eurozone area has more than ever, ignited global concerns from economists and policymakers towards a renewed focus on the sustainability of fiscal policy and public debts in both the developed and developing economies. The import of this is that deteriorating fiscal sustainability imposes some constraints on the growth and development of debtor nations and constitutes not only a drain on their resources but a drag on debt serviceability. Corroborating this assertion, Curtasu (2011) stated that unsustainable fiscal policies could worsen the macroeconomic conditions and make economies more vulnerable to exogenous shocks, adding that unsustainable fiscal policy could harm the welfare state through large fiscal deficits and excessive public debt stocks, generating an inefficient allocation of resources, an excessive public debt stock that could affect future generations, and an increase in the inflation rate and its volatility. Over the years, Nigerian government has employed a blend of monetary and fiscal policies to achieve macroeconomic stability of the economy. Whereas monetary policies involve the process by which the monetary authority such as the Central Bank of Nigeria (CBN) controls money supply, with the aim of targeting inflation or interest rate to achieve price stability and enhance public confidence on our currency, fiscal policy measure on the other hand, is concerned with the use of government revenue realized through taxes and expenditure (spending on goods and services) to influence the economy. When the nation’s revenue through taxes exceeds the expenditure, this result in fiscal surplus and on the contrary, when government spending exceeds revenue, the outcome is fiscal deficit and government is said to be running at a budget deficit. It is important to note that fiscal deficit may also result from government inefficiencies, reflecting widespread tax evasion or wasteful spending rather than a planned countercyclical policy. Unarguably, fiscal deficits in Nigeria is not a new development as the country recorded her first fiscal deficit of N455.10 million in 1970, ten years after independence. Since then, the country has continued to be on a sustained path of deficit financing using the instrument of public debt. However, the growing concerns over Nigeria’s debt problems started in the early 1980’s when the country’s foreign exchange earnings witnessed a marked drop induced by the falling prices of oil in the international market. This is more visible as Nigeria is a mono- product economy with heavy dependence on oil as a major revenue earner.
Transcript of Fiscal Policy and Public Debt Sustainability in Nigeria

Journal of Economics and Sustainable Development www.iiste.org
ISSN 2222-1700 (Paper) ISSN 2222-2855 (Online)
Vol.10, No.19, 2019
6
Fiscal Policy and Public Debt Sustainability in Nigeria
Inibehe Nya
Regional Service Head, South- South/South- East, First City Monument Bank Limited
80, Olu Obasanjo Road, Port Harcourt, Rivers State
Chukwuemeka O. Onyimadu*
National Institute for Legislative and Democratic Studies, National Assembly, Abuja
Abstract
The study investigated fiscal policy and public debt sustainability in Nigeria between 1990 and 2017, by employing
an error correction model and IMF/World Bank debt burden indicators such as solvency and liquidity ratios. The
results from IMF/World Bank debt burden indicators revealed that Nigeria’s debt has been sustainable over the
last 8- 10 years using the solvency ratios. Also, the liquidity indicator (debt service/export earnings) showed that
Nigeria was able to meet its short term liabilities, as the debt burden indicators were below the indicative threshold
of 20%. On fiscal policy sustainability, the empirical result using cointegration test revealed that the fiscal variables
were cointegrated, indicative of the fact that fiscal policy in Nigeria was sustainable. However, it was further
revealed by Wald coefficient restriction test that although fiscal policy in Nigeria was sustainable, it was found to
be weakly sustainable. Thus, Nigeria could introduced debt ceilings in order to prevent explosion of the initial
stock of debt arising from arbitrary borrowings by state governments.
DOI: 10.7176/JESD/10-19-02
Publication date:October 31st 2019
Introduction
The growing challenge of high fiscal deficits and accelerating debt levels in most economies of the world, coupled
with the debt crisis in the Eurozone area has more than ever, ignited global concerns from economists and
policymakers towards a renewed focus on the sustainability of fiscal policy and public debts in both the developed
and developing economies. The import of this is that deteriorating fiscal sustainability imposes some constraints
on the growth and development of debtor nations and constitutes not only a drain on their resources but a drag on
debt serviceability. Corroborating this assertion, Curtasu (2011) stated that unsustainable fiscal policies could
worsen the macroeconomic conditions and make economies more vulnerable to exogenous shocks, adding that
unsustainable fiscal policy could harm the welfare state through large fiscal deficits and excessive public debt
stocks, generating an inefficient allocation of resources, an excessive public debt stock that could affect future
generations, and an increase in the inflation rate and its volatility.
Over the years, Nigerian government has employed a blend of monetary and fiscal policies to achieve
macroeconomic stability of the economy. Whereas monetary policies involve the process by which the monetary
authority such as the Central Bank of Nigeria (CBN) controls money supply, with the aim of targeting inflation or
interest rate to achieve price stability and enhance public confidence on our currency, fiscal policy measure on the
other hand, is concerned with the use of government revenue realized through taxes and expenditure (spending on
goods and services) to influence the economy. When the nation’s revenue through taxes exceeds the expenditure,
this result in fiscal surplus and on the contrary, when government spending exceeds revenue, the outcome is fiscal
deficit and government is said to be running at a budget deficit. It is important to note that fiscal deficit may also
result from government inefficiencies, reflecting widespread tax evasion or wasteful spending rather than a
planned countercyclical policy.
Unarguably, fiscal deficits in Nigeria is not a new development as the country recorded her first fiscal deficit
of N455.10 million in 1970, ten years after independence. Since then, the country has continued to be on a sustained
path of deficit financing using the instrument of public debt. However, the growing concerns over Nigeria’s debt
problems started in the early 1980’s when the country’s foreign exchange earnings witnessed a marked drop
induced by the falling prices of oil in the international market. This is more visible as Nigeria is a mono- product
economy with heavy dependence on oil as a major revenue earner.

Journal of Economics and Sustainable Development www.iiste.org
ISSN 2222-1700 (Paper) ISSN 2222-2855 (Online)
Vol.10, No.19, 2019
7
Figure1: Trend Analysis of Nigeria’s Public Debt Outstanding (1990 – 2017)
Source: CBN Statistical Bulletin, 2017
Figure 1 shows the domestic and external debt mix for Nigeria in financing the fiscal deficits for the period
1990 - 2017. It is important to clarify that external debt refers to debt owed to foreign creditors such as multilateral
agencies (the African Development Bank(ADB), the World Bank, or the Islamic Development Bank), to bilateral
sources (such as the China Exim Bank, the French Development Bank or the Japense Aid Agency), or to private
creditors like the investors in Nigeria’s Eurobonds. Domestic debt on the other hand, refers to debt incured within
Nigeria, usually through the issuance of bonds that will then be purchased by banks, pension funds and other
domestic and foreign investors.
From Figure 1, Nigeria’s domestic and external debt profile have been increasing progressively from 1990,
with external debt forming the bulk of the debt stock. This implies that Nigeria depended much on external debt
to fund her fiscal deficits and other expenditures up to 2005. However, the trend took a dramatic turn in 2006 as
external debt declined sharply, from N2,695.07 trillion in 2005 to N451.46 billion in 2006, representing a decrease
of about 83.25%, while domestic debt rose from N1,525.91 trillion in 2005 to N1,753.26 trillion in 2006, about
14.90% increase. The decline in external debt stock may be explained by the Paris Club debt relief in 2006 which
made Nigeria’s obligation to foreign creditors in terms of debt service ‘nose dive’. Another possible reason that
could be adduced for this is that Ministry of Finance put in place a medium - term debt strategy with a mix of
limited external and domestic borrowing that is considered appropriate for the economy. The strategic mix of
limiting the country’s external debt and increasing domestic borowing is considered appropriate based on the fact
that external debt is subject to fluctuations in exchange rates, capable of affecting the nation’s debt repayment and
further exarcebating Nigeria’s debt burden while domestic debt, which is denominated in local currency, is free
from exchange rate fluctuations, thereby ensuring stability of the debt repayment programmes.The debt mix is
evidenced from the trend analysis (figure 1) as domestic debt continued to lead external debt for the period 2006
- 2017.
Deficit financing refers to the method employed by the government to finance its overall fiscal deficit. The
financing option through borrowing is considered the best stimulant for the economy in the short run and in the
long run, it constitutes a drag on the economy due to interest rate accrual. Aside from financing fiscal deficits
through borowing from external and domestic sources, other options include quantitative easing(QE) and
withdrawal from the nation’s reserves.
For the period under review(1990-2017),the Nigerian economy ran on budget deficit with exception of 1995
and 1996 where a marginal surplus of N1billion and N32billion were recorded respectively, as shown in Table 2.

Journal of Economics and Sustainable Development www.iiste.org
ISSN 2222-1700 (Paper) ISSN 2222-2855 (Online)
Vol.10, No.19, 2019
8
Table 1: Stylized Facts on Federal Government Fiscal Position1990- 2017(Naira Billions).
Year FGN Retained Revenue Total Expenditure Surplus(+)/Deficit(-) % Surplus/Deficit of GDP
1990 38.15 60.27 -22.1161 -4.42608
1991 30.83 66.58 -35.7552 -5.99874
1992 53.26 92.8 -39.5325 -4.34517
1993 126.07 191.23 -65.1577 -5.17506
1994 90.62 160.89 -70.2706 -3.98628
1995 249.77 248.77 1 0.03454
1996 325.14 337.22 32.0494 0.848062
1997 351.26 428.22 -5 -0.12161
1998 353.72 487.11 -133.3893 -2.90672
1999 662.59 947.69 -285.1047 -5.37187
2000 597.28 701.06 -103.7773 -1.50457
2001 796.98 1,018.03 -221.0489 -2.71754
2002 716.75 1,018.16 -301.4016 -2.65968
2003 1,023.24 1,225.97 -202.7247 -1.52407
2004 1,253.60 1,426.20 -172.6 1.275309
2005 1,660.70 1,822.10 -161.4 1.962283
2006 1,836.61 1,938.00 -101.3975 1.906336
2007 2,333.66 2,450.90 -117.2371 2.256042
2008 3,193.44 3,240.82 -47.3796 2.748049
2009 2,642.98 3,452.99 -810.0085 1.162932
2010 3,089.18 4,194.58 -1105.401 -0.03727
2011 3,553.54 4,712.06 -1158.519 0.377862
2012 3,629.61 4,605.39 -975.7831 0.42768
2013 4,031.83 5,185.32 -1153.49 0.427273
2014 3,599.63 4,571.06 -835.678 0.364776
2015 3,431.07 4,988.86 -1557.793 -0.42581
2016 2,952.51 5,160.74 -2208.222 -2.76895
2017 4,622.60 8,302.10 -3679.5 -2.21288
Source: CBN Statistical Bulletin, 2017
Figure 2: Trend Analysis of Federal Government Fiscal Position(1990 – 2017).
Source: CBN Statistical Bulletin, 2017 and Authors’ compilation.
The persistent deficits had been majorly financed by government through borrowing from external or
domestic sources as already explained, and ocassionally through the depletion of its reserves. Some of the projects
financed by debt included Ajaokuta Steel Complex, Delta Steel Complex, Port Harcourt and Kaduna refineries. It
is important to state that the Ajaokuta and Delta Steel Complexes,which were viewed as precursors for Nigeria’s
industrialization, were completely abandoned while the refineries operated at a very low capacity utilsation for

Journal of Economics and Sustainable Development www.iiste.org
ISSN 2222-1700 (Paper) ISSN 2222-2855 (Online)
Vol.10, No.19, 2019
9
reasons not compeletely alienated from avarice, corruption and erratic policy changes of the Federal
Government.The failure of these laudable projects which would have ensured productive employment, poverty
reduction and the positioning of the Nigerian economy on growth and development trajectory calls for questioning
the omission or oversight of Debt Management Office(DMO) responsibilities, which amongst others, include that
funds are borrowed from appropriate sources and applied prudentially with sound analytical and regulatory
frameworks that will assure serviceability and amortisation of the country’s debt as at when due. One explanation
for this shortcoming is the fact that the roles assigned to Debt Management Office (DMO) were devoid of direct
or oversight function of projects monitoring and evaluation (M & E) to ensure funds are properly channelled to
the purpose it was meant for, thus guranteeing debt payback or serviceability.
The option of quantitative easing(QE) is not a recommended option for deficit financing in Nigeria and other
developing countries based on the fact that these economies are consumption based and the application of this
financing option could lead to higher inflation in the long run, due to increased money supply. According to
Umo(1986), printing of money is highly inflationary as an increase in the volume of money is not matched by
increase in production in the economy. He cited the case of some African countries like Uganda(under Idi Amin)
and Congo Democratic Republic(under Mobutu Seseko) who printed money to balance their budget and this
resulted in very high inflationary levels due to failure of the increased volume of money to match production of
goods and services.Table 2 below shows the fiscal position of the Federal Government of Nigeria for the period
1990-2014. The deficits fluctuated over the years with a sharp deepening in 2010, 2011 and 2013 with
corresponding values of N1.105 trillion, N1.158 trillion and N1.153 trillion respectively and later declined in 2014
to N971.43 billion. It is important to mention that fiscal deficits are certainly not new and perculiar to Nigeria
alone but common characteristics of almost all countries of the world, including the developed economies of USA,
United Kingdom.
From the IMF World economic Outlook, UK recorded the highest fiscal deficits of 10.85% of their GDP in
2009, followed by USA with a deficit of 10.29% and 3.21% for Nigeria in the same year. This is an indication that
even the developed economies run on fiscal deficits. On a comparative basis, Nigeria with a fiscal deficit to GDP
of 3.21% is more sustainable compared to USA and UK with deficts to GDP of -10.29% and -10.85% respectively.
Nigeria’s fiscal position suffered an imbalance in 1970 with the country recording her first fiscal deficit of
N455 million. This development marked the beginning of the era of oil boom (1970s) and Nigeria’s heavy
dependence on oil as a major source of revenue at the detriment of the non-oil sector (agriculture, manufacturing,
building and construction). However, fluctuations in oil prices in the international market led to budgetary
deterioration which has continued to enmesh the country on a sustained path of deficit financing using the
instrument of public debt. As the nation continued to experience unstable fiscal position, the result is a rising debt
profile capable of throwing the country into a debt trap.
The motivation for this study is based on the fact that many of the studies that replete the extant literature in
Nigeria’s public finance focused attention on public debt and the bi-directional causality between public debt and
deficit financing and other macroeconomic variables such as interest rates and growth dynamics. However, not
much has been done on the sustainability of Nigeria’s fiscal policy and public debt by analysts and those in the
academia in order to validate the veracity or otherwise of the increasing public outcry, misinformation and
misconception in the media and public debates, that Nigeria’s economy is on the verge of collapse as a result of
increasing public debt profile which has become unsustainable in the last decade.
This paper will be relevant to analysts and policy makers in the evolvement of strategies for sound fiscal
policy and debt management that will ensure overall macroeconomic stability of the country. It will also assist to
enlighten the public that rising public debt does not imply its unsustainability and the country being at the verge
of collapse.
Therefore, the need to clarify Nigeria’s fiscal policy and public debt sustainability position and possibly,
provide a knowledge base for future debates has formed the major objective of this paper. The specific objectives
are to examine whether Nigeria has exceeded her borrowing limit by carrying out a debt sustainability analysis,
determine whether or not fiscal policies in Nigeria are sustainable by assessing the robustness or otherwise of
Nigeria fiscal policies and finally, recommend policy options aimed at reducing the widening fiscal deficit gaps
and ensure macroeconomic stability.
The rest of the paper is categorized as follows. Section two presents the theoretical and empirical literature
while section three focuses on the methodology and data collection. Section four dwells on empirical result and
discussion and finally, section five contains the recommendations and conclusion.
Theoretical Background
The theoretical discourse on fiscal and public debt sustainability is centered on the IMF/World Bank Debt
Sustainability Framework and Present Value Budget Constraint (PBVC). The IMF/World Bank Debt
Sustainability Framework (DSF) introduced in 2005 with subsequent reviews in 2009 and 2012, is a standardized
framework for the analysis of public debt sustainability in Low Income Countries (LICs). It (DSF) defines debt

Journal of Economics and Sustainable Development www.iiste.org
ISSN 2222-1700 (Paper) ISSN 2222-2855 (Online)
Vol.10, No.19, 2019
10
sustainability as the capacity of a country to meet its current and future debt service obligations in full, without
recourse to debt rescheduling or the accumulation of arrears and without compromising growth( IDA-IMF, 2004).
The main thrusts of this framework are to provide guidance for LICs borrowing decisions, creditors’ lending
decisions and inform IMF and World Bank analysis and policy advice (IMF, 2013).
Under the World Bank’s Country Policy and Institutional Assessment (CPIA), countries are classified on the
basis of their CPIA index using four indicators namely economic management, structural policies, policies for
social inclusion and equity, and public sector management and institutions. These countries are then rated based
on these four performance criteria with the rating of one (1) being the lowest and six (6) the highest. The Debt
Sustainability Framework (DSF) classifies countries using the CPIA index into three groups (low, medium and
high performer) depending on the strength of countries policies and institutions as indicated in the indexes below.
≤ 3.25 - weak policies and institutions (low performer).
>3.25 < 3.75 - medium policies and institutions (medium performer)
≥ 3.75 – strong policies and institutions (high performer)
Consequently, Nigeria is classified by IMF and World Bank as medium performer with a CPIA rating of 3.4.
Debt Sustainability Framework employs macroeconomic and debt data in assessing whether a country’s debt
is sustainable or not using debt burden indicators such as the solvency and liquidity positions: Debt Stock/GDP,
Debt Stock/Export, Debt Stock/Revenue and Debt Service/Export. However, it is important to stress that
thresholds assigned by the DSF are not static but vary from one LIC to another depending on the quality of their
policies and institutions.
The Present Value Budget Constraint (PVBC), also called The Lender- Based Approach, states that
government is considered to be solvent if the flow of expected value of future resources is at least equal to the face
value of the stock of debt as indicated in the equation below:
�� = � ����(1 + ) �
��
Where Do is the initial stock of debt, Pbalt is the future primary balances (surpluses or deficits) and (1+r) t is
the discounting factor.
The above equation is called the intertemporal budget constraint of government and it holds true with the
assumption of Non-Ponzi game (NPG) by government. That is, government is not involved in rolling over its debt
(bubble financing its expenditure) by issuing new debts to finance the deficits.
The PVBC/econometric approach employs the stationarity and co-integration tests in the evaluation of fiscal
policy sustainability. While stationarity test is carried out using the Augmented Dickey Fuller (ADF) and Phillip
Perron (PP), the co-integration test between government revenue and expenditure provides a necessary condition
for fiscal policy sustainability analysis. Consequently, fiscal sustainability between the co-integrating vectors
(expenditure and revenue) is achieved if the vectors are of order I (1) and are co-integrated; at this point fiscal
policies of government are considered sustainable (Hakkio and Rush, 1991).
However, the degree of sustainability of fiscal policy- whether strongly or weakly sustainable is further
evaluated using Wald Coefficient Restriction Test. If the beta (β) co-efficient of the independent fiscal variable is
1, this implies a strong fiscal policy sustainability and conversely, beta co-efficient of less than 1 depicts a weak
sustainability of government fiscal policy (Quintos, 1995).
Regarding the empirical literature, Corsetti and Roubini(1991) carried out a study on fiscal deficits, public
debt and government solvency on 18 Organisation for Economic Co-operation and Development (OECD)
countries, 1960 -1989, using stationarity tests( PP and ADF) found out major differences in long term sustainability
of public debt across the OECD countries. The study revealed that major OECD countries like US, France,
Germany, Japan, UK and Canada did not appear to have issues with public debt sustainability whereas, other
smaller OECD countries like Greece, Netherlands, Belgium and Ireland were faced with debt sustainability
problems, with a common large debt to GDP ratio. Corsetti and Robin failed to advance reason for the
unsustainability of smaller OECD countries, however, this could be due to failure of OECD governments to
achieve intertemporal budget constraints.
Makrydakis, Tzavalis and Balfoussias (1999) investigated Policy regime changes and long run sustainability
of fiscal policy: An application to Greece. Using time series data between 1958 and 1995, the stationarity tests
result showed that Greece debt was not sustainable as the government failed to satisfy intertemporal budget balance
in the long run. The study associated the cause of the failure with Greece deterministic policy regime shift in 1979.
Curtasu (2011) in a study on How to access Public Debt sustainability: Empirical Evidence from Advanced
European Countries, using annual data spanning 1970-2012. The empirical evidence using stationarity test(ADF),
co-integration test(Johansen) and fiscal reaction function revealed that few of the countries such as Denmark,

Journal of Economics and Sustainable Development www.iiste.org
ISSN 2222-1700 (Paper) ISSN 2222-2855 (Online)
Vol.10, No.19, 2019
11
Finland, Netherlands and Sweden were not in danger of facing solvency risk in the future, as their sustainability
of their fiscal position was generated by public debt ratio did not surpass the threshold and as well as by a primary
surplus large enough to cover the stabilizer one(except the Netherlands).However, the study revealed that the rest
of the countries such as France, Ireland, Italy, Portugal, Spain and UK were over-indebted and the credit markets
were already concerned about their ability to service their debts, evidenced by their huge debt ratios and the fact
that they also run primary deficits or very low surpluses, that cannot matched the primary balance-to-GDP ratio
required to stabilize debt.
In a study on Sri Lanka carried out by Foneska and Ranasinghe (2007) on Sustainability of Sri Lanka’s public
debt using the traditional threshold ratios and the theoretical model approach to measure liquidity and solvency of
the domestic and external debt, the result revealed that Sri Lanka failed to achieved the debt sustainability set by
International agencies as all indicators exceeded the upper threshold limits. The study further argued that if such
condition persists, the country will fall into a serious debt trap, and will not be able to source for funds from both
domestic and foreign sources at affordable cost.
Adam (2003) investigated the Debt Servicing capacity of Nigeria’s economy using survey method with DMO
officials and the accounting measurement of debt to GDP ratio and argued that the Nigerian debt situation, to a
greater extent, is highly unsustainable. According to the study, the unsustainability of Nigerian debt could be
associated with high initial debt stock, high interest rate, lower real GDP growth, and large trade deficits. While
the conclusion by Adam on Nigeria’s debt being highly unsustainable may be partially correct as per external debt
/GDP and debt/export ratios with values of 64.4 and 176.9 against international benchmark of 50 and 150
respectively, I consider this conclusion as hasty on the basis that his analysis revealed that Nigeria’s debt was
sustainable considering indicators such as external debt /revenue ratio of 173.9 against 250, external debt
service/export with ratio of 9.8 against 15 and external debt service/revenue ratio of 9.1 against 20.
Oyeleke and Ajilore (2014) investigated the sustainability of fiscal policy in Nigeria between 1980- 2010
using the Error Correction Model (ECM) with the objective of determining whether government has violated
intertemporal government budget constraints. The study revealed that fiscal policy was weakly sustainable in
Nigeria’s economy. The study recommended improvement on tax revenue generation and other sources of income
by government with restriction of her expenditure to growth enhancing projects.
Dayaratna-Banda and Priyadashanee (2014) carried out a study on the impact of government budget deficit
on debt sustainability in Sri Lanka using time series data from 1960 to 2012. Accounting ratio analysis was
employed to test the sustainability of government debt using debt to GDP ratio. Result of Augmented Dickey
Fuller (ADF) and Phillips- Perron (PP) tests showed that debt ratios were non-stationary, implying the existence
of an unsustainable debt outlook. Hence, they concluded that public debt in Sri Lanka was not sustainable and
therefore, a switch is required from foreign debt to other sources of financing of fiscal deficit or deficit reduction.
Ozkaya (2013) in a study on public debt stock sustainability in nine selected Organisation for Economic Co-
operation and Development (OECD) countries namely Ireland, Spain, Greece, Portugal, Italy, United Kingdom,
France, Poland and Turkey using quarterly data from 1999 to 2010 (1999Q1- 2010Q1), employed the Stationarity
test (unit root test) statistics such as Augmented Dickey Fuller(ADF), Phillip Perron and Kwiatkowski-Phillips-
Schmidt-Shin(KPSS) and co-integration test in testing the sustainability of public debt in those OECD countries.
The result of the econometric analysis revealed that five of the OECD economies like Ireland, Greece, Spain and
Portugal were characterized by unsustainable debt policies, while the rest of the countries namely Italy, UK, France,
Poland and Turkey had debt policies that were sustainable.
Elliot and Kearney (1998) employed the co-integration test in their study on the intertemporal government
budget constraint and tests for bubble financing of fiscal deficits in Australia, using time series data between 1953
and 1987. The findings did not revealed any evidence of unsustainability of public debt in Australia. However,
there was evidence that the Australian government financed the sustained primary deficits through seigniorage
(quantitative easing) as shown by co-integration relationship between government spending and taxation plus
seigniorage, with co-integrating coefficient of unity.
Payne (1997) carried out a study on International evidence on the sustainability of budget deficits of the G-7
countries (Canada, France, Germany, Italy, Japan, UK and US) between 1949 and 1994. Using the co-integration
test, the study showed that in the case of Germany, for each dollar increase in expenditure, revenue increased by a
corresponding amount. For France, Japan and Italy, the result showed that the budget deficits in these countries
were not sustainable as evidenced by the absence of co-integrating relationship, whereas for UK, US and Canada,
co-integration existed between revenue and expenditure, indicating sustainability of their budget deficits. On the
overall, the study affirmed that the estimated coefficients on expenditures for the G-7 countries were significantly
less than unity, an indication that government expenditure was growing faster than government revenue.
Employing the fiscal reaction function test, Bohn (1998) in his study of the behaviour of US public debt and
deficits, examined the reaction of the US government towards the accumulation of public debt using annual data
for the period 1916 – 1995. The paper showed that the U.S. government has historically responded to increases in
the debt-GDP ratio by raising the primary surplus, or equivalently, by reducing the primary deficit. It further

Journal of Economics and Sustainable Development www.iiste.org
ISSN 2222-1700 (Paper) ISSN 2222-2855 (Online)
Vol.10, No.19, 2019
12
concluded that an estimated positive response of primary surplus to the debt-GDP ratio can be interpreted as a new
test for the sustainability of U.S. fiscal policy, thus providing a strong evidence that U.S. fiscal policy has been
sustainable in the sense of satisfying an intertemporal budget constraint for the sample period 1916-95 and various
sub periods, despite the rather frequent primary budget deficits.
Ghosh, A.R, Mendoza, E.G, Ostry, J.D and Qureshi, M.S (2011) employed the fiscal reaction function test to
examine whether 23 advanced economies possess space for fiscal maneuver, otherwise called fiscal space (defined
as the difference between current debt level and a (country-specific) debt limit, where the latter is the debt level
beyond which fiscal solvency fails) or whether they need urgent fiscal adjustment to achieve debt sustainability.
The empirical evidence revealed a marginal response of primary balance to lagged debt which was nonlinear,
assuming positive values at moderate debt levels and witnessed a decline when debt reaches 90-100% of GDP.
The findings also showed that while Australia, Korea, New Zealand and the Nordic countries have large fiscal
space to handle fiscal shocks their economies, Greece, Italy and Japan and Portugal had the least space while UK,
U.S, Spain, Ireland and Iceland were constrained in the degree of their fiscal maneuver.
Afonso (2000) employed stationarity tests (unit root tests) to examine stock of public debt and co-integration
tests to examine the long run relationship between government expenditures and revenues for the period 1968-
1997 among the EU countries. The empirical result revealed that most EU countries had unsustainable fiscal
policies, with the exception of Austria, Germany and the Netherlands.
Stoian, Campeanu and Roman (2010) carried out a study on fiscal sustainability of Romania based on fiscal
reaction function using quarterly data for the period 1995-2005. Using the ordinary Least Square (OLS) and fiscal
reaction function to test the sustainability of fiscal policies in Romania, the result showed a weak fiscal
sustainability in Romania.Smith and Zin (1991) carried out a study on the stationarity of public debt and fiscal
deficits in Canada for the period 1946- 1984 and the empirical result showed that public debt in Canada was not
sustainable.
Model Specification.
The assessment of debt sustainability using the IMF/World Bank approach involves the comparison of debt burden
indicators with the indicative debt burden thresholds. Where the calculated debt burden indicator is greater than
the indicative threshold, Nigeria is likely to face debt distress/unsustainability and conversely, where debt burden
indicators are below the indicative threshold, the country may not experience distress in honouring her debt
obligations as they fall due and her debt is deemed sustainable. The debt burden indicators (accounting ratios) are
the solvency and liquidity ratios.
Solvency Ratios
The Solvency ratios measure the country’s capacity to meet her long term debt liabilities. Examples of solvency
ratios are:
The Debt Stock- GDP Ratio
This is the ratio of a country’s debt stock expressed as percentage of her GDP (real). It measures the amount of
the overall resources of a country available to repay its debt. The ratio is given as: ���� ����� ���� � ∗ 100%
The threshold for debt stock /RGDP ratio is given as 40%.
Debt Stock- Export Ratio
This is the ratio of a country’s debt stock expressed as percentage of her export of goods and services for a
particular year. An increasing debt to export ratio implies that debt stock is growing faster than the country’s basic
source of external income, indicating the country’s likelihood of having problems to meet its debt obligations in
the future.
It is expressed as: ���� ����� � !� � � ∗ 100%
The threshold for debt stock- export ratio is 150%.
Debt Stock- Revenue Ratio
This is the ratio of a country’s debt stock expressed as a percentage of its revenue. It measures the ability of
government to generate fiscal resources to meet its debt obligations.
It is given as: ���� ����� ��"�#$� � ∗ 100%
The threshold for debt stock- revenue ratio is 250%.
Liquidity Ratio
This measures the ability of a country to meet its short term debt obligations as they fall due. A country’s liquidity
problems can be triggered by variables such as sharp drop in export earnings and tightening in global liquidity
among others. An example of liquidity ratio is debt service to export ratio, expressed in terms of debt repayment
as a percentage of export earnings.

Journal of Economics and Sustainable Development www.iiste.org
ISSN 2222-1700 (Paper) ISSN 2222-2855 (Online)
Vol.10, No.19, 2019
13
Debt Service – Export Earnings ratio ���� ����� � !� � �� #%#&' � ∗ 100%
The threshold for debt service to export earnings ratio is 20%.
The Econometric Approach:
The econometric approach to fiscal policy sustainability makes use of annual time series data on the fiscal variables
namely government revenue and expenditure, the later which also includes interest payments on public debt. In
view of the trendy properties of time series data, it becomes important to overcome this problem by testing for the
stationarity of the series, using the unit root tests such as the Augmented Dickey - Fuller (ADF) and the Phillips -
Perron (PP) statistics.
If the order of integration of the variables using ADF and PP tests reveals I(0), it means the series is stationary
at levels, indicative of sustainable fiscal policies of government. However, if the variables are integrated of order
one or two i.e. I(1) or I(2) and the vectors are co-integrated, fiscal policies are deemed sustainable whereas
government fiscal policies are considered unsustainable if the variables are integrated of order one or two i.e. I(1)
or I(2) and there is absence of co-integration between the fiscal variables.
Thus, the presence of unit root i.e. non stationarity of the variables of order one I(1) is a condition for the
assessment of whether a long run relationship exists between the fiscal variables. The existence of long run
relationship (co-integration) between government revenue and expenditure shows that government policies are
sustainable. However, the degree of sustainability of fiscal policies is a function of whether the value of the
parameter, beta (β) is equal to unity (1) which denotes strong fiscal policy sustainability or less than one(1), which
shows weak fiscal policy sustainability.
The model specification shows a functional relationship between government expenditure (GE) as the
dependent variable and government revenue (GR) as the independent variable. This suggests that changes in
government expenditure might be associated with changes in government revenue and the stochastic term. The
control variables are inflation (inf) and population growth (pop). �� = ((��, *+,, ���) �� = -� + -�*+, + -.��� + �
Where GE is Government Expenditure, GR is the Government Revenue, INF represents Inflation, PoP is
Population Growth, -� %' � Constant, and -� �#/ -. are parameters to be estimated with e representing the
Stochastic term.
Empirical Results
Total Debt Stock - GDP Ratio:
Table 2 shows total debt stock to GDP ratio for 2005-2017.The data revealed that public debt in Nigeria seem
sustainable as the calculated ratios were lower than the peer group threshold stipulated by IMF/World Bank.
Although the ratio based on GDP are significantly lower than the peer group threshold (Figure 3), the GDP based
ratios are rising and the shrinking the existing gap between from the peer group threshold. Thus, although GDP
based ratios project Nigeria’s Debt as sustainable, caution should be used in interpreting these findings. It is
imperative to state that no country pays debt using its Gross Domestic Product (GDP), hence the importance of
exploring other sustainability measures as suggested by export and revenues based ratios.
Table 2: Total Debt Stock/ GDP Ratio (GDP at 2010 Constant Prices)
Year TDS/GDP Peer Group Threshold
2005 11.26% 40.00%
2006 5.51% 40.00%
2007 6.08% 40.00%
2008 6.18% 40.00%
2009 7.66% 40.00%
2010 9.60% 40.00%
2011 11.34% 40.00%
2012 12.62% 40.00%
2013 13.46% 40.00%
2014 14.20% 40.00%
2015 15.86% 40.00%
2016 21.40% 40.00%
2017 26.82% 40.00%
Source: CBN Statistical Bulletin, 2017

Journal of Economics and Sustainable Development www.iiste.org
ISSN 2222-1700 (Paper) ISSN 2222-2855 (Online)
Vol.10, No.19, 2019
14
Figure 3: Graph of TDS/GDP Sustainability Analysis at 1990 Constant Prices
Source: CBN Statistical Bulletin, 2017
Debt Stock- Export Ratio:
Table 3 shows total debt stock to Export ratios for 2005-2017.The data revealed that public debt in Nigeria seems
sustainable as the calculated ratios for total export and oil export, were lower than the peer group threshold
stipulated by IMF/World Bank. Figure 4 shows that debt- export ratios from 2005 – 2015 remained consistently
below the peer group threshold, suggesting sustainability. However, from 2016 – 2017, the export based ratios
were had crossed the peer group threshold. The unsuitable debt finding for 2016 – 2017 period can be explained
by the occurrence of economic recession, occasioned by the fall in world oil prices. In the recession period,
Nigeria’s total export fell by about 30% in 2015 – 2016, with oil and non –oil exports also falling by about 30%
respectively. This exogenous shock affected Nigeria’s exports negatively, thereby making the debt to export ratios
to increase.
Also, from Figure 5, the Debt – Non – oil export ratios clearly indicates unsustainability. This ratio is
important as it gives an idea of the degree of economic diversification Nigeria has attained. The ratio indicates the
capacity of earnings from non – oil sources to meet debt obligations. Noticeably, without revenue from oil sources,
Nigeria’s current debt status would be highly unsustainable, as the Non – oil based ratios are evidently above the
Peer group threshold.
Table 3: Debt Stock- Export Ratio
Year TDS/Export TDS/Oil Export TDS/Non-oil Export Peer Group Threshold
2005 58.25% 59.11% 3983.71% 150%
2006 30.10% 30.66% 1650.30% 150%
2007 31.39% 32.16% 1309.12% 150%
2008 27.37% 28.83% 540.75% 150%
2009 44.37% 47.11% 762.37% 150%
2010 43.64% 46.38% 737.27% 150%
2011 42.79% 45.52% 713.70% 150%
2012 49.97% 53.05% 860.25% 150%
2013 55.74% 60.19% 752.66% 150%
2014 73.57% 79.42% 1000.03% 150%
2015 123.78% 133.77% 1657.16% 150%
2016 164.53% 177.74% 2213.35% 150%
2017 131.30% 142.23% 1708.65% 150%
TDS is Total Debt Stock; PGT is Peer Group Threshold. Exp. is Export
Source: CBN Statistical Bulletin, 2017
0.00%
5.00%
10.00%
15.00%
20.00%
25.00%
30.00%
35.00%
40.00%
45.00%
2004 2006 2008 2010 2012 2014 2016 2018
TDS/GDP Peer Group Threshold
Journal of Economics and Sustainable Development www.iiste.org
ISSN 2222-1700 (Paper) ISSN 2222-2855 (Online)
Vol.10, No.19, 2019
15
Figure 4: Graph of TDS/Export Sustainability Analysis
Source: CBN Statistical Bulletin, 2017
Figure 5: Graph of TDS/Non-oil Export Sustainability Analysis
Source: CBN Statistical Bulletin, 2017
Debt Stock – Revenue Ratio:
Debt stock – revenue ratio measures the country’s fiscal capacity to generate resources to meet its debt obligations.
The analysis in Table 4 revealed that, from 2005 - 2017, debt – revenue ratios, especially debt – Gross Federally
Collected Revenue and Debt – Retained Revenue were lower than the peer group threshold of 250%. However,
from 2014, the debt – retained revenue ration had risen to 254.17% signaling that Nigeria could not generate
enough revenue to pay its debt, an indication of fiscal indiscipline (Figure 6). Although the debt-revenue ratios
prior to 2014 were sustainable, it is relevant to state that no country uses all its retained revenue to pay her debt
obligations. Conversely, when revenue from oil and non – oil sources are considered (Figure 7), we can clearly
see no improvements in fiscal responsibility and economic diversification, as the revenues generated from the non
– oil sector can hardly meet debt obligations. From Figure 7 and Figure 8, debt – oil revenue ratio and debt –
retained revenue ratio would suggest debt sustainability but with increasing decadence in fiscal responsibility.

Journal of Economics and Sustainable Development www.iiste.org
ISSN 2222-1700 (Paper) ISSN 2222-2855 (Online)
Vol.10, No.19, 2019
16
Table 4: Debt Stock –Revenue Ratio
Year TDS/GF
CR
TDS/Retained
Revenue
TDS/Oil
Revenue
TDS/Non-oil
Revenue
Peer Group
Threshold
2005 76.09% 254.17% 88.63% 537.64% 250%
2006 36.96% 120.04% 41.70% 325.40% 250%
2007 45.54% 111.78% 58.45% 206.27% 250%
2008 36.15% 89.04% 43.54% 212.84% 250%
2009 78.82% 144.48% 119.63% 231.05% 250%
2010 71.77% 169.68% 97.14% 274.78% 250%
2011 58.65% 183.47% 73.43% 291.33% 250%
2012 71.00% 208.41% 94.25% 287.76% 250%
2013 87.16% 210.98% 124.92% 288.29% 250%
2014 94.70% 254.17% 140.36% 291.16% 250%
2015 158.39% 319.10% 285.86% 355.19% 250%
2016 255.98% 492.36% 539.63% 486.99% 250%
2017 250.98% 397.32% 446.89% 572.53% 250%
Source: CBN Statistical Bulletin, 2017
GFCR refers to Gross Federally Collected Revenue
Figure 6: Graph of TDS/Revenue Ratio Sustainability
Source: CBN Statistical Bulletin, 2017
Figure 7: Graph of TDS/Oil and Non-oil Revenue Ratio Sustainability
Source: CBN Statistical Bulletin, 2017
LIQUIDITY RATIO:
Debt Service- Export Earnings Ratio:
The result of debt service – export earnings ratios (Table 5) for the review period revealed that Nigeria’s debt
service was sustainable for all the period under review, as the ratios were significantly lower than the prescribed
threshold by IMF/World Bank for low income countries (LICs) (Figure 8). The implication of this is that the
0.00%
100.00%
200.00%
300.00%
400.00%
500.00%
600.00%
2004 2006 2008 2010 2012 2014 2016 2018
TDS/GFCR TDS/Retained Revenue Peer Group Threshold
0.00%
100.00%
200.00%
300.00%
400.00%
500.00%
600.00%
700.00%
2004 2006 2008 2010 2012 2014 2016 2018
TDS/Oil Revenue TDS/Non-oil Revenue Peer Group Threshold

Journal of Economics and Sustainable Development www.iiste.org
ISSN 2222-1700 (Paper) ISSN 2222-2855 (Online)
Vol.10, No.19, 2019
17
country has not experienced liquidity problems in servicing its debt for the stated period, implying enhanced
capacity of the country to generate enough export proceeds to service its debt, hence its sustainability.
Table 5: Debt Service – Export Earnings Ratio
Year Debt service to
exports (%)
Total debt service (% of exports of goods,
services and primary income)
Total debt service
(% of GNI)
Peer Group
Threshold
2005 15.41% 15.41% 5.41% 20.00%
2006 10.98% 10.98% 2.90% 20.00%
2007 1.44% 1.44% 0.38% 20.00%
2008 0.48% 0.76% 0.21% 20.00%
2009 0.73% 1.28% 0.27% 20.00%
2010 0.38% 1.50% 0.37% 20.00%
2011 0.34% 0.51% 0.14% 20.00%
2012 0.25% 1.34% 0.31% 20.00%
2013 0.40% 0.49% 0.10% 20.00%
2014 0.31% 5.32% 0.83% 20.00%
2015 0.51% 2.85% 0.30% 20.00%
2016 0.93% 6.31% 0.63% 20.00%
2017 0.74% 6.83% 0.98% 20.00%
Source: CBN Statistical Bulletin, 2017
Figure 8: Graph of DS/Export Ratio Sustainability
Source: CBN Statistical Bulletin, 2017
Fiscal Sustainability Analysis:
Stationarity Test:
Table 6: Result of Unit Root Test:
Variable ADF PP Conclusion
1ST DIFF 2ND DIFF 1ST DIFF 2ND DIFF ADF PP
GE 2.388 6.168* 4.960* - I(2) I(1)
* represents stationarity at 1% significance level based on MacKinnon critical value.
Source: Computed by Author
The result of the Unit Root test revealed the presence of unit root in the fiscal variables- government
expenditure (GE) and government revenue (GR). Using ADF, the variables were integrated of order two, that is,
stationary at second difference I(2), while stationarity was achieved between the two variables at first difference,
I(1) when PP was applied. Following Leachman and Francis (2000), the presence of long run relationship will
attest to the sustainability of fiscal policy. This was carried out using the Johansen co-integration test and the result
is as shown in table 6 below:
0.00%
5.00%
10.00%
15.00%
20.00%
25.00%
0.00%
5.00%
10.00%
15.00%
20.00%
2005 2006 2007 2008 2009 2010 2011 2012 2013 2014 2015 2016 2017
Debt service to exports (%)
Total debt service (% of exports of goods, services and primary income)
Total debt service (% of GNI)
Peer Group Threshold
Journal of Economics and Sustainable Development www.iiste.org
ISSN 2222-1700 (Paper) ISSN 2222-2855 (Online)
Vol.10, No.19, 2019
18
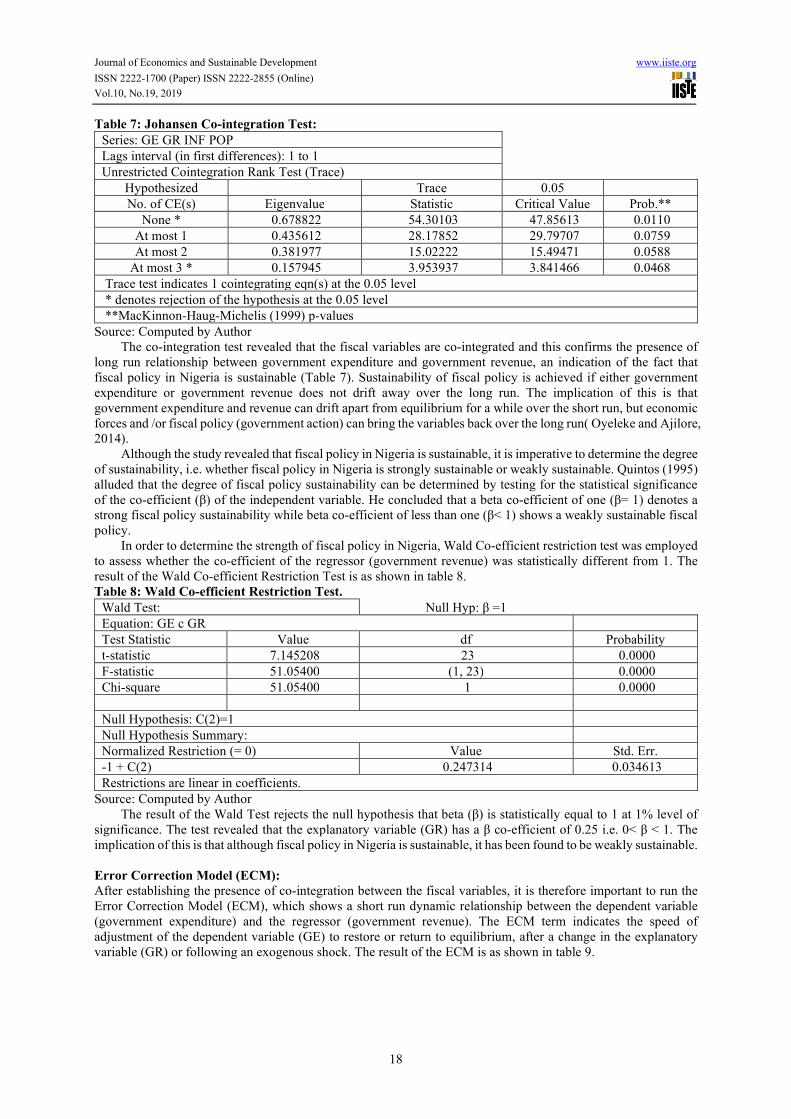
Table 7: Johansen Co-integration Test:
Series: GE GR INF POP
Lags interval (in first differences): 1 to 1
Unrestricted Cointegration Rank Test (Trace)
Hypothesized Trace 0.05
No. of CE(s) Eigenvalue Statistic Critical Value Prob.**
None * 0.678822 54.30103 47.85613 0.0110
At most 1 0.435612 28.17852 29.79707 0.0759
At most 2 0.381977 15.02222 15.49471 0.0588
At most 3 * 0.157945 3.953937 3.841466 0.0468
Trace test indicates 1 cointegrating eqn(s) at the 0.05 level
* denotes rejection of the hypothesis at the 0.05 level
**MacKinnon-Haug-Michelis (1999) p-values
Source: Computed by Author
The co-integration test revealed that the fiscal variables are co-integrated and this confirms the presence of
long run relationship between government expenditure and government revenue, an indication of the fact that
fiscal policy in Nigeria is sustainable (Table 7). Sustainability of fiscal policy is achieved if either government
expenditure or government revenue does not drift away over the long run. The implication of this is that
government expenditure and revenue can drift apart from equilibrium for a while over the short run, but economic
forces and /or fiscal policy (government action) can bring the variables back over the long run( Oyeleke and Ajilore,
2014).
Although the study revealed that fiscal policy in Nigeria is sustainable, it is imperative to determine the degree
of sustainability, i.e. whether fiscal policy in Nigeria is strongly sustainable or weakly sustainable. Quintos (1995)
alluded that the degree of fiscal policy sustainability can be determined by testing for the statistical significance
of the co-efficient (β) of the independent variable. He concluded that a beta co-efficient of one (β= 1) denotes a
strong fiscal policy sustainability while beta co-efficient of less than one (β< 1) shows a weakly sustainable fiscal
policy.
In order to determine the strength of fiscal policy in Nigeria, Wald Co-efficient restriction test was employed
to assess whether the co-efficient of the regressor (government revenue) was statistically different from 1. The
result of the Wald Co-efficient Restriction Test is as shown in table 8.
Table 8: Wald Co-efficient Restriction Test.
Wald Test: Null Hyp: β =1
Equation: GE c GR
Test Statistic Value df Probability
t-statistic 7.145208 23 0.0000
F-statistic 51.05400 (1, 23) 0.0000
Chi-square 51.05400 1 0.0000
Null Hypothesis: C(2)=1
Null Hypothesis Summary:
Normalized Restriction (= 0) Value Std. Err.
-1 + C(2) 0.247314 0.034613
Restrictions are linear in coefficients.
Source: Computed by Author
The result of the Wald Test rejects the null hypothesis that beta (β) is statistically equal to 1 at 1% level of
significance. The test revealed that the explanatory variable (GR) has a β co-efficient of 0.25 i.e. 0< β < 1. The
implication of this is that although fiscal policy in Nigeria is sustainable, it has been found to be weakly sustainable.
Error Correction Model (ECM):
After establishing the presence of co-integration between the fiscal variables, it is therefore important to run the
Error Correction Model (ECM), which shows a short run dynamic relationship between the dependent variable
(government expenditure) and the regressor (government revenue). The ECM term indicates the speed of
adjustment of the dependent variable (GE) to restore or return to equilibrium, after a change in the explanatory
variable (GR) or following an exogenous shock. The result of the ECM is as shown in table 9.

Journal of Economics and Sustainable Development www.iiste.org
ISSN 2222-1700 (Paper) ISSN 2222-2855 (Online)
Vol.10, No.19, 2019
19
Table 9: Error Correction Model (ECM)
Dependent Variable= GE Variables Co-efficient Standard Error t- Statistics Prob.
C -0.141816 0.079155 -1.791625 0.0965
LOG GR 0.592292 0.097897 6.050156 0.0000
ECM-1 -0.000151 0.0000523 -2.8777 0.0129
Source: Computed by Author The error correction model (ECM) coefficient therefore, is an indication of how quickly the fiscal variables
(GE and GR) converge to equilibrium and for this to occur; the coefficient must be statistically significant, with
the correct negative sign. Following from this, the ECM result showed that the coefficient is statistically significant
at 5%, with value of -0.000151 which was rightly signed. The implication of this is that the degree to which the
fiscal variables will return to long run equilibrium after an exogenous shock will be very sluggish, further stressing
the fact that only 0.02% disequilibrium between the fiscal variables (GE and GR) in the Nigeria macroeconomy
was restored on a yearly basis as a result of extraneous shocks. Evidently, log GR which represents the elasticity
of government revenue to changes in government expenditure, has a value of 0.59 less than 1, thus further
corroborating the result of the Wald Test that fiscal policy in Nigeria is weakly sustainable.
Conclusion
The study investigated fiscal policy and public debt sustainability in Nigeria between 1990 and 2017, by employing
econometric techniques such as unit root test, cointegration test, error correction model, Wald restriction
coefficient test and IMF/World Bank debt burden indicators such as solvency and liquidity ratios.
The results from IMF/World Bank debt burden indicators revealed that Nigeria’s debt was sustainable in the
last 8- 10 years using the solvency ratios (Debt Stock/Revenue and Debt Stock/Export), as the debt burden
indicators were less than the indicative thresholds, thus implying Nigeria’s ability to meet its long term debt
liabilities. Also, the liquidity indicator (debt service/export earnings) showed that Nigeria was able to meet its
short term liabilities, as the debt burden indicators were below the indicative threshold of 20%. The findings were
contrary to public outcry and misinformation that the Nigerian economy is not only strangulated by mammoth
debt but also at the verge of collapse as a result of her rising debt profile which has become unsustainable.
On fiscal policy sustainability, the empirical result using cointegration test revealed that the fiscal variables
(GE and GR) were cointegrated, indicative of the fact that fiscal policy in Nigeria was sustainable. However, it
was further revealed by Wald coefficient restriction test that although fiscal policy in Nigeria was sustainable, it
was found to be weakly sustainable, as shown by a beta coefficient of 0.25(0<β< 1). This is in tandem with the
findings of Oyeleke and Ajilore (2014).
The ECM coefficient of -0.000151 or 0.02% which represents the rate at which the fiscal variables are restored
on a yearly basis as a result of exogenous shocks to the economy was considered very low and the rate of
adjustment sluggish, thus pointing to the fact that central government must streamline expenditure to its revenue
and diversify the economy by fully investing in the non-oil sector (export) in order to improve fiscal policy
sustainability and macroeconomic stability of Nigeria.
Nigeria’s weak fiscal stance is already a source of concerns and needs to be addressed to avoid fiscal crisis.
On the basis of this, the following recommendations are proffered:
Debt is a development tool. Hence, Nigeria could go ahead and borrow internationally to finance
productive investment projects. However, these borrowings should be long term and have lower cost
implications in terms of debt servicing. Also, borrowed funds should be tied to development projects that
could either, reduce the country’s dependence on foreign exchange or improve foreign exchange earnings.
Government should introduced debt ceilings in order to prevent explosion of the initial stock of debt
arising from arbitrary borrowings by state governments.
References
Afonso, A. (2000). Fiscal Policy Sustainability: Some Unpleasant European Evidence. ISEG Working Paper No.
12/2000/DE/CISEP, August.
Arrau, P. (1990). How Does the Debt Crisis Affect Investment and Growth? International Economics Department,
World Bank.
Bernheim, D.B. (1989). A Neoclassical Perspective of Budget Deficit, Journal of Economic Perspectives, vol.3
no.2, spring, pp 55-72.
Bohn, H. (1998). The Behavior of US Public Debt and Deficits. The Quarterly Journal of Economics, Vol. 113,
No.3.
Corsetti, G. and Roubini, N. (1991). Fiscal Deficits, Public Debt, and Government Solvency: Evidence from
OECD Countries. NBER Working Paper, No.3658.
Curtasu, A.R (2011). How to Assess Public Debt Sustainability: Empirical Evidence for the Advanced European
Journal of Economics and Sustainable Development www.iiste.org
ISSN 2222-1700 (Paper) ISSN 2222-2855 (Online)
Vol.10, No.19, 2019
20
Countries. Romanian Journal of Fiscal Policy, Vol. 2, Issue 2, July - December, pp 20-43.
Dayaratna-Banda, O.G and Priyadashanee, A.A.S (2014). Sustainability of Government Debt in Sri Lanka. Sri
Lanka Economic Journal, 5(1):51-69.
Elliot G. and Kearney C. (1988). The Intertemporal Government Budget Constraint and Tests for Bubbles.
Research Discussion Paper, No. 8809, Reserve Bank of Australia.
Foneska A.T and Ranasinghe, S.S (2007). Sustainability of Sri Lankan’s Public Debt. Sri Lankan Journal of
Management, Vol. 12 Nos. 3& 4 (July – December), pp.185-212.
Goldstein, M (2003). Debt Sustainability, Brazil and the IMF. Institute of International Economics, WP 03-1.
Ghosh, A.R, Mendoza, E.G, Ostry, J.D and Qureshi, M.S (2011). Fiscal Fatigue, Fiscal Space and Debt
Sustainability in Advanced Economies. NBER Working Paper, No. 16782.
Hakkio C.S. and Rush M. (1991), “Is the Budget Deficit too Large?” Economic Inquiry, 29, 429-445.
Ijioma, E (2013).Nigeria: Fiscal Responsibility and Challenges of Economic Development, All Africa Global
Media.
Leachman L. and Francis B. (2000). “Multi-Cointegration Analysis of the Sustainability of Foreign Debt.” Journal
of Macroeconomics, 22, (2): 207-227.
IMF (2002). Assessing Sustainability. Policy Development and Review Department.SM/02/166.
IMF (2013).Staff Guidance Notes on the Application of the Joint Bank-Fund Debt Sustainability Framework for
Low Income Countries, November 5.
IMF-IDA (2004). Debt Sustainability in Low Income Countries – Proposal for an Operational Framework and
Policy Implications. Washington, DC.
Makrydakis, J.S, Tzavalis, E and Balfoussias, A. (1999). Policy Regime Changes and Long Run Sustainability of
Fiscal Policy: An Application to Greece. Economic Modelling, Vol.16, Issue 1, pp.71-86.
Oyeleke, O.J and Ajilore, O.T (2014). Analysis of Fiscal Deficit Sustainability in Nigeria Economy: An Error
Correction Approach. Asian Economic and Financial Review.4(2):199-2010.
Ozkaya, A.(2013). Public Debt Stock Sustainability in Selected OECD Countries, Central Bank Review, Vol. 13,
pp31- 49.
Payne, J. (1997). International Evidence on the Sustainability of Budget Deficits. Applied Economic Letters, No.12.
Quintos, E.C., 1995. Sustainability of the fiscal process with structural shifts. Journal of Business and Economic
Statistics, 13(4): 409-417.
Smith, G.W. and Zin, S.E. (1991), “Persistent Deficits and the Market Value of Government Debts,” Journal of
Applied Econometrics, 6, 31-44.
Stoian, A, Campeanu, E. and Mihai, R.( 2010). Fiscal Sustainability based on Fiscal Reaction Function: Case
Study of Romania. Finance a úvěr-Czech Journal of Economics and Finance, No.6.
Tesic, A; Ilic, D and Delic, T. (2014). Consequences of Fiscal Deficit and Public Debt In Financing the Public
Sector. Economics of Agriculture 1/2014, UDC 336.14: 336.13.
Umo, J.U (1986). Economics: An African Perspective. Millennium Text Publishers Limited, 2nd edition.