FISCAL OPERATIONS IN A DEPRESSED ECONOMY: NIGERIA, …
68
MARCH 1996 RESEARCH PAPER FORTY-FOUR f FISCAL OPERATIONS IN A DEPRESSED ECONOMY: NIGERIA, 1960-90 — AKPAN H. EKPO and JOHN E. NDEBBIO ARCHIV 104735 )MIC RESEARCH CONSORTIUM CONSORTIUM POUR LA RECHERCHE ECONOMIOUE EN AFRIOUE
Transcript of FISCAL OPERATIONS IN A DEPRESSED ECONOMY: NIGERIA, …

MARCH 1996
RESEARCH PAPER FORTY-FOUR
f FISCAL OPERATIONS IN A DEPRESSED ECONOMY: NIGERIA, 1960-90
—
AKPAN H. EKPO and JOHN E. NDEBBIO
ARCHIV 104735
)MIC RESEARCH CONSORTIUM
CONSORTIUM POUR LA RECHERCHE ECONOMIOUE EN AFRIOUE
IDRC - Lib.
Fiscal operations in a depressed economy: Nigeria, 1960—90

Other publications in the AERC Research Papers Series:
Structural Adjustment Programmes and the Coffee Sector in Uganda by Germina Ssemogerere, Research Paper 1.
Real Interest Rates and the Mobilization of Private Savings in Africa by F.M. Mwega, S.M. Ngola and N. Mwangi, Research Paper 2
Mobilizing Domestic Resources for Capital Formation in Ghana. the Role of Informal Financial Markets by Ernest Aryeetey and Fritz Gockel, Research Paper 3.
The Informal Financial Sector and Macroeconomic Adjustment in Malawi by C. Chipeta and M.L.C. Mkandawire, Research Paper 4.
The Effects of Non-Bank Financial Intermediaries on Demand for Money in Kenya by S.M. Ndele, Research Paper 5.
Exchange Rate Policy and Macroeconomic Performance in Ghana by C.D. Jebuni, N.K. Sowa and K.S. Tutu, Research Paper 6.
A Macroeconomic-Demographic Modelfor Ethiopia by Asmerom Kidane, Research Paper 7.
Macroeconomic Approach to External Debt: the Case of Nigeria by S. Ibi Ajayi, Research Paper 8.
The Real Exchange Rate and Ghana's Agricultural Exports by K. Yerfi Fosu, Research Paper 9.
The Relationship Between the Formal and Informal Sectors of the Financial Market in Ghana by E. Aryeetey, Research Paper 10.
Financial System Regulation, Deregulation and Savings Mobilization in Nigeria by A. Soyibo and F. Adekanye, Research Paper 11.
The Savings-Investment Process in Nigeria: an Empirical Study of the Supply Side by A. Soyibo, Research Paper 12.
Growth and Foreign Debt: the Ethiopian Experience, 1964-86 by B. Degefe, Research Paper 13.
Links Between the informal and Formal/Semi-Formal Financial Sectors in Malawi by C. Chipeta and M.L.C. Mkandawire, Research Paper 14.
The Determinants of Fiscal Deficit and Fiscal Adjustment in Cote d'Ivoire by 0. Kouassy

and B. Bohoun, Research Paper 15.
Small and Medium-Scale Enterprise Development in Nigeria by D.E. Ekpenyong and M.O. Nyong, Research Paper 16.
The Nigerian Banking System in the Context of Policies of Financial Regulation and Deregulation by A. Soyibo and F. Adekanye, Research Paper 17.
Scope, Structure and Policy Implications of informal Financial Markets in Tanzania by M. Hyuha, 0. Ndanshau and J.P. Kipokola, Research Paper 18.
European Economic Integration and the Franc Zone: the future of the CFA Franc after 1996. Part I: Historical Background and a New Evaluation of Monetary Co-operation in the CFA Countries by Allechi M'bet and Madeleine Niankey, Research Paper 19.
Revenue Productivity implications of Tax Reform in Tanzania by Nehemiah E. Osoro, Research Paper 20.
The Informal and Semi-formal Sectors in Ethiopia: a Study of the Iqqub, iddir and Sav- ings and Credit Co-operatives by Dejene Aredo, Research Paper 21.
inflationary Trends and Control in Ghana by Nii K. Sowa and John K. Kwakye, Research Paper 22.
Macroeconomic Constraints and Medium-Term Growth in Kenya: A Three-Gap Analysis by F.M. Mwega, N. Nguguna and K. Olewe-Ochilo, Research Paper 23.
The Foreign Exchange Market and the Dutch Auction System in Ghana by Cletus K. Dordunoo, Research Paper 24.
Exchange Rate Depreciation and the Structure of Sectoral Prices in Nigeria Under an Alternative Pricing Regime, 1986-89 by Olu Ajakaiye and Ode Ojowu, Research Paper 25.
Exchange Rate Depreciation, Budget Deficit and inflation - The Nigerian Experience by F. Egwaikhide, L. Chete and 0. Falokun, Research Paper 26.
Trade, Payments Liberalization and Economic Performance in Ghana by C.D. Jebuni, A.D. Oduro and K.A. Tutu, Research Paper 27.
Constraints to the Development and Diversification of Non-Traditional Exports in Uganda, 1981-90 by G. Ssemogerere and L.A. Kasekende, Research Paper 28.

indices of Effective Exchange Rates: A Comparative Study of Ethiopia, Kenya and the Sudan by Asmerom Kidane, Research Paper 29.
Monetary Harmonization in Southern Africa by C. Chipeta and M.L. C. Mkandawire, Research Paper 30.
Tanzania's Trade with PTA Countries.' A Special Emphasis on Non-Traditional Products by Flora Mndeme Musonda, Research Paper 31.
Macroeconomic Adjustment, Trade and Growth: Policy analysis using a Macroeconomic model of Nigeria by C. Soludo, Research Paper 32.
Ghana.' The Burden of Debt Service Payment Under Structural Adjustment by Barfour Osei, Research Paper 33.
Short-Run Macroeconomic Effects of Bank Lending Rates in Nigeria, 1987-91.' A Computable General Equilibrium Analysis by D. Olu Ajakaiye, Research Paper 34.
Capital Flight and External Debt in Nigeria by S. Ibi Ajayi, Research Paper 35.
institutional Reforms and The Management of Exchange Rate Policy in Nigeria by Kassey Odubogun, Research Paper 36.
The Role of Exchange Rate and Monetary Policy in the Monetary Approach to the Bal- ance of Payments: Evidence From Malawi by Exley B.D. Silumbu, Research Paper 37.
Tax Reforms in Tanzania.' Motivations, Directions and Implications by Nehemiah E. Osoro, Research Paper 38.
Money Supply Mechanisms in Nigeria, 1970-88 by Oluremi Ogun and Adeola Adenikinju, Research Paper 39.
Profiles and Determinants of Nigeria's Balance of Payments.' The Current Account Component, 1950-88, by Joe U. Umo and Tayo Fakiyesi, Research Paper 40.
Empirical Studies of Nigeria's Foreign Exchange Parallel Market 1.' Price Behaviour and Rate Determination by Melvin D. Ayogu, Research Paper 41.
The Effects of Exchange Rate Policy on Cameroon's Agricultural Competitiveness by Aloysius Ajab Amin , Research Paper 42
Policy Consistency and inflation in Ghana by Nii Kwaku Sowa, Research Paper 43
PERt 00% CA L.S
Fiscal operations in a depressed economy: Nigeria, 1960—90
Akpan H. Ekpo University of Abuja
Abuja, Nigeria
and
John E. Udo Ndebbio University of Calabar
Calabar, Nigeria
AERC Research Paper 44 African Economic Research Consortium, Nairobi
March, 1996
©Afncan Economic Research Consortium, 1996
Published by The African Economic Research Consortium P.O. Box 62882 Nairobi, Kenya
Printed by the Regal Press Kenya Ltd P.O. Box 46116 Nairobi, Kenya
ISBN 9966-900-63-2

Contents
List of tables
I Introduction 1
II Theoretical issues 2
III Evolution of Nigeria's fiscal federalism 5
IV Federal fiscal profiles 16
V Evaluation of the allocation system 19
VI State fiscal operations, federal allocation: an overview 23 VIII Conclusion 30
References 32 Appendixes: A: Tables 34
B: Figures 54
List of tables
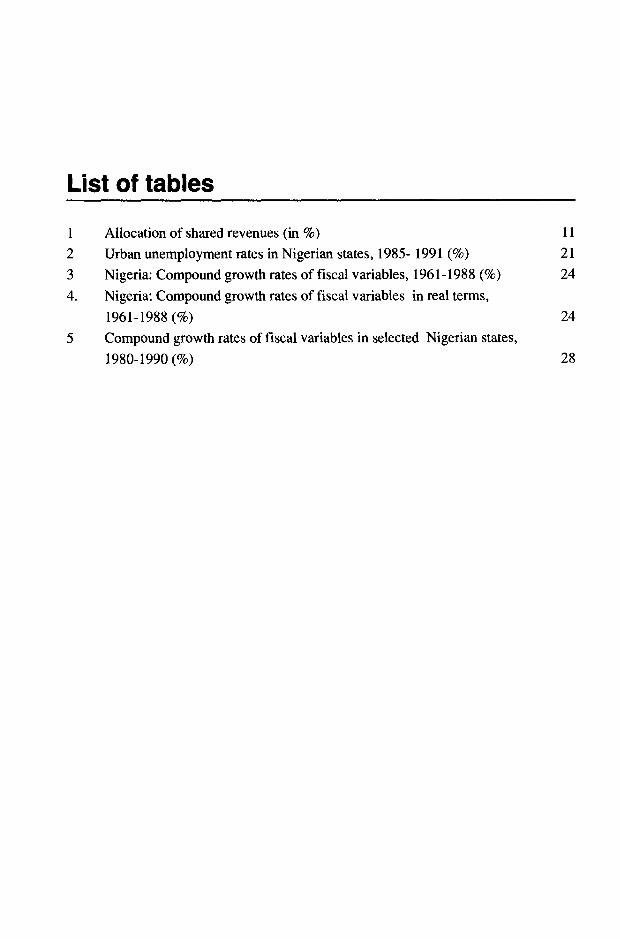
1 Allocation of shared revenues (in %) 11
2 Urban unemployment rates in Nigerian states, 1985- 1991 (%) 21
3 Nigeria: Compound growth rates of fiscal variables, 1961-1988 (%) 24
4. Nigeria: Compound growth rates of fiscal variables in real terms,
1961-1988(%) 24
5 Compound growth rates of fiscal variables in selected Nigerian states,
1980-1990(%) 28
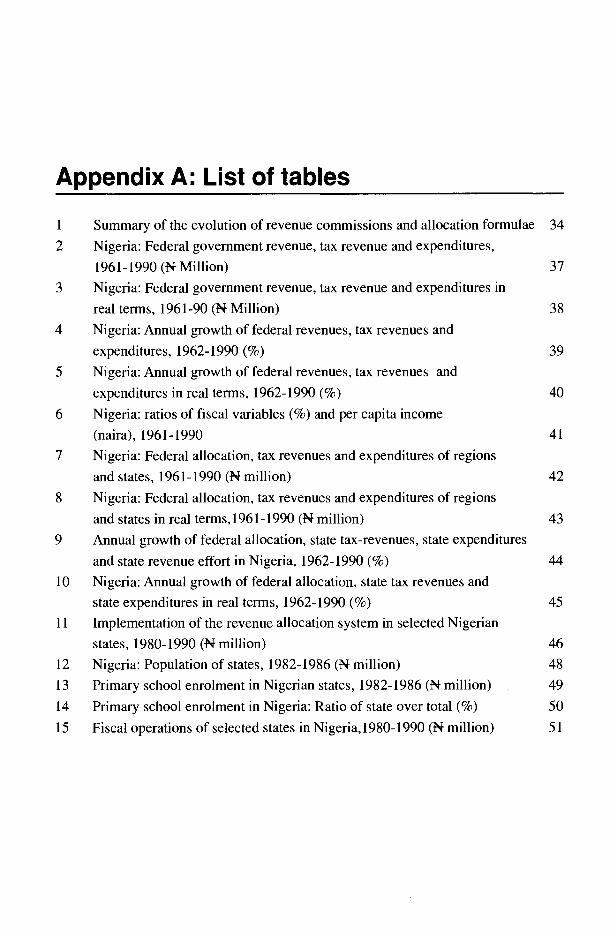
Appendix A: List of tables
1 Summary of the evolution of revenue commissions and allocation formulae 34
2 Nigeria: Federal government revenue, tax revenue and expenditures,
196 1-1990 (N Million) 37
3 Nigeria: Federal government revenue, tax revenue and expenditures in
real terms, 196 1-90 (N Million) 38
4 Nigeria: Annual growth of federal revenues, tax revenues and
expenditures, 1962-1990 (%) 39
5 Nigeria: Annual growth of federal revenues, tax revenues and
expenditures in real terms, 1962-1990 (%) 40
6 Nigeria: ratios of fiscal variables (%) and per capita income
(naira), 1961-1990 41
7 Nigeria: Federal allocation, tax revenues and expenditures of regions
and states, 196 1-1990 (N million) 42
8 Nigeria: Federal allocation, tax revenues and expenditures of regions
and states in real terms,1961-1990 (N million) 43
9 Annual growth of federal allocation, state tax-revenues, state expenditures
and state revenue effort in Nigeria, 1962-1990 (%) 44
10 Nigeria: Annual growth of federal allocation, state tax revenues and
state expenditures in real terms, 1962-1990 (%) 45
11 Implementation of the revenue allocation system in selected Nigerian
states, 1980-1990 (N million) 46
12 Nigeria: Population of states, 1982-1986 (N million) 48
13 Primary school enrolment in Nigerian states, 1982-1986 (N million) 49
14 Primary school enrolment in Nigeria: Ratio of state over total (%) 50
15 Fiscal operations of selected states in Nigeria,1980-1990 (N million) 51
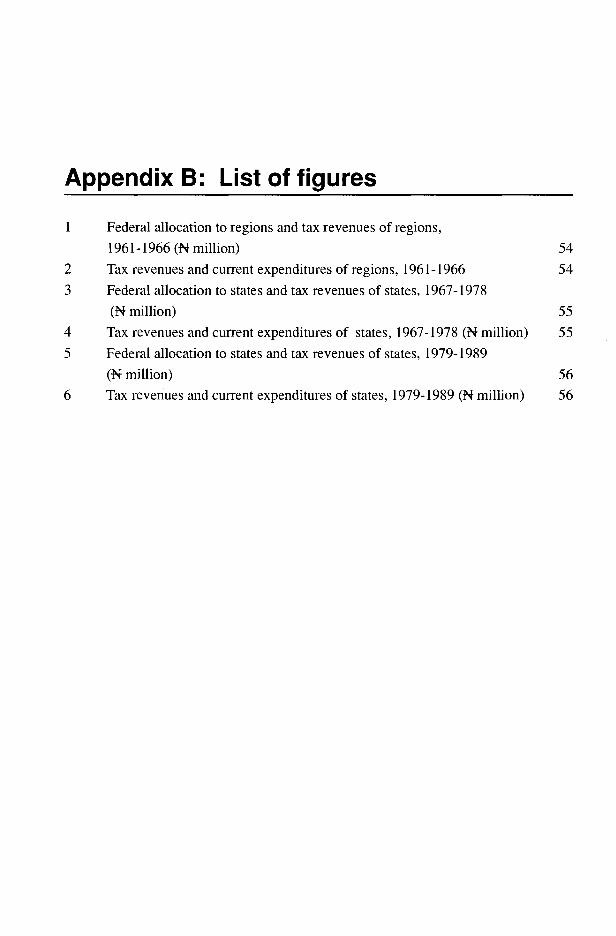
Appendix B: List of figures
1 Federal allocation to regions and tax revenues of regions,
196 1-1966 (N million) 54
2 Tax revenues and current expenditures of regions, 1961-1966 54
3 Federal allocation to states and tax revenues of states, 1967-1978
(N million) 55
4 Tax revenues and current expenditures of states, 1967-1978 (N million) 55
5 Federal allocation to states and tax revenues of states, 1979-1989
(N million) 56
6 Tax revenues and current expenditures of states, 1979-1989 (N million) 56

I. Introduction
Fiscal federalism remains an important area of study especially in an economy characterized by regional or state organization. The Nigerian economy consists of states. Twenty-one states and the Federal Capital Territory(Abuja) made up the federation until 25 August 1991, when the federal government created additional nine states. Hence, the country now consists of 30 states plus the Federal Capital Territory. However, this study concentrates on the original 21- state structure. The pattern had developed from one with three regions to one with four regions between 1960 and 1966. From 1967 to 1971, the country operated a 12- state structure. A 19- state blueprint, which lasted until September 1987 was created in 1975/76. These re-organizations, though political, have reasonable doses of historical and economic considerations. From the economic sphere, the creation of more states affects an economy's fiscal operations. The nature and type of relationship(s) between the centre and the states have to be worked out especially in terms of revenue sharing and expenditure. State fiscal structures have to be developed and fiscal functions of allocation, distribution and stabilization should be properly monitored in order to ensure growth and development within the economy. The centre must ensure that expenditure and revenue patterns in states or regions do not create distortions in the larger economy.
This study analyses fiscal federalism in Nigeria. Specifically, the report presents an historical account of fiscal federalism in the economy, highlighting significant episodes as well as drawing out implications for overall fiscal performance. Furthermore, it attempts to highlight some issues of fiscal centralization and decentralization within the economy. The paper is organized as follows. Section II discusses some theoretical issues, while Section III examines the evolution of fiscal federalism within the economy. Federal fiscal profiles as well as an evaluation of the implementation of the complex allocation system are presented in Sections 4 and 5, respectively. Section 6 discusses the fiscal operations of all states and focuses on ten selected states. Section 7 concludes the study.

II. Theoretical issues
Public expenditures play a significant role in the functioning of an economy whether it has a relatively low or high level of income. The theory of public expenditure development posits that the role of public expenditures changes in the course of development since the budgetary function must be adapted to the changing needs of the economy. Expenditure development is determined by economic, social, cultural and political factors.
The varying needs of the economy relate to both the allocation and distribution aspects of expenditure profiles. The allocation aspect concerns itself with the rising share of the public sector in the economy. It argues that as an economy expands, there will be a rising share of the public sector; that is, the ratio of public expenditures to GNP will increase. This is the familiar Wagner's law concerning the "expanding scale of state activity".
In terms of distribution, it is necessary to ascertain whether, as per capita income rises, there is an increasing or decreasing need for distributional measures depending on (1) variations in the existing distribution of income and (2) changes in the need to secure a particular pattern of distribution. Changes in technology as well as demographic factors may affect expenditure development. These factors have been labelled "conditioning forces" (Musgrave, 1973, pp. 70-74). The preferred mix of public and private goods is partly influenced by changes in technology in both the capital and consumer goods sector. Changes in demographic factors affect demand patterns and therefore the appropriate output mix. For example, an increase in the birth rate will likely influence future demand for education.
Conceptually, fiscal operations of any economy can be perceived from two extreme forms of the public sector. On one hand, there exists a highly decentralized fiscal system in which the government at the centre has no economic responsibilities. The other arms of government hence perform virtually all economic functions. The other extreme is a case of total centralization where the central government undertakes complete responsibility for all economic activities of the public sector and thus no other tiers of government participate in the economic life of the nation. In reality, there exists some degree of decentralization in all economies.
Decentralization implies the portion of total revenue collected and expenditures allocated to both state and local governments. The degree of decentralization is the extent of independent decision-making by the various arms of the government in the provision of social and economic services. It consists of the degree of autonomy of the state and local governments in carrying out various economic tasks.
FISCAL OPERATIONS IN A DEPRESSED ECONOMY: NIGERIA, 1960-90 3
An operational measure of decentralisation is therefore the share of decentralised expenditures and revenues of the state and local governments in the nation's total fiscal activities (Ubogu, 1982,
p.3).
Many factors determine an existing form of fiscal decentralization. They include historical, economic, political, geographical, cultural and social. It should be noted that an analysis of fiscal decentralization in an economy may differ depending on whether emphasis is
with tax (revenue) or expenditure. Decentralization of the fiscal structure, determined by historical and political forces, may have significant bearing on the funtioning of a country's fiscal system. This could allow for comparison of fiscal performance within an economy. If concern is on revenue when measuring fiscal decentralization, then a distinction must be drawn between total and own-revenues, with inter-governmental transfers constituting the significant difference. Within the context of expenditure centralization, allowances must also be made for the degree of central direction of local expenditures.
Expenditure made at the local level may be not only centrally financed but also centrally directed. Local governments which act as central expenditure agents do not reflect expenditure decentralization in a meaningful sense, just as centrally collected but shared taxes do not constitute true revenue centralization (Musgrave, 1973 p. 342).
Therefore, various kinds of grants or transfers must be distinguished depending on the extent to which central control of expenditures is involved. Centralization could be measured between various tiers of governments. Hence, a country may be relatively decentralized between the federal and state governments, but relatively centralized at the local government level; the reverse is also possible.
The degree of centralization or decentralization also affects the composition of the tax structure. Certain taxes are imposed more appropriately and administered more efficiently at the central level, while others are better at the state and local levels. Consequently, differences in tax centralization have implications for stabilization and economic development. Several economists have attempted to analyse various economic factors responsible for the different levels of fiscal centralization or decentralization.
The literature on fiscal federalism maintains that centralization of government expenditure is often accompanied by a rising per capita national income. This argument is predicated on the fact that: (a) as economic development occurs coupled with the increasing urbanization problems, there is pressure on government to provide better services by greater centralization; (2) there exist economies of scale in public activities
4 RESEARCH PAPER 44
provided by the central government; and (3) the broad-based taxation and superior taxing powers of the central government lead to an increasing centralization of government functions (Peacock and Wiseman, 1961).
However, greater centralization of government activities is significant as a result of the scarcity of qualified people. Their empirical results revealed that local governments have been unable to execute the functions assigned to them because of lack of qualified personnel; thus centralization of government expenditures is necessary for optimum use of the limited qualified manpower. They further observed that the various degrees of centralization were related to the physical size of a nation, rather than to economic development.
Per capita income, size of population, costs, degree of urbanization, degree of openness of an economy, etc are explanatory variables that have been used by scholars in studying fiscal centralization or decentralization vis-a-vis economic development. Several conflicting results have been obtained by economists (Pryor, 1967; Oates, 1972; Wheave, 1963; Kee, 1977; Ubogu, 1982).
We have attemped a brief discussion of the theoretical issues involving expenditure and revenue structure development. We have not carried out a detailed analysis of tax stucture development because it is beyond our present focus. Nonetheless, we hope that the issues discussed will provide a framework within which we can describe fiscal federalism in Nigeria, bearing in mind that economic, political, social and cultural factors are often difficult to separate.
Ill. Evolution of Nigeria's fiscal federalism
The evolution of fiscal federalism in Nigeria is anchored in economic, political! constitutional, social and cultural developments, which have influenced the nature and character of inter-governmental fiscal relations. As the economy progressed from a unitary to a federal type of government and the form of government became more and more decentralized, there were changes in fiscal arrangements. In analysing the history of the country's fiscal federalism, we divide the economy into two broad time frames, namely: (1) the pre-independence period and (2) the post-independence period. Within the post- independence era, we are specifically interested in the period of stabilization and structural adjustment(1980-1990). The evolution of Nigeria's fiscal federalism is summarized in Table A-i in the appendix.
Pre-independence period
Before the introduction of a republican constitution in 1963, the fiscal arrangements in the country were influenced by political and constitutional factors. Several commissions were set up to review existing fiscal arrangements and make appropriate recommendations.
The Phillipson Commission
Under the 1946 constitution and following the establishment of Regional Assemblies in the then Western and Eastern Regions, as well as a Northern Regional Council in the Northern Region, it was necessary to give some financial responsibilities to these new bodies. Consequently, the financial secretary to the Nigerian government, Sydney Phillipson, was appointed sole commissioner charged with the responsibility of preparing financial arrangements under the new constitution. The Phillipson commission, as it was later known, was mandated "to study comprehensively and make recommendations regarding the problems of the administrative and financial procedure to be adopted under the new constitution"(Phillipson, 1946, p. 1). The commission attempted to resolve three problems, namely: (1) the criteria to be used in declaring revenue as regional revenue; (2) how to determine the size of the grants from the central revenue; and (3) the formula for allocating grants among the regions. As regards the first problem, the commission utilized two criteria: (a) the revenue in question must be derived within the region and locally collected by the regional authorities, and (b) the revenue must be free from national

6 RESEARCH PAPER 44
or significant policy questions. Direct taxes, revenue from licences, mining rents, fees of courts and offices, rent from government property, and earnings from government departments met the two criteria.
The second problem had a constitutional solution. Under the constitution, the central government had complete authority to determine how much to provide as grants to the regions. However, the onerous task faced by the commission was how to derive a formula for distributing such grants among the regions. The commission considered two principles, (a) derivation and (b) even progress or even development. It recommended that the sharing of the grants be based solely on the principle of derivation. The shares were as follows: East, 24%; West, 30%; and North, 46%. The adoption of the principle of derivation in sharing revenue among the regions in Nigeria started with the implementation of the Phillipson Commission's recommendations. The derivation principle has since been a thorny issue in Nigeria's inter-governmental fiscal relation (Adedeji, 1969; Phillips, 1971; Teriba, 1966).
The Hicks-Phillipson Commission
Following the dissatisfaction with the revenue allocation system under the Phillipson Commission and the decision to transfer educational grants-in-aid from the central to the regional estimates, a new commission known as the Hicks-Phillipson Commission (HPC) was appointed in June 1950.
The terms of reference of the HPC included: (1) To carry out an expert and independent enquiry in consultation with all parties concerned, to submit proposals to the governor- in-council for division of revenue over a period of five years between the three regions and central Nigerian services in order to achieve in that time a progressively more equitable division of revenue among the three separate regions and the centre. (2) To determine whether any region had been unfairly treated in past years; if this was proven, then that region would be allowed a block grant to compensate for grants lost in past years.
In allocating revenue, the commission adopted the following criteria: liberty, justice, fraternity and efficiency. It recommended four principles corresponding to these criteria. They were independent revenue, derivation, need and national interest. Regarding independent revenue, four conditions were postulated for viewing revenue as regional. The revenue must be localized within the region, stable in yield, inexpensive to administer and free from considerations of national interest and policy. Hence, independent revenues to the regions were similar to revenues viewed regional by the Phillipson Commission except that the regions were given powers to impose sales taxes on petrol and also to impose entertainment taxes and stamp duties. The HPC applied the other three principles to the allocation of non-declared revenue. It apportioned 50% of tobacco tax on the principle of derivation; based capital grants on the principle of need; and transferred to the federal budget police and education. The Native Authority Police received 50% on national interest.
Furthermore, the HPC recommended that a one-time grant of N4 million be paid to
FISCAL OPERATIONS IN A DEPRESSED ECONOMY: NIGERIA, 1960-90 7
the Northern Region as compensation for its deprivation, arguing that the North was under-capitalized as compared to other regions. Scholars have critized the HPC for fomenting inter-regional conflicts and misunderstanding (Teriba, 1966, P. 366).
The Louis-Chick Commission
As the nationalist struggle persisted, two constitutional conferences were held, the first in August 1953, and the second in January and Febuary of 1954. The conference created the Louis-Chick Commission (LCC). Its terms of reference included: (1) to assess the cost of central services and those of the regions; (2) to recommend how best revenue should be collected and distributed having regard to the need to provide the centre and the regions an adequate measure of fiscal autonomy and the importance of applying the principle of derivation to the fullest degree compatible with meeting the reasonable needs of the centre and the regions ; and (3) to examine the financial ramifications of the southern part of the Cameroons becoming a separate region.
The commission's report was accepted by government and became operational in October 1954. The report provided that:
1. The federal government should retain the revenue from the following: company income tax and 50% of the duties on exports, tobacco, excise, imports (except those on motor spirit and tobacco).
2. 50% of import duties except those on tobacco and motor spirits should be shared thus: 40% for the West; 30% for the North; 29% for the East; and 1% for the Southern Cameroons.
3. Regions should collect and retain revenue from personal income tax, produce sales tax, license and service fees, interest on loans and earnings on surplus funds invested, revenue from regional departments, etc.
4. Revenue from the following sources should be shared among the regions in accordance with regional consumption: 50% of tobacco, export and excise duties; 100% of the duty on motor spirit, all mining rents and royalties; and fees from small craft licences. Personal income tax revenues collected by the federal goverment from Africans were returned to the regions where the Africans who paid the tax were resident.
The Raisman-Tress Commission
The revenue allocation commission of Sir Louis Chick was found wanting on three grounds: insufficient independent revenues to the regions, the utilization of the principle of derivation in revenue allocation, and the rejection of the principles of need and national interest in revenue allocation. As a result of these shortcomings, the 1957 constitutional conference inaugurated another fiscal revenue review commission in 1958 under the chairmanship of Sir Jeremy Raisman. Though the details of the commission's assignment

8 RESEARCH PAPER 44
is in (Raisman and Tress, 1958), we present highlights of its terms of reference. The Raisman-Tress Commission (RTC) was required to examine the division of power
to levy taxes in the Federation of Nigeria and the system of allocation of the revenue thereby derived in the light of: (1) experience of the system to date; (2) the allocation of functions between the governments in the federation as agreed at the conference; (3) the desirability of ensuring that the maximum possible proportion of the income of regional governments should be within the exclusive power of those governments to levy and collect, taking into account consideration of national and inter-regional policy; (4) as regards item 3, the special problems in the area of indirect taxation given the position of Lagos as a federal territory; (5) in so far as the independent revenues that can be secured for the various goverments are insufficient to provide not only for their immediate needs but also for a reasonable degree of expansion, and bearing in mind the federal government's own further needs, the desirability of allocating further federal revenue in accordance with such arrangements as will best serve the overall interests of the federation as a whole.
It is noteworthy that the commission introduced taxes on partnerships, clubs, trusts and other unincorporated associations to accrue to regional government jurisdictions. It contended that the federal government should be financially strong in order for it to avoid insolvency, and be able to provide grants to needy regions and services of national interest. The commission adopted four criteria in allocating revenue in a distributable pool account, which it created. These criteria were: balanced development, continuity in regional government services, maintenance of minimum responsibilities and population.
The RTC divided each type of revenue into three parts to be paid to states of origin, federal government and the distributable pooi account. These included: under state of origin, 50% of mining rents and royalties and import duties; for the distributable account, 30% of mining rents, royalties and import duties; and for the Federal Government, 20% of mining rents and royalties as well as 40% of import duties.
The distribution of the distributable pooi account was based on 40% for the North; 31% for the West; 24% for the East; and 5% for Southern Cameroons. It is interesting to note that the distributable pool account was used after independence to share some federally-collected revenue among the regions of the federation. In addition, the commission recommended the formation of a fiscal commission to review periodically the revenue from mining rents and royalties as well as the size, composition and distribution of the distributable pool account. The fiscal commission was required to consult with the regional governments. This recommendation seemed to have survived given the frequent review of revenue allocation within the economy.
From the above discussion, it appears clear that each commission was concerned with the efficient provision of public goods, and the distribution of available revenue. New fiscal commissions were appointed on the basis of constitutional changes. Though not explicit, there was some evidence of a power struggle between the regions each attempting to secure benefits for having an important natural resource. This phenomenon is implicit in the debate over the derivation principle.

FISCAL OPERATIONS IN A DEPRESSED ECONOMY: NIGERIA, 1960-90 9
The post-independence period
1) This period experienced significant economic, social and political changes, including an almost three-year civil war (1967-1970), which affected government expenditures and revenue patterns. 2) The form of government was further decentralized in 1967 by the creation of 12 states out of the erstwhile four regions. 3) In 1976, 19 states were created and local governments became officially known as the third tier of government. 4) Two new states (Akwa Ibom and Katsina) were created in 1987, thereby bringing the number of states to 21 excluding the Federal Capital Territory (Abuja), which received full status and thus was entitled to the allocation of federal funds. 5) Of significance during the period was the frequency and duration of military rule. The military took over the reigns of power and held them for almost 13 years before a civilian administration was installed in October, 1979. 6) In 1984, the military once again seized power from the civilians and two military regimes have existed since then: the Buhari regime and the Babaginda administration. 7) The military rule was characterized by the promulgation of decrees affecting the country's fiscal operations.
A major economic feature of the period was the ascendancy of the petroleum sector as the major foreign exchange earner. The windfall profit from petroleum beginning in 1974 and the dependence of the economy on oil revenues had implications on fiscal variables. For example, as a result of the huge foreign exchange earnings, government embarked on various non-viable projects and became actively involved in virtually all sectors of the economy.
Almost throughout the post-independence period Nigeria has been in a situation of economic crisis. Beginning in 1979/80, the economy entered a recessionary phase. The prolonged high rates of inflation and unemployment coupled with declining productivity confirmed the existence of stagflation in the economy. Consequently, various stabilization and adjustment packages aimed at reversing the crisis were introduced from 1984. The economy finally had to settle for a full-blown IMF type of structural adjustment in 1986. These stabilization and adjustment packages have implications for the country's fiscal operations. More concretely, the issues highlighted above influenced — positively or negatively — the evolution of fiscal federalism during the post-independence period in Nigeria.
The Binns Commission of 1964
Following the introduction of a republican constitution in 1963, the B inns Revenue Commission was appointed in 1964 to review inter-government fiscal relations. Its terms of reference included an examination of the appropriateness, in the prevailing circumstances of Nigeria, of: (a) the formula for the allocation of the proceeds of mining rents and royalties laid down in section 140 of the constitution of the federation; and (b) the formula for the distribution of funds in the distributable pool account laid down in
10 RESEARCH PAPER 44
section 141 of the constitution of the federation (Binns, 1964, pp. 5-6). The commission rejected the disttribution of funds based on principles of derivation
and need, and utilized the principles of regional financial comparability, continuity in government services and maintenance of minimum responsibilities. The commission recommended that 35% of federally collected revenue from import duties, mining rents and royalties be paid into the distributable pools account and distributed among the regions on the basis of North, 42%; East, 30%; West, 20%; and Mid-West, 8%. After the military intervention in 1966, and the creation of 12 states in 1967, the shares of the Northern Region were divided among the six northern states on the basis of population and equality of states. The military government carried out the changes by promulgating, as an interim measure, Decree No. 15 of 1967. The decree stipulated how the funds in the distributable pooi account were to be shared among the 12 states. It took cognizance of the regional blocks and segmented the funds in the account that had accrued to those regions among the new states. The principle adopted in dividing a region's share among the states emanating thereof was ad hoc and unsatisfactory. As a result, the military government appointed an Interim Revenue Allocation Review Committee in 1966, chaired by Chief 1.0. Dma.
Interim Revenue Allocation Review Committee
This committee was the first such body consisting only of Nigerians. In the light of the creation of 12 states, charged with the functions formerly exercised by the regional governments, the committee was mandated to look into and suggest any change in the existing system of revenue allocation as a whole. This included all forms of revenue going to each government besides and including the distributable pool account. The committee was also to suggest new revenue sources for both the federal and state governments.
In carrying out its mandate the committee proposed possible principles that could serve as criteria for revenue allocation, including four of those used in earlier allocation systems. The principles were basic need, minimum national standard, population, tax effort, financial prudence, fiscal adequacy, balanced development, independent revenue, derivation and national interest. The allocation of revenue between the federal and the state governments was divided into independent revenue and shared revenue. The independent revenue to the federal government comprised principally company (including oil companies) income tax, while that of the state governments consisted of personal income tax, licences, fees, etc. The shared revenue consisted of revenue from excise duty, import duty, export duty, mining rent and royalties from off-shore operations, and royalties from in-shore operations in respect of oil and solid minerals.
In addition, the committee recommended that the shared revenue should be allocated among the federal government and three accounts namely: the states joint account to replace the distributable pool account, the special grants account and the derivation account. The committee also worked out the details for sharing the states joint account.

FISCAL OPERATIONS IN A DEPRESSED ECONOMY: NIGERIA, 1960-90 11
Table 1: Allocatio n of share d revenues (in %)
Account ED1 1M2 ED3 MRI4 MRRO5
Federal 60 50 15 15 60 State deny — — 10 10 —
States joint 30 50 70 70 30 Special grants 10 — 5 5 10
Total 100 100 100 100 100
Source: The Report on the Interim Revenue Allocation Comm., (1969, p.77). Notes: 1. excise duty; 2. import duty; 3. export duty; 4. mining royalty (in-shore); 5. mining rent and royalty (off-shore)
In terms of derivation, the committee argued that the rent from inshore oil exploration should be assigned in full to the state from which the oil was extracted, while 10% of the royalties should be shared on derivation. The formula for the allocation of shared revenue is given below:
It must be noted that this first indigenous revenue allocation committee addressed vital fiscal issues in its recommendations. For example, it called for the centralization of certain functions, overhauling the tax administration throughout the country as well as uniformity in personal income taxes, measures that would increase tax revenue to federal and state governments, and the intensification of federal government spending on public goods that have the characteristics of spillovers in their consumption. However, the military government rejected the report of Chief Dma's committee and enacted Decree 13 of 1970. This decree modified the distribution of the distributable pool account, and the revenue paid into the account was distributed among the states on the basis of 50% on equality of states and 50% on population. Furthermore, an off-shore oil revenues decree was promulgated in 1971 it amended Section 140(6) of the constitution, which provided that the continental shelf of a state is part of that state.
The 1971 amendment stated that: (a) the ownership of and title to the territorial waters and the continental shelf shall vest in the federal military government; and (b) all royalties, rents and other revenues derived from or relating to the exploration, prospecting or searching for or the mining or working of petroleum (as defined in the Petroleum Decree of 1969) in the territorial waters and the continental shelf shall accrue to the federal military government.
The implication of the off-shore decree was that all the revenues from off-shore operations accrued to the federal government, while those from in-shore operations were allocated as per the existing formula: 45% on derivation; 50% to the distributable pool account; and 5% to the federal government.
In 1975, further changes were effected in the revenue allocation system. The distributable pool account was enlarged and revenues credited to the account included 35% of import duties other than motor fuels, tobacco, wine, potable spirits and beer;

12 RESEARCH PAPER 44
100% of the import duty on motor fuels and tobacco; 50% of excise duty on any commodity; 100% of the export duty (if levied) on produce, hides and skins; 80% of mining rents and royalties from inshore operations; and 100% of mining rents and royalties from off-shore operations. The creation of 19 states in 1976 and the demand by the constitution drafting committee for a new revenue allocation formula for inclusion in the proposed new constitution led to the appointment of The Technical Committee On Revenue Allocation in 1977 under the chairmanship of Professor Ojetunji Aboyade.
The 1977 Technical Committee on Revenue Allocation
The terms of reference of the committee were to take into consideration the need to ensure that each government of the federation had adequate revenue to enable it to discharge its responsibilities, with regard to population, equality of status among the states, derivation, geographical peculiarities, even development, the national interest and any other factors bearing on the problem. The committee was to analyse the existing revenue allocation formula with a view to determining its adequacy in the factors mentioned above and representations from the federal government and the state governments and other interested parties. Based on those findings, the committee was charged with recommending new propsals as necessary for the allocation of revenue among federal, state as well as the local governments, and also among state, and the local governments and making whatever recommendations were deemed necessary for the effective collection and distribution of federal and state revenues.
The committee rejected the former principles used in previous allocation systems. On the other hand, it recommended the following five criteria in allocating funds in the states joint account: equality of access to development opportunities, national minimum standards for national integration, absorptive capacity, independent revenue, and minimum tax effort and fiscal efficiency. The following weights were assigned to each of the above criteria respectively: 0.25, 0.22, 0.20, 0.18 and 0.15. The committee maintained that the allocation criteria should be applied to the incremental changes in the states joint account and not to the total absolute amount so as to ensure that each state government would be able to maintain a minimum continuity of services in carrying out its duties. The same formula was suggested for local governments.
The allocation formula recommended by the committee was: 57% for the federal government; 30% for states joint account; 10% for local government; and 3% for special grants account. The federal government in accepting the committee's recommendations modified the formula to read thus: 60% for the federal government; no change in state and local government shares, and no allocation for the special grants account.
The other significant recommendations of the committee, accepted by government, included: (1) the concurrent subjects in the new constitution would be similar to those of the 1963 constitution; (2) the local governments would be entrenched in the new constitution as the third tier of government; (3) all mineral rights would be vested in public ownership; (4) the tiers of government would be allocated tax powers and functions;

FISCAL OPERATIONS IN A DEPRESSED ECONOMY: NIGERIA, 1960-90 13
and (5) all revenue collected by the federal government (apart from personal income tax from the armed forces, external affairs officers and the new federal capital territory) would be shared among the federal, states and local governments.
The committee's report came under severe criticism especially as regards the weights attached to the five criteria and the recommendation that state governments should administer company income tax. It was feared that the latter would introduce complications while the former (weights) were arbitrary. An excellent appraisal and critique of the various fiscal commission reports is in Uduebo (1982).
The Okigbo Commission
Consequently, a new revenue allocation commission was established in November 1979, under the chairmanship of Dr. Pius Okigbo. This commission, otherwise known as the Presidential Commission on Revenue Allocation or the Okigbo Commission was set in motion two months after a new civilian administration assumed power. Despite the minority views expressed by some members of the commission, government modified and accepted its report.
However, on 2 October 1981 the Supreme Court of Nigeria declared the recommendations of the Okigbo Commission as invalid, null and void, and of no effect whatsoever.
The 1981 Revenue Act
In 1981, a new revenue act was passed by Parliament. It became operational from January 1982. Under the new act, federally collected revenues were distributed as follows:
Federal government 55% State governments 35% Local governments 10%
The 35% statutory share of the state governments was to be distributed thus:
(1) 30.5% to be shared among the states on the basis of:
(a) Minimum responsibility of government 40% (equality of states)
(b) Population 40% (c) Social development as indicated by primary
school enrolment, of which 11.5% is based on direct primary school enrolment; and 3.75% on inverse enrolment). 15%
(d) Internal revenue effort measured as the ratio of

14 RESEARCH PAPER 44
total internal revenue to total recurrent expenditure 5% (2) 3.5% for the benefit of the mineral producing states to be shared on the basis
of derivation, of which 2% will be shared directly on derivation and 1.5% will be administered by the federal government for the development of the mineral producing areas.
(3) 1% will be allocated to the federal fund for ecological problems.
The 1981 Revenue Act remained in force until December 1989. The act is the longest- standing revenue formula in the history of Nigeria's fiscal federalism. We will evaluate the implementation of this revenue act in a subsequent section. Even the two military governments, after the civilian rule, ignored the several criticisms levied against the act. However, in 1988, The National Revenue Mobilization, Allocation and Fiscal Commission was inaugurated under the chairmanship of General 1. Danjuma. In December 1989, government modified and accepted the recommendations of the Danjuma Commission.
The Danjuma Commission
Among other things, it is noteworthy that government agreed with the commission that there should be no dichotomy between on-shore and off-shore oil production for the purposes of revenue sharing and for the development of mineral producing areas. The important aspects of the revenue allocation formula of the Danjuma Commission accepted by government are summarized below:
Commission's recomendation Government's approved
Vertical allocation: Federal government 47% 50% State governments 30% 30% Local governments 15% 15% Special funds 8% 5%
100% 100% Special funds: Federal territory 1.0% FA 1.0% Stabilization 0.5% FA 0.5% Savings 2.0% FA Derivation 2.0% MR 1.0% MR Development of oil MPA 1.5% OMR 1.5% MR Development of non-oil MPA 0.5% NOMR -
General ecology 0.5% FA 1.0%
8.0% 5.0%

FISCAL OPERATIONS IN A DEPRESSED ECONOMY: NIGERIA, 1960-90 15
Horizontal allocation: Equality of states 40% 40% Population 30% 30% Social dev. factor* 10% 10% Land mass and terrain 10% Internal rev, effort 20% 10%
100% 100%
Notes: FA = Federal account MA = Mineral areas OMR = Oil mineral producing areas NOMR = Non-oil mineral producing areas *jncludes education (direct enrolment 8%); inverse enrolment (2%) The above revenue allocation formula except that of land mass and terrain took effect from December 1989.
IV. Federal fiscal profiles
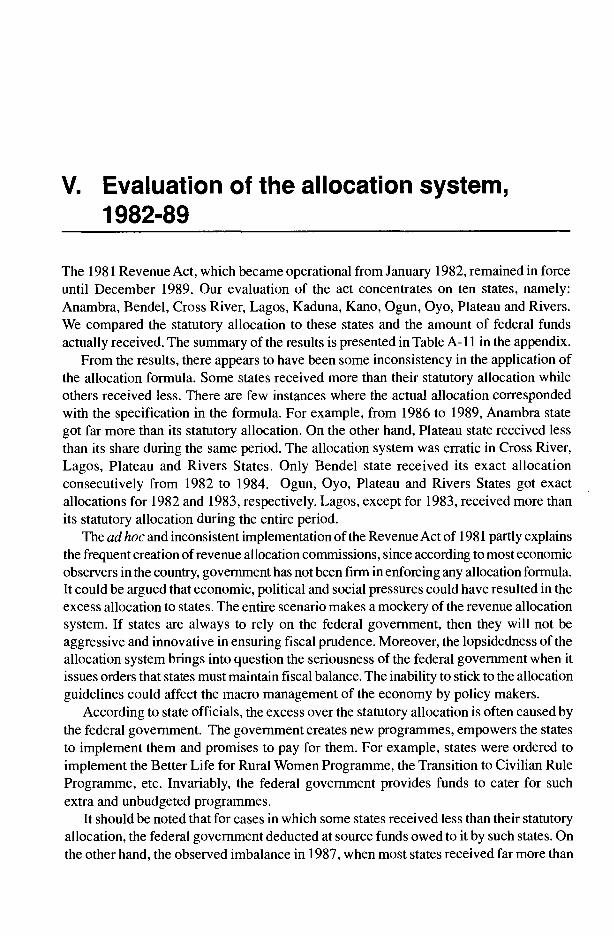
Between 1961 and 1967, the federal government operated a surplus budget, with tax revenues exceeding both current and capital expenditures from 1961 to 1965. The period 1960 to 1968 was characterized by high earnings from the export of agricultural commodities. Between 1961 and 1962, total revenue increased by 6.8%. However, total revenue, which was only N223.65 million in 1961, rose to N4,537 million in 1974. The growth in total revenue in 1974 was 167.6% as a result of the windfall profit from petroleum. Total revenue then continued to show remarkable increases except for 1981, 1982 and 1983 when the economy was in a depression. There were reductions in both current and capital expenditures during the same period (see Tables A-2 to A-b, as well as the bar charts and graphs in the appendix).
From 1968, excluding 1973 and 1974, the government operated a deficit in its fiscal operations. There were attempts to narrow the deficit during the period of depression, (1984-1988), which were necessitated by the conditions of the structural adjustment programme (SAP). The evidence does suggest some financial discipline on the part of the federal government. Table A-6 in the appendix presents some important fiscal ratios. Tax revenues constituted more than 60% of total federal revenues between 1961 and 1989; jumping from 16.5% of total revenue in 1961 to 86.9% in 1964 due to favourable international prices in agricultural exports. Thereafter, there were slight decreases; but on the average, tax revenue's share in total revenues between 1971 and 1974 was almost 80% indicating the importance of the oil sector. Though not shown in the tables, our investigation revealed that petroleum profit tax became the dominant revenue source during the 1970s. In 1979, for example, petroleum profit tax averaged almost 88% of direct tax revenue.
The ratio of tax revenues to gross domestic product, which averaged less than 10% before 1971, rose to 18.8% in 1974 and remained at almost 18%; by 1980, it increased to 21.6%. The ratio started to decline in 1981; at the worst of the depression, it stood at about 9.8%. This was partly due to the decline in company income taxes, personal income taxes, etc., caused by the downward trend in economic activities. However, from 1987, the increase in productive activities as well as efforts by government to enhance its revenue position-coupled with increased petroleum earnings-assisted in raising slightly the share of tax revenues to national product.
Furthermore, the evidence on the structure of expenditure development in Nigeria reveals interesting results. As an economy grows and modernizes, a substantial part of its expenditures ought to be financed through the national product. The share of total expenditures to GDP remained at almost 7% between 1961 and 1967. It averaged almost 18% from 1968 to 1972; declined to 13.4% in 1973 and rose slightly to 16.3% in 1974. Thereafter, the ratio increased remarkably, and by 1978 it was 39.4%. From 1981 to

FISCAL OPERATIONS IN A DEPRESSED ECONOMY: NIGERIA, 1960-90 17
1989, the ratio of total expenditures to national income was erratic (see Table A-6 in the appendix). Several factors were responsible for the "observed" structure on expenditure development. The growth in population and resulting demand for more social services like health and education, as well as the desire to provide necessary infrastructures for development, increased the share of expenditures in national income in the Nigerian economy. In addition, increased military expenditures (current and capital) raised the share of total expenditures in national output. The larger share of expenditures to national output between 1979 and 1990 was more political, because the then civilian regime tried to appease the electorate by engaging in a wide variety of projects, many of which were not viable. The present military regime began in 1985 to spend huge sums of money on the programme for the transition to civilian rule. This expenditure, financed by the Central Bank of Nigeria, generated fiscal imbalance.
In order to make precise statements on the ratios in Table A-6, it would be necessary to decompose the various revenue and expenditure sources and analyse the components as arguments within each fiscal ratio. For example, to properly incorporate the issue of economic development, it is important to ascertain over time and cross-sectionally how the ratio of tax revenue to GDP (TX/Y) and total expenditures to GDP (TE/Y) are related to income per capita. It is noteworthy to examine the variations of total expenditures and other fiscal variables in real terms overtime. From 1961 to 1974, fiscal variables increased over time when compared to nominal values during the same period. For example, in 1961, total federal government revenue and total expenditures stood at N223 .65 million and Ni 63.9 million, respectively, in nominal terms. In real terms, federal government revenue was N2,033.18 million, while total expenditures stood at N 1,490.00 million. Thus, in real terms, the 1961-1974 period seems better in terms of the impact of inflationary pressure on the economy. Tables A-3 and A-5 in the appendix present fiscal variables in real terms.
The adverse effect of inflation is clearly present during the period 1975 to 1990. However, it is important to indicate that the period was also characterized by various stabilization and adjustment policies. In real terms, government revenues and total expenditures have fluctuated over time. Invariably, government actually spent less on both current and capital expenditures for the period 1981-1990. In looking at real variables, 1975 and 1984 were chosen as base periods in deriving the implicit price deflators. The variables for these years match their nominal values.
The growth rate of fiscal variables in real terms is presented in Table A-S in the appendix. Comparing Table A-S with Table A-4 further confirms the presence of inflationary pressure on fiscal operations in the Nigerian economy.
Federal fiscal profiles have been influenced by the political character of the country. Expenditures have increased because of federal responsibilities to the regions and states. The expansion of the political structures from 4 regions to 12 states in 1967, from 12 to 19 states in 1976 and then to 21 in 1987 brought pressure on the fiscal balance of the federal government. The recent creation of nine more states further compounds the problem. The need to give states fiscal autonomy raises the issue as to which taxes should be collected at the state level. In addition, the size of federal allocations to the states depends on the amount of revenue collected. The domestic and external economic and

18 RESEARCH PAPER 44
political conditions could determine the magnitude of federal revenues. If states are to depend less on the federal government in terms of revenue, then they must be given some autonomy in determining their fiscal operations. The extent to which the federal government can allow states to be independent in revenue and expenditure matters re- echoes the complex nature of fiscal centralization and/or decentralization in an economy characterized by ethnic rivalry, political instability, diverse cultures, etc. Let us attempt an evaluation of the complex allocation system during the period, 1982-1989.
V. Evaluation of the allocation system, 1982-89
The 1981 Revenue Act, which became operational from January 1982, remained in force until December 1989. Our evaluation of the act concentrates on ten states, namely: Anambra, Bendel, Cross River, Lagos, Kaduna, Kano, Ogun, Oyo, Plateau and Rivers. We compared the statutory allocation to these states and the amount of federal funds actually received. The summary of the results is presented in Table A-il in the appendix.
From the results, there appears to have been some inconsistency in the application of the allocation formula. Some states received more than their statutory allocation while others received less. There are few instances where the actual allocation corresponded with the specification in the formula. For example, from 1986 to 1989, Anambra state got far more than its statutory allocation. On the other hand, Plateau state received less than its share during the same period. The allocation system was erratic in Cross River, Lagos, Plateau and Rivers States. Only Bendel state received its exact allocation consecutively from 1982 to 1984. Ogun, Oyo, Plateau and Rivers States got exact allocations for 1982 and 1983, respectively. Lagos, except for 1983, received more than its statutory allocation during the entire period.
The ad hoc and inconsistent implementation of the Revenue Act of 1981 partly explains the frequent creation of revenue allocation commissions, since according to most economic observers in the country, government has not been firm in enforcing any allocation formula. It could be argued that economic, political and social pressures could have resulted in the excess allocation to states. The entire scenario makes a mockery of the revenue allocation system. If states are always to rely on the federal government, then they will not be aggressive and innovative in ensuring fiscal prudence. Moreover, the lopsidedness of the allocation system brings into question the seriousness of the federal government when it issues orders that states must maintain fiscal balance. The inability to stick to the allocation guidelines could affect the macro management of the economy by policy makers.
According to state officials, the excess over the statutory allocation is often caused by the federal government. The government creates new programmes, empowers the states to implement them and promises to pay for them. For example, states were ordered to implement the Better Life for Rural Women Programme, the Transition to Civilian Rule Programme, etc. Invariably, the federal government provides funds to cater for such extra and unbudgeted programmes.
It should be noted that for cases in which some states received less than their statutory allocation, the federal government deducted at source funds owed to it by such states. On the other hand, the observed imbalance in 1987, when most states received far more than

20 RESEARCH PAPER 44
their statutory allocation, can be explained in terms of excess money in the economy due to the increased revenue from petroleum. Towards the last quarter of 1986 and all of 1987, government realized a "windfall" from petroleum, hence states' allocations were increased.
It is difficult to examine the impact of the 1981 revenue allocation system. There are no data on states' gross domestic product or income. Efforts to collect data on industrial production for each state were also fruitless. As regards agriculture, there are production figures on various crops for each state. Agricultural production for all states decreased during the period under study. However, there were slight increases in the production of cocoa and palm produce for 1987 and 1988.
State governments, like the centre, were involved in all kinds of economic activities. Most of the allocations from the federal government were used by states to float companies, either directly or in partnership with internal and external investors. States owned investment and finance houses as well as banks; they were involved in beer, cement, paint, agriculture, transport and other types of businesses (Federal Republic of Nigeria, 1986). These state enterprises performed badly, hence most of them have been either privatized or commercialized.
Most states experienced economic problems despite the "generous" financial allocation from the centre. For the period 1984-1987, for example most states recorded high urban unemployment rates (see Table 2). In 1984, Anambra had an unemployment rate of almost 15%; Bendel almost 13%; Cross River, 14%; Imo, about 16%, and Lagos, almost 10%. The unemployment rates for Bendel in 1986 and 1987 stood at 25.1% and 32.4%, respectively. The high unemployment rates in these states suggest, among other things, the loss in potential output. However, Kano and Kwara seemed to have performed better in terms of employment. Most states did reduce their unemployment rates in 1990 and 1991. It must be noted that Bendel, Cross River, Imo and Rivers are oil-producing areas. The federal allocation coupled with the grant received as oil producing areas seemed not to have arrested the high unemployment rates. The actual unemployment was likely to have been much higher, given the fact that most job-seekers do not patronize the labour exchanges.
Though inflation rates for states are not usually published, the available data on retail prices of certain basic commodities in all states indicated sharp increases in the prices of basic commodities during the period 1986-1990 (CBN, annual reports). Invariably, there has been a decline in the real wage of workers in all the states.
The provision of social services by the states is another area that consumes a large share of the federal allocations. Primary, secondary, technical and vocational schools come under the purview of state governments and education constitutes a substantial part of the states' current and capital expenditures. The population has been growing between 2.5% and 3% annually (see Table A-8 in the appendix), which should indicate increased expenditure on education. For the period 1981-1985, most northern states spent huge sums of money on scholarships for both secondary and university education. Some of the university scholarships were tenable abroad this also explains the excess statutory allocation to some of these states. However, the period of structural adjustment

FISCAL OPERATIONS IN A DEPRESSED ECONOMY: NIGERIA, 1960-90 21
Table 2: Urban unemployment rates in Nigerian states 1985-1991 (%)
States 1984 1985 1986 1987 1989 1990 1991*
Anambra 14.8 9.4 10.7 6.1 10.2 10.9 6.7
Bauchi 7.0 7.4 8.9 6.9 2.5 2.6 2.9 Bendel 12.8 11.6 25.1 32.4 13.0 10.1 8.5 Benue 8.0 13.8 9.1 10.4 7.7 4.1 2.9 Borno 5.7 12.6 8.1 6.0 4.3 3.5 6.5 Cross River 14.1 15.4 15.9 14.5 14.1 12.7 11.8 Gongola 13.3 16.0 8.2 3.0 1.0 10.1 13.0 lmo 15.7 15.9 18.8 19.4 10.4 15.0 5.9 Kaduna 5.7 12.2 8.1 19.8 10.2 7.9 3.0 Kano 3.6 2.3 2.7 2.3 1.3 7.0 1.4 Kwara 0.3 1.5 5.3 5.8 2.1 0.9 3.2 Lagos 9.7 7.3 11.4 7.1 6.1 4.3 1.5 Niger 2.7 3.9 12.0 5.1 2.9 ** 2.4 Ogun 6.5 5.1 5.5 14.6 2.1 2.3 1.6 Ondo 4.5 6.1 7.8 14.7 7.4 6.4 1.4 Oyo 8.1 11.5 5.9 10.4 8.1 1.7 2.9 Plateau 2.3 7.1 7.6 16.1 6.0 4.1 6.0 Rivers 7.3 10.1 11.6 21.8 12.9 7.2 18.8 Sokoto 0 1.4 2.8 4.1 11.3 8.4 9.5 All Nigeria 7.9 9.7 10.0 12.2 7.5 5.9 5.9
Source: Federal Office of Statistics, Lagos. Notes: * Figures are for March, 1991. ** Less than 0.1.
has been characterized by reduced expenditures on secondary education in almost all the states.
The data on primary school enrolment in all the states show that apart from the slight increase between 1982 and 1983 (2.1%), enrolment declined from 14.383 million to 12.915 million in 1986 representing a -3.5%. This trend is not unconnected with the stabilization and adjustment policies of the period. The introduction of school fees and other charges in primary, secondary and other types of training institutions resulted in fewer prospective school pupils since parents could not afford the increased fees.
Oyo state recorded the highest primary school enrolment as a ratio of total enrolment in the country for the period 1982-1986. In 1982, the percentage of primary school enrolment in the state compared to the total was 13.1%; by 1984, it had jumped to 14.4% and it stood at 15% in 1986. Kaduna, Kano and Anambra are also states with high primary school enrolment (see Tables A-9 and A-b in the appendix).
In the health sector, out of 11,177 health establishments in the country in 1984, state governments owned 2,968, about 27% of the total, while the federal government owned 78 (0.7%). The total number of health establishments in 1985 and 1986 were 3,023 and 3,022, respectively. The bulk of the health establishments were owned by private concerns

22 RESEARCH PAPER 44
and local governments (FOS, Abstract of Statistics, 1988). What is important in the provision of health care, however, is the accessibility and quality of services; How to measure these aspects is beyond the scope of this study.
The paucity of data on important variables like income/production at state levels prevented a cross-sectional correlation analysis. Nonetheless, we attempted to take an impressionistic view by discussing certain economic and social indicators with the implicit assumption that funds allocated to states were utilized in economic and social activities. Next, we examine the fiscal operations of selected states.

VI. State fiscal operations and federal allocations: An overview
States' tax revenues, current and capital expenditures, and federal statutory allocations, as well as their annual growth rates in nominal and real terms, are shown in Tables A-7 to A-b in the appendix. States operated fiscal deficits throughout the period 1961 to 1989, and depend on the federal government to meet their expenditures. In fact, during the period under study, state tax revenues were far below either current or capital expenditures. States' fiscal operations in real terms differed sharply from nominal values during the period, but an analysis of their fiscal operations using nominal values is also in order, at
least in allowing for inflationary effects.
Revenue and expenditure profiles
Tables A-8 and A-b present states' fiscal operations in real terms. However, the degree of centralization differed from time to time. In absolute terms, state tax revenues, which were N31.22 million in 1961, rose to N61.82 million in 1967, representing an increase of 10.3%. In 1968, states tax revenues began to decline, but showed some increase between 1972 and 1976 a period when states were allowed to collect personal income taxes. The remarkable upswing between 1980 and 1988 was partly due to the creation of more states, which resulted in increased employment and thus more personal income taxes. Current and capital expenditures of states were inconsistent. For example, in 1976, states' current expenditures grew by 208%, but in 1977 and 1978 they declined by 13.4% and 14.3%, respectively. By 1980, they grew by almost 65%, and showed some evidence of a decline after 1986. Capital expenditures exhibited similar patterns. Since the expenditures are aggregated for all states, we can only describe the trend more precisely when we analyse the fiscal operations of selected states.
From Table A-9, federal allocation to states recorded its highest pre-SAP growth rate in 1974 (116.4%). During the same year, capital expenditures of states grew by almost 71%, while the efforts by states to generate their own revenue grew by 12%. However, efforts by states to generate own revenues declined from 12% in 1974 to 3% in 1978, the period of the oil boom.
The period before the oil boom shows a different pattern. Between 1960 and 1967, the regions depended less on the federal government. The revenue allocation formula at that time allowed regions to collect petroleum profits tax, airport and produce sale/purchase taxes, customs and excise, and mining receipts. Hence, states' and regions' revenue efforts

24 RESEARCH PAPER 44
Table 3: Nigeria: Compound growth rates of fiscal variables, 1961-1988 (in %)
Items 1961-66 1967-70 1971-78 1974-76 1979-88
Fed alloc 10.5 3.6 26.4 13.9 13.4 Fed revenue 5.4 17.9 26.1 14.2 9.6 Fed tax revenue 6.5 21.7 25.1 10.2 10.3 Fedcurexp 10.6 52.8 29.2 53.2 8.8 Fed cap exp 2.5 24.7 53.0 40.0 5.6 State tax rev -1.7 -16.7 15.1 -1.5 20.4 State cur exp 6.9 2.9 31.8 73.3 9.4 State cap exp 2.0 -2.9 58.8 21 .9 7.4 State rev effort -6.6 -17.8 -18.1 -36.3 12.0
Source: Computed by authors based on data in tables in the appendix.
4: Nigeria: C ompound g rowth rates o f fiscal varia bles in real terms 1961-1988 (in
Items 1961-66 1967-70 1971-78 1974-76 1978-88
Fed alloc 2.72 -11.2 4.7 0.7 15.2 Fed revenue 2.00 1.0 4.4 1.0 10.0 Fed tax revenue -0.90 4.2 3.6 -2.5 10.6 Fed cur exp 2.9 30.9 7.0 35.4 9.1
Fed cap exp -4.6 6.8 26.6 23.6 5.9 State tax revenue -8.6 -28.6 -4.7 -12.9 22.9 Statecurexp -0.6 -11.9 9.1 53.1 11.1
Statecapexp -5.3 -16.8 31.5 7.7 7.7
Source: Computed by authors based on data in tables in the appendix.
grew at reasonable rates. It is interesting to note that in 1973, states' revenue efforts far exceeded the growth rate of total state expenditures! We are unaware of any policy that created such a scenario. During the period of the civil war (1967-70), federal allocations to regions grew at a compound rate of 3.6%, while state tax revenue declined by almost 17%. For the same period, the efforts by states to generate their own revenue decreased by almost 18%. It is commonly noted that during and after wars, governments usually increase expenditures, hence, the retained revenue to be allocated may be insufficient to meet demands by states. Fiscal operations during the war and after support the above observation for the Nigerian economy.
It appears that fiscal centralization in the economy was more pronounced before the period of supply-side stabilization and structural adjustment packages. A close

FISCAL OPERATIONS IN A DEPRESSED ECONOMY: NIGERIA, 1960-90 25
examination of Tables 3 and 4 indicate important episodes. During 1961-1966, when the economy was characterized by agricultural export
earnings, state tax revenues declined while both current and capital expenditures increased; reliance was on federal allocation. Efforts by states to generate tax revenues fell by -
6.6%. The same pattern, though with different magnitudes, could be observed during the civil war, the oil boom period and the windfall petroleum profits period (so-called due to the Arab oil embargo on the United States of America).
During the adjustment period, however, the scenario appears different. Annually, federal allocation declined successively from 1981 to 1986, except in 1985 (see Table A- 9). On the other hand, state tax revenues registered a compound growth rate of 20.4% between 1979-1988 due to the fiscal discipline dictated by the SAP and the mandate from the centre to the states that budgetary deficits would not be tolerated. In real terms, state tax revenues also grew by almost 23% during the same period. The growth of current and capital expenditures of states was less during the adjustment period as compared to other phases. Overall during the period under study, however, state revenue effort declined except during adjustment when it recorded a positve growth rate of 12%.
It follows, all things being equal, that the period of supply-side stabilization and adjustment was characterized more by fiscal decentralization. States attempted to match expenditures with revenues and depended less on the federal government. There is no doubt that states have tried to mobilize additional revenue by being innovative in establishing new revenue sources while at the same time enhancing the machinery for collecting taxes. The performance has varied between states. The federal government awards a surprise bonus to any state that generates more revenue during a fiscal year. Last year, Bendel state was the winner of the bonus.
Presently, state governments' revenue sources, that is, their tax jurisdictions, include: (a) personal income tax (retention of proceeds). (b) capital gains tax (retention of proceeds). (c) stamp duties (retention of proceeds). (d) football pools and other betting taxes. (e) land tax, including land registration fees. (f) vehicle licence and driving licence fees. (g) other fees, licences and earnings on items relating to state government functions. (h) other taxes as provided for under section 4(7) (a) of the constitution, for example,
purchase tax.
In line with the above, states have floated companies/banks in partnership with private investors, established lotteries, created development funds, etc. all with a view of being more revenue independent. Some states now source for funds from the capital and money markets. This was not the case before adjustment.
Fiscal operations in selected states
It is important to examine the fiscal operations of selected states in order to make precise

26 RESEARCH PAPER 44
statements on the economy's fiscal federalism. We have identified ten states, namely: Anambra, Bendel, Cross River, Lagos, Ogun, Oyo, Kano, Kaduna, Plateau, and Rivers. These states were chosen on the basis of data availability, geographical spread, and stage of economic development and maturity.
The pattern of fiscal operations in the ten selected states is shown in Table A- 15 in the appendix and in Table 5 below. It is interesting to note that all states exhibited deficit financing throughout the period, 1980-1990. No state was able to raise enough revenue to cover even recurrent expenditures. Consequently, statutory allocations continued to be vital in bailing out the economies of the various states. The reliance on federal grants suggests fiscal centralization. For all states, federal allocations increased steadily from 1980 -1990.
In order to better discuss the fiscal operations of states, we divided the period into three namely: (1) 1980-1985, a period of various stabilization packages; (2) 1980-1990, characterized by a full-blown structural adjustment; and (3) 1980-1990.
For the period 1980-1985, federal allocations to the ten selected states declined. The largest declines were recorded in Plateau (-8.2%), Rivers (-8.1%) and Bendel (-7.8%). During this period, there were efforts by government to deliberately reduce allocations to states as a way of ensuring fiscal prudence. The stabilization policy of the Buhari regime as well as the austerity measures of the 1985 Babaginda administration must have contributed to the decline in federal allocations to states. Federal projects in states were curtailed and the latter were instructed by the centre to avoid unnecessary capital projects and to reduce current expenditures.
Thus it is surprising that the period of structural adjustment is characterized by dramatic increases in federal allocation to states. Between 1986 and 1990, federal allocation to Anambra grew by almost 37%, while allocation to Plateau showed a compound growth rate of 47% for the same period. Allocations to other states also recorded remarkable growth. There is no doubt that increased federal revenue meant more money in the federation account for distribution. In addition, the centre, as was indicated in Section 5, made extra funds available to states in order to enable them to implement certain projects and programmes. For example, after the 1989 anti-SAP riots, funds were dispatched to states so that facilities to cushion the negative aspects of the SAP could be implemented.
Tax revenues of most of the states increased during 1980-1985 a period marked by declining federal allocations. For example, tax revenues in Bendel increased by about 22%; Cross River's by 19%; and those of Ogun and Anambra by almost 15%. On the other hand, tax revenues for Lagos state declined by -0.8%, and the decline in Plateau was rather drastic (-16.5%). In Plateau, all fiscal variables during 1980-1985 declined, with capital expenditures registering a negative growth rate of approximately 51%. Furthermore, the state exhibited no efforts in raising internal revenues. It should be noted that during the period of stabilization, some states relied on bank loans (mostly state- owned) to manage their economies.
It is noteworthy that during adjustment, capital expenditures for Bendel, Cross River, Ogun, Oyo, Plateau and Rivers grew by 45.5%, 39.2%, 37.4%, 55.1%, 78.8% and 53%, respectively. These rates are rather high for a period in which governments were supposed to be curtailing expenditures. During this same period, Bendel, Cross River, Ogun, Plateau

FISCAL OPERATIONS A DEPRESSED ECONOMY: NIGERIA, 1960-90 27
and Rivers showed no serious efforts in generating internal revenue and thus there was no growth in revenue efforts. However, there were states in which the growth in tax revenues either matched or exceeded the growth of current expenditures. In Anambra, tax revenues grew by 14.7% in 1980-1985 and current expenditures increased by 2.1% for the same period. For Bendel, tax revenues grew by 21.7% while current expenditures increased by 8.4%. In Kano, both tax revenues and current expenditures grew by the same rate of 1.6%. In these states, revenue efforts registered considerable growth as
well. It thus appears that these states and others in the same situation must have attempted
to implement the fiscal directives of the federal government. The overall period of 1980- 1990 indicates some 'stability' in the behaviour of certain fiscal variables except for Kano, Ogun and Plateau, where revenue efforts declined remarkably.
In fact, for Plateau and Lagos states, revenue efforts declined for each of the three periods. This partly confirms the assertion that Lagos state does not have that extra drive to raise revenues since it collects substantial company and personal income taxes at source.
However, it is important not to reach conclusions on the basis of examining only growth rates. In the case of Lagos state, for example, Table A-IS shows that the state revenue efforts stood at almost 114%, 104% and 130% for 1987, 1988 and 1989, respectively. Hence, Table 5 must be examined in conjunction with Table A-15 in the appendix.
The facts presented above on the fiscal operations of selected states may not fully portray the workings of the fiscal system within each state. It may be necessary to decompose the expenditure variables in order to ascertain which project or programme is creating the fiscal imbalance. States do have relationships with local governments under their jurisdiction, and they allocate funds to local governments. Moreover, some of the capital expenditures of states are located in local government areas and the multiplier effects may not be realizable in the short-run. For example, the building and equipping of schools and hospitals by states in various local governments possess both short-run and long-term advantages to the respective states and the wider economy.

28 RESEARCH PAPER 44
Table 5: Compound growth rates of fiscal variables in selected Nigerian states, 1980- 1990 (%)
States 1980-1985 1986-1990 1980-1990
Anambra
Federal allocation -3.4 36.8 11.2 Tax revenue 14.7 9.6 15.4 Current expenditure 2.1 17.7 9.5 Capital expenditure -11.6 19.4 1.5 Revenue efforts 12.5 -6.8 5.4
Bendel
Federal allocation -7.8 32.9 7.5 Tax revenue 21.7 4.8 10.7 Current expenditure 8.4 16.8 10.4 Capital expenditure -17.1 45.5 5.9 Revenue efforts 12.2 -10.3 0.3
Cross River
Federal allocation -4.7 27.8 7.3 Tax revenue 19.0 -1.0 6.0 Current expenditure 0.9 -1 .2 -1.0 Capital expenditure -19.3 39.2 2.9 Revenue efforts 17.9 -3.7 7.1
Lagos
Federal allocation -0.3 30.5 12.7 Tax revenue -0.8 9.8 4.9 Current expenditure 7.2 19.8 8.8 Capital expenditure 0.8 30.3 16.8 Revenue efforts -7.4 -8.4 -3.6
Kaduna
Federal allocation -1.0 21 .6 7.6 Tax revenue 2.8 25.2 10.1
Current expenditure -0.3 9.5 3.5 Capital expenditure -19.0 20.4 -5.9 Revenue efforts 3.2 14.3 6.4
Kano
Federal allocation -0.1 29.4 11.4

FISCAL OPERATIONS IN A DEPRESSED ECONOMY: NIGERIA, 1960-90 29
Table 5 ....continued
Tax revenue 1 .6 9.4 7.3 Current expenditure 1 .6 24.0 11 .9
Capital expenditure -11 .4 25.6 1 .0
Revene efforts 0.1 -11.7 -4.1
Ogun
Federal allocation -3.4 35.7 12.4 Tax revenue 14.9 -15.4 1.4 Current expendture 9.1 17.4 10.3 Capital expenditure -30.4 37.4 -1 .6
Revenue efforts 5.3 -27.9 -8.0
oyo
Federal allocation -2.5 31.3 10.5 Tax revenue 10.3 15.7 16.0 Current expenditure 10.2 15.4 12.0 Capital expenditure -13.1 55.1 9.9 Revenue efforts 0.1 0.2 3.5
Plateau
Federal allocation -8.2 47.3 11 .5
Tax revenue -16.5 7.4 -3.5 Current expenditure -2.4 14.1 5.1 Capital expenditure -50.8 78.8 -11.5 Revenue efforts -14.5 -5.9 -8.2
Rivers
Federal allocation -8.1 33.5 7.0 Tax revenue 9.3 18.0 13.6 Current expenditure -2.4 18.1 5.1
Capital expenditure -20.6 53.0 6.2 Revenue efforts 12.0 0 8.1
Source: Computed from data in Table A-iS. Notes: Revenue efforts = [tax revenue/current expenditures]%.

VII. Conclusion
We have examined fiscal operations in the Nigerian economy using an historical (political economy) approach. Specifically, we described the evolution of the various revenue allocation commissions from 1946 to the Danjuma Commission of 1989. We evaluated the implementation of the allocation formulas as contained in the Revenue Act of 1981. Furthermore, an impressionistic view of the impact of the allocation system as well as a discussion of the fiscal profiles of ten states were undertaken.
An analysis of the fiscal operations of both the federal and state governments showed that the latter was more dependent on the former before the economic crisis of 1979/80, suggesting some evidence of centralization. The stabilization and adjustment period portrayed fiscal decentralization
It was apparent that states often received more than their statutory allocation, implying that the allocation formulas were not strictly adhered to by the federal government. This must have been due to political and social pressures. Consequently, states depended on the federal government to meet their deficit financing. It was rather difficult to find a common pattern or framework that could be used in describing the nature of fiscal operations within the economy, especially in the states. All evidence confirms revenue centralization, while there were certain episodes of expenditure decentralization.
The creation of more states, the civil war, the dependent nature of the economy on the petroleum sector and the economic crisis have had implications for the country's fiscal federalism. Moreover, fiscal federalism in the economy is more influenced by non- economic factors. The agitation for more states, for example, is more political than economic. Economic viability of these states is of secondary importance.
It seems to us that states need some financial autonomy if they are to contribute to national development. In other words, fiscal decentralization within the economy is
necessary. Please note that this conclusion is not directly derived from our analysis. It is rather based on our discussions with officials at the state level. This is, therefore, suggested for political reasons. We also suggest that: (1) certain taxes like export and custom duties be returned to the states; (2) states be allowed to obtain royalties, etc., from minerals within their areas with an agreed fraction to be paid to the federal government; and (3) certain vital data like production and income be gathered at the state level this would allow for a more robust analysis of the economy in general and a given state in particular. Finally, the federal government must on its own part show fiscal discipline before giving directives to states to behave likewise.
The ad hoc and inconsistent nature of the country's fiscal operations has consequences on the macroeconomic management of the economy. The issues of stabilization, efficient resource allocation, distribution, growth, etc. all matters of structural adjustment —

FISCAL OPERATIONS IN A DEPRESSED ECONOMY: NIGERIA, 1960-90 31
could create further disequilibrium within an economy if inter-governmental fiscal relations are not properly managed.
In future, it may be necessary to carry out a more robust analysis in order to strengthen the discussion on the aspect of fiscal centralization and decentralization in the Nigerian economy.

References
Adedeji, A. 1969. Nigerian Federal Finance. London: Hutchison. Beck. M. 1979. "Public sector growth: A real perspective". Public Finance, vol. 36, no.
3.
Breton, A. 1965. "A theory of government grant". Canadian Journal of Economics and Political Science, May.
Central Bank of Nigeria, Economic and Financial Review, various issues, Lagos. Ekpo, A.H. 1988. "Increasing the revenue generating base of Akwa Ibom State" in
Priorities for the Development of Akwa Ibom State, Centre for Development Studies, Uyo, Nigeria.
Ekpo, A.H. and J. Ndebbio. 1992. "Fiscal operations in a depressed economy, Nigeria, 1960-1990". Final Report. Nairobi: AERC.
Federal Office of Statistics, 1989. Abstract of Statistics. Lagos: Government Printer. Enweze, C. 1974. "Structure of public expenditure in selected developing countries: A
time series study," Manchester School of Economics and Social Studies, December, 1974, pp. 430-463.
Gupta, S.P. 1986."Public expenditure and economic development: A cross section study". Finanzarchiv, pp. 24-41. June.
Kee. W. K. 1977. "Fiscal decentralisation and economic development". Public Finance Quarterly, pp.79-97, January.
Musgrave, R.A. 1973. Fiscal Systems. New Haven, Connecticut: Yale University Press. Oates, W.E. 1972. Fiscal Federalism. New York: Harcourt-Brace, Jovanovich. Peacock,A. and J. Wiseman. 1961. The growth of public expenditure in the United
Kingdom. Princeton: Princeton University Press. Pryor, F. L. "Elements of a positive theory of expenditure". Finanzarchiv, December,
pp.405-430. Shah, A. 1991. Perspective on the design of intergovernmental fiscal relations. World
Bank Working paper, No. 726, Washington D.C. Teriba, 0. 1966."Nigerian revenue allocation experience,1952-1965: A study in
intergovernmental fiscal and fianacial relations". Nigerian Journal of Economic and Social Studies, vol.8. no.3.
Ubogu, R. 1982."Fiscal decentralisation and economic development among Nigerian States". Nigerian Journal of Economic and Social Studies, vol.1. pp. 1-21. March.
Uduebo, M.A. 1982." Fiscal federalism in Nigeria: Experience since 1967 and proposals for the future". Unpublished Ph.D Thesis, Department of Economics, University of Lagos, Nigeria.
Wheave, K.C. 1963. Federal Government. Oxford: Oxford University Press.

Official Reports (In order of year published)
Binns, K.J. 1964. Report of the Fiscal Revenue Commission, Lagos, Government Printer. Federal Republic of Nigeria. 1967. Supplement to Official Gazette, Decree 14 and 15 of
1967. 1976. Supplement to Official Gazette, Decree 12 of 1976. 1969. Report of the Interim Revenue Allocation Review Committee, Apapa, Nigerian National Press. 1970. Supplement to Official Gazette, Decree 13 of 1970. 1971. Supplement to Official Gazette, Decree 15 of 1971. 1975. Supplement to Official Gazette, Decree 6 of 1975. 1978. Government Views on the Report of the Technical Committee on Revenue Allocation, Lagos, Federal Ministry of Information. 1980. Report of the Presidential Commission on Revenue Allocation, vol.1., Main Report and Minority Views, Lagos, Office of the President.
______
1981 ."Allocation of Revenue Act 1981" Supplement to Official Gazette Extraordinary, No.6, vols.68 & 69, Lagos. 986. Structural Adjustment Programme For Nigeria June 1986-July 1988, Govt. Printer, Lagos. 1990. The Approved Revenue Allocation Formulae, National Revenue Commission, Ikoyi, Lagos.

Appendix
Table A-i: Summary of the evolution of revenue commissions and allocation formulas
Year/commission Principles/criteria and allocation formulas
1946 Phillipson Based on derivation and equal progress or equal development. Grants were solely on derivation. East 24%, West 30% and the North 46%
1950 Hicks-Phillipson Based on independent revenue, derivation, need and national interest. Same formula as in 1946 except regions were empowered to impose sales taxes on petrol, entertainment taxes and stamp duties.
1954 Louis-Chick Federal government to retain revenue from company income tax; and sales on the export, tobacco, excise; 50% of import duties (except on tobacco and motor spirits) to be shared thus: West 40%, North 30%; East 29% and Southern Cameroons 1%. Regions to collect and retain revenues from personal income tax. 50% of tobacco export and excise duties and 100% of the duty on petrol to be shared among the regions in accordance with regional consumption.
1958 Raiseman-Trees Criteria: balanced development, continuity in regional government services, maintenance of minimum responsibilities and population. Divided each revenue into three parts: (a) states of origin, (b) federal government, (c) distributable pool account. For (a) 50% of mining rents and royalties and import duties; for (b) 30% of mining rates, royalties and import duties; for (c) 20% of mining rents and royalties and 40% of import duties. Allocation from the pool account: North 40%; West 31%; East 24%; and Southern Cameroons 5%.

FISCAL OPERATIONS IN A DEPRESSED ECONOMY: NIGERIA, 1960-90 35
1964 Binns 35% of federally collected revenue from import duties, mining rents and royalties to be paid into the distributable pool account and shared among states as follows: North 42%; East 30%; West 30% and Mid- West 8%.
1966 Dma Principles: basic needs, minimum national standards, population, tax effort, financial prudence, fiscal adequacy, balanced development, independent revenue, derivation and natioanl interest. Segmented revenue into independent and shared; the latter to be allocated between the federal government and other accounts, viz., states jooint account, special grants account, and derivation account. Excise duty: 60% federal; 30% states joint account; 10% special grants. Import duty: federal 50%; states joint account 50%. Export duty: 15% federal; 10% derivation; 70% states joint account; 5% special grants. Mining royalty (in shore): 15% federal; 10% derivation; 70% states joint account; 5% special grants. Mining rent and royalty (off shore): 60% federal; 30% states joint account and 10% special grant.
1970 Decree 13 Rejected Dma report. Revenue distributed among the states on the basis of 50% equality of states; 50% on population. All off-shore revenues accrued to the federal government. In-shore revenue shared as follows: 45% on derivation; 50% to the distributable pool account and 5% to the federal government.
1975 Amendment to Decree 13 of 1970 of import duties except on motor fuels, tobacco, wine, potable spirits and beer to the distributable pooi account; 100% of the import duty on motor fuels and tobacco; 50% of the excise duty on any commodity; 100% of the export duty (if levied) on produce, hides and skins; 80% of mining rents and royalties from in-shore operations, and 100% of mining rents and royalties from off-shore operations. All of the above were to accrue to the distributable pool account.
1977 Aboyade Criteria for state joint account: equality of access to development opportunities, minimum standards for national integration, absorptive capacity, independent

36 RESEARCH PAPER 44
revenue, minimum tax, and fiscal efficiency. 50% for the federal government; 10% for local governments; 3% for special grants account. Later, federal government changed its share to 60% and abolished the special grants account.
1979 Okigbo Recommendations declared null and void by the Supreme Court of Nigeria.
Revenue Act of 1981 Revenues to be allocated thus: federal government 55%; state governments 35%; local governments 10%. 35% statutory share of states to be allocated as follows: 40% as equality of states or minimum responsibility of government; 40% on population; social development 15%, of which 11.5% is based on direct primary school enrolment and 3.5% on inverse enrolment; 5% for internal revenue effort; 3.5% for mineral producing states, of which 2% on the basis of derivation and 1.5% administered by the federal government for the development of the mineral producing areas; 1% to the federal fund for ecological problems.
1989 Danjuma Vertical allocation: federal 50%; state governments 30%; local governments 15%; special funds 5%. Horizontal allocation: 40% for equality of states; 30% for population; 10% for social development factor, 8% direct enrolment and 2% for inverse enrolment; land mass and terrain 10% and internal revenue effort 10%. These were approved by the government.

FISCAL OPERATIONS IN A DEPRESSED ECONOMY: NIGERIA, 1960-90 37
Table A-2: Nigeria: Federal government revenue, tax revenue and expenditures, 1961-1990 (N million)
Year TR1 TX2 CE3 CAPE4 TE5
1961 223.65 171.1 96.86 67.0 163.9 1962 238.89 174.9 103.61 63.9 167.5 1963 249.10 186.6 119.64 64.0 183.6 1964 277.21 240.9 142.63 75.6 218.2 1965 321.10 267.6 156.84 79.6 236.5 1966 306.44 250.2 177.27 77.9 255.2 1967 327.17 2234.2 166.67 91.3 258.1 1968 290.76 230.0 218.75 131.1 349.9 1969 377.98 305.0 433.42 122.8 556.2 1970 633.16 513.6 909.15 220.9 1130.1 1971 1168.97 942.4 918.68 173.8 1092.5 1972 1404.80 1105.5 1412.40 451.3 1863.7 1973 1695.30 1369.1 963.50 565.7 1529.2 1974 4537.00 3530.3 1517.00 1549.4 3066.5 1975 5514.70 3750.9 4740.10 3518.2 8258.3 1976 6765.90 4735.1 5459.60 4241.9 9701.5 1977 8042.20 5876.6 6253.00 5442.3 11695.3 1978 7469.30 5659.6 7140.10 5197.0 12337.1 1979 10913.50 6898.2 8354.00 4837.5 13191.5 1980 15234.00 10974.6 9117.30 8395.6 17542.9 1981 12180.20 9362.8 5739.10 5696.9 11436.0 1982 11764.40 8090.7 7417.90 7950.3 15368.2 1983 10508.70 6316.1 5656.50 5868.5 11525.0 1984 11766.80 7197.0 6275.40 54110.0 11686.4 1985 14680.80 9972.5 7215.30 7613.3 14828.6 1986 12837.60 8227.8 7696.90 9076.8 16773.7 1987 25099.80 17280.0 15646.20 6372.5 22018.7 1988 27310.80 18333.0 19409.40 8340.1 27749.5 1989 50272.10 32110.4 25993.98 15034.1 41028.0 1990 66895.40 39042.3 36219.60 24929.5 61149.1
Sources: (1) Files of the Federal Ministry of Finance and Development, Lagos. (2) Central Bank of Nigeria, Economic and Financial Review, various issues. (3)Federal Office of Statistics, Abstract of Statistics, various issues.
Notes: 1 = Total revenue; 2 = Tax revenues; 3 = Current expenditures; 4 = Capital expenditures; 5 = Total expenditures (3+4).
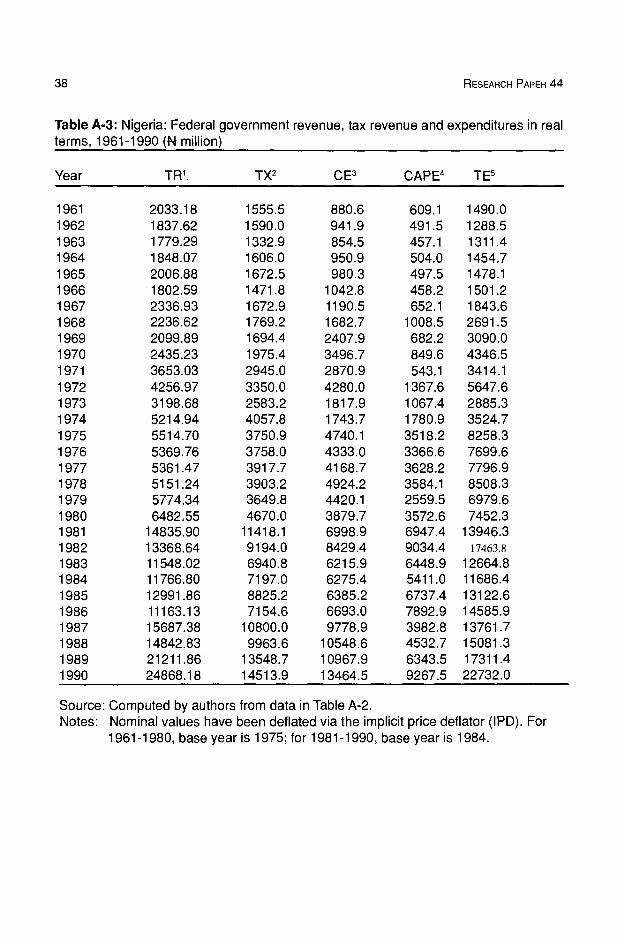
38 RESEARCH PAPER 44
Table A-3: Nigeria: Federal gov ernment revenue, tax re venue and ex penditures in real terms, 1961 -1990 (N million)
Year TR1 TX2 CE3 CAPE4 TE5
1961 2033.18 1555.5 880.6 609.1 1490.0 1962 1837.62 1590.0 941.9 491.5 1288.5 1963 1779.29 1332.9 854.5 457.1 1311.4 1964 1848.07 1606.0 950.9 504.0 1454.7 1965 2006.88 1672.5 980.3 497.5 1478.1 1966 1802.59 1471.8 1042.8 458.2 1501.2 1967 2336.93 1672.9 1190.5 652.1 1843.6 1968 2236.62 1769.2 1682.7 1008.5 2691.5 1969 2099.89 1694.4 2407.9 682.2 3090.0 1970 2435.23 1975.4 3496.7 849.6 4346.5 1971 3653.03 2945.0 2870.9 543.1 3414.1 1972 4256.97 3350.0 4280.0 1367.6 5647.6 1973 3198.68 2583.2 1817.9 1067.4 2885.3 1974 5214.94 4057.8 1743.7 1780.9 3524.7 1975 5514.70 3750.9 4740.1 3518.2 8258.3 1976 5369.76 3758.0 4333.0 3366.6 7699.6 1977 5361.47 3917.7 4168.7 3628.2 7796.9 1978 5151.24 3903.2 4924.2 3584.1 8508.3 1979 5774.34 3649.8 4420.1 2559.5 6979.6 1980 6482.55 4670.0 3879.7 3572.6 7452.3 1981 14835.90 11418.1 6998.9 6947.4 13946.3 1982 13368.64 9194.0 8429.4 9034.4 17463.8
1983 11548.02 6940.8 6215.9 6448.9 12664.8 1984 11766.80 7197.0 6275.4 5411.0 11686.4 1985 12991.86 8825.2 6385.2 6737.4 13122.6 1986 11163.13 7154.6 6693.0 7892.9 14585.9 1987 15687.38 10800.0 9778.9 3982.8 13761.7 1988 14842.83 9963.6 10548.6 4532.7 15081.3 1989 21211.86 13548.7 10967.9 6343.5 17311.4 1990 24868.18 14513.9 13464.5 9267.5 22732.0
Source: Computed by authors from data in Table A-2. Notes: Nominal values have been deflated via the implicit price deflator (IPD). For
1961-1980, base year is 1975; for 1981-1990, base year is 1984.

FISCAL OPERATIONS IN A DEPRESSED ECONOMY: NIGERIA, 1960-90 39
Table A-4: Nigeria: Annual growth of federal revenue, tax revenue and expenditures, 1962-1990 (%)
Year TR1 TX2 CE3 CAPE4
1962 6.8 2.2 7.0 -4.6 1963 4.3 6.7 15.5 0.2 1964 11.3 29.1 19.2 18.1
1965 15.8 11.1 10.0 5.3 1966 -4.6 -6.6 13.0 -2.1 1967 6.8 -6.4 -6.0 17.2 1968 -11.1 -1.8 31.2 43.6 1969 30.0 32.6 98.1 -6.3 1970 67.5 68.4 109.8 79.9 1971 84.6 83.5 1.0 -21.3 1972 20.2 17.3 53.7 159.7 1973 20.7 23.8 -31.8 25.3 1974 167.6 157.8 57.5 173.9 1975 21.5 6.2 212.4 127.1 1976 22.7 26.2 15.2 20.6 1977 18.9 24.1 14.5 28.3 1978 -7.1 -3.7 14.2 -4.5 1979 46.1 21.9 17.0 -7.0 1980 36.9 59.1 9.1 73.6 1981 -20.0 -14.7 -37.1 -32.1 1982 -3.4 -13.6 29.3 39.6 1983 -10.7 -21.9 -23.7 -26.2 1984 12.0 14.0 10.9 -7.8 1985 24.8 38.6 14.9 40.7 1986 -12.6 11.5 6.7 19.2 1987 96.0 110.0 103.3 -29.8 1988 8.8 6.1 24.1 30.9 1989 84.0 75.2 33.9 80.2 1990 33.1 21.6 39.3 65.8
Source: Computed from data in Table A-2.

40 RESEARCH PAPER 44
Table A-5: Nigeria: Annual growt h of federal re venues, tax revenue and expenditures in real terms, 1962-1990 (in %)
Year TR TX CE CAPE
1962 -9.6 2.2 7.0 19.3 1963 -3.2 -16.2 -9.3 -8.1 1964 3.9 20.5 11.3 10.3 1965 8.6 4.1 3.1 -1.3 1966 -10.2 -12.0 6.4 -7.9 1967 29.6 13.7 14.2 42.3 1968 -4.3 5.8 41.3 54.7 1969 -6.1 -4.2 43.1 -32.4 1970 16.0 16.6 45.2 24.5 1971 50.0 49.1 -17.9 -36.1 1972 16.5 13.8 49.1 151.8 1973 -24.9 -22.9 -57.5 -22.0 1974 63.0 57.1 -4.1 66.8 1975 5.7 -7.6 171.8 97.6 1976 -2.7 0.2 -8.6 -4.3 1977 -0.2 4.2 -3.8 7.8 1978 -3.9 -0.4 18.1 -1.2 1979 12.1 -6.5 -10.2 -28.6 1980 12.3 28.0 -12.2 39.6 1981 129.1 144.5 80.4 94.5 1982 -10.9 -19.5 20.4 30.0 1983 -13.6 -24.5 -26.3 -28.6 1984 1.9 3.7 1.0 -16.0 1985 10.4 22.6 1.8 24.5 1986 -14.1 -18.9 4.8 17.2 1987 40.5 51.0 46.1 -49.5 1988 -5.4 -7.7 7.9 13.8 1989 42.9 36.0 4.0 39.9 1990 17.2 7.1 22.8 46.1
Source: Computed by authors from Table A-3.

FISCAL OPERATIONS IN A DEPRESSED ECONOMY: NIGERIA, 1960-90 41
Table A-6: Nigeria: Ratios of fiscal variables (in %) and per capita income (in naira), 1961 -1 990
Year TR\Y1 TX\TR2 TX\Y3 TE\Y4 Yp5
1961 9.4 16.5 7.2 6.9 44.8 1962 8.6 73.2 6.3 6.0 51.7 1963 8.5 74.9 6.3 6.2 52.6 1964 8.8 86.9 7.7 7.0 55.2 1965 9.6 83.3 8.0 7.0 57.9 1966 8.5 81.6 7.0 7.1 60.2 1967 11.1 71.6 8.0 8.7 48.4 1968 10.1 79.1 8.0 12.2 45.7 1969 10.0 80.7 8.0 14.7 58.3 1970 11.3 81.1 9.2 20.2 83.3 1971 17.1 80.6 13.8 16.0 99.3 1972 19.7 78.7 15.5 26.1 100.5 1973 14.9 80.8 12.0 13.4 156.0 1974 24.2 77.8 18.8 16.3 250.3 1975 25.6 68.0 17.4 38.3 280.2 1976 24.8 70.0 17.3 35.5 349.2 1977 24.9 73.1 18.2 36.1 409.6 1978 23.9 75.8 18.1 39.4 386.4 1979 26.8 63.2 16.9 32.4 356.5 1980 30.0 72.0 21.6 34.4 362.6 1981 20.7 76.9 15.9 19.4 321.1 1982 18.8 68.8 13.0 24.5 304.1 1983 16.2 60.1 9.8 17.7 276.0 1984 16.5 61.2 10.1 16.4 251.0 1985 18.2 68.0 12.4 18.4 256.5 1986 15.7 64.1 10.1 20.5 292.1 1987 23.4 68.8 16.2 20.6 289.8 1988 19.1 67.1 12.8 19.4 281.6 1989 22.6 63.9 14.4 18.4 271.7 1990 27.3 58.4 16.0 25.0 275.7
Sources: Computed by authors based on the data from Table A-2. Notes: (1) Ratio of total revenue (TR) to gross domestic product (Y); (2) ratio of tax revenue (TX) to total revenue; (3) ratio of tax revenue to GDP; (4) ratio of total expenditures (current + capital) to GDP; (5) per capita income

42 RESEARCH PAPER 44
Table A-7: Nigeria: Federal allocation, tax revenues and expenditures of regions
Year FA STX1 SCE2 SCAE3 TSE4
1961 66.8 31.22 115.60 56.7 172.27 1962 71.9 38.22 138.11 56.27 194.38 1963 75.7 40.31 127.39 55.53 182.92 1964 109.0 37.64 143.87 62.54 206.41 1965 130.7 31.77 167.56 61.08 228.64 1966 121.3 28.14 172.21 63.91 236.12 1967 85.7 61.82 126.92 50.80 177.72 1968 77.1 40.29 104.67 24.25 128.92 1969 126.6 45.45 173.29 42.50 215.79 1970 98.8 29.76 142.20 45.20 187.40 1971 190.0 41.04 220.49 54.46 274.95 1972 349.1 76.70 349.10 136.00 485.10 1973 357.1 83.02 489.30 250.20 739.50 1974 772.9 113.97 521.40 427.00 948.40 1975 1039.9 73.93 880.70 409.70 1290.40 1976 1142.8 108.90 2711.60 772.90 3485.50 1977 1572.5 138.10 2349.50 3990.30 6339.98 1978 1240.0 126.60 2012.70 2201.20 4213.90 1979 2044.0 283.60 2583.90 1758.50 4342.40 1980 4128.6 1327.70 4254.00 4697.00 8951.00 1981 3825.6 1049.20 4944.90 6913.50 11858.40 1982 3245.7 1315.80 4733.90 5946.60 10680.00 1983 2958.5 1370.90 5262.10 5828.80 11090.90 1984 2722.0 1678.90 4603.10 2424.00 7027.00 1985 3260.8 1584.10 4823.10 1034.00 5857.10 1986 2843.8 1818.00 4458.20 1130.40 5588.60 1987 6197.1 1954.50 5721.20 2542.30 8263.50 1988 8181.3 2178.80 7193.40 3585.10 10778.50 1989 9899.3 1602.30 8140.60 4834.10 12974.70 1990 13509.7 3006.80 12140.20 5603.00 17743.20
Source: As Table A-2.
Notes: From 1960-1967, allocations were for regions. Thereafter, allocations were for states. There are presently 21 states excluding the Federal Capital Territory (Abuja). Federal allocations; (1) states' tax revenues; (2) states' current expenditures; (3) states'
capital expenditures; (4) total states' expenditures.

FISCAL OPERATIONS IN A DEPRESSED ECONOMY: NIGERIA, 1960-90 43
Table A-8: Nigeria: Federal allocation, tax revenues and expenditures of regions and states in real terms, 1961 -19 90 (N million)
Year FA STX1 SCE2 SCEA3 TSE4
1961 607.27 283.82 1050.91 515.18 1566.09 1962 553.08 294.00 1062.24 432.85 1495.23 1963 540.71 287.93 909.93 396.64 1306.07 1964 726.67 250.93 959.13 416.93 1376.07 1965 816.88 198.56 1047.25 381.75 1429.00 1966 713.53 165.53 1013.00 371.59 1388.94 1967 612.14 441.57 906.57 362.86 1269.43 1968 593.08 309.92 805.15 186.54 991.69 1969 703.33 252.50 962.72 236.11 1198.83 1970 380.00 114.46 546.92 173.85 713.08 1971 593.75 128.25 689.03 170.19 859.22 1972 1057.88 232.42 1057.88 412.12 1470.00 1973 673.77 156.64 923.21 472.08 1395.28 1974 888.39 131.00 599.31 490.80 1090.11 1975 1039.90 73.93 880.70 409.70 1290.40 1976 906.98 86.43 2152.06 613.41 2766.27 1977 1048.33 92.07 1566.33 2660.25 4226.65 1978 855.17 87.31 1388.07 1518.07 2906.14 1979 1081.48 150.05 1367.14 930.42 2297.57 1980 1756.85 564.98 1810.21 1998.72 3808.94 1981 4665.36 1279.51 6030.36 8431.10 14461.46 1982 3688.30 1495.23 5379.43 6757.50 12136.93 1983 3251.10 1506.48 5782.53 6405.27 12187.80 1984 2722.00 1678.90 4603.10 2424.00 7027.00 1985 2885.66 1401.86 4268.23 915.04 5183.27 1986 2472.87 1580.87 3876.70 982.96 4859.65 1987 3873.19 1221.56 3575.75 1588.94 5164.69 1988 4446.36 1184.13 3909.46 1948.42 5857.88 1989 5176.19 1117.77 4513.09 2082.90 6595.99
Source: Computed by authors. Notes: See Tables A-3 and A-5

44 RESEARCH PAPER 44
Table A-9: Annual growth of federal allocation, state tax revenues, state expenditures and state revenue effort in Nigeria, 1962-1990 (in %)
Year FA SIX SCE SCAE TSE SRE*
1962 7.7 22.4 19.5 -0.7 12.8 19.7 (18.1)**
1963 5.2 5.5 -7.8 -1.3 -5.9 22.0 1964 44.0 -6.6 12.9 12.6 12.8 18.2 1965 20.0 -15.6 16.5 -2.3 10.8 13.9 1966 -7.2 -11.4 2.8 4.6 3.3 12.0 1967 -29.3 119.7 -26.3 -20.5 -24.7 34.8 1968 -10.1 -34.8 -17.5 -52.3 -27.5 31.3 1969 64.3 12.8 65.6 75.3 67.4 21.1 1970 -22.0 -34.5 -17.9 6.3 -13.2 15.9 1971 92.3 37.9 55.1 20.5 46.7 14.9 1972 83.7 86.9 58.3 149.7 76.4 15.8 1973 2.3 8.2 40.2 84.0 52.4 59.5 1974 116.4 37.2 6.6 70.7 28.2 12.0 1975 34.5 -35.1 68.9 -4.1 36.1 5.7 1976 10.0 47.3 208.0 88.7 170.0 3.1
1977 37.6 26.7 -13.4 416.3 82.0 2.2 1978 -21.1 -8.3 -14.3 -44.8 -33.5 3.0 1979 64.8 124.0 28.4 -20.1 3.1 6.5 1980 102.0 368.2 64.6 167.1 106.0 14.8 1981 -7.3 -21.0 16.2 47.2 32.5 8.8 1982 -15.2 25.4 -4.3 14.0 -10.0 12.3 1983 -8.8 4.2 11.2 -2.0 3.8 12.4 1984 -8.0 22.5 -12.5 -58.4 -36.6 23.9 1985 14.8 -5.6 4.8 -57.3 -16.6 27.0 1986 -12.8 14.8 -7.6 9.3 -4.6 32.5 1987 118.0 7.5 28.3 125.0 47.9 23.7 1988 32.0 11.5 25.7 41.0 30.4 20.2 1989 21.0 -26.4 13.2 34.8 20.4 12.3 1990 36.5 87.6 49.1 15.9 36.8 16.9
Source: Computed by authors from data in Table A-S. Notes: See Table A-4. *SRE = state revenue efforts = state tax revenue = the ability of states to generate own revenues.

FISCAL OPERATIONS IN A DEPRESSED ECONOMY: NIGERIA, 1960-90 45
Table A-1O: Nigeria: Annual growth of federal allocation, state tax revenues and state expenditures in real terms, 1962-1990 (in %)
Year FA STX SCE SCAE TSE
1962 -8.9 3.6 1.1 -16.0 -4.5 1963 -2.2 2.1 -14.3 -8.4 -12.6 1964 34.4 -12.9 5.4 5.1 5.3 1965 12.4 -20.9 9.2 -8.4 3.8 1966 -12.7 -16.6 -3.3 -2.7 -2.8 1967 -14.2 166.8 -10.5 -2.3 -8.6 1968 -3.1 -29.8 -11.2 -48.6 -21.9 1969 18.6 -18.5 19.6 26.6 20.9 1970 -46.0 -54.7 -43.2 -26.4 -40.5 1971 56.3 12.0 25.9 -2.1 20.5 1972 78.2 81.2 53.5 142.2 71.1 1973 -36.3 -32.6 -12.8 14.5 5.1
1974 31.9 -16.4 -35.1 4.0 -21.9 1975 17.1 -43.6 47.0 16.5 18.4 1976 -12.8 16.9 144.4 49.7 114.4 1977 15.6 6.5 -27.2 333.7 52.8 1978 18.4 -5.2 -11.4 -42.9 -31.2 1979 26.5 71.9 -1.5 -38.7 -20.9 1980 62.4 276.5 32.4 114.8 65.8 1981 -73.5 126.5 233.1 321.8 279.7 1982 -21.0 16.9 -11.3 -19.9 -16.1 1983 -11.9 0.8 7.5 -5.2 0.4 1984 -16.3 11.4 -20.4 -62.2 -42.3 1985 6.0 -16.5 -7.3 -62.3 -26.2 1986 -14.3 12.8 -9.3 22.6 13.4 1987 56.6 -22.7 -7.8 61.6 6.3 1988 14.8 -3.1 9.3 22.6 13.4 1989 -6.1 -42.9 -12.1 4.7 -6.5 1990 20.2 65.3 31.4 2.1 20.5
Source: Computed by authors from Table A-8.
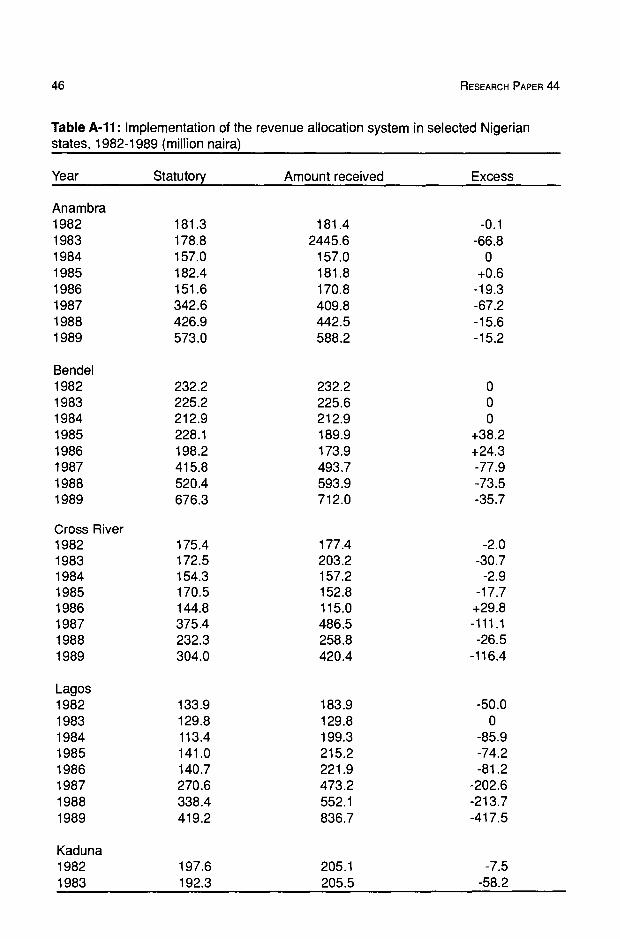
46 RESEARCFI PAPER 44
Table A-il: Implementation of the revenue allocation system in selected Nigerian states, 1982-1989 (million naira)
Year Statutory Amount received Excess
Anambra 1982 1983 1984 1985 1986 1987 1988 1989
181.3 178.8 157.0 182.4 151.6 342.6 426.9 573.0
181.4 2445.6
157.0 181.8 170.8 409.8 442.5 588.2
-0.1 -66.8
0
+0.6 -19.3 -67.2 -15.6 -15.2
Bendel 1982 1983 1984 1985 1986 1987 1988 1989
232.2 225.2 212.9 228.1 198.2 415.8 520.4 676.3
232.2 225.6 212.9 189.9 173.9 493.7 593.9 712.0
0
0
0
+38.2 +24.3 -77.9 -73.5 -35.7
Cross River 1982 1983 1984 1985 1986 1987 1988 1989
175.4 172.5 154.3 170.5 144.8 375.4 232.3 304.0
177.4 203.2 157.2 152.8 115.0 486.5 258.8 420.4
-2.0 -30.7
-2.9 -17.7 +29.8 -111.1 -26.5
-116.4
Lagos 1982 1983 1984 1985 1986 1987 1988 1989
133.9 129.8 113.4 141.0 140.7 270.6 338.4 419.2
183.9 129.8 199.3 215.2 221.9 473.2 552.1 836.7
-50.0 0
-85.9 -74.2 -81.2
-202.6 -213.7 -417.5
Kaduna 1982 1983
197.6 192.3
205.1 205.5
-7.5 -58.2

FISCAL OPERATIONS IN A DEPRESSED ECONOMY: NIGERIA, 1960-90 47
Table A-il .... continued
1984 179.9 198.8 -18.9 1985 220.7 240.6 -19.9 1986 198.1 175.2 +22.9 1987 440.6 660.9 -220.3 1988 291.2 433.3 142.1 1989 301.2 301.2 0
Kano 1982 248.0 249.6 -1.6 1983 240.2 241.8 -1.6 1984 228.2 229.9 -1.7 1985 280.8 291.3 -10.5 1986 254.6 252.5 +2.1 1987 501.8 559.3 -57.5 1988 639.4 628.2 +11.2 1989 786.1 759.9 +26.2
Ogun 1982 114.6 114.6 0 1983 111.9 111.9 0 1984 104.4 90.9 +13.5 1985 115.3 48.3 +67.0 1986 111.4 80.9 +30.5 1987 231.9 275.3 -43.4 1988 285.4 312.0 -26.6 1989 336.8 205.8 +131.0
Oyo 1982 226.7 226.7 0 1983 220.4 220.4 0 1984 198.2 202.1 -3.9 1985 239.9 316.9 -122.0 1986 214.4 255.9 -41.5 1987 437.2 471.4 -34.2 1988 572.5 552.2 +20.3 1989 701.6 716.7 -15.1
Plateau 1982 126.2 126.2 0 1983 125.9 125.9 0 1984 96.6 98.3 -1.7 1985 97.7 110.2 -12.5 1986 77.6 21.8 +55.8 1987 202.4 121.4 +81.0 1988 300.7 242.6 +58.1 1989 378.8 339.9 38.9

48 RESEARCH PAPER 44
Table A-il .... contnued
Rivers 1982 226.2 226.2 0
1983 NA NA NA 1984 202.7 206.2 -3.5 1985 208.2 220.3 -12.1 1986 171.0 185.3 -14.3 1987 384.0 489.6 -105.6 1988 490.2 473.5 +16.7 1989 618.5 646.2 -27.7
Sources: (1) Federal ministry of finance and development, (2) Central bank of Nigeria, Lagos. (3) States' ministries of finance.
Notes: 1. A minus (-) indicates that the state received more than its statutory allocation according to allocation formula; plus (+) shows that the state received less than its statutory share. 2. The allocation is based on the revenue Act of 1981 formulae.
Table A-12: Nigeria: Popu lation of states, 1982-19 86 (million)
STATE 1982 1983 1984 1985 1986
Anambra 5.7 5.9 6.0 6.2 6.7
Bauchi 3.9 4.0 4.1 4.2 4.5 Bendel 3.9 4.0 4.1 4.2 4.6 Benue 3.9 4.0 4.1 4.2 4.5 Borno 4.8 4.9 5.0 5.2 5.6 C\River 5.5 5.7 5.8 6.0 6.5 Gongola 4.2 4.3 4.4 4.5 4.9 Imo 5.9 6.0 6.2 6.3 6.9 Kaduna 6.5 6.7 6.8 7.0 7.7 Kano 9.2 9.4 9.7 10.0 10.8 Kwara 2.7 2.8 2.7 3.0 3.2 Lagos 2.6 2.7 2.8 3.4 3.8 Niger 1.9 2.0 2.1 2.1 2.0 Ogun 2.4 2.5 2.6 2.7 2.9 Ondo 4.4 4.5 4.6 4.7 5.1
Oyo 8.3 8.5 8.7 9.0 9.7 Plateau 3.2 3.3 3.4 3.5 3.8 Rivers 2.7 2.8 2.9 3.0 3.2 Sokoto 7.2 7.4 7.6 7.8 8.5
Source: Federal Office of Statistics, AnnualAbstract of Statistics, 1988, Lagos Notes: C\River is an abbreviation for Cross River State
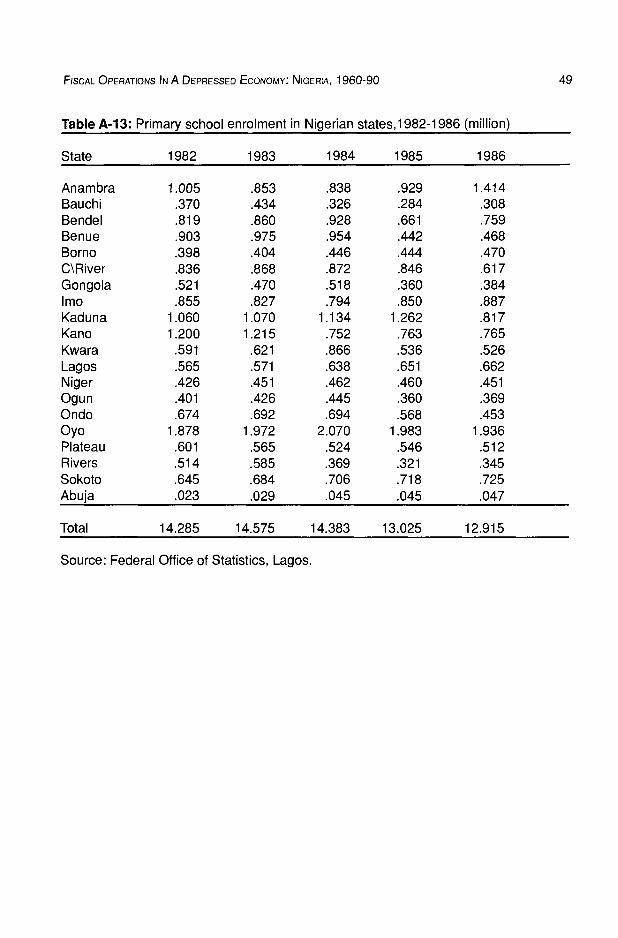
FISCAL OPERATIONS IN A DEPRESSED ECONOMY: NiGERIA, 1960-90 49
Table A-13: Primary school enrolment in Nigerian states,1982-1 986 (million)
State 1982 1983 1984 1985 1986
Anambra 1.005 .853 .838 .929 1.414 Bauchi .370 .434 .326 .284 .308 Bendel .819 .860 .928 .661 .759 Benue .903 .975 .954 .442 .468 Borno .398 .404 .446 .444 .470 C\River .836 .868 .872 .846 .617 Gongola .521 .470 .518 .360 .384 Imo .855 .827 .794 .850 .887 Kaduna 1.060 1.070 1.134 1.262 .817 Kano 1.200 1.215 .752 .763 .765 Kwara .591 .621 .866 .536 .526 Lagos .565 .571 .638 .651 .662 Niger .426 .451 .462 .460 .451
Ogun .401 .426 .445 .360 .369 Ondo .674 .692 .694 .568 .453 Oyo 1 .878 1 .972 2.070 1 .983 1 .936 Plateau .601 .565 .524 .546 .512 Rivers .514 .585 .369 .321 .345 Sokoto .645 .684 .706 .718 .725 Abuia .023 .029 .045 .045 .047
Total 14.285 14.575 14.383 13.025 12.915
Source: Federal Office of Statistics, Lagos.
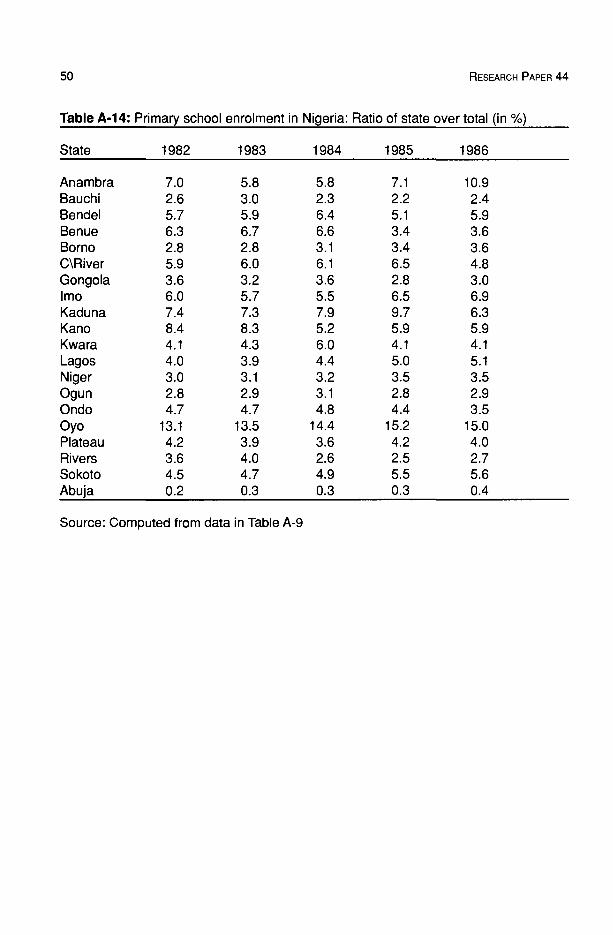
50 RESEARCH PAPER 44
Table A-14: Primary scho ol enrolment in Nigeria: Ratio of state over total (in %)
State 1982 1983 1984 1985 1986
Anambra 7.0 5.8 5.8 7.1 10.9 Bauchi 2.6 3.0 2.3 2.2 2.4 Bendel 5.7 5.9 6.4 5.1 5.9 Benue 6.3 6.7 6.6 3.4 3.6 Borno 2.8 2.8 3.1 3.4 3.6 C\River 5.9 6.0 6.1 6.5 4.8 Gongola 3.6 3.2 3.6 2.8 3.0 Imo 6.0 5.7 5.5 6.5 6.9 Kaduna 7.4 7.3 7.9 9.7 6.3 Kano 8.4 8.3 5.2 5.9 5.9 Kwara 4.1 4.3 6.0 4.1 4.1
Lagos 4.0 3.9 4.4 5.0 5.1
Niger 3.0 3.1 3.2 3.5 3.5 Ogun 2.8 2.9 3.1 2.8 2.9 Ondo 4.7 4.7 4.8 4.4 3.5 Oyo 13.1 13.5 14.4 15.2 15.0 Plateau 4.2 3.9 3.6 4.2 4.0 Rivers 3.6 4.0 2.6 2.5 2.7 Sokoto 4.5 4.7 4.9 5.5 5.6 Abuja 0.2 0.3 0.3 0.3 0.4
Source: Computed from data in Table A-9

FISCAL OPERATIONS IN A DEPRESSED ECONOMY: NIGERIA, 1960-90 51
Lagos 1980 143.4 1981 129.7 1982 133.9 1983 129.8
Table A-15: Fiscal operations of selected states in Nigeria, 1980-1990 (million naira)
Year FA RX CE CAPE TE RE1 RE2
Anambra 1980 225.1 1981 199.3 1982 181.3 1983 178.8 1984 157.0 1985 182.4 1986 151.5 1987 342.6 1988 426.9 1989 573.0 1990 725.8
Bendel 1980 372.0 1981 309.0 1982 232.2 1983 225.6 1984 212.9 1985 228.1 1986 198.2 1987 415.8 1988 520.4 1989 676.3 1990 821.2
Cross River 1980 227.4 1981 198.0 1982 175.4 1983 172.5 1984 154.3 1985 170.5 1986 144.8 1987 375.4 1988 232.3 1989 304.8 1990 493.8
38.4 256.2 178.6 64.3 337.5 438.1
281.8 412.3 476.0 167.4 442.9 347.2 106.0 2800 170.0 87.6 290.3 85.5
117.7 309.5 87.0 130.4 411.1 153.0 130.0 431.6 212.0 41.3 567.0 211.3
186.4 698.4 210.7
50.0 244.3 206.8 32.4 358.7 626.1 44.4 365.1 416.7 53.6 419.2 330.6
149.6 365.5 102.6 162.7 396.7 67.1 120.9 333.2 59.4 118.4 406.2 93.7 190.4 155.9 645.3
93.1 521.0 342.4 152.9 723.5 399.0
22.6 273.2 60.6 27.5 330.7 325.2 40.8 256.6 250.3 54.8 276.1 289.8 61.6 227.1 83.3 64.2 288.1 16.7 55.5 260.0 15.9 43.0 253.3 88.5 21.0 137.4 90.5 32.0 1340 133.2 43.1 244.5 83.1
43.6 344.6 160.5 365.2 369.1 386.4 399.4 415.5 272.0 417.7 446.4 564.4
434.8 775.6 888.3 770.1 450.0 375.8 396.5 564.1 643.6 778.3 909.1
451.1 984.8 781.8 749.8 468.1 463.8 392.6 499.9 38.9
863.4 1111.5
520.8 655.9 506.9 565.9 310.3 304.8 275.9 341.8 227.9 267.2 327.6
505.1 755.5 687.5
1010.8
14.9 19.1
68.3 37.8 37.8 30.2 38.0 31.7 30.1
7.3 26.7
20.5 9.0
12.1
12.8 40.9 41.0 36.3 29.1 29.5 17.9 21.1
8.3 8.3
15.9 19.8 27.1 22.3 21.3 17.0 15.3 23.9 17.6
125.5 98.9 96.1 93.6
8.8 8.3
31.7 21.7 23.6 23.3 29.7 23.1 20.2 5.3
20.5
11.1
3.3 5.6 7.1
32.0 35.1 30.8 23.7
10.8 13.8
4.3 4.2 8.0 9.7
19.9 21.1 20.1 12.6 9.2
12.0 13.2
85.6 48.3 58.1 41.3

52 RESEARCH PAPER 44
Table A-15 .... continued
1984 113.4 1985 141.0 1986 140.7 1987 270.6 1988 338.4 1989 419.2 1990 533.0
296.3 475.2 659.2 1134.4 412.7 423.1 168.8 691.9 458.2 351 .8 234.2 586.0 466.6 410.4 551.2 961.6 464.7 47.3 412.6 859.9 593.1 457.6 615.2 1072.8 729.9 868.7 878.5 1742.2
62.3 26.1 78.9 59.6
130.2 78.2 113.7 48.5 103.9 54.0 129.6 55.3 84.0 41.8
Kaduna 1980 234.7 1981 221.1 1982 197.6 1983 192.3 1984 179.9 1985 220.7 1986 198.1 1987 440.6 1988 291.2 1989 301.2 1990 526.7
65.8 245.1 270.4 515.5 37.4 254.4 386.1 640.5 45.6 274.3 373.8 648.1 60.0 320.9 354.0 674.9 85.4 273.8 188.6 462.4 77.5 240.3 76.2 316.5 61.4 227.8 54.6 282.4
132.7 219.0 124.0 343.0 72.8 79.3 142.6 221.8
129.6 302.5 258.4 560.9 189.1 858.8 138.4 497.2
26.8 12.8 14.7 5.8 16.6 7.0 18.7 8.9 31.2 18.5 32.3 24.5 27.0 21.7 60.6 38.7 91 .8 32.8 42.8 23.1 52.7 38.0
Kano 1980 282.2 1981 260.1 1982 248.0 1983 240.2 1984 228.2 1985 280.8 1986 254.6 1987 501.8 1988 639.4 1989 786.1 1990 923.0
66.5 222.9 244.6 467.5 50.3 280.9 450.6 731 .5 38.1 263.7 376.0 639.7 52.4 313.7 276.9 590.6 92.4 258.7 15.6 374.3 73.2 245.0 118.7 363.7 92.3 261 .7 87.3 349.0
104.0 382.6 189.7 572.3 96.1 530.7 227.0 757.7 48.8 538.7 378.7 917.4
144.8 765.7 272.8 1038.5
29.8 14.2 17.9 6.9 14.4 8.9 16.7 8.9 35.7 24.7 29.9 20.1 35.3 26.4 27.2 18.2 18.1 12.7
9.1 5.3 18.9 13.9
Ogun 1980 141.6 1981 135.9 1982 114.6 1983 111.9 1984 104.4 1985 115.3 1986 111.4 1987 231.9 1988 285.4 1989 336.8 1990 512.2
23.9 124.1 251.5 375.6 50.1 193.5 210.6 404.1 32.0 158.6 181.7 340.3 47.2 203.0 217.4 420.4
135.0 253.4 58.9 312.3 55.0 208.8 28.5 237.3 64.7 163.6 43.0 206.6 77.0 181.0 84.5 265.5 79.1 223.4 127.3 350.7 28.1 286.1 235.5 521.6 28.0 364.4 210.8 575.2
19.3 6.4 25.9 12.4 20.2 9.4 23.2 11.2 53.3 43.2 26.3 23.2 39.5 31.3 42.5 29.0 35.4 22.5 9.8 5.4 7.7 4.9

FISCAL OPERATIONS IN A DEPRESSED ECONOMY: NIGERIA, 1960-90 53
Table A-15 .... continued
Oyo 1980 278.6 78.5 236.2 187.7 423.9 33.2 18.5 1981 248.2 41.8 300.2 379.1 679.3 13.9 6.2 1982 246.7 61.5 351.1 420.4 771.5 17.5 8.0
1983 220.4 37.3 425.4 396.2 819.7 13.5 7.0
1984 198.2 201.4 378.2 99.9 478.1 53.3 42.1 1985 239.9 141.0 422.3 80.6 502.9 33.4 28.0 1986 214.4 194.1 402.3 58.9 461.2 48.2 42.1 1987 437.2 234.2 440.8 234.3 675.1 53.1 34.7 1988 572.5 280.5 595.5 361.3 956.8 47.1 29.3 1989 701.6 125.3 714.0 240.3 954.3 17.5 13.1
1990 836.0 401.9 823.7 528.3 1352.0 48.7 29.2
Plateau 1980 162.8 83.4 215.1 380.4 595.5 38.8 14.0 1981 161.7 35.5 237.6 342.4 580.0 14.9 6.1
1982 126.2 31.9 250.1 355.5 605.6 12.8 5.3 1983 125.9 25.1 246.0 333.0 579.0 10.2 4.3 1984 96.6 36.7 147.4 16.4 163.8 24.9 22.4 1985 97.7 28.2 186.0 5.4 191.4 15.2 14.7 1986 77.6 39.4 193.4 5.4 198.8 20.4 19.8 1987 292.4 27.8 302.7 8.5 311.2 9.2 8.9 1988 300.7 35.3 341.6 55.1 396.7 10.3 8.9 1989 378.8 11.6 405.7 52.4 458.1 2.9 2.5 1990 538.9 56.4 373.6 98.7 472.3 15.1 11.9
Rivers 1980 346.0 45.4 373.3 178.6 551.9 12.2 8.2 1981 300.7 53.2 333.9 533.6 867.5 15.9 6.1 1982 262.2 - - - - - -
1983 - - - - - - -
1984 202.7 87.3 286.9 77.0 363.9 30.4 24.0 1985 208.2 77.6 322.1 44.8 366.9 24.1 21.2 1986 171.0 80.9 282.4 41.2 323.6 28.6 25.0 1987 284.0 67.3 08.7 37.0 345.7 21.8 19.5 1988 490.2 94.3 397.8 249.4 647.2 23.7 14.6 1989 618.5 26.3 476.8 195.7 672.5 5.5 3.9 1990 725.1 185.1 647.9 344.9 992.8 28.6 18.6
Source: (1) Files of the Federal Ministry of Finance and Development, Lagos. (2) State Ministries of Finance. (3) Central Bank of Nigeria, Lagos.
Notes: FA = Federal allocation; RX = State tax revenues; RE1 = Ratio of state revenue to current expenditure (revenue efforts); RE2 = Ratio of state revenue to total expenditure (current + capital); CE Current expenditures; CAPE = Capital expenditure; TE = Total expenditure

Appendix B
Figure B-i: Federal allocation to regions and tax revenues of regions, 1961 -1966 (N million)
150
0
E
z
1961 1962 1963 1964 1965 1966
Figure B-2: Tax revenues and current expenditures of regions, 1961 -1 966
Federal allocation
Tax revenues
100
1 Year
C 0
E
z
1961 1962 1963 1964 1965 1966
Year

FISCAL OPERATIONS IN A DEPRESSEL ECONOMY: NIGERIA, 1960-90 55
Figure B-3: Federal allocation to states and tax revenues of states, 1967-1978 (N million)
2000
Federal allocation
Tax revenues
1500
0
Z N N
• N N
500
0
1967 1969 1971 1973 1975 1977
Year
Figure B-4: Tax revenues and current expenditures to states, 1967-1978 (N million)
3 OOC
Revenues 2500 I Current expenditure
/ 2000
0
1500
z 1000
500
0 1967 1969 1971 1973 1975 1977
Year

56 RESEARCH PAPER 44
Figure B-5: Federal allocation to states and tax revenues of states, 1979-1989 (N million)
12000
LI Federal allocation 10000
Tax revenues
8000 0
6000
Cs
Z 4000
200:_____ 1979 - 1981 1983 1985 1987 - 1989
Year (provisional)
Figure B-6: Tax revenues and current expenditures of states, 1979-1989 (N- million)
10000
Revenues
1979 1981 1983 1985 1987 1989
Year

P.O. BOX 62882 NAIROBI, KENYA
TELEPHONE (254-2) 228057 225234 215898 212359
332438 225087
TELEX 22480
FAX (254-2) 219308
E-MAIL [email protected]
AFRICAN ECONOMIC RESEARCH CONSORTIUM
The principal objective of the African Economic Research Consortium (AERC), established in August 1988, is to strengthen local capacity for conducting independent, rigorous inquiry into problems pertinent to the management of economies in Sub-Saharan Africa.
In response to special needs of the region, AERC has adopted a flexible approach to improve the technical skills of local researchers, allow for regional determination of research priorities, strengthen national institutions concerned with economic policy research, and facilitate closer ties between researchers and policy makers.
Since its establishment, AERC has been supported by private foundations, bilateral aid agencies and international organizations.
SPECIAL PAPERS contain the findings of commissioned studies in furtherance of AERC's programmes for research, training and capacity building.
RESEARCH PAPERS contain the edited and externally reviewed results of research financed by the AERC.
It is AERCs policy that authors of Special and Research Papers are free to use material contained therein in other publications. Views expressed in the Special and Research Papers are those of the authors alone and should not be attributed to the AERC's sponsoring Members, Advisory Committee, or Secretariat.
Further information concerning the AERC and additional copies of Special and Research Papers can be obtained by writing to: African Economic Research Consortium, P.O. Box 62882, Nairobi, Kenya.
ISBN 9966-900-63-2