Fiscal impact analysis of three development scenarios in Nashville ...
24
1 Fiscal impact analysis of three development scenarios in Nashville-Davidson County, TN April 2013 Prepared by
Transcript of Fiscal impact analysis of three development scenarios in Nashville ...

1
Fiscal impact analysis of three development scenarios in Nashville-Davidson County, TN
April 2013
Prepared by

2
SUMMARY BY SMART GROWTH AMERICA
Summary This study examines the relative fiscal costs and benefits of three development scenarios in Nashville-Davidson County, TN: an infill development project, a New Urbanist-style development project in a suburban location and a conventional suburban development in a suburban location. The first scenario is The Gulch, a 76-acre infill project on a brownfield location including 4,500 housing units and 6 million square feet of retail and office space. The second scenario is Lenox Village, a 185-acre New Urbanist-style development in a greenfield location with 1,700 residential unit and 67,000 square feet of retail and office space. And the third scenario is Bradford Hills, a 185-acre conventional suburban development with 538 housing units and 39,000 square feet of retail and office space. Nashville-Davidson County is a combined city-county government and therefore has jurisdiction over both the most urban parts of Nashville and the most rural parts of Davidson County. Smart Growth America hired Strategic Economics to calculate the net general fund impact of providing services on the residential component of each project. (Upfront infrastructure cost was not included in the analysis.) Conclusions included the following:
• Infill development had lower service costs. On a per-unit basis, Lenox Village had the lowest cost to provide services: $1,300 per unit per year. The Gulch cost $1,400 per unit per year. Bradford Hills had the highest cost of $1,600 per unit per year. Lenox Village and The Gulch cost 19 percent less and 13 percent less, respectively.
• Infill development generated the most revenue per unit. All three scenarios generated
a revenue to the general fund, on a per-unit basis. The Gulch had by far the largest revenue, generating $3,370 per unit. That rate is more than twice as high as the Bradford Hills scenario, which generated $1,620 in revenue per unit. Lenox Village generated $1,340 in revenue per unit. (Revenue included property tax but also the sales tax likely to be generated by the project’s residents as well as other miscellaneous taxes.)
• Infill development generated the largest surplus. On a per-acre basis, The Gulch
generated $115,720 in net revenue - almost 1,150 times the net revenue generated by Bradford Hills ($100) and 148 times the net revenue of Lenox Village ($780). The Lenox Village project generated a surplus 7.8 times higher than that of Bradford Hills on a per-acre basis. These trends are similar on a per-unit basis as well.

3
ANALYSIS BY STRATEGIC ECONOMICS
Fiscal impact analysis Strategic Economics was hired by Smart Growth America to prepare a fiscal impact analysis considering key operation and maintenance (general fund) categories for Nashville-Davidson County, Tennessee. The fiscal impact analysis compares revenues and costs between two “smart growth” developments with an equivalent “sprawl” development. This memorandum presents the findings from the fiscal impact analysis. The following section provides background information on fiscal impact analysis. The subsequent sections describe the development scenarios and results for the Nashville analysis.
Background Typically, the purpose of a fiscal impact analysis is to help a city make decisions about specific development proposals or plans. The analysis presented in this memorandum is intended to provide more general information about the potential for different development patterns to impact a city’s fiscal outlook. In order to ground the results in reality the analysis presented here is based on existing and proposed developments and on the fiscal factors of Nashville-Davidson County, Tennessee. For all scenarios included in the analysis, Strategic Economics estimated the annual General Fund operations and maintenance (O&M) costs and primary sources of local revenues (property taxes, sales taxes, and other recurring revenues) that could be generated by the existing/completed communities or a build-out scenario of planned communities. It is important to note that the analysis focuses on impacts to the Nashville-Davidson Metropolitan Government’s General Fund and not on other programs and services that are funded independently of the General Fund. Therefore, the analysis does not consider impacts to the provision of services provided outside of the General Fund or by other service providers, such as schools and utilities. As with all fiscal impact analyses, the assumptions drive the results. Strategic Economics created its assumptions based upon all available data, input from city staff, review of market data, and appropriate standards.

4
Nashville-Davidson fiscal impact analysis This section presents the development scenarios and results of the fiscal impact analysis for Nashville-Davidson County, Tennessee. The methodology and assumptions for the Nashville-Davidson analysis are included in an appendix to this memorandum. The Nashville-Davidson fiscal impact analysis case study considered three development scenarios, as described in the following sections.
1. Bradford Hills Bradford Hills is a primarily residential neighborhood located in southern Nashville-Davidson County, Tennessee. It is just west of Lenox Village, which is another development scenario used in the analysis and described in the following section. Bradford Hills was built out in the early 1990s and includes a total of 538 single-family detached homes and 39,000 square feet of nonresidential space on 185 acres. Figure 1 shows the existing number of residential units and commercial square feet for Bradford Hills, and Figure 2 provides an aerial photograph of the neighborhood. FIGURE 1
Land Uses, Bradford Hills
Land Use Type Units / Square Feet
Residential
Single Family Detached 538
Total Residential Units 538
Nonresidential
Retail 17,835
Office 21,280
Total Nonresidential Square Feet 39,115
Source: Metropolitan Nashville Planning Department, 2012

5
FIGURE 2
Aerial photograph, Bradford Hills
Source: Metropolitan Nashville Planning Department, 2012.

6
2. Lenox Village Lenox Village is a greenfield traditional neighborhood development (TND) located in southern Nashville-Davidson County, Tennessee, east of Bradford Hills, which is described above. Lenox Village is partially built out at this time. The master plan for Lenox Village includes 572 single-family detached units, 245 single-family attached units, and 898 multi-family units, as well as 67,000 square feet of nonresidential uses. Figure 3 shows the total number of residential units and commercial square feet planned for Lenox Village, and Figure 4 provides an aerial photograph of the TND. FIGURE 3
Land Uses, Lenox Village
Land Use Type Units / Square Feet
Residential
Single Family Detached 572
Single Family Attached 245
Multi-family 898
Total Residential Units 1,715
Nonresidential
Retail 27,409
Office 4,000
Mixed Use 35,742
Total Nonresidential Square Feet 67,151
Source: Metropolitan Nashville Planning Department, 2012; Regent Homes, 2012.

7
FIGURE 4
Aerial photograph, Lenox Village
Source: Metropolitan Nashville Planning Department, 2012.
8
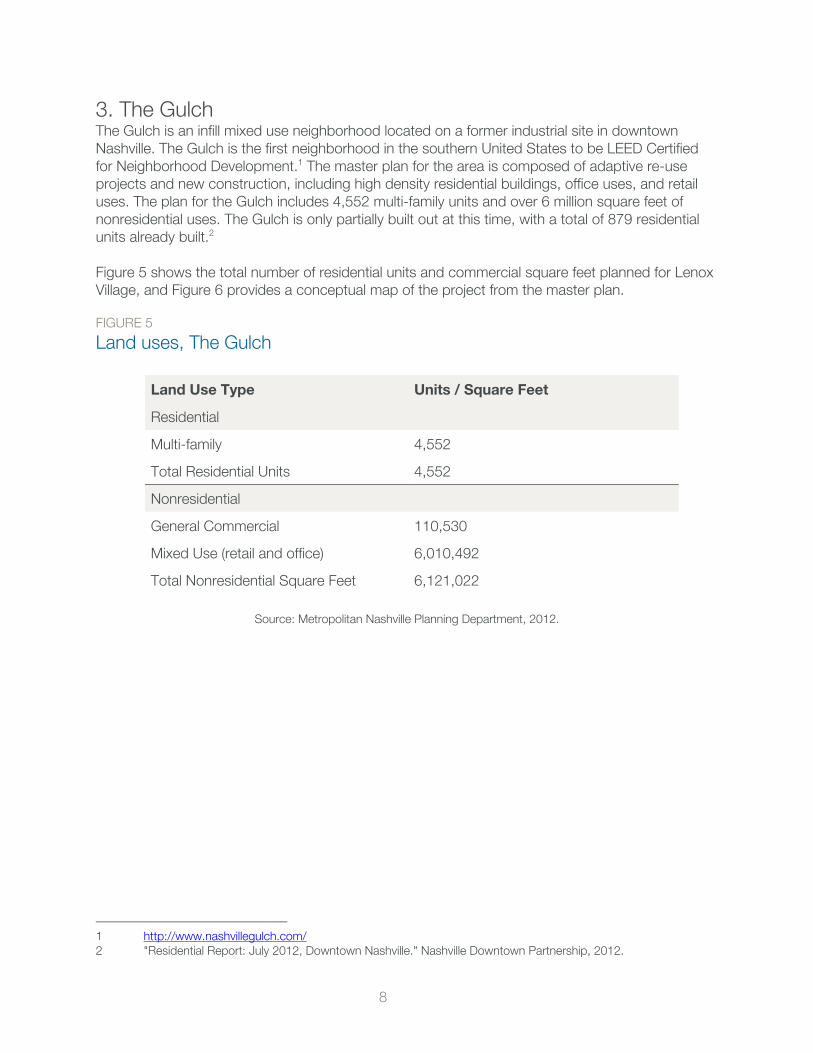
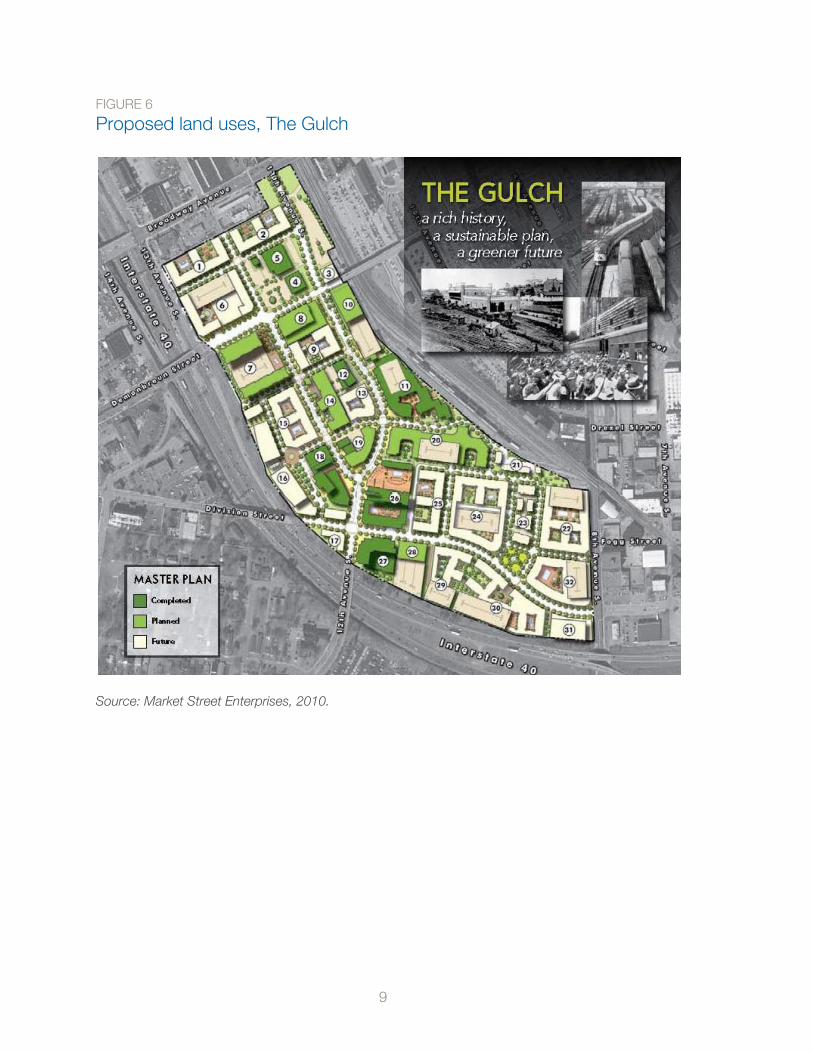
3. The Gulch The Gulch is an infill mixed use neighborhood located on a former industrial site in downtown Nashville. The Gulch is the first neighborhood in the southern United States to be LEED Certified for Neighborhood Development.1 The master plan for the area is composed of adaptive re-use projects and new construction, including high density residential buildings, office uses, and retail uses. The plan for the Gulch includes 4,552 multi-family units and over 6 million square feet of nonresidential uses. The Gulch is only partially built out at this time, with a total of 879 residential units already built.2 Figure 5 shows the total number of residential units and commercial square feet planned for Lenox Village, and Figure 6 provides a conceptual map of the project from the master plan. FIGURE 5
Land uses, The Gulch
Land Use Type Units / Square Feet
Residential
Multi-family 4,552
Total Residential Units 4,552
Nonresidential
General Commercial 110,530
Mixed Use (retail and office) 6,010,492
Total Nonresidential Square Feet 6,121,022
Source: Metropolitan Nashville Planning Department, 2012.
1 http://www.nashvillegulch.com/ 2 "Residential Report: July 2012, Downtown Nashville." Nashville Downtown Partnership, 2012.
9
FIGURE 6
Proposed land uses, The Gulch
Source: Market Street Enterprises, 2010.

10
Results Figure 7 shows the estimated net General Fund impact of the three development scenarios. In considering the results of the analysis it should be noted that Nashville-Davidson County has a tiered property tax rate and tiered service level depending on location. The General Services District (GSD) encompasses the entire County and pays a base tax rate. The Urban Services District (USD) was originally bound by the Nashville city limits when the Metropolitan Government was established, but has since been expanded by annexation. The USD has an additional tax rate and an “enhanced” level of service for some services. The Gulch development is the only one of the three scenarios that falls within the USD and therefore pays the higher property tax rate and receives additional services. In addition to the higher USD property tax rate, The Gulch has established the Gulch Central Business Improvement District (GCBID), with a special assessment of $0.20 per $100 in assessed value to provide a further enhanced level of services to “help make the Gulch a clean, safe and vibrant urban neighborhood in which to work, live, shop and be entertained.”3 The costs for services and revenues associated with the GCBID special assessment are not included in this analysis because they are not included in the General Fund.
• Both Lenox Village and The Gulch are expected to have a positive net impact on the Nashville-Davidson Metropolitan General Fund. The fiscal impact analysis indicates that at full buildout, The Gulch development could have a significantly positive impact and potentially generate $8.8 million a year more in General Fund revenues than in expenditures. At full buildout, Lenox Village is projected to have a slightly positive net impact (6%) on the General Fund. Bradford Hills is estimated to have a neutral impact (2%) on the General Fund.4
• On a per acre basis, The Gulch and Lenox Village developments are both estimated to have a significantly larger positive impact on the General Fund than Bradford Hills. On average, The Gulch development is expected to have a net positive impact of $116,000 per acre and Lenox Village is expected to have a net positive impact of $780 per acre, compared to $100 per acre for Bradford Hills. The Gulch’s greater positive impact reflects the fact that while new development in the downtown is more expensive to serve on a per-acre basis than Bradford Hills or even Lenox Village, these expenditures are outweighed by the higher per-acre revenues associated with the much higher density development.
3 Metropolitan Nashville / Davidson County FY 2013 Operating Budget, p. J – 96 4 Net revenue between +5 and -5% of total revenue is considered a neutral fiscal impact.

11
FIGURE 7
Net general fund impact of development scenarios
Bradford Hills Lenox Village The Gulch
Housing Units 538 1,715 4,552
Acreage 185 185 76
Revenue
Property Tax-GSD $555,000 $1,473,000 $10,432,000
Property Tax-USD $0 $0 $2,714,000
Sales Tax $33,000 $106,000 $281,000
Other Recurring Revenues-GSD $286,000 $723,000 $1,778,000
Other Recurring Revenues-USD $0 $0 $151,000
Subtotal $874,000 $2,302,000 $15,356,000
Per Housing Unit $1,620 $1,340 $3,370
Per Acre $4,720 $12,440 $202,050
Costs
Per Capita Expenditures-GSD $855,000 $2,158,000 $5,394,000
Per Capita Expenditures-USD $0 $0 $1,167,000
Subtotal $855,000 $2,158,000 $6,561,000
Per Housing Unit $1,590 $1,260 $1,440
Per Acre $4,620 $11,660 $86,330
Net Revenue $19,000 $144,000 $8,795,000
Per Housing Unit $30 $80 $1,930
Per Acre $100 $780 $115,720
Net Revenue as % of total Revenue
2% 6% 57%
Notes: Net revenue between +5 and -5% of total revenue is considered a neutral fiscal impact. Columns may not add due to rounding. Source: Strategic Economics, 2012.

12
Appendix: Assumptions and methodology
General assumptions Ongoing operations, maintenance, and service costs: The analysis evaluates the costs associated with providing ongoing city services such as police, fire, and operations and maintenance of infrastructure under the three development scenarios. The analysis does not assess the costs of capital improvements (i.e., new infrastructure and facilities) required to support development. Static analysis of full development build-out: The analysis is “static,” as opposed to “dynamic.” It analyzes the annual fiscal impacts upon completion of development, rather than providing year-by-year estimates during construction. General Fund impact: This analysis estimates potential impacts to the city’s General Fund. The Nashville-Davidson Metropolitan Government pays for many of its departmental activities through fees for service or other sources that do not go through the General Fund. For example, school services are included in the Metropolitan Government’s budget, but the expenditures are not paid for from the General Fund. Therefore the costs for providing school services and that portion of property tax revenues that are used to fund the services are not included in this analysis. 2012 dollars: The analysis is derived from the adopted budget for fiscal year (FY) 2012/13, and all outputs are reported in 2012 dollars. General Services District (GSD) and Urban Services District (USD): The Nashville-Davidson Metropolitan Government has a tiered property tax rate and tiered service level depending on location. The General Services District (GSD) encompasses the entire County and pays a base tax rate. The Urban Services District (USD) was originally bound by the Nashville city limits at the time of establishment of the USD, but has since been expanded by annexation. The USD has an additional tax rate and an “enhanced” level of service for some services. The Gulch development is the only one of the three scenarios that falls within the USD and therefore pays the higher property tax rate and receives additional services. Existing service population: To calculate certain costs and revenues on a per capita basis, an existing service population – or “daytime population” of residents and workers – must be established. For the purposes of this analysis, the residential population of the USD is included as 427,138, and the residential population of the GSD is included as a total of 626,681 (including the 427,138 in the USD), based on United States Census data provided by the Nashville Area Metropolitan Planning Organization. Employment within the USD is included as 456,810, and the total employment within the GSD is included as 631,938 (including the employment within the USD), again based on United States Census data provided by the Nashville Area Metropolitan Planning Organization. Employee factor: Each worker is counted as producing 0.50 of the impacts of a resident for analytical purposes, since workers spend no more than half the time of a resident in the city, and are assumed to require fewer services in general (library, parks, etc.). This falls within industry-standard practices of counting employees as 0.25 to 0.5 of a resident for service needs.

13
Figure A1 shows the existing service population for the GSD and the USD. FIGURE A1
Current Nashville-Davidson service population
Source: Census 2010 SF1 data for Blocks as modified by the Nashville Area MPO; InfoUSA (2012) as modified by the Nashville Area MPO; data provided by Nashville MPO.
Key land use assumptions Figure A2, below, shows the key land use assumptions used to create the model. These land use assumptions were derived as follows: Number of residential units and commercial square feet: These are drawn from the three development scenarios, as shown in the report’s Figures 1, 3 and 5. FIGURE A2 Key land use assumptions
Source: Colliers, 2012; Cassidy Turley, 2012; Nashville Downtown Partnership, 2012; Trulia, 2012; Strategic Economics, 2012.
Value per unit/per square foot:
• Commercial development: The value of commercial space ($253/square foot in The Gulch, $198/square foot in Lenox Village, and $165/square foot Bradford Hills) was estimated

14
using the income capitalization approach. In this approach to property valuation, a building’s anticipated operating expenses are removed from anticipated operating revenues to derive net operating income; this net operating income is then divided by a “capitalization rate,” which is the ratio of net operating income to the property sale value expected in the general real estate market. This calculation is shown in Figure A3. Strategic Economics estimated average commercial rental rates at about $1.92 per square foot for The Gulch, $1.50 per square foot for Lenox Village, and $1.25 per square foot for Bradford Hills, triple net5, based on local market reports for the Nashville area.
• Residential units: Estimated market values for residential units were based on recent sales in Bradford Hills, Lenox Village, and The Gulch. The pricing assumptions derived from the data are shown in Figure A4.
FIGURE A3 Pricing assumptions for commercial space
Source: Colliers, 2012; Cassidy Turley, 2012; Strategic Economics, 2012. FIGURE A4 Pricing assumptions for residential units
Source: Nashville Downtown Partnership, 2012; Trulia, 2012; Strategic Economics, 2012.
5 In a triple net lease, the tenant is responsible for a proportionate share of a building’s property taxes, property
insurance, and common area operating and utility expenses in addition to insurance, utility, cleaning and other costs associated with their own tenancy

15
Jobs and population estimates Many of the costs and revenues in the fiscal analysis were calculated based on the net increase in population and jobs resulting from build-out of the three development scenarios. In order to derive population and job estimates from the housing unit and square footage estimates of the potential development scenarios, Strategic Economics applied the following assumptions (summarized in Figure A5): Single-family attached or detached household size: 2.52 persons per household, the current average household size for owner-occupied, detached or attached single-family units in Nashville, as reported by the 2011 American Community Survey.6 Multi-family: 1.55 persons per household, the current average household size for owner-occupied units in buildings with 5 or more units in the Nashville, as reported by the 2011 American Community Survey. Jobs per square foot: 500 square feet per employee. The total assumed resident and employee population for each development scenario, based on the residential household sizes and employment densities described above, are shown in Figure A6. FIGURE A5 Service population assumptions
Source: U.S. Census Bureau, 2011 American Community Survey; Strategic Economics, 2012.
6 U.S. Census Bureau, 2011 American Community Survey 1-Year Estimates.

16
FIGURE A6 Estimated new service population associated with development scenarios
Source: Strategic Economics, 2012.
Estimating revenues This section summarizes assumptions for property tax, sales tax, and other recurring General Fund revenues. Property tax Assessed value: According to the Davidson County Assessor of Property, property taxes in Tennessee are calculated using an assessment ratio applied to the appraised, or market value for properties.7 To calculate assessed values, Strategic Economics used the market values shown in Figures A3 and A4 as the appraised values and then applied the appropriate assessment ratio. Figure A7 shows the total estimated appraised value for each land use alternative, by land use type. These values were based on units and square feet included in the development scenarios, multiplied by the per-square-foot and per-unit assumptions shown above in Figures A3 and A4. Figure A8 shows the total estimated assessed value for each land use alternative, by land use type. These values were based on the appraised values included in Figure A7, multiplied by the appropriate assessment ratio.
7 Davidson County Assessor of Property, http://www.padctn.com/estimatetaxes.htm#Tax_Calculator_Tool.

17
FIGURE A7 Appraised (market) property values of development scenarios, 2012 dollars
Sources: Strategic Economics, 2012. FIGURE A8 Assessed property values of development scenarios, 2012 dollars
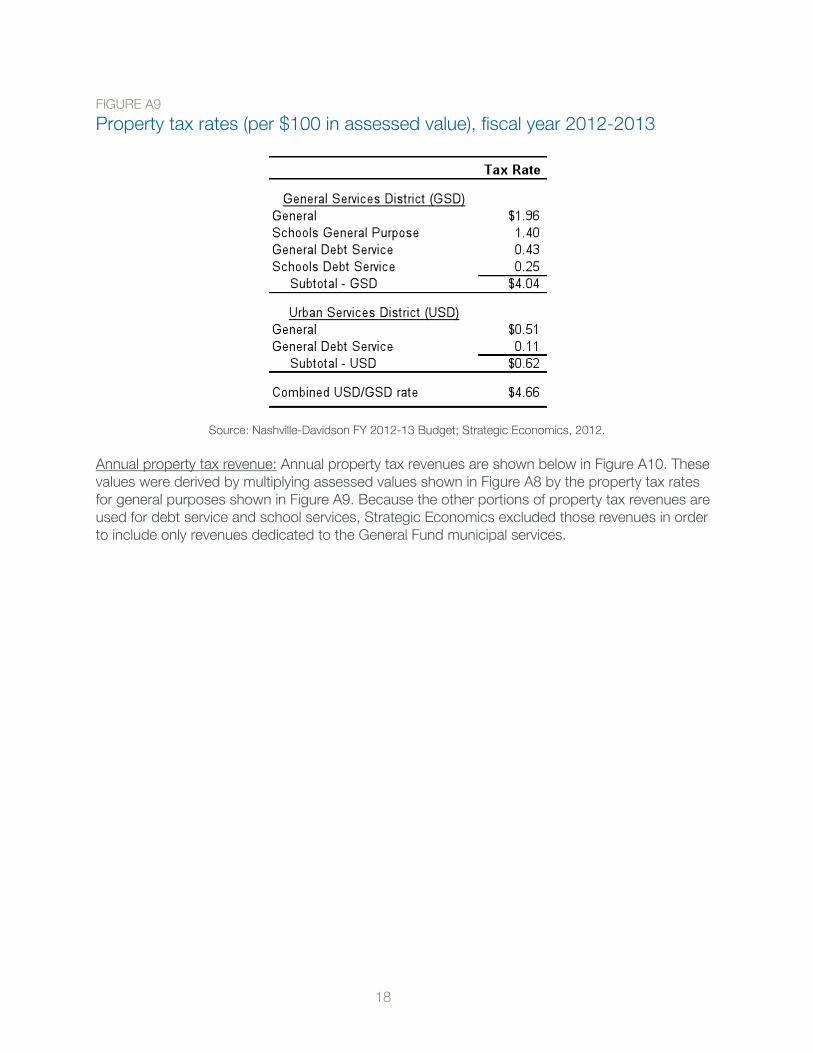
Sources: Davidson County Assessor of Property, 2012; Strategic Economics, 2012. Property tax rate: The Nashville-Davidson Metropolitan Government (Metro) has a tiered property tax rate and tiered service level depending on location. The GSD encompasses the entire Metro area and pays a base tax rate. As shown in Figure A9 the total property tax rate in the GSD is $4.04, which includes a portion for school operation and debt service. The portion of the GSD tax rate dedicated to general purposes is $1.96. The additional tax rate for the USD totals $0.62, for a total combined tax rate within the USD of $4.66. The portion of the USD tax rate dedicated to general purposes is $0.51.
18
FIGURE A9 Property tax rates (per $100 in assessed value), fiscal year 2012-2013
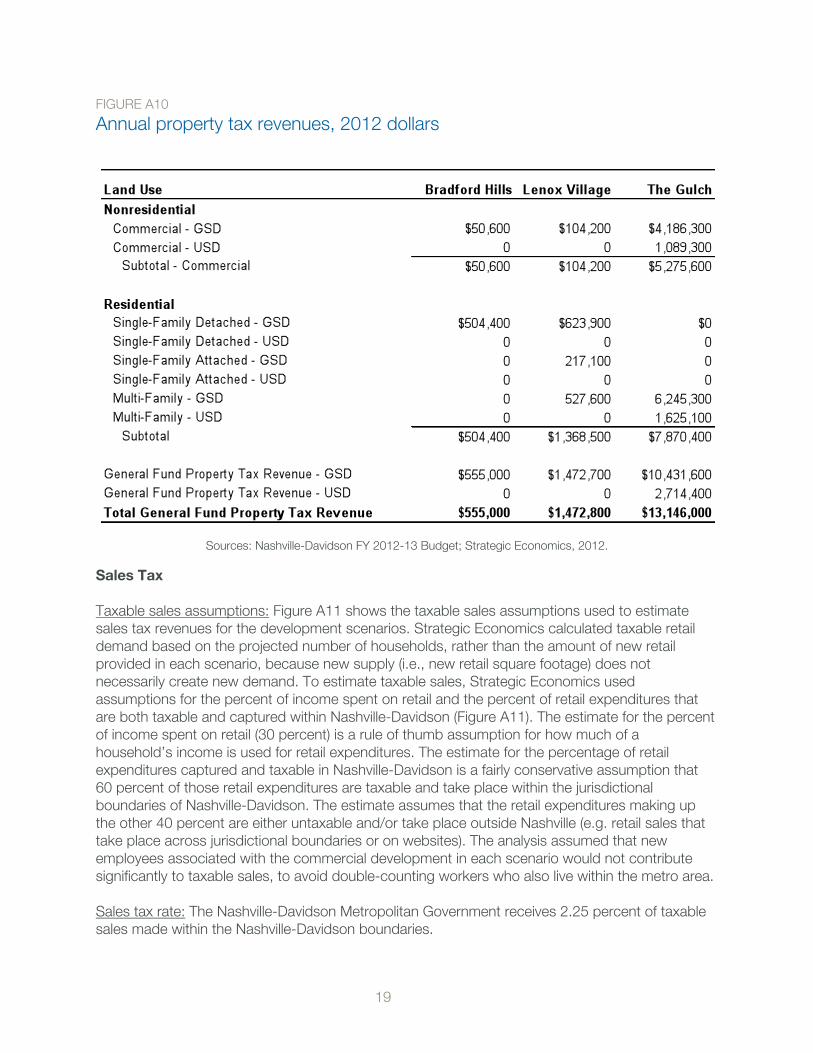
Source: Nashville-Davidson FY 2012-13 Budget; Strategic Economics, 2012. Annual property tax revenue: Annual property tax revenues are shown below in Figure A10. These values were derived by multiplying assessed values shown in Figure A8 by the property tax rates for general purposes shown in Figure A9. Because the other portions of property tax revenues are used for debt service and school services, Strategic Economics excluded those revenues in order to include only revenues dedicated to the General Fund municipal services.
19
FIGURE A10 Annual property tax revenues, 2012 dollars
Sources: Nashville-Davidson FY 2012-13 Budget; Strategic Economics, 2012.
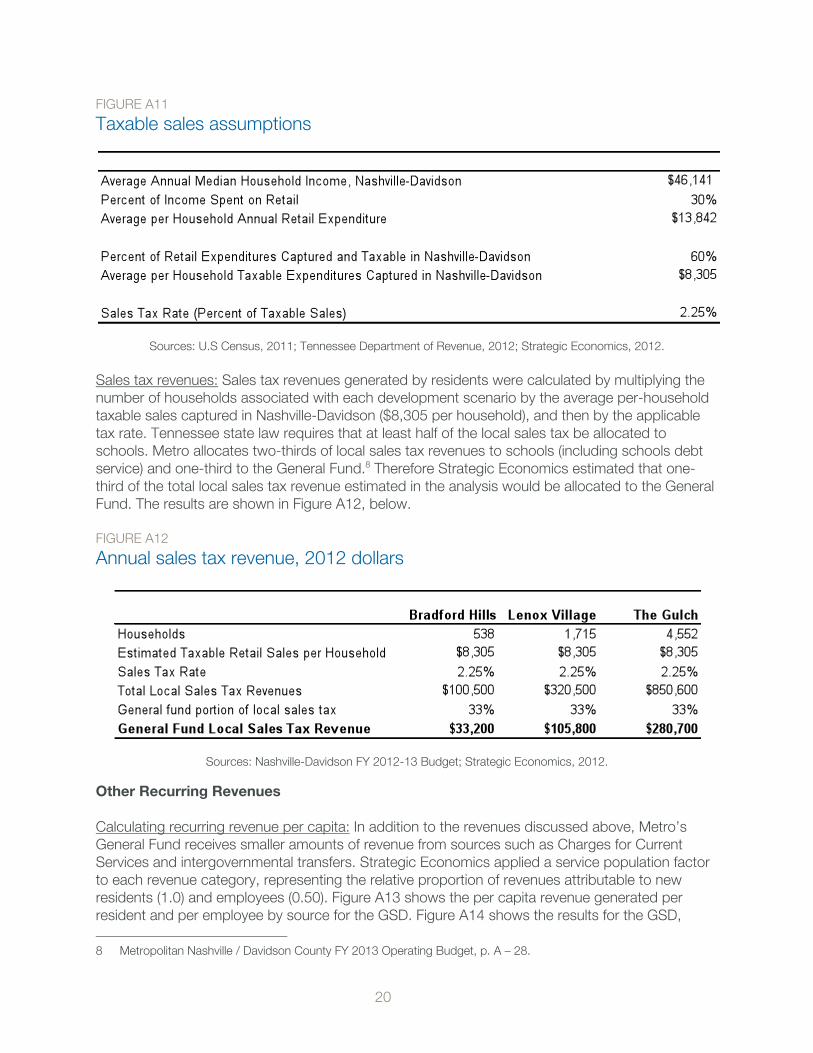
Sales Tax Taxable sales assumptions: Figure A11 shows the taxable sales assumptions used to estimate sales tax revenues for the development scenarios. Strategic Economics calculated taxable retail demand based on the projected number of households, rather than the amount of new retail provided in each scenario, because new supply (i.e., new retail square footage) does not necessarily create new demand. To estimate taxable sales, Strategic Economics used assumptions for the percent of income spent on retail and the percent of retail expenditures that are both taxable and captured within Nashville-Davidson (Figure A11). The estimate for the percent of income spent on retail (30 percent) is a rule of thumb assumption for how much of a household’s income is used for retail expenditures. The estimate for the percentage of retail expenditures captured and taxable in Nashville-Davidson is a fairly conservative assumption that 60 percent of those retail expenditures are taxable and take place within the jurisdictional boundaries of Nashville-Davidson. The estimate assumes that the retail expenditures making up the other 40 percent are either untaxable and/or take place outside Nashville (e.g. retail sales that take place across jurisdictional boundaries or on websites). The analysis assumed that new employees associated with the commercial development in each scenario would not contribute significantly to taxable sales, to avoid double-counting workers who also live within the metro area. Sales tax rate: The Nashville-Davidson Metropolitan Government receives 2.25 percent of taxable sales made within the Nashville-Davidson boundaries.
20
FIGURE A11 Taxable sales assumptions
Sources: U.S Census, 2011; Tennessee Department of Revenue, 2012; Strategic Economics, 2012. Sales tax revenues: Sales tax revenues generated by residents were calculated by multiplying the number of households associated with each development scenario by the average per-household taxable sales captured in Nashville-Davidson ($8,305 per household), and then by the applicable tax rate. Tennessee state law requires that at least half of the local sales tax be allocated to schools. Metro allocates two-thirds of local sales tax revenues to schools (including schools debt service) and one-third to the General Fund.8 Therefore Strategic Economics estimated that one-third of the total local sales tax revenue estimated in the analysis would be allocated to the General Fund. The results are shown in Figure A12, below. FIGURE A12 Annual sales tax revenue, 2012 dollars
Sources: Nashville-Davidson FY 2012-13 Budget; Strategic Economics, 2012.
Other Recurring Revenues Calculating recurring revenue per capita: In addition to the revenues discussed above, Metro’s General Fund receives smaller amounts of revenue from sources such as Charges for Current Services and intergovernmental transfers. Strategic Economics applied a service population factor to each revenue category, representing the relative proportion of revenues attributable to new residents (1.0) and employees (0.50). Figure A13 shows the per capita revenue generated per resident and per employee by source for the GSD. Figure A14 shows the results for the GSD, 8 Metropolitan Nashville / Davidson County FY 2013 Operating Budget, p. A – 28.

21
based on multiplying the per capita resident and employee revenues by the number of residents and employees associated with each development scenario. Figure A15 shows the per capita revenue generated per resident and per employee by source for the USD. Figure A16 shows the results for the USD, based on multiplying the per capita resident and employee revenues by the number of residents and employees associated with each development scenario. FIGURE A13
Other recurring revenues assumptions – GSD
Sources: Nashville-Davidson FY 2012-13 Budget; Strategic Economics, 2012. FIGURE A14
Other annually recurring revenue, 2012 dollars – GSD
Sources: Nashville-Davidson FY 2012-13 Budget; Strategic Economics, 2012. FIGURE A15 Other recurring revenues assumptions – USD
Sources: Nashville-Davidson FY 2012-13 Budget; Strategic Economics, 2012.

22
FIGURE A16
Other annually recurring revenue, 2012 dollars – USD
Sources: Nashville-Davidson FY 2012-13 Budget; Strategic Economics, 2012.
Estimating expenditures This section summarizes the methodology used to estimate major General Fund costs for both the GSD and USD.
Per Capita Expenditures Strategic Economics applied a per capita model to estimate General Fund costs. In the model, certain General Fund costs are assumed to increase on a per capita basis as residents and employees are added in the development scenarios. Strategic Economics assumed that some costs are fixed and independent of population growth, but that some portion of each cost category is “variable”, or dependent on the size of the service population. For example, fixed costs are those that do not vary with growth, such as administrative costs, and variable costs are those that do vary with growth such as the costs associated with the number of police officers or firefighters. For the purposes of this analysis, Strategic Economics assumed that 50 percent of General Government costs are independent of the size of the service population (Figure A17). This assumption is based on the premise that half of general administrative costs will not increase with new population. Other cost categories, such as public safety, are more closely tied to changes in population and therefore are assumed to have a higher level of variable costs (90 percent). The assumptions for fixed and variable costs are based on previous experience with fiscal impact analysis and industry standards. As with the revenues calculated on a similar basis, Strategic Economics applied a service population factor to each expense category, representing the relative proportion of expenses attributable to new residents (1.0) and employees (0.50). Figure A17 shows the per capita expenses generated by residents and employees within the GSD. Figure A18 summarizes the costs associated with each development scenario for the GSD. Figure A19 shows the per capita expenses generated by residents and employees within the USD. Figure A20 summarizes the costs associated with each development scenario for the USD.

FIGURE A17
General fund expenditure assumptions – GSD
Sources: Nashville-Davidson FY 2012-13 Budget; Strategic Economics, 2012. FIGURE A18 Calculation of annual general fund costs - GSD, 2012 dollars
Sources: Nashville-Davidson FY 2012-13 Budget; Strategic Economics, 2012.

FIGURE A19
General fund expenditure assumptions – USD
Sources: Nashville-Davidson FY 2012-13 Budget; Strategic Economics, 2012. FIGURE A20 Calculation of annual general fund costs - USD, 2012 dollars
Sources: Nashville-Davidson FY 2012-13 Budget; Strategic Economics, 2012.