
Fiscal Devolution and Dependency
32
HAL Id: hal-00582031 https://hal.archives-ouvertes.fr/hal-00582031 Submitted on 1 Apr 2011 HAL is a multi-disciplinary open access archive for the deposit and dissemination of sci- entific research documents, whether they are pub- lished or not. The documents may come from teaching and research institutions in France or abroad, or from public or private research centers. L’archive ouverte pluridisciplinaire HAL, est destinée au dépôt et à la diffusion de documents scientifiques de niveau recherche, publiés ou non, émanant des établissements d’enseignement et de recherche français ou étrangers, des laboratoires publics ou privés. Fiscal Devolution and Dependency Laurian Lungu, James Foreman-Peck To cite this version: Laurian Lungu, James Foreman-Peck. Fiscal Devolution and Dependency. Applied Economics, Taylor & Francis (Routledge), 2009, 41 (07), pp.815-828. 10.1080/00036840601019182. hal-00582031
Transcript of Fiscal Devolution and Dependency
HAL Id: hal-00582031https://hal.archives-ouvertes.fr/hal-00582031
Submitted on 1 Apr 2011
HAL is a multi-disciplinary open accessarchive for the deposit and dissemination of sci-entific research documents, whether they are pub-lished or not. The documents may come fromteaching and research institutions in France orabroad, or from public or private research centers.
L’archive ouverte pluridisciplinaire HAL, estdestinée au dépôt et à la diffusion de documentsscientifiques de niveau recherche, publiés ou non,émanant des établissements d’enseignement et derecherche français ou étrangers, des laboratoirespublics ou privés.
Fiscal Devolution and DependencyLaurian Lungu, James Foreman-Peck
To cite this version:Laurian Lungu, James Foreman-Peck. Fiscal Devolution and Dependency. Applied Economics, Taylor& Francis (Routledge), 2009, 41 (07), pp.815-828. �10.1080/00036840601019182�. �hal-00582031�
For Peer Review
Fiscal Devolution and Dependency
Journal: Applied Economics
Manuscript ID: APE-05-0698
Journal Selection: Applied Economics
Date Submitted by the Author:
12-Dec-2005
Complete List of Authors: Lungu, Laurian; Cardiff Business School, Economics Foreman-Peck, James; Cardiff Business School, Economics
JEL Code: R58 - Regional Development Policy < R5 - Regional Government Analysis < R - Urban, Rural, and Regional Economics
Keywords: Fiscal Devolution, Small Open Economy Modelling, Crowding Out
Editorial Office, Dept of Economics, Warwick University, Coventry CV4 7AL, UK
Submitted Manuscript
For Peer Review
1
Fiscal Devolution and Dependency
James Foreman-Peck♣ and Laurian Lungu Aberconway Building, Colum Drive, Cardiff Business School, Cardiff, CF10 3EU, UK
Abstract
Public spending devolution in practice is widely seen as more appropriate for addressing varied political aspirations within state boundaries than is tax devolution. A drawback is that devolved public spending may be subject to irresistible upward pressure, as illustrated by ‘formula drift’ of the United Kingdom devolved administrations. By crowding out the private sector such public spending can exacerbate the problem it was originally intended to alleviate. When taxpayers do not value increases in government output at least as highly as the private goods and services they must forgo to finance them, then the public sector is too large. This paper estimates a three sector Hecksher-Ohlin model of the economy with the greatest relative rise of the public spending ratio in the United Kingdom, Wales. Simulation of the model shows a net gain in employment from a one percent cut in income tax matched by a corresponding reduction in government spending. This result is consistent with the current level of intergovernmental transfers being excessive.
Keywords: Fiscal Devolution, Small Open Economy Modelling, Crowding Out JEL Classification: R15, R58.
♣ Corresponding author, e-mail address: [email protected]
Page 1 of 30
Editorial Office, Dept of Economics, Warwick University, Coventry CV4 7AL, UK
Submitted Manuscript
123456789101112131415161718192021222324252627282930313233343536373839404142434445464748495051525354555657585960

For Peer Review
2
1. Introduction
Devolution of public spending may permit local governments to provide public
services better adapted to local preferences than their central counterparts (Tiebout
1956; Besley and Coates 1999). They are closer to their residents and information
dissipates with distance. Within a given budget possibly they can alter the composition,
or change the method of delivery. A second, not exclusive, justification for devolution
can be a local predilection for devolved government quite regardless of whether it is
more responsive or generally better at meeting local needs. People may prefer to be
governed by those with whom they identify, independently of the quality of
governance1.
If expenditure is devolved there is an incentive case that at least some portion of
taxes should be also (Sanguinetti and Tommasi, 2004). In practice, while the sub-
national government share of public spending has increased in a majority of OECD
countries, the share in general government revenues (excluding grants) has failed to rise
correspondingly and has even declined in several cases (Journard and Kongsrud 2003).
Some institutional arrangements may encourage this trend more than others. An
example is where an expenditure ministry bargains on behalf of regional authorities for
finance with a ministry that raises national revenue and provides for national level
public goods. In this case a regime in which the spending ministry gets political benefits
from the expenditure will generate more spending than one where taxes, as well as
spending, are devolved (Sato 2002).
1 One part of this condition apparently is satisfied for Wales and Scotland according to the ‘British Identity’ MORI poll for the Economist in November 1999. The Welsh and Scottish have a stronger identification with Wales and Scotland than with Britain, in marked contrast to residents in England.
Page 2 of 30
Editorial Office, Dept of Economics, Warwick University, Coventry CV4 7AL, UK
Submitted Manuscript
123456789101112131415161718192021222324252627282930313233343536373839404142434445464748495051525354555657585960

For Peer Review
3
On the other hand stabilisation and redistribution weaken the case for tax
devolution. When taxes are not devolved and a region experiences a negative demand
shock, tax receipts fall and unemployment pay outs increase, boosting government
spending and partly offsetting the private sector contraction. This is a form of risk
sharing between regions subject to different shocks (Persson and Tabellini 1996).
Hughes Hallett (2005) undercuts the normative risk sharing argument by showing that
fiscal autonomy for UK regions would reduce volatility of output and inflation2.
Interpersonal redistribution also may be reflected in inter-regional net subsidies (Melitz
and Zummer 2002; Decressin 2002). Tax competition from other jurisdictions anyway
limits the extent to which taxation can effectively be devolved. The extent of factor
mobility between fiscally devolved administrations is the principal constraint (Wildasin
2003).
Without devolved taxation, income smoothing by the federal or central
government spending, rather than by built-in tax stabilisers, can give rise to higher
centrally funded state spending long after negative shocks have dispersed, preventing
adjustment (Obstfeld and Peri 1998). Stabilisation presupposes some recovery from
shocks and redistribution similarly has no reason to be trended. Soft budget constraints
and over-spending biases embedded in political institutions exacerbate a tendency
towards upwards drift in devolved public expenditure (Pisauro 2001).
The present paper therefore examines the fiscal performance of the devolved
administrations of the UK to assess evidence of such dependency. A test is constructed
and a tax and government spending model of the most likely candidate administration is
simulated. The employment patterns found are inconsistent with long run regional
2 Unless all shocks are on the supply side.
Page 3 of 30
Editorial Office, Dept of Economics, Warwick University, Coventry CV4 7AL, UK
Submitted Manuscript
123456789101112131415161718192021222324252627282930313233343536373839404142434445464748495051525354555657585960
For Peer Review
4
balance of payments equilibrium, suggesting an advantage from balanced reductions in
taxation matched by government spending.
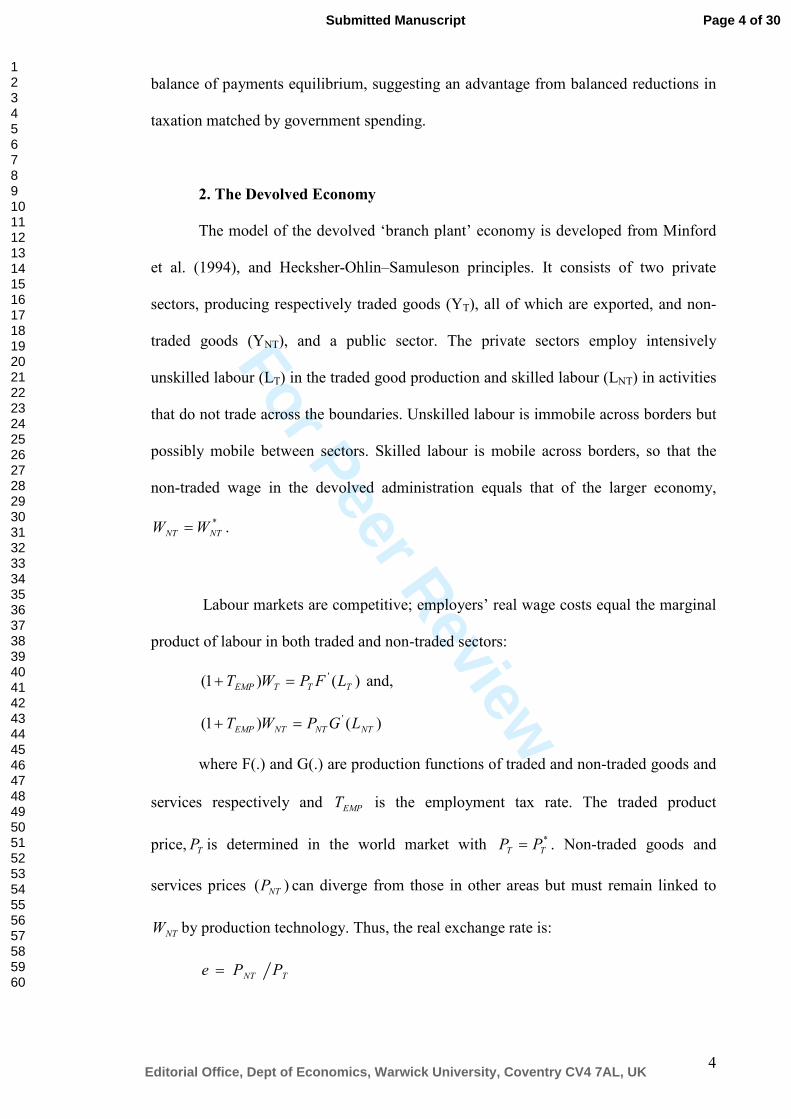
2. The Devolved Economy
The model of the devolved ‘branch plant’ economy is developed from Minford
et al. (1994), and Hecksher-Ohlin–Samuleson principles. It consists of two private
sectors, producing respectively traded goods (YT), all of which are exported, and non-
traded goods (YNT), and a public sector. The private sectors employ intensively
unskilled labour (LT) in the traded good production and skilled labour (LNT) in activities
that do not trade across the boundaries. Unskilled labour is immobile across borders but
possibly mobile between sectors. Skilled labour is mobile across borders, so that the
non-traded wage in the devolved administration equals that of the larger economy, *
NTNT WW = .
Labour markets are competitive; employers’ real wage costs equal the marginal
product of labour in both traded and non-traded sectors:
)()1( 'TTTEMP LFPWT =+ and,
)()1( 'NTNTNTEMP LGPWT =+
where F(.) and G(.) are production functions of traded and non-traded goods and
services respectively and EMPT is the employment tax rate. The traded product
price, TP is determined in the world market with *TT PP = . Non-traded goods and
services prices )( NTP can diverge from those in other areas but must remain linked to
NTW by production technology. Thus, the real exchange rate is:
TNT PPe =
Page 4 of 30
Editorial Office, Dept of Economics, Warwick University, Coventry CV4 7AL, UK
Submitted Manuscript
123456789101112131415161718192021222324252627282930313233343536373839404142434445464748495051525354555657585960
For Peer Review
5
With mobility between sectors both WT and NTW are exogenous; consequently
the real exchange rate is also. More productive local labour appreciates the exchange
rate. Labour supplies depend upon the cost of living, an index of the two prices, TP and
NTP , and on the income tax rate, YT .
Without tax autonomy devolved government spending (G) is fixed regardless of
tax receipts.
BYG G +=
The expenditure consists of purchases of goods and services to produce output
(YG) of public administration, health and/or education, say, plus transfer payments (B).
Both create a demand for non-traded goods and services, as does traded good
production. YG requires labour for production,
LT = gT(YG), LN = gN(YG)
The government sector can employ workers from either non-traded or traded
sectors. The expectation is that mobile labour will be used more intensively than
immobile labour.
The demand for nontraded output depends upon traded output and government
spending. Employees in exporting or in government service spend money in shops and
on local services and send their children to school. In turn this gives rise to other rounds
of spending. An income tax effect depends upon the levels of traded output and
government spending and their respective nontraded goods multipliers, on the demand
side. On the supply side the level of income tax affects labour force participation and
therefore private sector output. Government production, by contrast with transfer
payments, competes with the private sector for resources.
Page 5 of 30
Editorial Office, Dept of Economics, Warwick University, Coventry CV4 7AL, UK
Submitted Manuscript
123456789101112131415161718192021222324252627282930313233343536373839404142434445464748495051525354555657585960

For Peer Review
6
Net finance comes from the federal or central government. Tax receipts (τ) are
paid directly to the central government. They increase with employment, wage levels
and tax rates. The region’s current account is then:
YT (e) - M(e) = G - T
where YT are exports and M, imports, all tradable consumption. A net subsidy
to the economy (NTR) (T<G) allows a current account deficit and a higher level of
demand at a given real exchange rate.
Federal or central government income smoothing in the response to a negative
shock to exports and thus to employment and income occurs because T falls (by less
than X) and G remains unchanged (or may in fact rise). The regional balance of trade
deficit widens and tax revenue no longer covers as much of the cost of government
output and employment, so there is an expansion of the subsidy. The share of
government output and employment in the total rises.
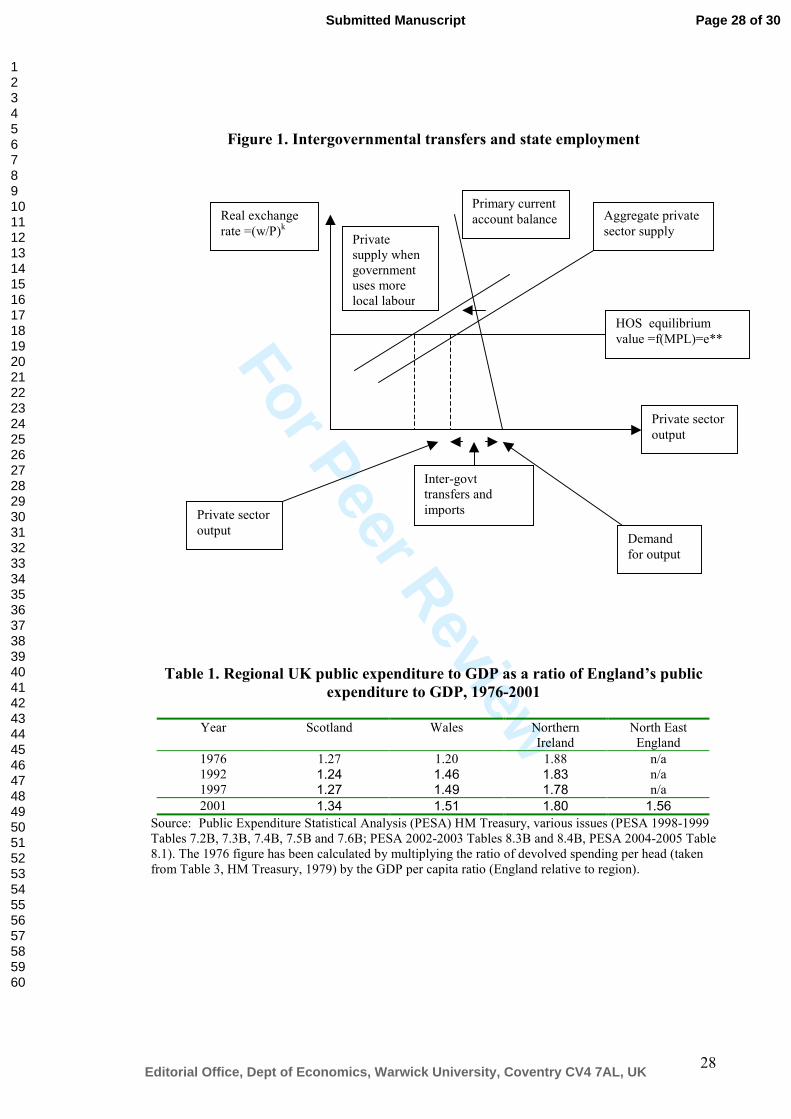
[ insert Figure 1 here ]
Figure 1 shows the case of mobility between traded and nontraded sectors,
where the real exchange rate is determined by technical efficiency and therefore is
exogenous. If net intergovernmental transfers pay for interpersonal transfers such as
pensions and invalidity benefit then they simply boost consumption, allowing demand
to exceed output by the amount of the transfer. They also permit more (tradable
consumption) imports than (tradable production) exports.
Again, when some of the net transfer pays for government production and
therefore employs local labour, some of which would have worked in the private sector,
the capacity to import is still enhanced by the block grant from the central government,
regardless of whether those in the devolved jurisdiction value the output as much as in
Page 6 of 30
Editorial Office, Dept of Economics, Warwick University, Coventry CV4 7AL, UK
Submitted Manuscript
123456789101112131415161718192021222324252627282930313233343536373839404142434445464748495051525354555657585960

For Peer Review
7
the first case. However the capacity to export will be reduced insofar as local labour is
diverted from the tradable sector. Hence the balance of payments constraint may not be
shifted as much as by pure transfers. The willingness of consumers to substitute
government output for tradable consumption (imports) determines the level of demand
generated by the block grant.
Now consider an increment of government spending not paid for by inter-
governmental transfers. Assume that the extra government output is judged an
inadequate substitute for private goods forgone as a consequence of the extra taxes paid
in the devolved administration3. Extra taxes and government output reduce private
sector output (tradable and non-tradable) at a given real exchange rate. Exports are cut
by the transfer of labour from the private to the public sector. Private consumption and
therefore imports do not fall initially despite the higher taxes because the taxes pay for
the workforce transferred to the public sector. These people still wish to consume
tradables, so that imports are not reduced. The economy therefore deflates as a
consequence of the self-financed increment in government spending, unless more
intergovernmental transfers are forthcoming; since the real exchange rate cannot adjust,
monetary forces exert downward pressure on income, employment and output to restore
balance of payments equilibrium (PCA shifts left in figure 1)4. Hence government
expansion crowds out the private sector and deflates the economy when government
output is not valued sufficiently highly by taxpayers.
The solution in such cases is to increase the size of the tradable sector by supply
side policies such as tax cuts matched by public spending cuts. The expansion of the 3 If increments to what the government was doing were useless in utility terms they would still record a contribution to output because of the way output is measured 4 PCA , primary current account, balance is the series of output and real exchange rate combinations at which exports equal imports. A given output and real exchange rate determines the demand for imports. If the supply of exports contracts then PCA balance shifts left.
Page 7 of 30
Editorial Office, Dept of Economics, Warwick University, Coventry CV4 7AL, UK
Submitted Manuscript
123456789101112131415161718192021222324252627282930313233343536373839404142434445464748495051525354555657585960

For Peer Review
8
private sector creates more exports, and shifts the PCA balance to the right, permitting
more long term output, employment and income. Failure to take into account the
monetary forces set in motion by balance of payments adjustment can conceal the
asymmetric effects of government expenditure increase and tax cuts on the level of
economic activity in devolved administrations and economies.
This devolved government over-expansion possibility can be tested. In practice
government output is measured at cost, and so, in an exercise implicitly to assess the
value users place on government output, must be ignored. Employment is a better
welfare proxy. If tax cuts boost employment by more than the equivalent government
spending reduction then the balance of payments will be improved, demand and output
will be higher. The balance of advantage indicates the valuation of incremental
government output.
3. The Devolved Administrations of the United Kingdom
The UK devolved administrations exercise no tax-raising powers but are
primarily funded with block grants from the central government that levies taxes. By
contrast the English regions lack authority for devolved spending, as well as for levying
taxes. Taxes are typically proportional or progressive (in the UK with the exception of
the only local tax, the community charge that accounts for a small proportion of total
tax payments). They therefore permit contributions to the finance of services such as
heath and education to a common standard according to ability to pay by individual and
by jurisdictions. These tax arrangements mean that, unlike central government, there are
no electoral advantages for administrations in terms of tax restraint from public
spending economy.
Page 8 of 30
Editorial Office, Dept of Economics, Warwick University, Coventry CV4 7AL, UK
Submitted Manuscript
123456789101112131415161718192021222324252627282930313233343536373839404142434445464748495051525354555657585960
For Peer Review
9
Since 1979 the size of the block grant has supposedly been governed by the
Barnett formula, intended virtually to eliminate the spending per head gap with England
in the very long term. The grant per head of the devolved population increases in
absolute terms with spending per head in England. Since the administrations spend
more per head than England, their percentage increases in budgets would be less under
the formula. However political bargaining, ‘formula bypass’ (Heald 1994; 2003),
ensured that the spending gap is more likely to increase than to diminish5. A study of
Scottish education spending found that using the English Local Authority approach to
assessing ‘need’, Scottish pupils would receive about 3 percent more than the English –
but actual spending is considerably higher (King, Pashley and Ball 2004).
With lower regional incomes the same spending gives rise to a higher ratio of
public expenditure to GDP; a region with a 20 percent lower than average income per
head would exhibit a ratio of 1.25 if this principle were followed. While temporarily
higher ratios might be warranted in response to shocks, permanently higher real
government spending, taking the ratio above the warranted level would be a symptom
of inefficiency, or of ‘gold-plating’ relative to rest of the economy, unless the spending
ratio in other regions has risen similarly. Stabilisation presupposes some recovery from
shocks and redistribution similarly has no reason to be trended. Trends in devolved
government spending to income ratios could reflect federal or central government
decisions rather than increasing or decreasing dependency. Therefore a test of
dependency or inefficiency is whether there is a trend rise in the ratio of government
spending to GDP in the devolved administrations relative to the ratio in the core, or to
the federal average.
5 For Scotland, Midwinter (2002 108) points out that the Scottish Executive was able to accommodate free personal care for elderly and teachers’ pay increases within Treasury allocated expenditure growth totals, because its share of the UK budget was rising- despite the Barnett ‘squeeze’.
Page 9 of 30
Editorial Office, Dept of Economics, Warwick University, Coventry CV4 7AL, UK
Submitted Manuscript
123456789101112131415161718192021222324252627282930313233343536373839404142434445464748495051525354555657585960
For Peer Review
10
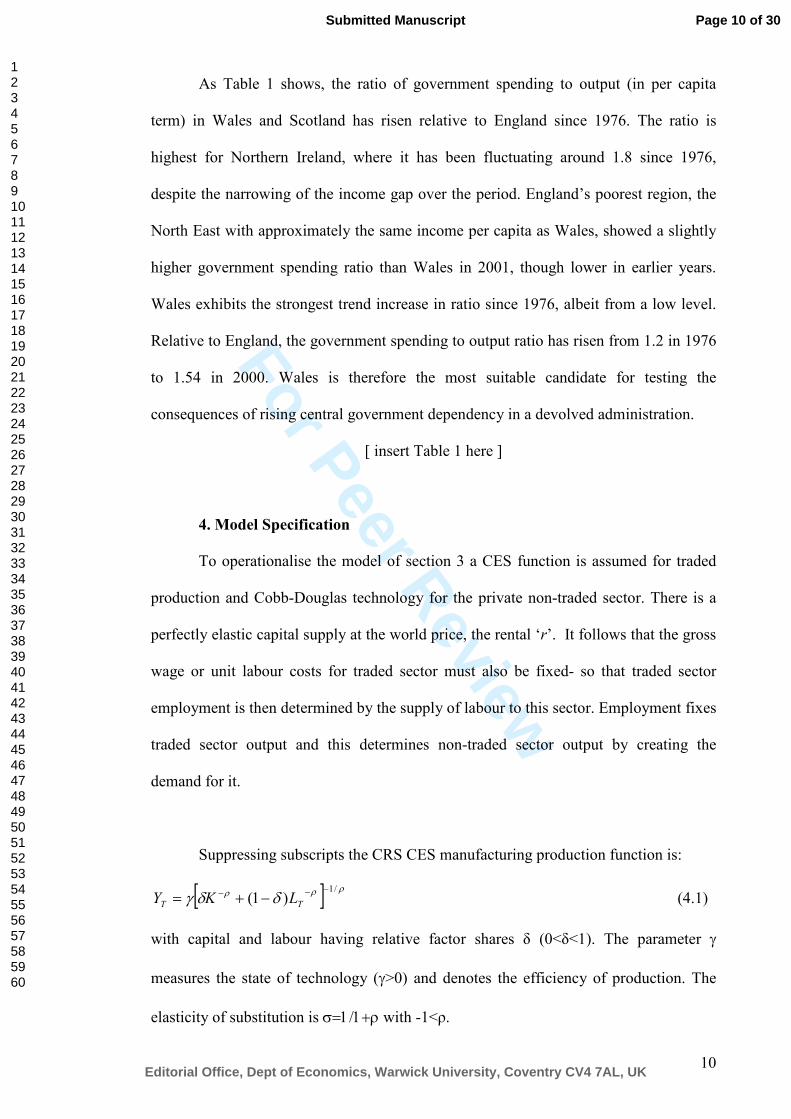
As Table 1 shows, the ratio of government spending to output (in per capita
term) in Wales and Scotland has risen relative to England since 1976. The ratio is
highest for Northern Ireland, where it has been fluctuating around 1.8 since 1976,
despite the narrowing of the income gap over the period. England’s poorest region, the
North East with approximately the same income per capita as Wales, showed a slightly
higher government spending ratio than Wales in 2001, though lower in earlier years.
Wales exhibits the strongest trend increase in ratio since 1976, albeit from a low level.
Relative to England, the government spending to output ratio has risen from 1.2 in 1976
to 1.54 in 2000. Wales is therefore the most suitable candidate for testing the
consequences of rising central government dependency in a devolved administration.
[ insert Table 1 here ]
4. Model Specification
To operationalise the model of section 3 a CES function is assumed for traded
production and Cobb-Douglas technology for the private non-traded sector. There is a
perfectly elastic capital supply at the world price, the rental ‘r’. It follows that the gross
wage or unit labour costs for traded sector must also be fixed- so that traded sector
employment is then determined by the supply of labour to this sector. Employment fixes
traded sector output and this determines non-traded sector output by creating the
demand for it.
Suppressing subscripts the CRS CES manufacturing production function is:
[ ] ρρρ δδγ /1)1( −−− −+= TT LKY (4.1)
with capital and labour having relative factor shares δ (0<δ<1). The parameter γmeasures the state of technology (γ>0) and denotes the efficiency of production. The
elasticity of substitution is σ=1/1+ρ with -1<ρ.
Page 10 of 30
Editorial Office, Dept of Economics, Warwick University, Coventry CV4 7AL, UK
Submitted Manuscript
123456789101112131415161718192021222324252627282930313233343536373839404142434445464748495051525354555657585960
For Peer Review
11
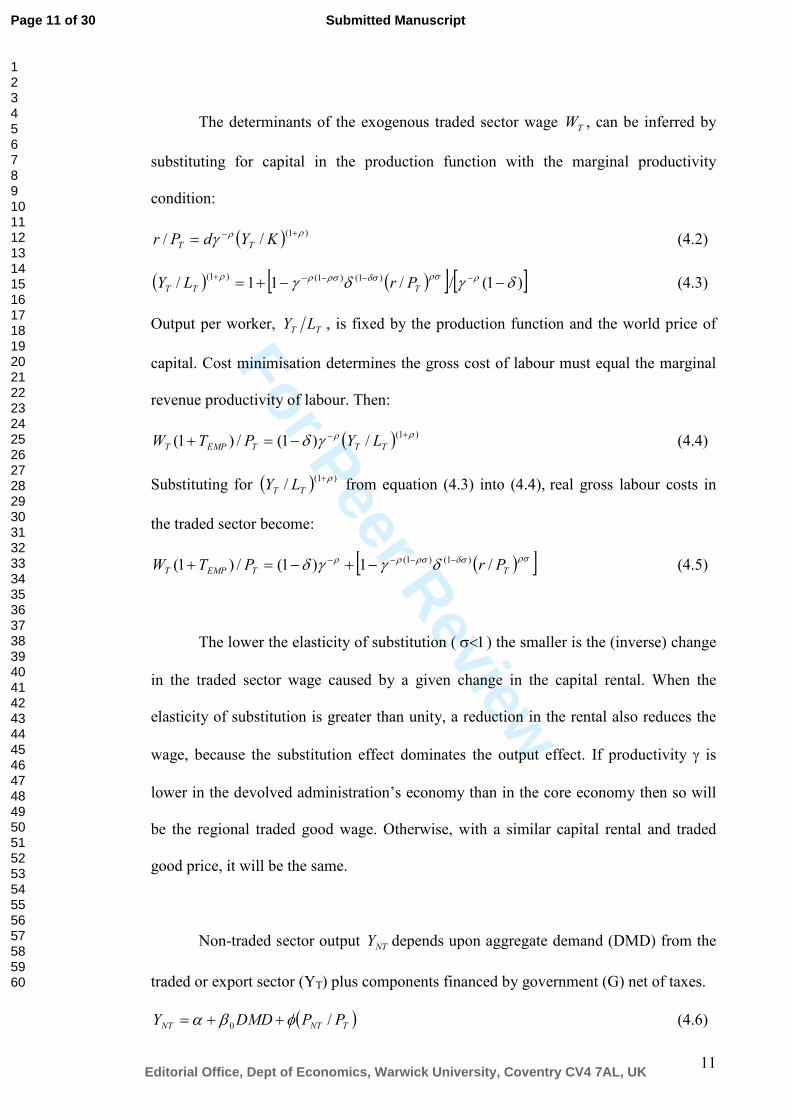
The determinants of the exogenous traded sector wage TW , can be inferred by
substituting for capital in the production function with the marginal productivity
condition:
( ) )1(// ρργ +−= KYdPr TT (4.2)
( ) ( )[ ] [ ])1(//11/ )1()1()1( δγδγ ρρσδσρσρρ −−+= −−−−+TTT PrLY (4.3)
Output per worker, TT LY , is fixed by the production function and the world price of
capital. Cost minimisation determines the gross cost of labour must equal the marginal
revenue productivity of labour. Then:
( ) )1(/)1(/)1( ρργδ +−−=+ TTTEMPT LYPTW (4.4)
Substituting for ( ) )1(/ ρ+TT LY from equation (4.3) into (4.4), real gross labour costs in
the traded sector become:
( )[ ]ρσδσρσρρ δγγδ TTEMPT PrPTW /1)1(/)1( )1()1( −−−− −+−=+ (4.5)
The lower the elasticity of substitution ( σ<1) the smaller is the (inverse) change
in the traded sector wage caused by a given change in the capital rental. When the
elasticity of substitution is greater than unity, a reduction in the rental also reduces the
wage, because the substitution effect dominates the output effect. If productivity γ is
lower in the devolved administration’s economy than in the core economy then so will
be the regional traded good wage. Otherwise, with a similar capital rental and traded
good price, it will be the same.
Non-traded sector output NTY depends upon aggregate demand (DMD) from the
traded or export sector (YT) plus components financed by government (G) net of taxes.
( )TNTNT PPDMDY /0 φβα ++= (4.6)
Page 11 of 30
Editorial Office, Dept of Economics, Warwick University, Coventry CV4 7AL, UK
Submitted Manuscript
123456789101112131415161718192021222324252627282930313233343536373839404142434445464748495051525354555657585960
For Peer Review
12
and aggregate demand is determined as follows;
)]1([]1)(1([ 3)21 yTEMPy TYTTGDMD −+−−+= βββ (4.7)
where φβα ,3,0,, =jj are parameters
The representative agent consumes a bundle of traded and non-traded goods for
which a price P is paid, taken as a weighted average of the traded and non-traded price
indexes. Each agent is endowed with a fixed amount of time, which is spent either on
leisure. The labour supply to the traded sector is derived from on household utility
maximisation, where the after-tax real wage relative to unemployment benefits
determines the trade-off between work and leisure.
Employment in the traded sector is fixed by exogenous gross wage and the
supply of labour to the sector. Output is then determined by the marginal productivity of
labour. In logs the marginal productivity equation is:
( )[ ] ( )[ ] ( )[ ]TPtwLnLnLYLn /)11/1)1)/( +++−= ργδ ρ (4.8)
Thus, average traded sector productivity depends on the real wages and the state of
technology.
The demand for employment in non-traded sector is derived from the demand
for output. The supply of nontraded labour depends upon opportunities outside the
economy and the size of the economy’s workforce. The demand for non-traded labour
in logs is (CES):
[ ] )ln(/)1(lnln)( 321 NTNTEMPNTNT YPTWEMPLn ϑϑϑ ++−= (4.9)
where 31, −=iiϑ are parameters. The real wage of non-traded labour can be forced up
relative to the traded wage if there is imperfect mobility between the sectors. If
Page 12 of 30
Editorial Office, Dept of Economics, Warwick University, Coventry CV4 7AL, UK
Submitted Manuscript
123456789101112131415161718192021222324252627282930313233343536373839404142434445464748495051525354555657585960

For Peer Review
13
government demand is primarily for skilled labour then is this will be the principal
determinant of the relative wage: 6
)ln()ln()ln()ln( 54 TNT WGW ++= ϑϑ (4.10)
Working population depends upon natural increase, net migration and influences
upon labour force participation such as administrative regimes for sickness benefit.
Only skilled labour migrates across the border in the present model. Net migration is
often supposed to depend upon relative wages and or relative unemployment rates (for
example Jackman and Savouri 1992). The impact of public sector employment (public
administration, health, education) depends on whether the appointments are from the
immobile or mobile labour forces. The effect is captured by the coefficient on
government employment in the working population equation.
Unemployment is determined by the difference between working population and
total employment, both public and private sector. Thus, unemployment is not the gap
between labour supply and demand, it is rather the excess of the labour force over the
labour supply7. Migration may alter the size of the labour force which in turn will affect
unemployment.
5. Model Estimation
The above model, estimated for the economy of Wales from annual data
between 1971 and 2001, is set out in Table 2 below. Manufacturing industry is the
proxy for the traded goods sector8. Appendix 1 presents unit root ADF tests for the
6 This is a mark-up on manufacturing (traded) sector wages since the traded sector wage is exogenous. 7 For a discussion on the implications of the two models of unemployment determination see, for instance, Blanchflower and Oswald (1994). 8 The correspondence with the theoretical sectors is not exact since there is some traded output produced in the non-manufacturing sector (for example mining at the beginning of the period and tourism at the end. Historically coal exports have been of major significance for the Welsh economy. On the one hand relatively little employment and output (11 percent in the Industrial Production index of 1970) was accounted for by mining even at the beginning of the period. On the other, it was more erratic than
Page 13 of 30
Editorial Office, Dept of Economics, Warwick University, Coventry CV4 7AL, UK
Submitted Manuscript
123456789101112131415161718192021222324252627282930313233343536373839404142434445464748495051525354555657585960
For Peer Review
14
variables. The maintained regressions for I(1) included either an intercept and a
deterministic trend or an intercept only, as appropriate. The tests show that the unit root
hypothesis cannot be rejected at the 5% significance level for all variables. The data
series and definitions are described in Appendix 2. All model equations have been
estimated by instrumental variables (IV), using various exogenous variables of the
model as instruments9. Appendix 3 presents the Ljung-Box Q-statistics for the residuals
for model equations.
Equation (A1.1), the manufacturing labour supply function, should ideally
measure labour supply in hours, rather than in persons, the actual specification. In view
of the rise in part-time, primarily female employment and the absence of data either on
hours worked or on the proportion of part-time workers in Welsh manufacturing, the
ratio of female employees in Welsh working population (FWPOP) is included to control
for this change. Demographic shifts and other time-dependent factors are approximated
by a time trend.
[ insert Table 2 here ]
The estimated productivity equation (A1.2) is derived from the labour marginal
productivity equation (4.8). The effect of tax-adjusted wages relative to manufacturing
prices on manufacturing output is statistically significant. Also highly significant is the
lagged productivity term, the coefficient of which implies a strong persistence of
productivity effects. As part-time workers displaced full time workers, manufacturing
labour productivity measured simply as a ratio of manufacturing output to the number
of employees in manufacturing could be misleading.10 As in equation A1.1 the spread of
manufacturing- employment and output fell earlier (between 1971 and 1974 output declined 40 percent). So there is an overstatement of buoyancy of export sector in the early years. 9 It is well known that the OLS estimation of equations with lagged dependent variables, as some equations in our model are, renders the DW statistics unreliable. 10 Explaining productivity in UK manufacturing as a whole has proved problematic, partly because apparent productivity slowdown in the 1970s stemmed from incorrect measurement of output and from structural change (Cameron, 2000).
Page 14 of 30
Editorial Office, Dept of Economics, Warwick University, Coventry CV4 7AL, UK
Submitted Manuscript
123456789101112131415161718192021222324252627282930313233343536373839404142434445464748495051525354555657585960

For Peer Review
15
female employment is therefore introduced as a control. The negative coefficient
estimated for the ratio of female employees in working population (FWPOP) is
consistent with this interpretation.
Turning to the non-traded sector, equation (A1.3) explains the demand for
output with the two exogenous components of demand, traded output and government
spending. The size of the long run coefficient on traded output/manufacturing reflects
the declining share of output of this sector over the estimation period. Firms’ demand
for labour to produce non-traded output is given by a Cobb-Douglas marginal
productivity equation (A1.4). The long run equilibrium ensures that this exhibits
constant returns to scale. Equation (A1.5) models the real net non-traded wage as a
mark-up over real traded wage. The coefficient of government spending is positive but
small, consistent with government demand for labour pushing up wages of selected
categories of employees.
Equation (A1.6) explains working population. House prices determine the
migrant component of working population; higher relative house prices elsewhere
discourage migration from Wales but encourage migration to Wales. The net effect on
migration may well depend on the region, whether it is a net importer or net exporter of
people to or from Wales. Those relative house price terms included are proxies for the
whole regional pattern of house price change. Adding in other region house prices does
not change the overall impact, even though they are often statistically significant.
The inclusion of numbers on invalidity and sickness benefits (SIB) in the
equation is designed to test whether working population is reduced by the high claimant
rate. The coefficient indeed has a negative sign; in view of the relative sizes of the two
Page 15 of 30
Editorial Office, Dept of Economics, Warwick University, Coventry CV4 7AL, UK
Submitted Manuscript
123456789101112131415161718192021222324252627282930313233343536373839404142434445464748495051525354555657585960

For Peer Review
16
groups, the elasticity of 0.04 implies that, at the end of the period, for every four
entering or leaving receipt of invalidity benefit approximately one person entered or left
the working population. Current declines in numbers on benefits are therefore explained
by moves into retirement; the majority of male claimants are over 55 years of age. Most
net new claimants apparently would have not been part of the workforce if they had not
claimed invalidity benefit.
The public sector and non-traded employment variables in the equation capture
similar, but larger, displacement effects. In 2001 public sector employment was 27
percent of working population, which together with the elasticity of 0.258, suggests a
one for one relationship; increases in public sector employment have raised the working
population equivalently, either by greater labour force participation or by migration
(which includes preventing emigration). Private non-traded employment, accounting
for 57 percent of working population in 2001 yet with a similar coefficient, exercises a
much smaller influence. Every two extra workers boosts working population by just
under one person, because some non-traded labour comes from the unemployed, the
traded sector or the public sector.
The model is closed with the identities (A1.7)-(A1.10). Government spending
(YG) and government employment (EMPG) are treated as exogenous. In the
unemployment identity ‘employment’ includes self-employment. Equation (A1.10)
constructs the Welsh cost of living index as a weighted average between traded and
non-traded regional prices. For simplicity the weights were kept constant over the
estimating period.
6. Simulations
Page 16 of 30
Editorial Office, Dept of Economics, Warwick University, Coventry CV4 7AL, UK
Submitted Manuscript
123456789101112131415161718192021222324252627282930313233343536373839404142434445464748495051525354555657585960

For Peer Review
17
To assess the impact of the rise in the government spending ratio over the years
1971-2001, the employment consequences of an income tax reduction compared with
an equivalent government spending increase are simulated with the estimated model.
The job effects of a one percent cut in employment tax is also considered. Output is less
relevant because it includes a substantial government component valued at cost rather
than market prices.
As the model of section 2 implies, if on average taxpayers in the devolved
economy regard an increment of government services as more than compensation for
the private goods foregone, then their demand for imported goods and services will
diminish, and the economy will expand. The converse is true if they prefer the private
goods. Measuring the size of the economy by employment, the test of the valuation
placed on a marginal change of government output is whether the more jobs are created
by a tax cut than by an equivalent increase in government expenditure. Another way of
putting the matter is that the valuation measure depends on how the ‘cost per job’ of the
employment created by the public spending increase compares with the ‘cost per job’ of
the taxes raised to finance it.
Simulation 1. Income Tax
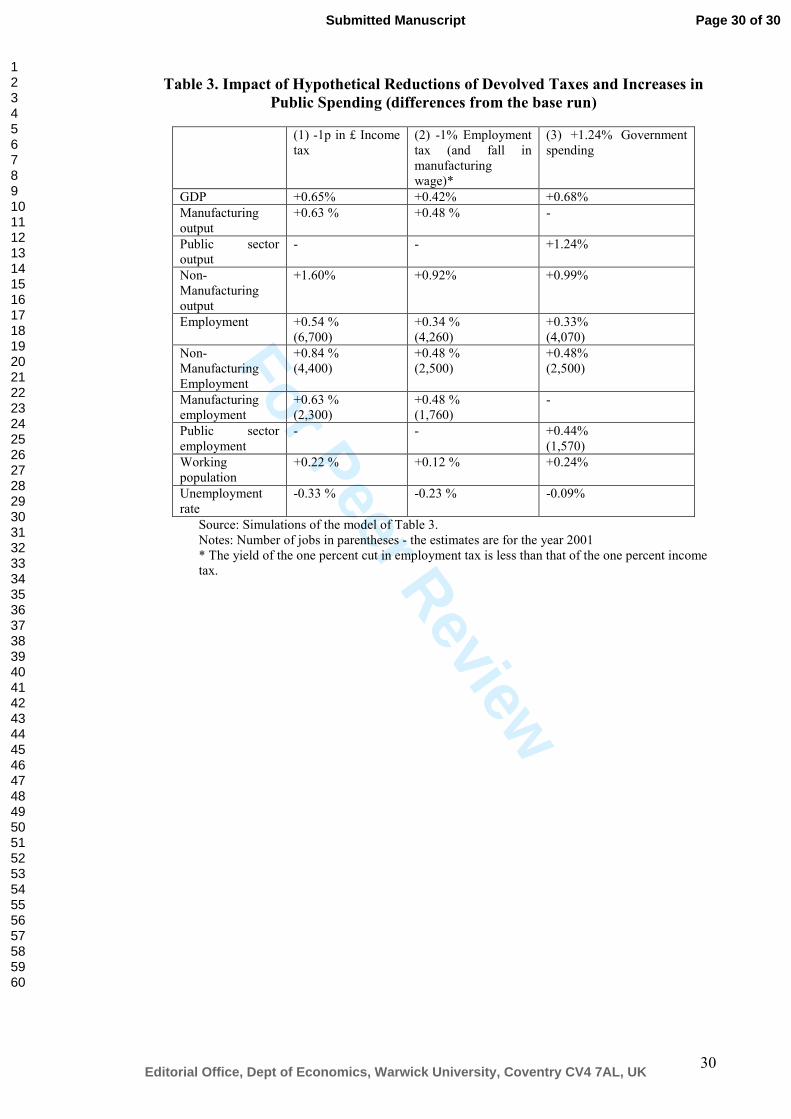
Table 3 below presents the quantitative effects of a hypothetical cut in Welsh
(and UK) tax rates and of a public spending reduction increase corresponding to a one
percent or 1p in the pound reduction in income tax, in 2001.
[ insert Table 3 here ]
A one penny in the pound cut in income tax induces a 0.5 percent (supply side)
increase in manufacturing output and employment (col. 1). The expansion of the
manufacturing sector, stemming from a greater labour input, boosts demand for non-
Page 17 of 30
Editorial Office, Dept of Economics, Warwick University, Coventry CV4 7AL, UK
Submitted Manuscript
123456789101112131415161718192021222324252627282930313233343536373839404142434445464748495051525354555657585960

For Peer Review
18
traded output by 1.6 percent so that total output rises 0.65 percent, while total
employment increases by 0.54 percent, or some 6,700 jobs. Non-manufacturing
employment expands by 0.84 percent - or 4,400 jobs. Working population also grows,
going up by 0.22 percent because of immigration and increasing labour force
participation. Considering the policy as a job creation exercise, a one penny in the
pound increase in the after-tax wage in both sectors yields a cost per job of £31,18011.
Simulation 2 - Employment Tax.
Table 3 (col. 2) shows the effects of a one percent cut in the employment tax rate
paid by the firm. Since the gross wage for the traded sector is exogenous, an increase in
the employment tax must be accompanied by a corresponding opposite movement of
the nominal manufacturing wage rate. Manufacturing employment increases by 0.48
percent - or 1,760 – triggering an expansion of the manufacturing output. Higher
activity in the traded sector has a positive impact on non-traded sector output, which
rises by 0.92 percent. To produce this output, employment in the non-traded sector goes
up by 0.48 percent - or some 2,500 jobs - and unemployment falls by 0.23 percent.
From the point of view of a job creation, the overall cost per extra job is £39,248 in
revenue forgone
.
Simulation 3 - Government Spending
This simulation is based on an increase in government spending approximately
equal to a one percent increase in income tax, namely a 1.24 percent rise in G. For the
year 2001 this amounts to £208.9 million. Another direct consequence of the shock is a
boost to public sector employment, EMPG. For every one percent increase in YG, EMPG
was assumed to rise according to the historical average, by 0.45 percent.
11 The figure reported is for the year 2001. For example, for the manufacturing sector the cost is £418/week*0.01*52 weeks per employee. For both sectors combined the cost per job is £31,180.
Page 18 of 30
Editorial Office, Dept of Economics, Warwick University, Coventry CV4 7AL, UK
Submitted Manuscript
123456789101112131415161718192021222324252627282930313233343536373839404142434445464748495051525354555657585960

For Peer Review
19
The expansion of government spending has no impact on the Welsh
manufacturing sector (Table 3, col. 3). The direct effect of government spending is
around 1,570 jobs which, together with the indirect effects, push up the total
employment to 4,070 jobs. The cost per job per year in this case is around £51,327 and
the cost per private sector job is much larger.
Comparison of Spending and Tax Simulations
Overall the costs per job are very high – for the income tax cut about equal to
the average full time gross wage costs- and especially high for the government spending
policy. Since the extra jobs generate more tax revenue in all three simulations, there
would be some offset not considered here. The impact on the non-traded private sector
is quite powerful and ranges between 0.5% in the government spending simulation to
0.9% in the employment tax simulation. A vital difference though is that the tax
reductions expand the traded sector whereas greater government spending has no effect
on it at all. Unemployment falls when taxes are cut. The unemployment rate also
declines with greater public spending but only because of the induced growth of
working population (the denominator of the unemployment ratio).
The simulation shows that a one penny in the £ cut in Welsh income tax (with a
corresponding reduction in UK tax) matched by an equivalent cut in Welsh government
spending raises employment (and leaves apparent output virtually unchanged). But the
spillover effects of public spending on the private non-traded sector are relatively weak.
Consequently the greater part of employment creation in the public spending scenario
comes from government jobs; the private ‘export’ sector only expands in a tax cutting
Page 19 of 30
Editorial Office, Dept of Economics, Warwick University, Coventry CV4 7AL, UK
Submitted Manuscript
123456789101112131415161718192021222324252627282930313233343536373839404142434445464748495051525354555657585960

For Peer Review
20
scenario and private sector jobs in total are crowded out by balanced tax and spending
increases.
The inference is that, because of the substantial size of the government sector
allowed by the net transfers from the central to the devolved economy, at the margin
Welsh taxpayers do not value an increment of average government spending as highly
as the private goods forgone because of the corresponding increase in tax payments. A
tax-cutting strategy would expand the devolved economy.
7. Conclusion
Devolution of public spending is increasingly seen as an appropriate response to
heterogeneous political aspirations within current sovereign state boundaries. Tax
devolution is less widespread because of limited or inappropriate tax bases, adverse
consequences of tax competition and reduced possibilities for regional stabilisation.
But against these considerations must be weighed the efficiency/moral hazard case for
devolving taxes. The political economy of increasing government spending, for instance
in ‘frontier’ regions with secessionist challenges, can encourage excessive government
spending in devolved economies in the sense that private sector economic activity is
crowded out and the possibilities for autonomous economic development unsubsidised
by central government are reduced. In the case of the United Kingdom’s devolved
administrations, ‘formula drift’ has prevented reining public spending into line with that
of the English economy, despite the existence of a rule intended to achieve this end.
The present paper has developed a test for over-expansion of the public sector in
devolved economies. It turns on whether taxpayers value increases in government
output at least as highly as the private goods and services they must forgo to finance
Page 20 of 30
Editorial Office, Dept of Economics, Warwick University, Coventry CV4 7AL, UK
Submitted Manuscript
123456789101112131415161718192021222324252627282930313233343536373839404142434445464748495051525354555657585960

For Peer Review
21
them. If they do not, they will try to import more private sector goods and services than
can be financed and thereby create deflationary pressure in the economy, unless more
central government transfers are provided. When a balanced expansion (contraction) of
government spending and taxation reduces (increases) employment then the size of the
public sector is greater than optimal; the valuation of the increment of government
output is less than that of the matched tax payments. The test can be represented also in
relative ‘cost per job’ terms. If the implied ‘cost per job’ of government expansion is
greater than that of the corresponding tax change then the public sector is too large.
Of the three devolved administrations in the United Kingdom, two of them
increased their ratios of government spending to GDP relative to the English economy
over a quarter of a century. The third maintained a ratio 80 percent higher than the
English over the period. The paper has estimated a three sector Hecksher-Ohlin model
of the economy with the greatest relative rise of the public spending ratio, Wales.
Simulation of the model showed a net gain in employment from a one percent cut in
income tax matched by a corresponding reduction in government spending. The result is
consistent with the current level of intergovernmental transfers being excessive.
Page 21 of 30
Editorial Office, Dept of Economics, Warwick University, Coventry CV4 7AL, UK
Submitted Manuscript
123456789101112131415161718192021222324252627282930313233343536373839404142434445464748495051525354555657585960
For Peer Review
22
References
Besley T and Coates S. (1999) ‘Centralised Versus Decentralised Provision of Local Public Goods: A Political Economy Analysis’ NBER working paper 7084.
Blanchflower D. G. and Oswald, A.J. (1994) The Wage Curve, MIT Press. Box, G.E.P., Pierce, D. A., (1970). Distribution of residual autocorrelations in
autoregressive integrated moving average time series models. Journal of the American Statistical Association, 65, pg. 1509-1526.
Cameron G (2000), ‘Why Did UK Manufacturing Productivity Growth Slow Down in the 1970s and Speed Up in the 1980s?’ Economica Feb. 70, 121-41
Decressin J (2002), ‘Regional Income Redistribution and Risk Sharing: How Does Italy Compare in Europe?’ Journal of Public Economics 86 (2002) 287–306.
Enders, W., Applied Econometric Time Series, New York: John Wiley & Sons, 2004.
Heald D (2003), ‘Funding the Northern Ireland Assembly: Assessing the Options’, Research monograph 10 Northern Ireland Development Office.
Heald, D. (1994), ‘Territorial Public Expenditure in the United Kingdom’, Public Administration, 72, Summer, 148-175.
Hughes Hallett, A. (2005), ‘Political Devolution without Fiscal Devolution’, Vanderbilt University, Department of Economics,Working paper 0505.
Jackman, R. and S. Savouri (1992). ‘Regional Migration versus Regional Commuting: The Identification of Housing and Employment Flows’, Scottish Journal of Political Economy 39(3), pg. 272-87.
Journard, I. and P.M. Kongsrud (2003), ‘Fiscal Relations Across Government Levels’, OECD Economic Studies 36, 2003/1.
King D, Pashley M, and Ball R (2004) ‘An English Assessment of Scotland's Education Spending Needs’ Fiscal Studies 25 4 439-467.
Ljung, G. and Box, G. (1978). "On a Measure of Lack of Fit in Time Series Models", Biometrika, 67, 297-303.
Melitz , J and Zummer F (2002) ‘Regional Redistribution and Stabilization by the Center in Canada, France, the UK and the US: A reassessment and new tests’ Journal of Public Economics 86 263–286
Midwinter A (2002) ‘The Limits to Fiscal Autonomy under the Devolution Settlement’ Scottish Affairs 41 102-120
Minford P., Stoney. P, Riley J. and Webb B. (1994). “An Econometric Model of Merseyside: Validation and Policy Simulations” Regional Studies, 28, 563-575.
Obstfeld M and Peri G (1998) Asymmetric Shocks; Regional Non-Adjustment and Fiscal Policy, Economic Policy 207-259
Persson T and Tabellini G (1996) ‘Federal Fiscal Constitutions: Risk Sharing and Redistribution’ Journal of Political Economy October
Pisauro, Giuseppe, (2001), ‘Intergovernmental Relations and Fiscal Discipline – Between Commons and Soft Budget Constraints’, IMF Working Paper 01/65.
Sanguinetti P and Tommasi M (2004) ‘Intergovernmental Transfers and Fiscal Behaviour: Insurance versus Aggregate Discipline’, Journal of International Economics 62 149– 170
Sato M (2002), ‘Intergovernmental Transfers, Governance Structure and Fiscal Decentralization’, Japanese Economic Review 53 1 March 55-76.
Tiebout, C M. (1956). ‘A Pure Theory of Public Expenditures’, Journal of Political Economy 64, 416-424.
Wildasin D E (2003) ‘Fiscal Competition in Space and Time’, Journal of Public Economics 87, pg. 2571– 2588.
Page 22 of 30
Editorial Office, Dept of Economics, Warwick University, Coventry CV4 7AL, UK
Submitted Manuscript
123456789101112131415161718192021222324252627282930313233343536373839404142434445464748495051525354555657585960

For Peer Review
23
Appendix 1 Unit Root Tests Variable# ADF Value for I (1) EMPT
* -1.730881 EMPNT
* -2.890787 WPOP* -2.751787 Real net manufacturing wage*
-2.671702
Y* -2.199194 YNT
* -2.032721 YG
* -2.77875 YT
* -2.653456 FWPOP* -1.273380 EMPG
* -2.178411 SIB* -1.371440 u_UK** -2.096756 u_W** -1.905140 EMP* -2.256045 G* -1.901133 LOW** -1.683851 SEW** -2.010703 Firms Unit Labour Costs*
-3.445898
Notes: #Unemployment rates, un_W and un_Uk, and the share of female employees in working population, FWPOP are in percentages. All other variables are in logs. *MacKinnon critical values for rejection of hypothesis of a unit root (intercept and a trend, 2 lags included). 1% Critical Value* -4.3226 5% Critical Value -3.5796 10% Critical Value -3.2239 **MacKinnon critical values for rejection of hypothesis of a unit root (only intercept, 2 lags included). 1% Critical Value** -3.6852 5% Critical Value -2.9705 10% Critical Value -2.6242
Page 23 of 30
Editorial Office, Dept of Economics, Warwick University, Coventry CV4 7AL, UK
Submitted Manuscript
123456789101112131415161718192021222324252627282930313233343536373839404142434445464748495051525354555657585960

For Peer Review
24
Appendix 2 Data Sources and Definitions: NES New Earnings Survey DWHS1 Digest of Welsh Historical Statistics 1931-1975 DWHS Digest of Welsh Historical Statistics 1974-1996 ONS Office for National Statistics, ONS web site: www.statistics.gov.ukDWS Digest of Welsh Statistics RT Regional Trends NAW National Assembly for Wales website ,
http://www.wales.gov.uk/keypubstatisticsforwales/index.htmOECD OECD National Accounts, volume 2. DWP Department of Work and Pensions MDS Monthly Digest of Statistics, ONS ODPM Office of the Deputy Prime Minister website, www.odpm.gov.uk
Definitions: Manufacturing wages (WMAN) – £/week. This is “average weekly earnings, full time manual and non-manual male”. For the 1986-2001 period the data is from NES. For the 1971-1985 period no such series is available. However, the NES reports separate time series for manual and non-manual male weekly earnings so that we re-constructed the series by assuming a constant share of manual males in total male employment of 0.7. This ratio was obtained (approximated) for year 1990 from Table 8.2, pg 159 in DWHS. To get the real wage the series was deflated by the CPI. CPI –UK consumer price index ONS, (1990=100). GDP deflator (GDPD) – ONS, (1990=100) Price of UK manufactures output (PM) – ONS, 1990=100. Working population (WPOP) – Thousands. Data for 1974-1996 from DWHS, Table 7.2, pg 137. Manufacturing, total employment (EMPT) – Thousands. Data for 2000 and 2001 was taken from the NAW. For other periods data is from RT. Total employment (EMP) – RT. Thousands. Welsh Output (Y) – £ millions, GDP at factor cost, current prices. Data from 1999 to 2001 are estimates and was taken from NAW. Data from 1974-1996 is from DWHS, Table 2.1, pg. 25.
Page 24 of 30
Editorial Office, Dept of Economics, Warwick University, Coventry CV4 7AL, UK
Submitted Manuscript
123456789101112131415161718192021222324252627282930313233343536373839404142434445464748495051525354555657585960
For Peer Review
25
Manufacturing Output (YMAN) - £ Millions. For the 1971-1990 period data is from RT (it has been multiplied by a coefficient of 1.075 for consistency because from 1996 the series has been revised backwards to 1989 by the Welsh Assembly Government to reflect the new European System of Accounts 1995 requirements, ESA95). For the 1989-1997 period it is from DWS 1999 issue, pg. 231. The 1998-2001 data from the NAW. Employment tax rate borne by the firm (taxfirm) – Percentage. To get an approximation for this we took the ratio of two indexes, namely total labour costs per unit of output divided by wages and salaries per unit of output (for the UK, whole economy). The latter is series LNNK and the former is series LNNL, both are from the ONS web site. Alternatively unit wage costs for the 1960-2001 period are in Table 3.8 in the Economic Trends Annual Supplement 2002. Income tax (taxinc) – Percentage. This has been computed as (DT+SS)/HCR where DT is direct taxes on household income, SS is the household’s contribution to social security schemes, and HCR is households’ current receipts minus employer contributions to social security schemes. All three time series were taken from the OECD National Accounts, vol 2. Ratio of females in employment (FWPOP) – Percentages. The female employees in employment series (which does not include the self-employed) obtained from RT was divided by the WPOP and multiplied by 100. Ratio of house prices Wales/South East (HP) – ODPM. Public sector employment (EMPPS) – Thousands. This is from DWHS, Table 7.3, pg 139 for the 1974-1996 period. To get a consistent time series we added employment from ‘other services’ to ‘public administration, education, and health’ for the 1974-1980 period. For the 1971-1973 period we assumed that public sector employment follows the same trend with public sector data. This is published in the row 27 in the table reporting data on insured employees from the WDHS1. Data for the 1997-2001 period was taken from various issues of DWS. Sickness and invalidity benefits (SIB) – Thousands. For the 1978-2001 period data is from DWP (e-mail). For the period prior to 1978 we used the data from RT. The table 'Sickness and Invalidity benefit: days of certified incapacity in period' in RT reports Wales data on both males and females. The time series was extended backwards for the period 1971-1978 by assuming that the 1982 ratio of the number of people who received SB to the number of days (i.e. 116/36.3) remained unchanged over the period.
Page 25 of 30
Editorial Office, Dept of Economics, Warwick University, Coventry CV4 7AL, UK
Submitted Manuscript
123456789101112131415161718192021222324252627282930313233343536373839404142434445464748495051525354555657585960
For Peer Review
26
An alternative way would be to take a fraction of the number of people who received SB in the UK during that period. Population (POP) – RT and DWHS, Thousands. Unemployment Benefits (UB) – In real terms, from the Liverpool model data file. Welsh Government Consumption (YG) - £ Millions. Obtained by multiplying the public sector average yearly wage by the number of public sector employees. Welsh Government Total Spending (G) - 1982-1996 DWHS (p.36). After 1996 various editions of DWS (DWS 1999, p.232 and DWS 2001, p.28). Public spending data for Wales was in considerable disarray in the 1970s and no consistent series could be found. Prior to 1982, G data is therefore constructed assuming that the Welsh government spending is a constant fraction of the total UK government spending.
Page 26 of 30
Editorial Office, Dept of Economics, Warwick University, Coventry CV4 7AL, UK
Submitted Manuscript
123456789101112131415161718192021222324252627282930313233343536373839404142434445464748495051525354555657585960
For Peer Review
27
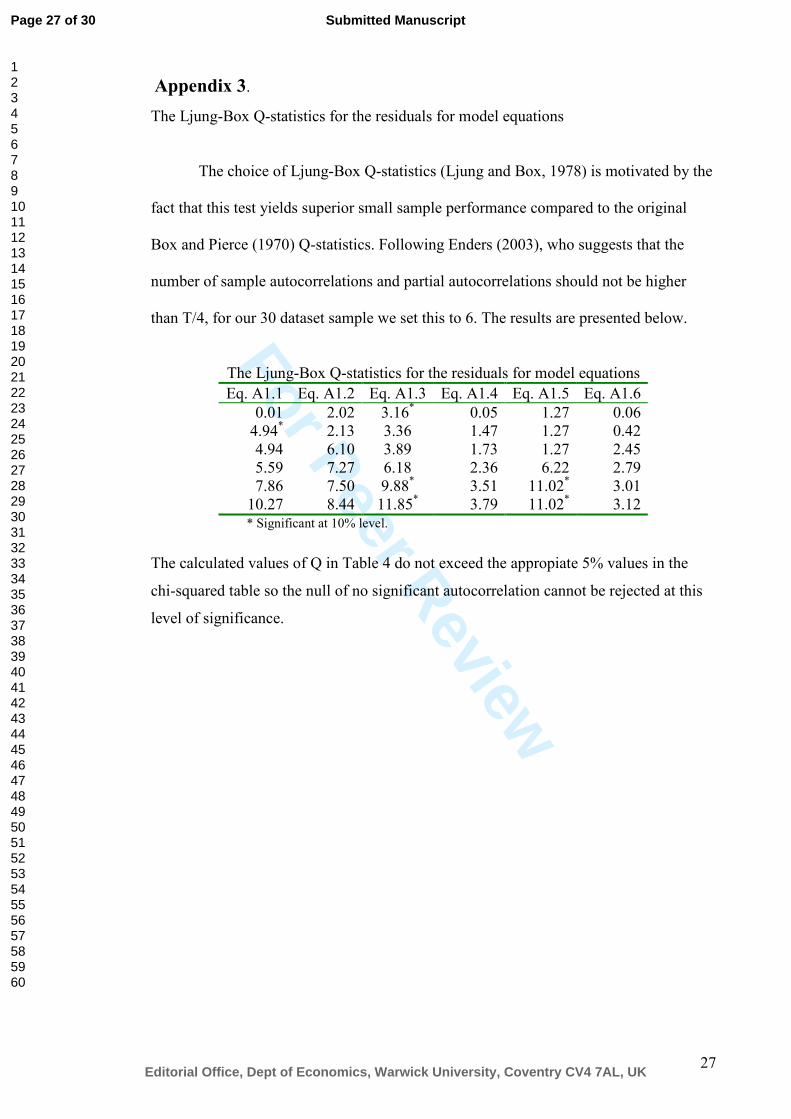
Appendix 3.The Ljung-Box Q-statistics for the residuals for model equations
The choice of Ljung-Box Q-statistics (Ljung and Box, 1978) is motivated by the
fact that this test yields superior small sample performance compared to the original
Box and Pierce (1970) Q-statistics. Following Enders (2003), who suggests that the
number of sample autocorrelations and partial autocorrelations should not be higher
than T/4, for our 30 dataset sample we set this to 6. The results are presented below.
The Ljung-Box Q-statistics for the residuals for model equations Eq. A1.1 Eq. A1.2 Eq. A1.3 Eq. A1.4 Eq. A1.5 Eq. A1.6
0.01 2.02 3.16* 0.05 1.27 0.064.94* 2.13 3.36 1.47 1.27 0.424.94 6.10 3.89 1.73 1.27 2.455.59 7.27 6.18 2.36 6.22 2.797.86 7.50 9.88* 3.51 11.02* 3.01
10.27 8.44 11.85* 3.79 11.02* 3.12* Significant at 10% level.
The calculated values of Q in Table 4 do not exceed the appropiate 5% values in the chi-squared table so the null of no significant autocorrelation cannot be rejected at this level of significance.
Page 27 of 30
Editorial Office, Dept of Economics, Warwick University, Coventry CV4 7AL, UK
Submitted Manuscript
123456789101112131415161718192021222324252627282930313233343536373839404142434445464748495051525354555657585960
For Peer Review
28
Figure 1. Intergovernmental transfers and state employment
Table 1. Regional UK public expenditure to GDP as a ratio of England’s public expenditure to GDP, 1976-2001
Source: Public Expenditure Statistical Analysis (PESA) HM Treasury, various issues (PESA 1998-1999 Tables 7.2B, 7.3B, 7.4B, 7.5B and 7.6B; PESA 2002-2003 Tables 8.3B and 8.4B, PESA 2004-2005 Table 8.1). The 1976 figure has been calculated by multiplying the ratio of devolved spending per head (taken from Table 3, HM Treasury, 1979) by the GDP per capita ratio (England relative to region).
Year Scotland Wales Northern Ireland
North East England
1976 1.27 1.20 1.88 n/a 1992 1.24 1.46 1.83 n/a 1997 1.27 1.49 1.78 n/a 2001 1.34 1.51 1.80 1.56
Aggregate private sector supply
Real exchange rate =(w/P)k
Private sector output
HOS equilibrium value =f(MPL)=e**
Primary current account balance
Inter-govt transfers and imports Private sector
output Demand for output
Private supply when government uses more local labour
Page 28 of 30
Editorial Office, Dept of Economics, Warwick University, Coventry CV4 7AL, UK
Submitted Manuscript
123456789101112131415161718192021222324252627282930313233343536373839404142434445464748495051525354555657585960

For Peer Review
29
Table 2: Estimated Model EquationsA1.1 [ ] FWPOPBENRPITWTIMEEMP WYTT *085.0)log(*54.0/)1(*log*54.0*05.028.101)log(
)42.6()36.2()23.10()28.11(+−−+−=
−
A1.2 [ ] [ ] )(*036.0/)1(*log*94.0)log()/log(*88.0)log(16.0)/log()60.2()31.2(1)81.6()34.0(
FWPOPPTWEMPPYEMPPY MEMPTTMTTMT −− −++−++=A1.3 )/log(73.0]/)1(log[48.0]/)1)(1(log[80.071.0)/log(
)78.2(1)71.1(1)28.7()67.0( MNTMYTWEMPYWNT PPPTYRPITTGRPIY−−−−
−−+−−+−=A1.4 [ ] 1)24.2()31.2()31.2(
)log(*48.0)/log(*52.0/)1(*log*48.057.1)log( −−+++−= NTNTNTNTEMPNTNT EMPPYPTWEMP
A1.5 )/log(*053.0)/log(15.0)/log()01.2()31.1( WWTWNT RPIGRPIWRPIW ++−=
−
A1.6 )log(*258.0_*003.0)log(*106.0)log(*087.0)log(037.0)log(*259.0154.4)log()85.6()29.4()15.2()32.2()08.3()69.6()81.20( GNT EMPUKuSEWLOWSIBEMPWPOP +++−−+=
−−
A1.7 GNTT YYYY ++=A1.8 GNTT EMPEMPEMPEMP ++=A1.9 [ ] 100*/1_ WPOPEMPWu −=A1.10 MNTW PPRPI *25.0*75.0 +=(t – statistics in parentheses)
Y – Welsh output (billions £)YNT – Welsh non-manufacturing output (billions £)YT – Welsh manufacturing output (billions £)YG – Welsh government spending (billions £)G – Welsh government spending, including transferpayments (billions £)EMP – Welsh Employment (thousands)EMPT – Welsh manufacturing employment (thousands)EMPNT – Welsh non-manufacturing employment (ths.)EMPG – Welsh public sector employment (thousands)u_UK – UK unemployment rate (%)u_W – Welsh unemployment rate (%)WT – Welsh manufacturing wage (£, weekly, gross)WUK – Average UK wage (£, gross, weekly)
WNT – Non-traded Welsh wage (£, gross, weekly)TY – Welsh employees’ income taxTEMP – Welsh employers’ income taxTYUK – UK income taxBEN – Unemployment benefitsFWPOP – Welsh ratio of females in working populationSIB – Welsh claimants of sickness benefits (thousands)LOW – London-Wales relative house pricesSEW – South-East – Wales relative house pricesWPOP = Welsh working population (thousands)PM – Manufactures prices (1990=100)PNT – Welsh non-treaded price index (1990=100)RPI – UK Retail Price Index (1990=100)RPIW – Welsh Cost of Living Index (1990=100)
Equation number DW R squaredA1.1 2.00 0.90A1.2 2.45 0.97A1.3 1.17 0.69A1.4 2.00 0.85A1.5 1.60 0.12A1.6 2.00 0.97
Page 29 of 30
Editorial Office, Dept of Economics, Warwick University, Coventry CV4 7AL, UK
Submitted Manuscript
123456789101112131415161718192021222324252627282930313233343536373839404142434445464748495051525354555657585960
For Peer Review
30
Table 3. Impact of Hypothetical Reductions of Devolved Taxes and Increases in Public Spending (differences from the base run)
(1) -1p in £ Income tax
(2) -1% Employment tax (and fall in manufacturing wage)*
(3) +1.24% Government spending
GDP +0.65% +0.42% +0.68% Manufacturing output
+0.63 % +0.48 % -
Public sector output
- - +1.24%
Non-Manufacturing output
+1.60% +0.92% +0.99%
Employment +0.54 % (6,700)
+0.34 % (4,260)
+0.33% (4,070)
Non-Manufacturing Employment
+0.84 % (4,400)
+0.48 % (2,500)
+0.48% (2,500)
Manufacturing employment
+0.63 % (2,300)
+0.48 % (1,760)
-
Public sector employment
- - +0.44% (1,570)
Working population
+0.22 % +0.12 % +0.24%
Unemployment rate
-0.33 % -0.23 % -0.09%
Source: Simulations of the model of Table 3. Notes: Number of jobs in parentheses - the estimates are for the year 2001 * The yield of the one percent cut in employment tax is less than that of the one percent income tax.
Page 30 of 30
Editorial Office, Dept of Economics, Warwick University, Coventry CV4 7AL, UK
Submitted Manuscript
123456789101112131415161718192021222324252627282930313233343536373839404142434445464748495051525354555657585960