FISCAL DECENTRALIZATION AND LOCAL ECONOMIC …
175
i FISCAL DECENTRALIZATION AND LOCAL ECONOMIC DEVELOPMENT: A CASE STUDY OF THE BUILSA NORTH DISTRICT, GHANA. BY ALBERT AGOABEY ANAMOGSI (10240645) THIS THESIS IS SUBMITTED TO THE UNIVERSITY OF GHANA, LEGON IN PARTIAL FULFILLMENT OF THE REQUIREMENT FOR THE AWARD OF MPHIL PUBLIC ADMINISTRATION DEGREE. JULY, 2016 University of Ghana http://ugspace.ug.edu.gh
Transcript of FISCAL DECENTRALIZATION AND LOCAL ECONOMIC …

i
FISCAL DECENTRALIZATION AND LOCAL ECONOMIC
DEVELOPMENT: A CASE STUDY OF THE BUILSA NORTH
DISTRICT, GHANA.
BY
ALBERT AGOABEY ANAMOGSI
(10240645)
THIS THESIS IS SUBMITTED TO THE UNIVERSITY OF GHANA,
LEGON IN PARTIAL FULFILLMENT OF THE REQUIREMENT FOR
THE AWARD OF MPHIL PUBLIC ADMINISTRATION DEGREE.
JULY, 2016
University of Ghana http://ugspace.ug.edu.gh

I
DECLARATION
I do hereby declare that this thesis is the result of my own research undertaken under
supervision and has not been submitted in part or in full to this institution or any other
institution for academic award. All citations and quotations have been identified and duly
acknowledged. I bear sole responsibility for any shortcomings.
………………………….. ………………………
ALBERT AGOABEY ANAMOGSI DATE
University of Ghana http://ugspace.ug.edu.gh

II
CERTIFICATION
This is to certify that this thesis was supervised in accordance with the laid down rules and
procedures as required by the University of Ghana.
…………………………………. ……….……………
RICHARDSON AZUNU (PhD) DATE
(SUPERVISOR)
University of Ghana http://ugspace.ug.edu.gh

III
DEDICATION
I dedicate this work to my lovely family especially my mother, Mrs. Azumah Anamogsi whose
love and commitment has brought me this far and to Miss. Grace Anamogsi, Mrs. Valeria
Avani and my daughter Miss. Jean Akankpabwon Anamogsi.
University of Ghana http://ugspace.ug.edu.gh

IV
ACKNOWLEDGEMENT
I am highly grateful to Almighty God in whose grace I have been sustained throughout from
the beginning to today. I also thank my family for praying for me all the time.
I am indebted to all those who have contributed to the accomplishment of this work. I would
also give special thanks to my supervisor, Dr. Richardson Azunu who kindly devoted much of
his time to supervise this work. I owe a lot of appreciation to the Department of Public
Administration and Health Services Management for giving me the opportunity to pursue this
programme successfully. I am very thankful to the Head of Department, Dr. Justice N. Bawole
for his inspiration and to Dr. James Mensah for his constructive critique to my work. Thanks
to Dr Kwame Asamoah for your materials and guidance during the seminar presentation. An
appreciation to Dr Daniel Appiah and to Mr. Ibrahim Mohammed for reviewing my work in
spite of your busy schedules. Thanks to all lecturers of the department for their various
contribution to the work.
I also extend my acknowledgement to the staff of the Builsa North District Assembly, most
especially the District Coordinating Director, Mr Alhaji Fuseni Al-Hassan, the District Director
of Education, Mr. Clement A. Abakisi, the Business Advisory Centre Head, Mr. Roger Akeeda
Awimbe, the District Finance Officer, Mr. Abdul Bafip Zubero for offering me valuable
information and assistance during my data collection.
I also want to express my profound gratitude to the District Chief Executive, Hon. Solomon
Kuyon and the District Coordinating Director Mr. Emmanuel Amoah of the Krachi Nchumuru
District Assembly for contributing significantly to the success of my work. Thank you for your
kindness. Thanks to Mr. Victor Eninful for your support in the data collection.
Finally, I thank Mr. Dominic Hotor and everyone who has contributed in one way or the other
in making this work a success.
University of Ghana http://ugspace.ug.edu.gh

V
TABLE OF CONTENTS
DECLARATION ....................................................................................................................... I
CERTIFICATION .................................................................................................................... II
DEDICATION ......................................................................................................................... III
ACKNOWLEDGEMENT ....................................................................................................... IV
TABLE OF CONTENTS .......................................................................................................... V
LIST OF TABLES ................................................................................................................... XI
LIST OF FIGURES ............................................................................................................... XII
LIST OF ABBREVIATIONS ............................................................................................... XIII
ABSTRACT .......................................................................................................................... XVI
CHAPTER ONE ........................................................................................................................ 1
GENERAL INTRODUCTION .................................................................................................. 1
1.0. Introduction ................................................................................................................. 1
1.1. Research Background .................................................................................................. 1
1.2. Statement of the Research Problem ............................................................................ 7
1.3. Objectives of the Study ............................................................................................. 10
1.4. Research Questions ................................................................................................... 11
1.5. Significance of the Study .......................................................................................... 11
1.6. Scope of the study ..................................................................................................... 12
1.7. Research Outline ....................................................................................................... 12
CHAPTER TWO ..................................................................................................................... 13
LITERATURE REVIEW ........................................................................................................ 13
University of Ghana http://ugspace.ug.edu.gh

VI
2.0. Introduction ............................................................................................................... 13
2.1. Search Strategy and Results ...................................................................................... 13
2.2. Literature and Theoretical Framework ...................................................................... 13
2.2.1. The Classical Theory of Fiscal Decentralization ............................................... 14
2.2.2. Decentralization ................................................................................................. 15
2.2.3. Fiscal Balance .................................................................................................... 20
2.3. Decentralization in Ghana ......................................................................................... 22
2.3.1. The History of Decentralization in Ghana ......................................................... 23
2.3.2. History of Ghana’s Decentralization From (1957- 1987) .................................. 24
2.3.3. Decentralization in 1988 and Beyond ................................................................ 27
2.3.4. The Composition of the New Local Government System ................................. 27
2.3.5. The Regional Coordinating Council (RCC) ...................................................... 28
2.3.6. The District Assembly (DA) .............................................................................. 29
2.3.7. Sub-District Political / Administrative Structure ............................................... 32
2.4. Advantages and Disadvantages of Fiscal Decentralization....................................... 33
2.4.1. Advantages of Fiscal Decentralization .............................................................. 34
2.4.2. Disadvantages of decentralization ..................................................................... 36
2.5. Local Economic Development .................................................................................. 38
2.5.2. Regional and Local Economic Development Theory ............................................. 39
2.5.3. Attraction Theory ................................................................................................... 41
2.5.4. Conceptual Framework........................................................................................... 41
University of Ghana http://ugspace.ug.edu.gh
VII
2.5.5. Actors of LED ........................................................................................................ 44
2.5.6. Determining the LED Factors................................................................................. 46
2.5.7. Local Economic Development in Ghana ................................................................ 49
2.5.8. Selecting a Local Economic Development Role .................................................... 50
2.5.9. The Dualistic Model of LED ............................................................................. 53
2.5.10. Importance of LED ............................................................................................ 55
2.5.11. Challenges of Local Economic Development.................................................... 56
2.6. Fiscal Decentralization to Facilitate Local Economic Development ........................ 58
2.7. Empirical Studies ...................................................................................................... 62
2.7.1. Positive Relationship between Fiscal Decentralization and Economic Development
.......................................................................................................................................... 62
2.7.2. Negative Link between Decentralization and Economic Development ................. 64
2.8. Conclusion ................................................................................................................. 66
CHAPTER THREE ................................................................................................................. 67
METHODOLOGY .................................................................................................................. 67
3.0. Introduction ................................................................................................................... 67
3.1. Research Setting ............................................................................................................ 67
3.2. Builsa North District in Context.................................................................................... 67
3.2.1. Demographic Characteristics .................................................................................. 68
3.2.2. Administrative and Political Set up ........................................................................ 68
3.2.3. The Local Economy ................................................................................................ 70
3.2.4. Justification for the Study Area ......................................................................... 72
University of Ghana http://ugspace.ug.edu.gh
VIII
3.3. Research Design ........................................................................................................ 73
3.3.1. Study and Target Population .................................................................................. 74
3.3.2. Sampling Techniques and sampling size ................................................................ 75
3.4. Method of Data Collection ........................................................................................ 75
3.4.1. Sources of Data ....................................................................................................... 76
3.4.2. Data Collection Procedure ...................................................................................... 76
3.4.3. Questionnaire Administration ................................................................................. 77
3.4.4. Document Analysis................................................................................................. 77
3.4.5. In-depth interviews ................................................................................................. 77
3.5. Measures of Fiscal Decentralization and LED .......................................................... 78
3.6. Data presentation and Instruments for Data Analyses .............................................. 78
3.7. Ethical Considerations............................................................................................... 79
3.8. Limitations of the Study ............................................................................................ 80
3.9. Chapter Conclusion ................................................................................................... 81
CHAPTER FOUR .................................................................................................................... 82
RESULTS AND DISCUSSION .............................................................................................. 82
4.0. Introduction ............................................................................................................... 82
4.1. Demographic Characteristics of Respondents........................................................... 82
4.2. Contribution of Fiscal Decentralization to LED ....................................................... 83
4.2.1. Provision of infrastructure ...................................................................................... 83
4.2.2. Social Services ................................................................................................... 85
University of Ghana http://ugspace.ug.edu.gh

IX
4.2.3. Citizens’ involvement in District Development Planning ................................. 87
4.2.4. Support for Micro Small Medium Enterprise Developments ............................ 89
4.2.5. Employment Creation ........................................................................................ 91
4.2.6. Assessing the General Environment for LED .................................................... 91
4.3. Factors Inhibiting Effective Fiscal Decentralization in Ghana ................................. 93
4.3.1. Sources of Revenue and Revenue generation capacity ...................................... 93
4.3.2. Internal Generated Fund Performance ............................................................... 94
4.3.3. All Revenue Performance .................................................................................. 96
4.3.4. Expenditure Patterns ............................................................................................... 99
4.3.5. Revenue and Expenditure Autonomy of the District Assembly ...................... 100
4.4. Factors Inhibiting Local Economic Development in the District ........................... 105
4.4.1. Administrative factors ...................................................................................... 106
4.4.2. Cultural Barriers............................................................................................... 110
4.5. The Actors of LED and Their Roles ....................................................................... 111
4.5.1. The role of the District Assembly in contributing to LED .............................. 112
4.5.2. The Role of NGOs and Donor Agencies ......................................................... 116
4.5.3. The Role of Individuals/ Community Based Organisations in Local
Development ................................................................................................................... 119
4.5.4. Benefits of the LED programme in the District ............................................... 119
4.6. Conclusion ............................................................................................................... 120
CHAPTER FIVE ................................................................................................................... 121
SUMMARY, CONCLUSION AND RECOMMENDATIONS ............................................ 121
University of Ghana http://ugspace.ug.edu.gh

X
5.0. Introduction ................................................................................................................. 121
5.1. Summary of Findings .................................................................................................. 121
5.1.1. Contribution of Fiscal decentralization to LED ................................................... 121
5.1.2. Constraints of Fiscal Decentralization .................................................................. 125
5.1.3. What are the Factors Hindering the Promotion of LED in the District? .............. 128
5.1.4. Actors of LED and their Roles ............................................................................. 130
5.2. Conclusion ................................................................................................................... 131
5.3. Recommendation ......................................................................................................... 133
5.3.1. Policy Recommendations ..................................................................................... 133
5.3.2. Recommendation for Further Research ................................................................ 136
REFERENCES ...................................................................................................................... 137
APPENDICES ....................................................................................................................... 149
APPENDIX ONE ............................................................................................................... 149
Structured Questionnaire ................................................................................................ 149
APPENDIX TWO .............................................................................................................. 155
Interview Guide .............................................................................................................. 155
APPENDIX THREE .......................................................................................................... 156
APPENDIX FOUR ............................................................................................................ 156
APPENDIX FIVE .............................................................................................................. 158
University of Ghana http://ugspace.ug.edu.gh

XI
LIST OF TABLES
Table 2.1. Definition of LED Factors ...................................................................................... 47
Table 4.1. Demographic Information of Respondents……………………………………….82
Table 4.2: Infrastructural Development in the District ........................................................... 84
Table 4.3: Provision of Social Services .................................................................................. 86
Table 4.4: Disbursement of DACF based on Sectors .......................................................... 104
Table 4.5: The Actors or Agents of LED .............................................................................. 112
Table 4.6: Japan Social Development Programme 2015 Action Plan .................................. 118
Table of Sub-Metropolitan Councils .................................................................................... 157
University of Ghana http://ugspace.ug.edu.gh

XII
LIST OF FIGURES
Figure 2.1. The Local Government Structure .......................................................................... 28
Figure 2.2. Structure of the Conceptual Framework................................................................ 42
Figure 4.1: Citizens Participation in Local Development ........................................................ 88
Figure 4.2: Micro Small, Medium Enterprise development in the District ............................ 90
Figure 4.3: Assessment of the General Environment for Local Business Development ........ 92
Figure 4.4: Summary of IGF Performance Trends ................................................................. 94
Figure 4.5: IGF Trends by Revenue Heads from 2013 to 2015 .............................................. 96
Figure 4.6: Summary of Comparative Analysis of all Revenue Sources ............................... 98
Figure 4.7: Expenditure patterns ............................................................................................. 99
Figure 4.8: 2015 Expenditure patterns .................................................................................. 100
Figure 4.9: Factors Hindering Local Economic Development in the District ....................... 106
Figure 4.10: The Role of the District Assembly ................................................................... 115
Figure 4.11: The Role of NGO’s in LED ............................................................................. 117
Figure 4.12: The Role of Individuals/ Community Organisations in Local Development ... 119
Figure 4.13: The Benefits of LED Programmes in the District ............................................ 120
Flowchart of the search on fiscal decentralization and LED ................................................ 156
Figure 3.1. Map of Builsa North District .............................................................................. 158
University of Ghana http://ugspace.ug.edu.gh

XIII
LIST OF ABBREVIATIONS
AAP: Annual Action Plan
AIDS: Acquired Immune Deficiency Syndrome
BNDA: Builsa North District Assembly
BAC: Business Advisory Centre
CBR: Community Based Rehabilitation
CGs: Central Governments
CEPS: Customs Excise and Preventive Service
CHPS: Community Based Health Planning System
DA: District Assembly
DACF: District Assembly Common Fund
DADU: District Agricultural Development Unit
DCD: District Coordinating Director
DCE: District Chief Executive
DDF: District Development Fund
DFO: District Finance Officer
DHD: District Health Directorate
DISEC: District Security Council
DMTDP: District Medium Term Development Plan
University of Ghana http://ugspace.ug.edu.gh

XIV
EXECO: Executive Committee
FD: Fiscal Decentralization
FDU: Fiscal Decentralization Unit
FOAT: Functional and Organizational Assessment Tools
GES: Ghana Education Service
GSGDA: Ghana Shared Growth and Development Agenda
GSOP: Ghana Social Opportunities Project
GSS: Ghana Statistical Services
GLSS: Ghana Living Standard Survey
HND: High National Diploma
HIV: Human Immuno-deficiency Virus
ICT: Information Communication Technology
IGF: Internally Generated Fund
ILGS: Institute of Local Government Studies
IMF: International Monetary Fund
JSDF: Japan Social Development Fund
LDC: Less Developed Countries
LED: Local Economic Development
LGs: Local Governments
University of Ghana http://ugspace.ug.edu.gh

XV
LGS: Local Government System
LU: Local Units
MLGRD: Ministry of Local Government and Rural Development
MMDA: Metropolitan, Municipal and District Assemblies
MMDCE: Metropolitan, Municipal, District Chief Executive
MOFA: Ministry of Food and Agriculture
MoFEP: Ministry of Finance and Economic Planning
MTDP: Medium Term Development Plan
MSE: Micro Small Enterprise
MSME: Micro Small Medium Enterprise
NBSSI: National Board for Small Scale Industries
NGO: Non- Governmental Organisations
PM: Presiding Member
PNDC: Provisional National Defence Council
RCC: Regional Coordinating Council
REP: Rural Enterprise Programme
RLED: Regional and Local Economic Development
SME: Small Medium Enterprise
UNDP: United Nations Development Programme
UNICEF: United Nations International Children’s Emergency Fund
University of Ghana http://ugspace.ug.edu.gh

XVI
ABSTRACT
Local Economic Development (LED) is increasingly gaining the attention of governments
especially in developing countries. In Ghana, LED has been adopted as a development strategy
to enable local governments in partnership with community groups and private sector create
employment and boost local development using the resources available. The study has
investigated the degree to which Fiscal Decentralization (FD) has contributed to LED at the
district level. Using qualitative research method, the study found that, fiscal decentralization
thus facilitates LED but with minimal effects. The district has a very low IGF base resulting in
its heavy reliance on central government, which undermines its fiscal autonomy. Local
economic development of the district is largely dependent on the interventions of central
government and donor supports and rarely could provide basic services for the people with its
own sources of funds. The study has contributed to the understanding of the theoretical link
between FD and LED and recommended that more research is needed from different
approaches to identify the best strategies to increase local revenue and expenditure autonomy
without causing negative developmental consequences.
University of Ghana http://ugspace.ug.edu.gh

1
CHAPTER ONE
GENERAL INTRODUCTION
1.0. Introduction
This section provides general overview of the study under the various headings; the research
background, the statement of the research problem, the study objectives and questions. The
scope of the research as well as the chapter outline is also provided in this section.
1.1. Research Background
The manner in which the public sector of a country is organised shows its history, political and
geographical characteristics that may distinguish it sharply from other countries (Bird &
Vaillancourt, 1998). Many developing countries have undergone reforms with the aim of
achieving national, regional and local development. In Ghana, fiscal decentralization has been
adopted to equip local authorities to provide education, employment for the youth and basic
services for the population particularly in the informal sector that depend on petty trading,
informal vending and many more. It is perceived that fiscal decentralization will help boost the
local industries that would consequently generate employment for the people.
The rising rate of unemployment among the growing workforce is a major concern that has not
only gained the attention of governments in developing countries but also it has become a
rallying call for increasing the pace of local economic development. In Ghana, as the proportion
of unemployment is widening nationally, pressure is mounted on local authorities to develop
or enlarge local economic policies for the growth of industries to meet the increasing
expectations of unemployed populace (Townroe, 1979). Majority of the districts (in the Upper
East Region) including the Builsa North District have created units/ departments with special
staff responsible for local economic policy planning and development. Others have relied on
existing officers from planning departments to lead these special units within the Assemblies.
University of Ghana http://ugspace.ug.edu.gh

2
The Business Advisory Centre (BAC) is a unit under the National Board for Small Scale
Industries (NBSSI) at the district level responsible for implementing rural enterprise
programmes. Whilst such initiatives are commendable, it has become evident that districts
require both financial autonomy and human resource capacity to be able to revitalise local
economic development to create employment and better the conditions of living of the people.
This implies that fiscal decentralization is invariably a major pillar in achieving this result.
Since Ghana’s adoption of decentralization programme and the passage of the Local
Government Act, 1993 (Act 462), every district is allowed to generate its own internal funds
in addition to government grants that are meant for the development of its localities. Districts
therefore, have to identify their potentials in order to explore to create more jobs for the people.
Local governments must therefore carry out local economic programmes themselves or in
partnership with community based organisations and private bodies to create favourable
environment to induce local development.
Local economic development has become a significant development strategy in recent times
for many developing countries and policy analysts (Rodriguez-Pose & Kroijer, 2009).
Countries that strive to develop have either tried to implement or are still implementing various
policies including fiscal decentralization to enhance efficiency in economic development. It is
in this light that, empirical evidence is urgently needed to investigate how fiscal
decentralization (FD) promotes local economic development (LED) and to identify LED actors
and their roles within the local level.
Decentralization is inspired by fairly diverse motives. While some countries all over the world
are trying for numerous motives and with different degrees of success and intentions to
establish and implement local units in earnest for development, decentralization still remains a
complex and elusive concept (Smoke, 2003). Many unitary countries have viewed
decentralization in the past as a way of finding or searching for a more effective and efficient
University of Ghana http://ugspace.ug.edu.gh

3
public sector. This is because some countries have become dissatisfied with the performance
of previous planning and centralization of programs.
As some of the literature on decentralization tends to identify the problems, other writers tend
to focus on the circumstantial instances of its benefits and success. Although there is no much
empirical evidence that points to the benefits of decentralization and the methods to achieve its
perceived benefits, some policy experts and decision makers recommend the adoption of
decentralization in many countries. This is because of a number of reasons as identified by
Smoke (2003) as follows:
First, the push for decentralization in Africa is partly due to pressure from international
development bodies and partly as a consequence of the failure of centralised approach to
development (Smoke, 2003; Akudugu, 2013).
Secondly, decentralization is sometimes regarded as all-encompassing to the extent that, it
seems to have limited the duties and roles of the central government. Quite important is the
difficulty of measuring decentralization. Measuring fiscal decentralization for instance can be
a challenge. Though some scholars have used the proportion of local government expenditure/
revenue to national expenditure/ revenue as a proxy for fiscal decentralization, this could not
measure the degree of fiscal autonomy and the level of accountability of District Assemblies
(Smoke, 2003; Xie, Zou & Davoodi, 1999).
Thirdly, Smoke (2003, p. 8) in his article pointed out that, “much of the literature on the topic
emphasise the fact that the decentralization is almost invariably complex”. Decentralization is
difficult to design and to understand and due to its’ various forms and nature, its
implementation usually takes time and vary across countries. The complexity of this issue is
further deepened by the compartmentalisation of the phenomenon by scientists in the
discipline. Scholars of the different dimension of decentralization still have different views of
University of Ghana http://ugspace.ug.edu.gh

4
decentralization and therefore focus only on their area of interest. While political scientists
focus on the political decentralization (that is local elections, intergovernmental transfers, and
accountability factors); economists look at the fiscal and economic dimension; public
administrators deal with institutional functions, processes and procedures, it must be noted that
all these dimensions are functionally integrated and must be considered collectively (Smoke,
2003; Martinez-Vazquez, Lago-Penasand & Sacchi, 2015).
Finally, it is worthy to note that, interested persons who stand to benefit or otherwise would
push either for or against decentralization. Based on these different perceptions of
decentralization, it has been considered in many developing countries based on different
reasons that sometimes may produce some evidence of its benefits to inform sound decision
making. Since countries are different and may adopt different styles or forms of
decentralization, the concept of decentralization may or may not be clearly defined. Any
country or institution that has a specific view of decentralization might find subjective evidence
to support its claims. At the end, decentralization has either been endorsed or rejected by
decision makers without proper recourse to how well to design it in order to achieve at
maximum, the intended benefits and constrain its’ potential problems (Smoke, 2003).
In fact, decentralizing governance ensures public confidence in public policies and a general
basis for wider policy agreement (Martinez-Vazquez, et al., 2015). Martinez-Vazquez and
others opined that, some countries may even use decentralization as a political opportunity for
merely electoral purposes though, fiscal decentralization is perceived to be concerned with the
way the public sector is structured to create enabling environment for economic development.
Ghana since 1988 has executed inclusive local government and decentralization reforms as a
substitute development approach to centralize planning and administration. The
decentralization policy is operated on four key interrelated areas namely fiscal decentralization,
University of Ghana http://ugspace.ug.edu.gh

5
political decentralization, administrative decentralization and decentralized planning. Several
years after, another dimension that has received, an increasing attention was public–private
partnerships. Many years of implementation of the policy has resulted in positive successes
including the establishment of two hundred and sixteen (216) local governments, the allocation
of authority, responsibilities and resources from the national to local governments. In addition,
infrastructural development and awareness creation among citizens with support from the
District Assemblies Common Fund (DACF) and augmented partnership between localities and
development partners (MLGRD), 2010).
The MLGRD (2010) however noted that, important issues require attention and proposed
solutions. Several years of implementation has witnessed incoherence and contradictions in
various approaches to decentralization. The first refers to the need to clarify the role of the
region in the national government structure. The second is continuing delay in incorporating
the decentralized departments into the assembly administration structure and the
implementation of fiscal decentralization. The third is the lack of effective local government
sub-structures. The fourth is low motivation and capacities of local authorities (assembly
members). Finally, general involvement in local governance should be encouraged and
streamlining relationships with traditional rulers.
To deepen development at the local level, LED policies were therefore incorporated into the
District Medium Term Development Plans (DMTDP) and Annual Action Plans (AAP) to
ensure that local authorities through participatory approach with community base organisations
and private bodies are able to identify and find solutions to local enterprises and community
development needs. Currently, some Districts including Bongo District Assembly, Amansie
District Assembly, Central Gonja District Assembly, Berekum Municipal Assembly, Wa
Municipal Assembly, Kassena-Nakana East District Assembly, Tamale Metropolitan
University of Ghana http://ugspace.ug.edu.gh

6
Assembly and Sissala West District Assembly were piloted for LED programmes (Akudugu,
2013).
The promotion of local citizens’ economic rights such as access to credit facilities, market,
good roads, electricity, food security, quality education and alternative source of livelihood
would help to improve the local economic development of the local areas. To what extent are
these economic rights granted to citizens by the District Assemblies (DAs) as a result of the
yearly income generation and donor funds support? Any attempt to explain the failure of DAs
to provide these facilities, would usually be pointed down by officials of the DA as lack of
resources being their main challenge. Unfortunately, it is not feasible to ascertain the truth or
to deliberate on the fiscal capacity of local governments in details as the top officials would be
reluctant to disclose information regarding their revenues and expenditures. A situation
described by Crawford (2010, p. 115) as “displaying a disturbing lack of transparency”. Despite
this, it is usually believed that, the two main sources of revenue (District Assembly Common
Fund and Internally Generated Fund) to the DAs are insufficient.
This is due to first, the challenge of raising internal income in deprived districts dwelled by
people with critical income poverty. They rarely can contribute to increase Internally Generated
Fund (IGF) as compared with relatively well-to-do districts. Secondly, though every district
receives the share of District Assembly Common Fund (DACF), it remains a small fraction,
unpredictable flow and highly controlled by the central government in relation to how it should
be disbursed. Many central governments just like Ghana may be more prepared to transfer and
reduce responsibilities to the local units than to devolve proportionate financial power
(Crawford, 2010).
The current study therefore seeks to investigate how FD contributes to LED in Ghana, the
barriers to effective FD and LED, to contribute to knowledge base as well as make
recommendations to inform policy formulation and implementation.
University of Ghana http://ugspace.ug.edu.gh

7
1.2. Statement of the Research Problem
The context of local economic development is very critical in determining the success or
otherwise of LED. In developed countries, there is increasing demand for local goods and
services and the presence of meso-level institutions facilitate the growth of local businesses
(Helmsing, 2003). The absence of these meso-level institutions at local sectors and areas
impede investment responses by households and enterprises. It has frequently been perceived
that Africa and more specifically Sub-Saharan Africa in particular, is different and as a result
needs unique solutions to its development problems. The adoption of diverse strategic plans
with common trends comparable to those practised by other countries in the world can make
LED successful in Sub-Saharan Africa as in other developing or middle and low income level
countries (Rodriguez-Pose & Tijmstra, 2007). This suggest that, “the likelihood of success of
LED depends on place specific conditions” (Rodriguez-Pose & Tijmstra, 2007, p. 536). This
view has also been supported by Rogerson (2014, p. 203) that “LED planning is a place-based
approach to development planning” which has recently assumed increasing importance across
the global south.
It is evident that most LED studies focused extensively on South Africa and some developed
nations (Rogerson & Rogerson, 2010; Rogerson, 2010; Rogerson, 2014). Other scholars
focused on LED in a more generalised context (Helmsing, 2003; Bergt, 2007). As it is now,
there is a lot more of LED studies on South Africa than on any other Sub-Saharan African
country (Rogerson & Rogerson, 2010). However, little attention has been given to developing
countries such as Ghana even though the primacy of LED for overall development in
developing countries, including Ghana, has been highlighted in the extant literature. Since LED
planning is more likely to be successful when place based approach is adopted (Rogerson,
2014) and depended on place specific conditions (Rodriguez-Pose & Tijmstra, 2007), other
University of Ghana http://ugspace.ug.edu.gh

8
countries like Ghana should also be given greater attention to identify successful strategies for
LED.
This also suggests that, there is the need to correct the regional imbalances, not least because
lessons from other developing countries contexts could be useful in enhancing LED efforts as
well as broadening the frontiers of knowledge. More precisely other context specific studies
would be very relevant in closing the context gap.
Most of the wealthy countries on the African continent at present have the enabling
environment and conditions in place for designing and implementing LED strategies
(Rodriguez-Pose & Tijmstra, 2007). Unfavourable conditions, less resources, poor
accessibility and weak civil society can undermine the success of LED. However, deprived
areas, regions and districts that lack some of the preconditions for LED may still achieve
success by capacity building (Rodriguez-Pose & Tijmstra, 2007) and fiscal support. More
over, the essence of fiscal decentralization is to enable district assemblies generate their own
resources to stimulate local development. This is however not the case for most districts in
Ghana including Builsa North District as they are unable to generate enough internal revenue
but rather rely heavily on government transfers which flow is often times delayed and
unpredictable (see Builsa North District Composite Budget, 2015). This also raises doubts
about the nature and extent of Ghana’s FD and the factors that inhibit its full realization.
Extensive studies have been done on LED planning (Helmsing, 2003; Rogerson & Rogerson,
2010) and the theoretical and conceptual framework that identifies strategic challenges that
affect LED planning (Bengt, 2007; Liou, 2009; Rogerson, 2010, Rogerson, 2014). However,
there is paucity of literature pertaining to the degree to which local government institutions are
able to use the resources available to promote LED within the local units.
A significant number of districts (for example, Builsa North and Builsa South Districts) in
Ghana as a result of LED policies have established separate departments under the control of
University of Ghana http://ugspace.ug.edu.gh
9
National Board for Small Scale Industries (NBSSI), through its Business Advisory Centres
(BAC) to facilitate planning and implementation of LED policies. Besides, there have been
fiscal transfers (yearly budgetary allocations) made to local governments or district assemblies
by the central government in addition to their own internally generated funds to ensure that
these policies and plans are executed. Over the years of implementation, “several institutions
and policies have been put in place to help improve development at the local level” (Mensah,
Domfeh, Ahenkan and Bawole, 2013, p. 163). However, there has been limited literature
regarding the success, challenges or otherwise of implementation of these policies at the district
level. However, some scholars on the subject matter did similar studies, their attention was
focused on LED piloted districts (Akudugu, 2013) and a more sectorial policy perspective
(Mensah, Domfeh, Ahenkan and Bawole, 2013).
How can local governments, with the support of fiscal decentralization and other local authors
such as community-based organisations, associations and producers, as well as private
organisations and donors contribute to LED (Helmsing, 2003) and employment creation? This
question though was posed over a decade ago, it is still relevant today and this current study
tries to respond to Helmsing (2003) question by investigating the contribution of FD to LED.
Performance of subnational or local level tasks needs sufficient funds and suitable means of
financing or supporting local government units to enable them respond appropriately to the
service needs of the people. Notwithstanding declarations, policies and even assurances by
governments, there has not been a concerted effort to grant local governments and for that
matter district assemblies with substantial fiscal autonomy to tax and spend (Bahl, 1999). This
assertion by Bahl (1999) is applicable to the Ghanaian context. Most district assemblies are
still unable to provide enough basic services such as quality education, health service delivery
and jobs to their citizens due to lack of adequate funds.
University of Ghana http://ugspace.ug.edu.gh

10
Most of the available empirical literature have concentrated on the connection between FD and
poverty (Crook, 2003; Crawford, 2008; Moche, Monkam, & Aye, 2014; Azila-Gbettor,
Adjimah & Tibu, 2014), FD and income inequalities (Sacchi & Salotti, 2014) but the link
between FD and LED in Ghana is still blurred. Therefore, there is the need for more empirical
literature specifically pointing to the contribution of FD to LED in Ghana, as studies of some
developing countries revealed that economic growth appears to be successful in countries
whose local governments enjoy greater control of the revenue generated within their
jurisdiction (Han & Kung, 2015).
1.3. Objectives of the Study
The main objective of the study is to determine the contribution of fiscal decentralization to
local economic development in the Builsa North District. The study therefore aims to examine
the following specific objectives:
1. To assess the extent to which fiscal decentralization contributes to local economic
development.
2. To identify the factors that inhibit effective fiscal decentralization in Ghana.
3. To determine the factors hindering local economic development in the Builsa North
District.
4. To identify the actors involved and the roles they play in LED.
University of Ghana http://ugspace.ug.edu.gh

11
1.4. Research Questions
In line with the research objectives, the study seeks to find answers to the following research
questions;
1. To what extent does fiscal decentralization contribute to local economic development?
2. What are the factors inhibiting effective fiscal decentralization in Ghana?
3. What are the factors hindering local economic development in Builsa North District?
4. Who are the actors of LED and what roles do they play?
1.5. Significance of the Study
Fiscal decentralization in Ghana was designed to enable local authorities have control over
their own affairs. This is however not the case as most district assemblies over rely on central
government (District Assembly Common Fund) for development. This condition raises a lot of
argument as to what the causes are. To some, FD alone cannot bring about development and to
others it is due to the political system that does not support the full operation of
decentralization. Though quite a lot of works have been done in the area of fiscal
decentralization (Moche, Monkam, & Aye, 2014; Azila-Gbettor, Adjimah & Tibu, 2014), there
is the need to apply different approaches to unveil the problem. The study therefore has both
practical and research implications.
In practice, the findings might assist local governments or Metropolitan/Municipal/District
Assemblies and policy makers to design some strategies that would enhance effective fiscal
autonomy (revenue generation and expenditure). The study would contribute to knowledge and
understanding of local governments about the benefits and limitations of FD to LED in Ghana.
University of Ghana http://ugspace.ug.edu.gh

12
In terms of research, the study has contributed to literature in terms of FD and LED for scholars
who might want to do similar studies. The study has also identified the links between fiscal
decentralization and LED at the district level and made recommendations for further research.
1.6. Scope of the study
The study was limited mainly to only staff of Builsa North District Assembly as a case study.
The variables used as measures for LED in this study include fiscal infrastructure, citizens’
participation in planning and implementation of LED programmes, capacity building,
employment creation and financial accessibility to local businesses. The study adopted the
qualitative method of data analysis.
1.7. Research Outline
The rest of the paper is organized as follows: Chapter two entails the examination of theoretical
and empirical literature on FD and LED. Chapter three contains the design and the
methodology that was used for the analysis. The results and findings gathered from the data
are captured in chapter four. The last chapter of the study contains the summary, conclusions
and recommendations.
1.8. Chapter Conclusion
This chapter has discussed the general overview of the study. It has indicated the main problem
that necessitated for the study and the aims and objectives that the study sets out to investigate.
The significance as well as the outline of the study has been presented in this chapter. The next
chapter reviews the theoretical framework and the empirical evidence of FD and LED.
University of Ghana http://ugspace.ug.edu.gh
13
CHAPTER TWO
LITERATURE REVIEW
2.0. Introduction
This chapter entails the search strategy, theoretical framework, the link between fiscal
decentralization (FD) and local economic development (LED), advantages and disadvantages
of FD and the related works relating to the current study.
2.1. Search Strategy and Results
The search strategy for identifying literature on fiscal decentralization and LED was done in
three stages. First, the paper searched for studies from six databases: Google Scholar, JSTOR,
PsycInfo, Emerald, Sage Journals Online and UG Space. The search terms include
decentralization (all fields), fiscal decentralization (all fields), and local economic development
(all fields).
Second, this study searched through documents from institutions (Builsa North District
Assembly, Local Government Service, District Assembly Common Fund and Ministry of Local
Government and Rural Development) and reviewed initial articles reference lists. Finally, this
study also searched the University of Ghana theses database for graduate research on fiscal
decentralization and Research Gate for lecturers’ publications related to the topic area. The
flow chart of the search strategy is presented in appendix 3.
2.2. Literature and Theoretical Framework
This section explains the theoretical and conceptual framework of fiscal decentralization and
LED, the various forms of decentralization, the history of decentralization in Ghana and related
literature on FD and LED.
University of Ghana http://ugspace.ug.edu.gh

14
2.2.1. The Classical Theory of Fiscal Decentralization
The classical theory can be attributed to three major attributions; first, Tiebout’s Local Good
Provision Model (Tiebout, 1956); Oates Decentralization Theorem (Oates, 1972) and Brennan
and Buchanan (1980) Leviathan Hypothesis.
Tiebout’s model of public good provision is where mobile households “select a community of
residence based on their preferences for local public goods” (Oates, 2005, p. 349). Local or sub
governments usually compete to provide a blend of tax and public goods. Citizens are then to
“choose by their feet” and decide wherever they want to live in accordance with the preferences
of their public goods and tax (Oates, 2005, p. 349).
Oates Decentralization Theorem attempts to “solve the trade-off between centralised and
decentralized provision of public goods in favour of the former (centralisation) if average
preferences across citizens of different regions are equal, the consumption of the public goods
generates spill-over effects; whereas a decentralized provision maximises social welfare when
preferences differ across regions, spill-over effects are absent”. The theory operates on the
assumption that government operates to maximise social welfare and in the event that it is
centralisation there would still be an even delivery of public goods (Porcelli, 2009, p. 2).
Finally, a significant influence in the public-choice dimension of fiscal decentralization is the
Brennan and Buchanan (1980) Leviathan Hypothesis where FD is seen as a “mechanism to
constrain the expansionary tendencies of government”. In this theory, central governments
operate as monopolists (or Leviathans) in order to maximise their autonomy over the country’s
resources rather than attempting to increase the provision of social welfare. Based on the notion
that “households and firms are mobile”, central government is divided into various sub national
or local governments and introduced among them fiscal competition through fiscal
University of Ghana http://ugspace.ug.edu.gh

15
decentralization system. This placed fiscal restrictions on the national government’s taxing
powers (Porcelli, 2009, p. 2).
Both Tiebout (1956) and Oates (1972) have provided a hypothetical framework of FD that
could ensure an effective delivery of public goods that would reflect local preference to
centralisation. While their initial method has assumed a compassionate government, the
Leviathan Hypothesis is centred on a contrary notion that decentralization is a way to decrease
the size and inefficient behaviours of government in order to make it more responsive to local
service preferences. Rodden (2003) argued that subject to how the public sector is funded,
fiscal decentralization could result in a small or large public sector. The Leviathan hypothesis
might not work effectively if local units continue to receive grants from the central government
and the outcome of this will result in a large public sector. There will be negative consequence
on the public sector when the central government devolves fiscal revenues to local
governments. The Leviathan model has successfully tested its hypothesis that decentralization
of expenditure without local tax can undermine the tax competition (Porcelli, 2009).
2.2.2. Decentralization
Decentralization refers to the allocation of decision making authority and public functions
responsibilities from the central government to sub governments or quasi-independent
government institutions (Boschmann, 2009). It involves the process of restructuring the
structure of the fiscal decentralization to devolve power to the local governments.
Decentralization according to Rondinelli (1981) is the allocation of the authority for decision
making, planning and the management of the functions of the public from the central
government to lower level government. In this study, the focus of decentralization is fiscal
decentralization, which is the assignment of intergovernmental resource power from the
national government level to lower level of government (or district assemblies). The extent of
University of Ghana http://ugspace.ug.edu.gh

16
FD determines the amount of power given to sub-governmental units to exercise control over
their own revenue generation and expenditure.
There are three main types of decentralization. These include delegation, de-concentration and
devolution (Boschmann, 2009). Crawford (2008) has identified devolution or democratic
decentralization and deconcentration or administrative decentralization as the main forms of
decentralization. Other scholars have identified privatisation as one other form of
decentralization (Rondinelli & Nellis, 1986; cited in Rees & Hossain, 2010, p. 583). The three
main types of decentralization as identified by Boschmann are explained below.
De-concentration: This type of decentralization is the weakest. Deconcentration is the transfer
of decision-making and planning authority and responsibilities from central government units
to other government departments, districts and regions. This type of decentralization enhances
the capacity building of administrative and local government officials at the grassroots under
the supervision of central government. Rees and Hossain, (2010) also explained that
deconcentration refers to the transfer of decision making power and responsibility from staff
and offices located at the centre to local governments or administrative offices located outside
the national capital.
The centre still has authority and regulatory powers over the decision making of the local units
that ensures that authorities at the local units are still responsible and accountable to the central
administration (Habibi et al, 2003). Based on this, local officials are unable to take all decisions
that affect them on their own. This form of decentralization is mostly associated with unitary
systems of governments (Habibi, et al, 2003).
Delegation: This type of decentralization refers to the relocation of administrative and
decision-making responsibilities from the national or central government to semi-autonomous
bodies to perform pre-defined functions with limited influence or control from the central
University of Ghana http://ugspace.ug.edu.gh

17
government (Boschmann, 2009). It involves the sharing of fiscal resources to sub-national units
with instructions or specific regulations regarding the resource utilization (Habibi, et al, 2003).
These semi-autonomous bodies or local units unfortunately remain accountable to the central
government. The establishment of national institutions such as Savannah Accelerated
Development Authority (SADA), High Way Authorities and public enterprises requires the
state to delegate some responsibilities to them. Delegated decentralization allows the
institutions or organisations to make policies with some reasonable amount of discretion.
But since the central government still maintains the power of resource allocation, this type of
decentralization possesses some kind of “principal-agent relationship, with the central
government as the principal and the local governments as the agents” (Habibi, et al, 2003, p.
75). This form of decentralization is more likely to be adopted in federal governments.
Devolution: This is concerned with the allocation of planning, finance, decision-making and
authority to semi-autonomous institutions of the state. Devolution is the type of
decentralization that focus on the financial autonomy of the district assemblies that enable them
to be responsible for the formation and implementation of local level development within their
jurisdiction. This implies that there should be regular flow of resources to enable local
governments achieve their developmental goals. Central government transfers to district
assemblies should be based on transparent, just and objective distribution procedures, reflecting
the locality differences in terms of needs and functions.
Usually in Ghana, the trend is the same. Fiscal authority and responsibilities are devolving to
local governments such as the regional coordinating council and the metropolitan, municipal
and district assemblies (MMDA). They have the authority to elect their own local leaders (e.g.
district chief executives), generate their own revenue and have control over their own
investment and expenditure. This is however not the case in the Upper East Region; inter-
governmental transfers to the Region have still not sustained the desired development that can
University of Ghana http://ugspace.ug.edu.gh

18
dissuade citizens from migrating to other regions in search of jobs and higher levels of
education. Sub-governments in devolved countries exist within specified and defined
geographic boundaries in which they exercise their legal powers and authorities. Similarly,
devolution is also defined as the transfer of legal powers to perform specified functions within
a formally constituted local bodies or agencies (Ayee, 1992).
Decentralization functions in a constitutional system is carry out progressively over a long
period of time. In this form of decentralization, local officials gain full responsibilities over
fiscal resources and decisions allocated to them, without interference from the central
administration (Habibi, et al, 2003). This may require central government to grant substantial
amount of powers on revenue mobilization (taxing) and expenditure. It is assumed that
decentralization by devolution will bring government more close to the people and is
anticipated to result in more political involvement at the grassroots. This will enable citizens
to get their voices heard and their demands met through their local representatives. At the end,
“it is anticipated that the local government unit will be more responsive to citizens, inclusive
of the majority poor, resulting in poverty reduction” (Crawford, 2008, p. 235). In Ghana, little
amount of these powers are granted to district assemblies.
Studies on decentralization, devolution and financial shortfalls have also shown that central
government’s discretion to some extent can be limited by decentralization and devolution and
this can lead to economic disincentive (Sosin. 2012). There is also the tendency that
decentralization and devolution can make sub units that gain autonomy not to match the needs
of the people to their service. Central governments may then lose functional power over the
sub states. This can be financial disincentive to local units to raise enough resource for
themselves. The tendency of raising higher taxes sufficient to meet the increasing level of
expenditure at the local level is there. However, the fear is that businesses may relocate if taxes
are high. It is also argued that, districts that are financially challenged or are unable to meet
University of Ghana http://ugspace.ug.edu.gh

19
their revenue targets will be faced with limited functional discretion. Moreover, this can
reinforce and encourage the sub-units to adopt priorities of the central government. Sosin
(2012) also supports the above argument that due to lack of adequate local funds, local
governments are unable to pursue their own priority programmes but tied to the dictates of the
central government.
The main components of devolution include administrative decentralization, political
decentralization and fiscal decentralization (Boschmann, 2009).
Political Decentralization involves the sharing of decision making functions and authority
from the national government to sub-national or local governments which is managed by
political representatives of the locality (Boschmann, 2009). It also means the territorial share
of power. This also involves the extent to which power and authority is distributed to specific
geographical units in the state, and the processes and the institutions through which this power
sharing is done. The division of states into smaller units with some level of political autonomy
enhances quick decision making at the local level. What this means is that the local people
know their problems best and would be able to find their own solutions.
Administrative Decentralization refers to the sharing of administrative functions of the
central government with the sub-governments under the authority and control of the local units.
Administrative decentralization seeks to enhance efficiency and to ease workload or congestion
at the central government level.
Fiscal Decentralization: this form of decentralization concerns the devolution of budgetary
authority and decision making functions from the central government to local governments to
take their own decisions in relation to revenue generation and expenditure (Boschmann, 2009).
It involves the allocation of resource from the central government or top level of government
to the lower or sub national units to ensure local control of their budgets and fiscal decisions
University of Ghana http://ugspace.ug.edu.gh

20
and performance (Ghaus-Pasha, Pasha & Khan, 2000). Both administrative and political
decentralization are largely preconditions for the full realization of fiscal decentralization. The
main concern of this study is fiscal decentralization. The form of decentralization adopted can
have influence on the structure and organisation of the public sector. This implies that the form
of decentralization a country can adopt is largely contingent on the country’s political system
and culture (Boschmann, 2009).
For the effective operation of fiscal decentralization, fiscal autonomy must necessarily be
granted to local governments and encourage fiscal balance. Fiscal decentralization entails three
major distinct areas. These components include revenue autonomy, expenditure autonomy and
intergovernmental transfers (Bahl, 2008). According to Bahl (2008), fiscal autonomy refers to
the amount of discretion a sub government can exercise over the management and control of
its fiscal resources. In some countries, the exercise of discretion by sub-governments are
limited to only expenditure while others have given some considerable amount of discretion to
local units to some extent to finance and spend their budgets. Bahl (2008) also noted that many
large countries that are affluent with diverse populations appears to exercise a lot of expenditure
decentralization. Comparing the situation to the Ghanaian context (and precisely in the Builsa
North District Assembly), it appears that the Assemblies have limited revenue generating
powers as compared to their expenditure (Builsa North District Composite Budget, 2014 and
2015).
2.2.3. Fiscal Balance
Fiscal decentralization entails horizontal and vertical fiscal balance. Fiscal system is said to be
vertically balanced if each district or local unit on average has adequate resources that can
carry-out a minimum level of service for which it is responsible. Local taxation,
University of Ghana http://ugspace.ug.edu.gh

21
intergovernmental transfers and charges constitute the main resources available to local
governments. These local taxes and charges are however limited. The intergovernmental
transfers that form a large chunk of the district revenue does not flow regularly. Moreover,
what is considered as the minimum level of service is subjective and is difficult to determine.
The cost associated with the perceived minimum level of service may vary from one local
government unit to the other. It is much better to view vertical balance in terms of availability
of resources to local governments than to attempt to measure public needs objectively. In fact,
there is no universally acceptable way of measuring fiscal balance (Bahl, 2008).
Bahl (2008) observed that vertical imbalance in a country can affect the intergovernmental
fiscal system negatively. When local governments are given spending autonomy relative to
revenue, they will not be able to provide services. Even if some services are delivered, it may
be done at a slow pace and with poor quality. Eventually, local government units may run into
fiscal deficits. On the contrary, when local units in the developing nations are given more
autonomous responsibilities in revenue mobilization as compared to expenditure, deficiency of
service delivery by the national government will emerge since the central government will not
be left with adequate funds (fiscal starvation) (Bahl, 2008). In this situation, the state will be
left with no option than to charge higher taxes to enable it finance public services.
This is not farfetched. Ghana has been facing fiscal starvation since 2015 simply not because
more national resources were not transferred to local governments. It is just that, Ghana
government simply could not generate enough revenue to provide most of the basic needs such
as reliable electricity supply, water and petroleum to its citizenry. This has propelled the
country to go for loan from the International Monetary Fund (IMF). In an attempt to meet the
conditions of the IMF, more burdens in the form of higher taxes were imposed on citizens as
against stagnant or un-increased salaries of workers. The government believed that by cutting
down expenditure and increasing taxes, it would be able to finance its debts (fiscal balance). In
University of Ghana http://ugspace.ug.edu.gh

22
many industrial countries where there is maximum allocation of significant taxing powers to
local units, the intergovernmental fiscal system is mostly vertical balance. Bahl, (2008) has
also expressed similar views in relation to ensuring fiscal balance.
On the other hand, horizontal fiscal balance refers the degree to which sub-governments with
available resources are able to deliver “minimum levels” of services to the public.
Notwithstanding the fact that central governments may attempt to restore horizontal fiscal
balance by allocating significant amount of resources that will meet the basic needs of the
public, disparities may still exist among local units since some deprived local governments or
district assemblies may not be able to generate enough of their own resources.
The benefits of decentralization to poverty reduction and better-quality service provision is still
an ongoing discussion among researchers (Crook, 2003; Ayee, 2004; Crawford, 2008). The
successful achievement of the purpose of decentralization largely requires the presence of
certain assumptions and conditions. The possible conditions necessary for the effective
contribution of decentralization to production reduction and improved quality service provision
includes but not limited to the following: (a) availability of sufficient local level resources; (b)
adequate human and administrative capacity; (c) central government political commitment; (d)
participation and consultation of stakeholders and (e) sufficient free flow of information.
2.3. Decentralization in Ghana
Decentralization in Ghana has gone through so many phases and reforms until date. Ranging
from time of indirect rule to the current local government act (Act 462 of 1993). In this study
the history of decentralization in Ghana, legal and political framework of decentralization, the
University of Ghana http://ugspace.ug.edu.gh

23
composition and structure of the current LGS and the Sub-districts political/ administrative
structures are discussed below.
2.3.1. The History of Decentralization in Ghana
Decentralization has existed since the pre-colonial time in Ghana though informal and less
democratic. In fact, communities had their own way of governing themselves. Usually the chief
was the political and administrative leader of the community and was supported by the council
of elders. The rule by traditional authorities were hierarchically structured ranking from the
King, followed by paramount chiefs, chiefs and at lower level divisional or sub-chiefs (Ahwoi,
2010; ILGS, 2010).
During the colonial period, the settlement of the Europeans in Africa and Ghana specifically
had changed the local leadership and governance structure resulting in chiefs playing limited
roles to the British Resident Commissioners (ILGS, 2010). When the colonial masters arrived
in the Gold Coast, chiefs and some local loyalists were the focus of local government and
administration, whose authority was fundamentally not legitimised by the locals. This local
system of administration was considered as the “Indirect Rule System” (IRS). The traditional
rulers also referred to as the Native Authority, which was then the unit of local government
was not democratic. The chiefs were selected based on influence of the colonial masters to help
them administer law and order in the Gold Coast. They wielded enormous authority over the
natives but their selection was not clearly recognised (ILGS, 2010).
LG emerged through two major lines; “a series of Municipal Council Ordinances regulated LG
in the major municipals while a series of Native Jurisdiction Ordinances regulated LG in the
rest of the country through the State Councils and Native Authorities” (ILGS, 2010, p.12). In
1951, the first Local Government Ordinance was commissioned to help solve the shortfalls
outlined by the Coussey Committee in relation to the 1948 disturbances.
University of Ghana http://ugspace.ug.edu.gh

24
Despite the Ordinance, there were no changes on the major councils. The creation of more
councils for instance, 252 local and urban councils and 26 district councils have deepened more
the unconstitutional powers of the traditional rulers. This was because the old system and the
new system were linked to each other which made the chief the president of the new system
but then with restricted powers. (Ahwoi, 2010).
In not later than five-years of implementation of the new system, it witnessed once more
inefficiencies which were outlined by the commission lead by F. A. Greenwood in 1956 to
make recommendations for the reorganisation of the Local Government System (LGS) on the
organisation of LG, expenditure control measures, revenue control systems, local government
financing and taxation among others. The recommendations of the Greenwood committee were
not implemented before the attainment of Ghana’s independence in 1957 (ILGS, 2010).
2.3.2. History of Ghana’s Decentralization From (1957- 1987)
During the postcolonial period, various reforms had been made to decentralize power and
authority to other parts of the country. The independent constitution of 1957 had contributed
to the attainment of Ghana’s independence on 6th March 1957. The constitution also set out
the legal framework for reorganisation in the LGS. The constitution had zoned Ghana into five
governmental regions namely: Western, Eastern, Northern, Ashanti and the Trans – Volta
Togoland Regions. All the regions but Ashanti region were headed by agents from the regional
house of chiefs. The Asantehene headed the Ashanti region. There was an assembly in every
region (synonymous to parliament) responsible for the development of the region. In addition
to that, local government councils such as the municipal, district, urban and local councils that
existed previously during the colonial period were still maintained in the constitution (ILGS,
2010).
University of Ghana http://ugspace.ug.edu.gh

25
The regional assemblies rarely lived to the expectation of discharging local governance hence
their activities were tagged with oppositions until the promulgation of the 1960 republican
constitution which again brought about some changes in the LGS (ILGS, 2010). The 1960
republic constitution enabled the establishment of the Central and Upper Regions and the
change of name from Trans-Volta Togoland to Volta Region. Overall, the total number of
regions increased to seven (7) in the country.
Subsequently, a Local Government Act (Act 54) of 1961 was enacted to facilitate the creation
of municipals, cities and local councils (Ahwoi, 2010). This major reform in the LGS has
allowed for the participation of villages, towns and unit committees in the governing process
of their localities. Again, elections were introduced to elect local officials into the unit
committees and councils. The paramount chiefs appointed by the Minister for Justice chaired
the district councils. The paramount chiefs were to preside over and give guidance throughout
the process of electing a permanent or official chair for the district councils. The tenure of
office for the district councils was three years though qualifies for re-election.
At the time, LG was under the control of the Ministry of Justice (MoJ). The main roles allocated
to the councils include security management (the use of native police), environmental
management, infrastructural provision and social services delivery. Local sources of revenue
including fees, licences, and permits remained the major sources of financing of the local
governments (ILGS, 2010).
Loopholes within the LGS still existed which had necessitated for reform of the sector using
all the recommendations from the committees. An additional Local Administration Act (Act
359) of 1971 was enacted to transfer the authority for appointment to the regional chief
executives that was previously performed by the Prime Minister (ILGS, 2010). That
notwithstanding, the amendment of the 1971 Act in 1974 had enabled the creation of a four-
University of Ghana http://ugspace.ug.edu.gh
26
tier structure of LG. Ahwoi (2010) observed that, the local government structure involves the
regional councils, district councils, municipal, urban, area and local councils and the town or
village committees.
The emergence of the new Local Government System (LGS) resulted in the establishment of
58 districts, 273 municipals, urban, area and local councils and were mandated with the
responsibility of developing their localities. Unlike the old system, the new system adopted an
integrated approach to LG, which reduces or eliminates differences between the national
government and LGs.
The 1979 constitution had empowered parliament to establish district councils, villages, towns
and area committees though it was significantly not different from what had been created
because of the 1974 Local Administration Amendment. It must be noted that the introduction
of the power of appointment to appoint members into the unit constitute the main difference.
However, the appointive power was given to the traditional authorities. This had brought
traditional authorities into LG again after Act 54 of the 1961 excluded it. While two thirds of
members of the units were elected based on universal adult suffrage, the native authorities
selected the remaining one-third. The functions of the LG councils were just still the same as
before (Ahwoi, 2010).
In line with the provisions of the 1979 constitution contained in chapter 20, amendments were
made to 1974 Act in 1980 and was substituted with the part one of the Act 359 of 1971 (Ahwoi,
2010). The amendment reconstituted the membership of the LG Units. Though the traditional
authorities have been given space in the new amendments, the powers of appointment were
conferred to the president of the Republic of Ghana and two representatives from the Regional
House of Chiefs at the various regional councils (ILGS, 2010). There were no other reforms in
University of Ghana http://ugspace.ug.edu.gh

27
the LGS until the current system of LG that was instituted by the law on decentralization of the
Provisional National Defence Council (PNDC) Law (Law 207) in 1988.
Although significant Local Government reforms were made, the reforms were not very
adequate until 1988 when the new local government system (LGS) emerged (ILGS, 2010). The
legal and political framework as well as the structure and composition of the new LGS are
explained below.
2.3.3. Decentralization in 1988 and Beyond
Ghana in 1988 had initiated the current system of decentralization which is enshrined in the
1992 constitution. The PNDC Law 207 of the Local Government System passed in 1988 had
enabled the creation of 110 Districts and ten (10) regions with the District Assemblies (DA) as
a key institution of the newly created districts in the ten regions of the country. The success of
the decentralization was manifested by the current increase in the number of districts to 216.
The 1992 constitution has also provided the legal background for the realization of
decentralization in Ghana. Article 240 (1) of the Ghanaian constitution asserts that “Ghana
shall have a system of local government and administration which shall, as far as practicable,
be decentralized” with “functions, powers, responsibilities and resources transferred from the
Central Government to local government units” (Article 240[2][a]). In addition, “make
democracy a reality by affording all possible opportunities to the people to participate in
decision-making at every level in national life and in government” (Article 35[6][d]).
2.3.4. The Composition of the New Local Government System
The new local government system (LGS) consists of the regional coordinating council (RCC)
and four-tier metropolitan and three-tier municipal/ DAs structure. In all, there are ten RCCs,
University of Ghana http://ugspace.ug.edu.gh

28
216 Metropolitan, Municipal and District Assemblies (MMDAs) (comprising of 6
metropolitans, 49 municipals, 161 Districts), over 2000 Urban, Zonal or Town or Area
Councils and more than 20,000 Unit Committees that have been approved by law (ILGS, 2010)
Figure 2.1. The Local Government Structure
Source: Guide to District Assemblies in Ghana, (ILGS, 2010)
2.3.5. The Regional Coordinating Council (RCC)
The RCC comprise of the regional minister as the chairperson, his deputy or deputies, the DCE
of each district and the presiding member of each DA in the region, two chiefs from the regional
house of chiefs and heads of decentralized departments who have no voting rights. The RCCs
were created in all the regions of Ghana and are the highest level of LG in Ghana. As an
administrative body, it is responsible for monitoring, coordinating and evaluating the
District Assembly Metropolitan
Assembly
Municipal Assembly
Sub-Metropolitan
District Councils
Regional Coordinating Council
Urban or Town
or Area Council Zonal Council
Town Council
Unit
Committees
University of Ghana http://ugspace.ug.edu.gh

29
performances of the DAs in the region (Local Government Act 462 of 1993). They also monitor
the use of finances that have been allocated to them by government or any agency (ILGS,
2010).
2.3.6. The District Assembly (DA)
The 1988 reforms contain democratic local elections that were based on non-partisanship
where candidates are not to contest on the ticket of any political party (Crawford, 2008).
Election to the District Assembly is held once every four years and at least six months before
or after a general election of members of parliament (Local Government Act 462 of 1993).
The composition of the District Assemblies consisted of “One person from each local
government electoral area within the district elected by universal adult suffrage; the member
or members of parliament from the constituencies that are within the authority of the District
Assembly as members without the right to vote; the District Chie Executive of the District”. In
addition, “other members not being more than thirty percent of all the members of the District
Assembly, appointed by the president in consultation with the traditional authorities and other
interest groups in the district” (Article 242 of 1992 Constitution).
The elected representatives of the District Assembly serve as representatives and a link between
their communities and the DA. The demands and views of their community members are
communicated through them. The appointed representatives are to provide professional and
technical expertise to the District Assembly and to give representation to traditional leaders
and stakeholder groups. The appointees are however viewed by many as loyal and partisan to
the governing party and are being appointed based on their political patronage (Crawford,
2008).
University of Ghana http://ugspace.ug.edu.gh

30
The District Assembly decisions are taken during General Assembly meetings, which takes
place at least three times a year and is organised and presided over by the Presiding Member
(PM). The PM is also elected by the Assembly Members. Crawford (2003, p. 242) noted that
most of the work of the district assembly in practice is done by the Executive Committee
(EXECO), described by Ayee (2003) as “the nerve of the DA”. The EXECO is composed of
about one-third of the Assembly Members. It meets every month, presided over by the District
Chief Executive (DCE).
The Role of the District Chief Executive: The DCE is the political and the administrative
head of the District appointed by the president and approved by not less than two thirds of the
majority of members of the Assembly. He is a local activist of the ruling party, and is appointed
to a term of four years, subject to renewal of a second term. The DCE as chairperson of the
EXECO is an influential and ex-officio member of the DA. The DA is staffed with civil
servants headed by the District Coordinating Director (DCD) who is answerable to the DCE.
Hence, with the exercise of both administrative and political powers, the DCE is the most
powerful figure in the district.
The Powers and functions of the District Assemblies: The DA comprise of the elected
members, member(s) of parliament (MP), government appointees not more than thirty percent
(30%) of the total number of elected members of the assembly and the DCE. The PM is elected
by assembly members and presides over all meetings of the Assembly. The DA has enormous
powers as enshrined in the constitution. The 1993 Local Government Act has endorsed the DA
as the “highest political authority in the district which shall have deliberative, legislative and
executive powers” (Article 241[3]). The major functions performed by the DA include the
following: “the formulation and execution of plans, programmes and strategies for the effective
mobilization of the resources necessary for the overall development of the district” (Article
University of Ghana http://ugspace.ug.edu.gh

31
245[a]); coordinate and harmonise the development partners and the decentralized departments
and non-governmental organisations.
All these functions were specified in the Legislative Instruments that establish each DA with
respect to PNDC Law 207 in 1988 and Act 462 of 1993. Despite all these defined functions of
DA, the functions of DA and the central government departments and agencies are still blurred.
The central government departments and agencies still interferes in the performance of the
local governments by setting policies and priorities that in a way compels the DAs to comply.
An example is the DHD and the District Education Service that are still under the control of
their mother ministries, Ministry of Health and Ministry of Education respectively. This
suggests that full functions and authority have not been devolved to DA yet (Ayee, 2004;
Crawford, 2008). The decentralized departments in each district are still responsible for
providing basic public services such as education, health and agricultural extension services
with support from the DA (Crawford, 2008).
The powers of the DA will increase tremendously if all decentralized departments are placed
under their control. Despite the passage of the Local Government Service Act that was to give
way for all decentralized departments to be under the control of the DA’s, implementation has
not been fully executed.
Financial resources: the sources of fund for the DA are mainly two; intergovernmental transfer
and internally generated funds (IGF). The District Assembly Common Fund (DACF) is set up
by the 1992 constitution “with annual allocation of not less than five percent of the total
revenues of Ghana” (Article 252 [2]). The DAs also have the power to generate their own
resources through their annual fee fixing resolutions. This is however limited especially for
districts with low economic activities. This is also partly due to what Nkrumah (2000 in
Crawford, 2008: p. 243) has noted that, “the lucrative tax fields” are taken by the central
University of Ghana http://ugspace.ug.edu.gh
32
government, while “low yielding taxes such as basic rates and market tolls” belong to the local
governments. Other possible source of funds to the DAs is the Donor Agencies (Local and
International Donor organisations) but these funds do not flow regularly to the DAs and when
they do flow, it is usually with less control over its expenditure by the DA (Crawford, 2008).
2.3.7. Sub-District Political / Administrative Structure
They are sub bodies under every district assembly that carry out tasks determined by the
instruments that set them up or transferred to them by the assembly. They consist of the Sub-
Metropolitan District Councils (DCs), urban or town or zonal or area councils and the unit
committees (ILGS, 2010).
Sub-metropolitan District Councils: This structure is directly under the metropolitan
assemblies. It is created based on the need for subsidiarity and in view of the large size of the
metropolis (ILGS, 2010). They are created to reduce the pressure of socio-economic,
urbanisation and management problems confronted by the metropolis. This is to facilitate city
administrators to effectively solve numerous problems of the city. The council is zoned into
electoral areas and is consisted of at least twenty-five and at most thirty members. All members
of the assembly elected and or appointed by the president in the sub-metropolitan district
should reside within jurisdiction of the sub-metropolitan district council. A list of Sub-
metropolitan councils are provided at the appendix 4
Urban Council: this structure is established for localities with over fifteen thousand
populations and is multicultural in nature, characterised with city development and
management challenges. The membership of the council is not more than 30 and is also not
less than 25. The composition of the council consists of a maximum of eight elected members
from the respective area/district assembly, a maximum of twelve agents from the unit
University of Ghana http://ugspace.ug.edu.gh

33
committees within the jurisdiction of the urban council and a maximum of ten ordinary citizens
residing within the area of the urban council (ILGS, 2010).
Zonal Councils: They are made up of a minimum of 15 members and a maximum of 20
members. This consist of elected members not exceeding five residing in the zonal area, a
maximum of ten representatives from the unit committees and ordinary citizens residing within
the zonal area. They are created based on conditions of a population of 3000, identified streets,
homogeneity of interest, geographic features, etc. as boundaries (Act 462 of the 1993 Local
Government Act).
Town or Area Councils: This is made up of at least 15 and at most 20 members consisting of
elected members not exceeding five from the relevant area or town, not more than ten-unit
committee representatives and at most five ordinary persons residing within the town or area.
The unit committee comprise of at most fifteen persons who consist of ten elected members
residing within the unit and at most five other people dwelling in the unit appointed by the
DCE (on behalf of the president).
Elections of members to the local government councils and the various sub-units are politically
non-partisan and are conducted by the electoral commission of Ghana sponsored by
government.
2.4.Advantages and Disadvantages of Fiscal Decentralization
Decentralization has been potentially identified to be desirable in some countries and otherwise
in other countries. Many advocates of decentralization have identified quite a number of
potential benefits of decentralization. Most of these possible benefits of decentralization point
to improve governance, efficiency and equity. The realization of these benefits turns to enhance
economic development and reduce poverty. It is also believed that, the extent to which these
University of Ghana http://ugspace.ug.edu.gh

34
benefits can be achieved largely depends on the form of decentralization (devolution of powers
and autonomy) being pursued. Nevertheless, it must also be noted that, studies had shown the
undesirable nature of decentralization. This section is dedicated to explaining the merits and
demerits of decentralization.
2.4.1. Advantages of Fiscal Decentralization
The first advantage of fiscal decentralization is economic efficiency. The basic economic
reason for decentralization is the efficiency in the provision of services and the authority of
local governments in allocating resources within their area of jurisdictions. Yamoah (2007) and
Boschmann (2009) shared the same view. People are different everywhere and with varied
needs for public services. Local leaders live with the people, have access to local information,
know local problems and feel the same conditions with the people. So they are in a good
position to identify the needs and priorities of the local citizens and allocate resources
efficiently (Smoke, 2003). It is certainly a fact that there are services that cannot be provided
by local governments due to either the quantum of service needed to be provided or the effect
that service may have on other jurisdictions. In such instances, the central government holds
the responsibility to provide and or control those services. Poverty can weaken decentralization
in developing countries by limiting the preference of differentiation and this may increase
public overhead expenditure, as a result affect productive and allocation efficiency (Prud’
homme, 1995).
Decentralization can also enhance LED through the provision of services and inputs to local
businesses or entrepreneurs; provision of legal and constitutional framework favourable
enough for development; and finally coordinating both local public and private businesses by
creating partnerships that enhance development (Asante and Ayee, 2010)
University of Ghana http://ugspace.ug.edu.gh

35
Improved equity: The local people are more familiar with their own situations; know their
problems best and therefore, in a good position to tackle their problems by equitably sharing
their resources judiciously in relation to their priorities. They are however constrained by
limited resources; therefore, central government should redistribute resources to the poor areas
that are unable to generate their own resources. Local governments will not willingly
redistribute resources in their areas unless they are compelled by the central government or by
policy directives to ensure political participation and inclusion (Smoke, 2003).
Improved Governance: People are more likely to identify themselves with local governments
if their interactions with local leaders will lead to decisions and actions consistent with their
wishes. Citizens will be better connected to the local governments than central government
since their influence and interest are taken into consideration. At least the fact that the citizens
can easily approach local authorities with their problems and influence directly their leaders’
decisions in a modest way gives the citizens a sense of confidence and autonomy. However,
national goals or interests supersedes local interests, therefore it is not everything they request
for which should necessarily be granted to them.
Improved development and poverty reduction: A major advantage of LG is its’ contribution
to local economic development through many ways as identified by Smoke (2003, p. 10): First,
“local governments provide services that serve as production and distribution inputs for local
firms and entrepreneurs. Second, they contribute to legal and institutional environment that are
conducive for development. Third, they can help to coordinate key local public, private and
community actors in creating partnerships that promote development”. Though local
governments may not be able to provide certain types of services –such as capital intensive
infrastructure, economic development largely depends on institutional and macro-economic
factors. Local economic development is also a crucial development strategy for sustaining
poverty reduction, though, not sufficient (Helmsing, 2001).
University of Ghana http://ugspace.ug.edu.gh

36
Fiscal decentralization allows local authorities to deliver different mixtures of public goods
and services that is in consonance with the priorities of the citizens living within the locality
(Oats, 1972) more than centralised governments.
Centralised governments might not be able to provide public goods and services that will reflect
the interest and priorities of the local people. Instead, the central government may deliver
uniform packages of public goods to all citizens without any regard for locational differences
and priorities. When this happens, inefficient allocation of public resources will certainly be
the result.
Decentralization offers the opportunity to deliver public services that reflects the needs and
preferences of the locals and ensuring accountability and responsiveness of the government.
Sakyi, Azunu and Bawole (2011) noted that decentralization has a positive impact on health
planning structure, actors and processes and therefore a better alternative to centralised
planning systems.
2.4.2. Disadvantages of decentralization
Although much has been said about the potential benefits of decentralization, in addition to
strong calls for decentralization in most developing countries in Africa, there are still problems
that need to be considered in adopting any decentralization programme.
First, decentralization can lead to unequal development and discrepancy across localities giving
impetus for an increase in macroeconomic instability and institutional fragmentation by
partisan local politicians (Prud’homme, 1995; Asante et al, 2010). Local politicians may turn
to deliver their own interests rather than the interests of the larger group, which can also bring
about conflicts. A practical case is the Nkwanta South DCE of the Volta Region of Ghana who
was murdered in cold blood by his own people purported to be pursuing the interest of a
minority group to which he belongs to in the district (Adomonline.com. 3rd November 2014).
University of Ghana http://ugspace.ug.edu.gh

37
As the resources of a country are not evenly distributed, decentralization may serve to deepen
the imbalance among districts and regions in the state. Poor districts would become poorer with
devolution because they would not have the needed resource to stand on their own. It does not
make complete sense to implement decentralization and yet local governments will continue
to depend on the state for their needs (Prud’homme, 1995; Asante et al, 2010).
Secondly, inadequate financial resources in addition to mismanagement of the scarce resources
and lack of accountability militates against efficient service provision to the poor in particular
(Smoke, 2003). Inadequate qualified staff at the local government units who will utilise public
resources efficiently to address local problems is a major challenge. If this condition exists in
local units where there are no internal and external control systems, local governments may
fail to account to the people and may even be more susceptible to corruption.
As the rural poor may not be in the position to hold local authorities accountable, corruption
will be more spread at the local units (LU) than the national level (Prud’homme, 1995).
Although on average, decentralized corruption will be better than the centralised corruption
where the resources will not even be distributed. Nevertheless, cumulatively, corruption would
be higher, as a result reduce productivity, and increase the cost of efficient resource allocation.
This is so because the provision of goods and services at any time will be costly as the levels
of ‘kickbacks’ are higher. Obviously, low productivity, inefficient strategies, technology and
resource waste is the result of decentralized corrupt systems (Prud’homme, 1995; Asante &
Ayee, 2010).
In addition, decentralization can cause serious regional divisions and disintegration that will be
very detrimental to a nation that has some of its regions being poor (Asante & Ayee, 2010).
Decentralization in a way encourages influential or wealthier regions to agitate to be
autonomous and to operate independently on their own. This can affect poorer regions or local
governments who do not have the resource to operate self-sufficiently (Asante & Ayee, 2010).
University of Ghana http://ugspace.ug.edu.gh

38
Again, decentralization can lead to unnecessary spending and wastage of public resources by
the inexperienced local political leaders. Local leaders who have little or no training about how
to manage public funds in addition to their political ambitions, cause a lot of spending. They
may tend to focus too much on achieving their own ambitions of becoming political leaders to
the detriment of the interests of the people. Here, resources would be used for electoral process
instead of developmental activities. Even though central government also does the same thing,
the quantum of public resource wastage becomes higher as more local units are established
(Asante & Ayee, 2010).
Finally, there is no automatic link between decentralization and democracy because the transfer
of power and autonomy may serve to supplement the influence of elites and the wealthy citizens
in the local areas who by means of their wealth are already powerful as against the poor ones.
The elitists will then use the resources to enrich themselves more and make the poor poorer.
2.5. Local Economic Development
Local economic development is gaining an increasing recognition globally and LED planning
schemes are closely linked to the changing world economy (Rogerson, 2014). Local economic
development is perceived by different scholars in different ways. What is considered “local” is
varied and is determined by the local people or the community members. In a general sense,
“local” is defined as “the physical space where the mental and social worlds are interactively
produced” (Bengt, 2007, p. 9). This means that community members must play a role in the
organisation of LED. Local economic development is considered as “the process in which the
partnership between community-based groups, governments and the private sector are set to
manage the existing resources to create jobs and stimulate the economy of a well-defined
territory” (Helmsing, 2001, P. 64). It concerns the use of potentials of the human, institutions
University of Ghana http://ugspace.ug.edu.gh

39
and fiscal resources by exercising local control. Usually local economic development
initiatives require that organisations, actors, institutions and resources are mobilised in addition
to the creation of new institutions and local systems through partnerships and strategic actions
(Helmising, 2001).
LED in the District Assemblies’ organisational framework operates in two ways with different
levels of authority. That is, LED may be incorporated into either the Mayor / MMDCE or the
Planning Office or be established as a separate department with its own staff responsible for
planning and implementing LED policies. From the functional perspective at the district level,
LED is institutionalised in two ways; first, LED is operating as a role of the district assemblies
or local authorities and second, through bodies which are charged with obligation of
implementing LED.
The practice of economic development is viewed from two main contrasting perspectives.
Bengt (2007) has identified the contrasting perspectives. First, voluntaristic view is that when
plans are formulated, the requisite resources would be made available for implementation.
Second is the deterministic view, which states that people working in a formal organisation or
a community are challenged with external forces to which they have to identify and overcome
them. The most appropriate coping strategy is reaction. Bengt (2007) observed that the
contrasting views stem from the same paradigmatic assumptions and need to be identified.
When the contrasting views are identified, it helps to determine whether it is a voluntaristic
view or a deterministic view.
2.5.2. Regional and Local Economic Development Theory
Local economic development (LED) is an emerging field with no theory or a set of theories
adequately explaining Regional and Local Economic Development (RLED) but many partial
University of Ghana http://ugspace.ug.edu.gh

40
theories point at a common underlying principle (Blakely & Bradshaw, 2002). The summation
of these various theories are explained by Blakely and Bradshaw (2002) as
“Local and regional development = c × r,
Where c equals an area’s capacity (economic, social, technological and political capacity) and
r equals its resources (natural resource availability, location, labour, capital investment,
entrepreneurial climate, transport, communication, industrial composition, technology, size,
export market, international economic situation, and national and state government spending)”
(Blakely & Bradshaw, 2002, p.55).
A value of ‘c’ is equal to 1 which signifies “a neutral capacity that neither add to nor detracts
from the resources of a community”. A value of ‘c’ greater than 1 signifies “a strong capacity
when applied to (multiplied by) resources, increases them” (Blakely & Bradshaw, 2002, p. 55).
In addition, a ‘c’ value less than 1 denotes a weak “community capacity (low-functioning
social, political, and organisational leadership), whether due to cronyism, corruption, self-
interest, disorganisation or ineptitude, that when applied to resources, decreases them and
hampers development” (Blakely & Bradshaw, 2002, p.55).
Resource capacities can be measured in several ways and different theories give importance
to diverse resources including markets size, raw materials, government spending,
infrastructure, access to credit and communication. Blakely and Bradshaw (2002) observed
that most theories of economic development have initially concentrated on only the ‘r’ aspect
of the equation (resources) to the neglect of the ‘c’ part (capacity). For instance, while location
theories emphasise the advantage of being close to raw materials or markets, other theories
focused basically on infrastructure and the need to invest on a number of these projects
(building roads, airports, telecommunication hubs and markets).
University of Ghana http://ugspace.ug.edu.gh

41
2.5.3. Attraction Theory
This theory is grounded in location theory and is a theory of economic development widely
used by communities (Blakely & Bradshaw, 2002). To attract investors, entrepreneurs, new
migrants among others, district assemblies have formulated policies and programmes that are
geared towards making their districts more attractive to gain competitive advantage over other
districts with similar prospects. The assumption underlining this model according to Blakely
and Bradshaw (2002, p.65) is that “community can alter its market position with industrialists
by offering incentives and subsidies”. This implies that a new economic activity can result in
the expansion of the economy, creation of wealth and broaden the tax base of the government.
The wealth generated from this can then replace the initial private and public subsidies.
Nevertheless, it is evident that much of the costs is actually borne by tax payers and workers
of the district (Bluestone, Harrison, and Baker, 1981).
Attraction theories have moved from their traditional focus of attracting industries to attracting
entrepreneurs particularly with certain socioeconomic backgrounds to the area or community.
Communities in this theory are seen as products and therefore must be packaged and displayed
appropriately. Though some people regard this mode of economic development with doubts,
there is an anecdotal evidence of the success of community promotion and that communities
should not “hide its virtues under a bushel basket” (Blakely & Bradshaw, 2002, p. 66).
2.5.4. Conceptual Framework
The availability and control of resources by local units will enable them achieve LED. Many
factors are used to determine LED. These include locational factors, physical factors, human
resources, business culture, infrastructural factors, capital and finance, knowledge and
technology, quality of life and industrial structure (Wong, 2002). However, this study has used
some components of LED from Helmsing (2003) and Wong (2002) including infrastructure
University of Ghana http://ugspace.ug.edu.gh

42
factors, human resource factor and capital and finance factors using some key indicators from
each factor as proxies for LED.
Linking the conceptual framework to the theory of local and regional economic development,
the ‘r’ component of the theory represents the fiscal resources of the locality (that is fiscal
decentralization, access to credit facilities) and the ‘c’ aspect is the capacity of the district
(citizens participation in decision making, local MSMEs capacity building, employment
opportunities, infrastructural provision). The factors comprising the ‘r’ and ‘c’ components of
the regional and local economic development are explained beneath the conceptual framework.
The framework of fiscal decentralization as well as LED is illustrated on a diagram below.
Figure 2.2. Structure of the Conceptual Framework
Source: Author’s own Construct, 2016
1. Infrastructural
availability
2. Capacity building of
MSMEs
3. Citizen participation
4. Employment
Opportunities
1. Fiscal
Decentralization
2. Access to credit
facilities by
MSMEs
Local Capacity
‘C’
LOCAL
ECONOMIC
DEVELOPMENT
The Theory of Local
and Regional Economic
Development
C*R
Institutions/actors
1. Local governments
2. Private sector
3. Community-based
organisations
4. Donor Agencies
Local
Resources ‘R’
‘
‘C’
University of Ghana http://ugspace.ug.edu.gh

43
Effective fiscal decentralization is believed to enhance the provision of physical infrastructures,
enhance the capacity building of local entrepreneurs, provide financial services to SMEs and
increase citizens’ participation in district level planning and implementation of LED
programmes. The provision of these conditions ensures a sound and supporting environment
for local economic growth and development.
Participation: participation in LED planning is an important element for the success of LED
and is a multi-actor affair (Helmsing, 2003). As indicated by Helmsing (2003, p. 74)
“participatory formulation of a development strategy plays an integrating role. It identifies the
overall local development priorities; defines strategic issues and related action programmes,
both for private and public sectors”. Most of the South African cities (example Cape Town)
“have developed participatory local strategies”. It is generally agreed that when projects and
programmes are designed without taking into consideration the views, needs and constraints of
the intended beneficiaries, the expected outcomes may not be achieved (Oduro, 2001). In
addition, stakeholder participation and contribution to policy designs increases ownership and
improves long term impacts (see Cities Alliance, 2007) The appropriate institutional structure
must be put in place to facilitate the participation of the intended beneficiaries in the design
and implementation of local economic projects and programmes.
Infrastructure: The provision of basic infrastructure and services such as water, electricity,
street lighting, access to roads and markets with special consideration of the diversified demand
from micro and small enterprises (Helmsing, 2003) facilitates local economic development.
Land development is also key in attracting potential users. Public-private partnerships can
support local governments to increase the delivery of infrastructure.
Provision of Financial services: Funding is the backbone of every organisation. Micro small
enterprises require access to capital to expand their businesses. Local governments are unable
University of Ghana http://ugspace.ug.edu.gh

44
to provide direct financial support to MSMEs however, local governments as part of their
facilitating role of LED can collaborate with some of these financial institutions to locate in
the locality. Local authorities can place inducements such as tax waivers and reduce rent of
facilities (stores, lands) that would encourage these financial institutions and other private
bodies to stay or come to their localities. Districts with these facilities are more likely to attract
investors to their area, since investors can have access to financial services.
Capacity Building: One of the assets at the local level is the availability of cheap labour. As
postulated by location theories of LED, industries may relocate to places that they can have
access to labour (Blakely & Bradshaw, 2002). Local governments can facilitate local
development by providing periodic training of programmes to community members in areas of
local policy formulation and implementation. Though the private sector can enhance the
capacity of local authorities to provide these services, local governments should take full
responsibility when private sector is unwilling or not ready to step in.
Employment Creation: Employment plays a significant role in LED. The district can facilitate
local employment by setting an enabling environment for private section to do so. There are
many examples where local governments in developing worlds create more facilitative
environments for the functioning and development of micro-enterprises (Stren and Gombay,
1994; Rogerson, 1999).
2.5.5. Actors of LED
Localities and regions in recent times have urged to assume responsibility for their own
development. There are various ways or processes to which local actors can do so. Developing
skills and competencies for local development policy can be strenuous. The actors that are
involved in LED have increased, including communities, governments, organisations, and non-
University of Ghana http://ugspace.ug.edu.gh
45
governmental organisations (NGOs) and private enterprises. Some of these actors explained by
Helmsing (2003) is provided below.
A. Community-Based Organisations: this may refer to grassroots territorial CBOs or
self-selected grassroots groups. The former one is more representative and serves a lot
of purpose. Helmsing (2003, p. 75) noted that, “often, territorial CBO’s are framed by
local traditions and customs and increasingly also by local or national government
legislation”. The self-elected grassroots groups usually serve a single purpose for
instance, a man’s football club. These groups are less hierarchically structured and is
more homogenous (Helmsing, 2003).
B. Local Government: Local governments are one of many leading actors of LED. Local
authorities are largely required to play the lead role in creating an enabling environment
for LED. However, local authorities spend only minute amount of their budgets on
direct LED support (Helmsing, 2003). Local governments functions to enhance service
delivery and serve as source of economic opportunity for accelerating local enterprise
development and competitiveness.
C. Local Producers and their Associations: Local producers are important stakeholders
of LED that spearhead the creation and expansion of enterprises. The joint action of
firms and associations plays a critical role. However, it is often difficult for producers
to combine both competition and cooperation (Helmsing, 2003). According to
Helmsing (2003), some commentators have shown that inter-firm and joint cooperation
is not easily achievable and thus requires a kind of external interventions.
D. Donor Agencies/ Non-governmental Organisation: Actors of LED development is
not limited to only local institutions, but to other sectorial, national and international
agencies. Participation of these stakeholders may promote LED. Donor agencies like
Japan Social Development Fund facilitate local economic development.
University of Ghana http://ugspace.ug.edu.gh

46
2.5.6. Determining the LED Factors
The location inequalities of LED have motivated many policy makers and policy analysts to
identify the economic and marketing strategies to boost local competition and efficiency at the
local and national level. So many factors can be used to measure LED. However, how to
measure some of the indicators is another challenge (Wong, 2002). According to Wong (2002),
there are eleven (11) broad factors that are regarded to be very important to LED and through
a comprehensive empirical literature review, there was a set of indicators that have been
identified as measures of the eleven (11) factors. Assessment of these factors adequately serve
as a measure of LED. Wong (2002, p. 1834) defined indicators as “proxy measures to provide
operational definitions to the multidimensional concept of LED”. The indicators covered areas
including economic, social and physical dimensions of LED. The definition and fitness of
classification of these factors may vary from study and context to another.
Table 2.1 shows the list of factors of LED that guided the selection of indicators. It is evident
that some factors (such as capital and finance, physical and industrial structure, and human
resources) are relatively easier to measure than other factors (like intangible factors such as
institutional capacity, quality of life, community image and business culture (Wong, 200). The
relationship between LED and some of the factors such as industrial structure or infrastructure,
knowledge and technology is not clearly tackled. This is because of the inadequate availability
of data and methodological difficulties in substantiating the relationship. There have been
agreement over the significant contribution of the immaterial factors. However, the theories
and the existing literature on these factors are not adequately established because the causal
link among the factors and the LED process are not generally direct (Wong, 2002).
University of Ghana http://ugspace.ug.edu.gh

47
Table 2.1. Definition of LED Factors
LED Factor Study Definition
Locational factors Refer to attributes external to an area; the accessibility advantage
gained from the spatial interplay between an area and its partners in
the production and consumption process—for example, the markets,
the suppliers, major business centres.
Physical factors Refer to the availability and cost of suitable sites, premises and other
built environment resources for development.
Infrastructural
factors
Embrace the more immobile and long-term fixed production factors
of an area; they are public goods as well as capital goods, which
facilitate the development of other economic development activities.
Human resources Include the availability, participation level, quality, attitude, cost and
other characteristics of the workforce.
Capital and
finance
Are the financial resources (such as money and credit) available for
investment in local businesses and for economic development
purposes?
Knowledge and
technology
Include frontier activities in research, knowledge development and
technological innovation.
Industrial structure This is the mix of industrial sectors in an economy; the degree of
concentration of a few industrial sectors may affect its growth
potential or vulnerability to economic changes.
Quality of life Refers to the desirability of a place for living in terms of its non-
marketable public goods, which include the quality of the natural and
built environment, public amenities and cost of living.
University of Ghana http://ugspace.ug.edu.gh

48
Business culture Refers to the entrepreneurship and the dynamics of indigenous
business activities such as the ability of business start-ups and the
capacity to innovate and adapt.
Community
identity and image
Include the degree of mutual co-operation and social responsiveness
of the residents to their daily living in a community, their attitude to
business development and how this ‘character’ is being perceived by
the outside world.
Institutional
capacity
Refers to the coherence of local policies and the co-operation among
local actors to provide support and assistance to economic
development activities.
Source: Wong (2002) Developing Indicators to Inform Local Economic Development in
England
Traditional factors such as land, labour, capital, infrastructure and location were rated among
others as the ingredient for successful LED (Wong, 2002) while human resource appears as the
most common factor rated higher by actors of different views on LED. Other scholars have
identified participatory local economic planning, physical planning, urban planning and design,
infrastructure and socio economic overhead capital as the important components (Helmsing,
2003). The study therefore used locational, infrastructure, business culture, human resource
(participation of citizens) and capital factors as proxies for LED. Vazquez (2002) observed that
LED would be beneficial, if there is employment for the local people, social interaction,
creation of physical infrastructure and developing the skills of individuals and groups.
Though there are many other factors that might influence the success of LED, these factors
were carefully selected in view of the significant contribution to the success of LED that is
University of Ghana http://ugspace.ug.edu.gh

49
generally identified and recognised by actors of different perspectives of LED (Wong, 2002,
Helmsing, 2003).
2.5.7. Local Economic Development in Ghana
LED in the simplest form responds to the needs of families and individual households trying
to enhance their living conditions through investment in their present livelihood activities or
attempting to start new business (Wekwete, 2014). Wekwete noted that local authorities
managing LED should provide services including entrepreneurship training, local financing,
infrastructure investment, technology and mentoring support.
The central government is “the hub of policy” formulation, “institutions and funding for public
sector developments” (Wekwete, 2014, p. 19). LED exists within the national policy
framework of sector ministries or special agencies that support local development programmes.
One main role of implementers of LED is to involve opinion leaders, local policy makers and
local stakeholders to identify their needs in order of importance to them and support the
implementation process.
Infrastructure, institutional development and investment from sector ministries is only
supportive of LED development when resources from the centre are transferred to local levels
(through fiscal decentralization) and are supplemented by local efforts to mobilise and raise
their own revenues. The role of central government and ministries should primarily be
concerned with shaping both the policy and investment instruments leaving implementation to
be shaped by local organisations. This balance of responsibility and commitment is a critical
prerequisite for sustainable LED (Wekwete, 2014)
For LED to be effective, it must be considered as a long term national economic development
plans and not as a seasonal ad hoc programmes undertaken only when some donor funds are
available (Wekwete, 2014).
University of Ghana http://ugspace.ug.edu.gh

50
2.5.8. Selecting a Local Economic Development Role
Local Economic Development Planning is done at the local level guided by the District
Development Planning Officer. The LED plans however, must be within the national local
economic development policy framework. The regional coordinating council also gives
coordinating roles to ensure that the formulated plans are feasible and implementable. Once
plans are formulated, “any organisation interested in LED needs to be clear about the role it
needs to play in the process” (Blakely and Bradshaw, 2002, p. 85).
Organisations have constraints emanating from their historical and current roles for which they
are established. It is often difficult for organisations to go beyond their mandate (Blakely &
Bradshaw, 2002). The District Assembly has been established to bring government closer to
the people. District Assemblies therefore have the responsibilities to provide services,
employment and overall development to the district. According to Blakely and Bradshaw
(2002), there are four courses of action open to organisations: the role as an entrepreneur, a
coordinator, the facilitator, a stimulator or any combination of these roles.
The role as an entrepreneur: in this role, organisations are to operate their own business
enterprises. Local governments or community-based organisations can operate commercial
enterprises by themselves (Blakely & Bradshaw, 2002). Lands or buildings controlled by
district assemblies for conservations or future development can be transformed into economic
purposes. It is very apparent that District Assemblies can take great opportunity of the
commercial potentials of lands and buildings under their control. Road verges, beaches, forest
reserves and tourist sites may be used for a variety of activities that creates jobs. The
development of special “themes” or talents for particular localities can increase visitor traffic
and that is a great potential for commercial operations.
University of Ghana http://ugspace.ug.edu.gh

51
Community based organisations can be in the right position to operate enterprises as
employment creators when private enterprises are not, or the delivery of certain service to
which the private sector may be unwilling to take such risks (Blakely & Bradshaw, 2002).
There are times where local governments or DAs provide goods and services (employment
such as GSOP projects) for their own operation, especially when these goods and services
would be imported from outside the area or locality (Blakely & Bradshaw, 2002). For example,
the provision of hotels, tree planting, leisure parks, washing bays and concrete or crushing
plants.
When a district assembly has an objective to redevelop its “depressed industrial or commercial
areas in order to increase local trade, employment, revenue, it can take an active role either
individually” or by collaborating with private enterprises or community based organisations
(Blakely & Bradshaw, 2002, p. 86).
The role as a coordinator: Local governments or community based groups can play the role
of coordination to formulate polices or strategies for local development. Since services
provided by both government and by community and business entities have a local impact,
local councils are increasingly assuming leadership in planning and coordination of services
within their localities (Blakely & Bradshaw, 2002). Part of this role to LED may include DAs
or community groups collecting and evaluation economic information such as workforce,
employment levels, unemployment, establishments and property data bases. The DA may also
work with other government departments/ agencies, community-based groups, donor agencies
and business organisations to formulate economic plans, objectives and strategies. This
approach can also ensure consistency with national economic policy and strategies that would
give the local economy a maximum attention.
University of Ghana http://ugspace.ug.edu.gh

52
Economic development plans or tourist development plans that have been prepared in some
areas can be synthesised as a joint development plans between the spheres of government and
other sectors. Blakely and Bradshaw (2002, p. 87) noted that, “plans developed and imposed
by government alone are unlikely to have the same level of commitment or resource input that
joint plans would have”.
Regional planning bodies with representation from each sector usually work effectively
with government to produce these plans. A regional approach will normally be more
effective because government attention will be focused on regional economies. It will
also represent a more manageable level of cooperation between state and local
governments. Regional bodies that adequately represent all sectors, and that produce
realistic analyses and approaches, are likely to have high credibility with government
and thus considerable political influence (Blakely & Bradshaw, 2002, p. 87).
The role as a facilitator: Local governments /district assemblies can promote development by
“improving the attitudinal environment in the community or area” (Blakely & Bradshaw, 2002,
p. 87). This might include structuring and reforming the development process, improving
planning procedures and zoning of regulations and by-laws. District Assemblies may use their
planning powers to establish employment or allocate certain developments to particular areas
that influence the development of a particular class or section of the economy. Through
advertisement or direct approaches by the local authorities, development potentials could also
be identified and marketed to prospective business clients.
Elected local representatives and council members can articulate the concerns of the local
people by bringing to the attention of the central government the local economic problems and
prospects (Blakely & Bradshaw, 2002). This advocacy would be strengthened and considered
by the central government if, local governments are able to provide evidence of full support of
University of Ghana http://ugspace.ug.edu.gh

53
business sector and community on the local concerns in addition to the proposed realistic and
attainable remedies.
The role as a stimulator: Both the DA, community groups, town and area councils can
stimulate business development by taking certain actions to induce firms and other
organisations to enter or remain in the community/ district (Blakely & Bradshaw, 2002). The
stimulation may involve developing business brochures, establish industrial estates, warehouse
and manufacturing workshops.
Local governments or the DA can build manufacturing shops and stores and rent at reduced
amounts for operators in localities where the provision of suitable business premises is a
problem. In terms of tourism too, district assemblies can also promote a particular activity or
site by itself when private sector is not willing to do so. In addition, the DA can organise and
sponsor periodic trade fairs to market business potentials (such as craft and leatherwork) in the
district. The course of action a town or an area council decides to pursue depends on the
situation of the locality (Blakely & Bradshaw, 2002). Community or local government
initiatives is not entirely a solution to all local problems but a significant complement to
stimulate national economic development.
2.5.9. The Dualistic Model of LED
Several models and theories contribute to the understanding of local and regional economic
development. Bengt (2007) has identified three divergent concepts that have contributed to the
understanding of the discussion on regional economic development. These perspectives
involve (1) the major life-setting in the territory, (2) the general outlook of the people in the
area or locality and finally (3) the critical competence needed to implement evolving issues.
University of Ghana http://ugspace.ug.edu.gh

54
The life-setting: The way of life of the rural and urban people is determined by the life-setting
of the people. The rural life setting of the people is mechanistic who are bounded together by
string ties, solidarity, common characteristics and principles such as reciprocity. Informal
institutions guide them. However, in the urban setting, there are weak ties and the people are
less bounded together because they are more specialised. Again, the informal institutions give
way for formal institutions to guide the conduct of people.
The outlook: a local outlook of the people indicates that there is regard for customary norms
and beliefs. This means that the strategies of addressing local challenges and deeply rooted in
the established traditions of the people. On the other hand, a global outlook implies that “the
mental and social spaces of local communities, their members, individuals as well as
collectives, are unbounded and (therefore) quite separated” (Bengt, 2007, p. 14). People who
have global outlook engage in long distance /global networking. Therefore, their values and
norms may differ significantly from those to which they are networking. As rightly indicated
by Rodrigue-Pose and Tijmstra (2009), globalisation reduces the physical and mental space as
capital, ideas, goods and people can travel very easily which makes economic development
feasible for localities.
The Competence: This component ranges from focused to complex. According to Bengt
(2007), focused competence refers to the skills, abilities and experience acquired by members
of the locality over time to which they can use to find new ideas and to address challenges that
they face. Effective use of focused competence over a period can result in the development of
a special skill that will become an innate quality. This innate or embodied quality may even be
superior to formal knowledge and analytical thinking. On the contrary, complex competence
is the competence derived from the combined skills and knowledge acquired from different
knowledge areas that is practiced consistently. Bengt (2007) observed that complex
University of Ghana http://ugspace.ug.edu.gh

55
competence is associated with science based findings but others may also be found in the
humanities as well.
2.5.10. Importance of LED
The dynamics of LED in developing countries is influenced by central government agencies.
Peasant farmers now depend on both governmental and quasi-government agencies for
supports and these agencies are expected to provide important inputs such as seeds, fertilisers
and extension (Helmsing, 2001). The prices of crops are largely determined by government
and as well as the purchase of cash crops through the marketing boards. Peasant farmers rarely
have any choice over the decision of price, how much to grow and the profit to yield.
Government mostly dictate to farmers the type of cash crop to produce through their
agricultural policies. The macro and small local enterprises are faced with competition on a
daily basis as many people are engaged in self-employment. This has pushed many Micro,
Small and Medium Enterprises (MSME) on survival strategies, exacerbating poverty rather
than promoting economic growth (Helmsing, 2001).
Helmsing (2001) indicated that, in some Sub-Saharan countries, basic services were provided
freely to the public by government agencies. Financial assistance (grants, and soft loans) were
needed to finance important physical infrastructure and for investment in basic services.
Nevertheless, infrastructural investment depends on the decision of government and the ability
to obtain donor funding (Helmsing, 2001). Based on this argument, local economic
development of an area largely depends on the interventions of central government. For
instance, allocation of resources to governmental agencies in agriculture must be considered in
a general budget. Again, aid agencies and programmes were allocated or assigned to localities
based on general criteria and on the policy requirements of the aid. Regional development
policies only served as suggestive guidelines for the spatial allocation of public investment.
University of Ghana http://ugspace.ug.edu.gh
56
The complete control of all aspects of economic life by central government has contributed to
the underdevelopment of the local economy.
The successful local economic development could be beneficial in the following ways as
enumerated by Vazquez (2002). Employment of local societies and generation of local dialogue
or social interaction; Improvement of living standard of local citizens; Creation of physical
structures such as markets, roads that promote economic activities; Generation of sustainable
employment in businesses that make it enduring to global economic changes; Developing skills
of individuals and groups towards high productivity; Increasing the income of households and
/many more.
2.5.11. Challenges of Local Economic Development
Local governments have included in their plans to implement local economic development
within their jurisdiction and in partnership with private sector. The implementation of LED
plans and policies can be carried out by the public sector, the private and non-governmental
bodies from different levels depending on their functional capacities and abilities. Despite this,
there are limitations or challenges to the implementation of LED. First, the development of
local strategies, formation of partnership and coordination of stakeholders among others
requires a considerable amount of organisational efforts that consume a lot of time. The process
formulation is usually strenuous even before the commencement of the implementation itself
and is worse in localities where there are no institutions for associations to register within the
local government unit like the District/ Municipal Assembly.
Second, there is the possibility that some district assemblies will not be able to identify and
design or implement suitable local economic development strategies. Moreover, the mere
involvement of local participants in the selection of strategies is not a guarantee for successful
and adequate policies and strategies (Helmsing, 2001). Political interference is another critical
University of Ghana http://ugspace.ug.edu.gh

57
factor that sometimes undermines success of implementation. Interference of politicians can
influence and misdirect the location and beneficiaries of LED programmes and activities. The
selection of short-term policies that would score political marks may be considered as a
detriment to long term and balanced policies that may not have immediate benefits to the
public.
Third, successful Local Economic Development lies on policy guidelines. The ability and
commitment of local authorities to implement and coordinate LED activities amidst the low
level of education of citizens can enhance development. High illiteracy rates due to lack of or
poor quality of education can be serious threat to development. Education is very vital for the
success of LED. However, most of the districts in Ghana especially in the Builsa North District
are associated with high levels of illiteracy (see Builsa North Statistical Report, GSS, 2010)
which militates against smooth growth and development of local businesses.
Access to soft loans and micro finance programmes can boost local economic development.
The main challenge is the inability of loan beneficiaries to repay their loads (Bank of Ghana,
2010). This could be due to unstable economic factors (inflation). Fluctuating inflation rates
has made it difficult for investors who are granted loan facilities from banks to repay mainly
because of low patronage of their goods and services.
Obtaining suitable data to measure a number of local economic development indicators was an
impediment. For example, there is much data on infrastructural factors than financial factors
(Wong, 2002; Helmsing, 2003). This may be attributed partly to the fact that information
regarding financial institutions and telecommunications are protected as commercial secret.
Due to competition, businesspersons of financial institutions unlike public utilities fear to make
information regarding their business available or known to the public.
University of Ghana http://ugspace.ug.edu.gh
58
The quality of data sources is another key challenge in the attempt to measure local economic
development indicators. Most of the data are obtained from sources that were gathered
infrequently or have been initiated only one time by government departments. An obvious
example is the Ghana Statistical Service and employment data. Furthermore, some of the
available data may not even contain locality specifics such as districts, cities and towns.
Furthermore, lack of accountability and transparency in managing public resources would
undermine the success of LED. Accountability and transparency is highly needed to ensure
efficiency and effectiveness in the attainment of policies.
2.6. Fiscal Decentralization to Facilitate Local Economic Development
Fiscal decentralization is the transfer of financial or economic responsibilities of the national
government to sub-governments to ensure economic development and efficiency of the
government (Oates, 1993). In this study, fiscal decentralization entails the allocation fiscal
authority and responsibilities to district assemblies to exercise both revenue and expenditure
powers.
The “basic economic case for fiscal decentralization is the enhancement of economic
efficiency: the provision of local outputs that are differentiated according to local tastes and
circumstances results in higher levels of social welfare than centrally determined and more
uniform levels of outputs across all jurisdictions” (Oates, 1993, p. 240). Even though this
assertion has been established mainly in a fixed context (see Decentralization Theorem by
Oates 1972), the whole assertion should have shown an empirical evidence in the dynamic
situation of economic growth. There are actually “strong reasons, in principle, to believe that
policies formulated for the provision of infrastructure and even human capital that are sensitive
University of Ghana http://ugspace.ug.edu.gh

59
to regional or local conditions are likely to be more effective in encouraging economic
development than centrally determined policies that ignore these geographical differences”
(Oates, 1993, p. 240). Other researchers have also expressed this view on local government
and fiscal decentralization (Xie, Zou & Davoodi, 1999). Unfortunately, Oates (1993) showed
that there is no “formalised theory” that explains such link between FD and local economic
development. Like the theory would have been useful in determine the parameters (which
programmes are “jurisdictional specific”) on which the social and infrastructure gains
contribute to LED and their order of significances.
The economic case of FD is based or dependent on the anticipated response or reaction of local
authorities to the wellbeing of their constituencies. Conyers (1990, p.18) argued that,
“decentralization may increase the participation of people at the local level, but sometimes it
is only a small privileged elite group who get to participate”. These elites may focus on
achieving their own self-interest to the detriment of the citizens.
There are certain conditions that must be fulfilled to enable local governments perform
effectively. These conditions were stressed in Bird’s (1986) paper that provides the scope for
autonomous fiscal decision with the right kind of indications and rewards to local governments
(Oates, 1993). Oates (1993) explains two of Bird’s conditions as follows:
First, local governments require their own independent sources of incomes. Intergovernmental
transfers from central government to sub-governments play a significant role in the fiscal
system of the country but should not be extreme. However, in developing countries like Ghana,
such intergovernmental grants constitute the largest proportion of local governments’ revenue.
This has the tendency of undermining the autonomy and essence of decentralized decision
making (Oates, 1993). For local governments to have full fiscal discretion, they should be able
to raise large proportion of their funds from their own revenue sources. This is vital according
to Bird (1986) for two main reasons. To begin with, in a political setting, intergovernmental
University of Ghana http://ugspace.ug.edu.gh

60
transfers usually come with certain conditions/ strings attached. In addition, these conditions
are required to be followed diligently by local authorities. If local governments or district
assemblies are dependent largely on transfers from central government, it is inexorable that
central governments interference/ intrusion in spending decisions will be obvious. This suggest
that decisions regarding the form and level of local programmes and projects will be the result
of negotiations between local authorities and central government, undermining local fiscal
autonomy. Finally, over dependence on intergovernmental transfers discourages responsible
local decisions. It is very necessary that when local authorities plan to expand or contract
programmes, the must take into consideration the cost and benefits of these decisions. When
funding is from government, there is actual economic cost to the local unit to which the decision
is taken (Oates, 1993). Bird (1986) proposed that when funding is from local’s own revenues,
especially in relation to programmes to be carried out, there would be critical analysis of the
cost of the decisions. This is very important for the proper function of the fiscal system.
The other condition concerns with the nature of local governments own revenue. Bird (1986 in
Oates, 1993, p. 241) paid a critical attention to the “characteristics of a good local tax”, and it
is “important in the vertical assignment of revenue instruments to ensure both the local taxes
do not induce distorting movements of economic goods and activity. Instead, they are tied, at
least roughly, to benefits in order to provide the right sorts of cost signals to the community on
local fiscal decisions”. This condition is not easy for countries with emerging economies due
to the “absence of requisite institutions for revenue administration” (Oates, 1993, p. 241).
The transfer of fiscal powers and responsibilities to local units or governments may either
decrease or deepen the income disparity of the citizens within the locality. It was found that
higher level of tax decentralization is linked with greater household income inequality in a
country (Sacchi & Salotti, 2014). Sacchi and Salotti (2014) observed that although fiscal
University of Ghana http://ugspace.ug.edu.gh

61
decentralization may enhance efficiency, it might have negative consequences on the income
distribution of households in the country.
Local governments under fiscal decentralization deserves to be given considerable amount of
taxing powers. In that instance the local people will be able to demand for accountability from
local officials especially in cases where they pay heavy taxes to fund local public activities as
opposed to being funded by donors or central government funds. When heavy taxes are
imposed on the citizenry that posed a huge burden on the local people, they may be compelled
to demand for accountability from their duty bearers. On the other hand, low taxes or rates may
be very insignificant and hence they citizens would not feel the impact so much to demand for
accountability from their political officers (Bahl, 1999).
In Oates own view, property tax is “quite a good source of revenue”. It is therefore fair and
reasonably to require citizens who own property to pay for local services but many developing
countries and for that matter deprived districts may not have the “administrative capacity at
present to implement property taxation” (Oates, 1993, p. 241).
In the view of Berg (2004, p. 33) “the success of decentralization reforms hinges on the way
fiscal decentralization is designed and implemented.” As Akudugu (2013) noted,
decentralization and its resultant sub government system thus create the platform for the
promotion of LED. “It is well accepted that local governments play a significant role in the
economic development process and that economic development success is largely dependent
on effective local government participation” (Sjostrom, 2010, p. 10). Decentralization must
transcend just enhancing the capacity of local authorities for effective utilization of the
resources allocated to them to encompass training of their role as promoters of LED
(Alberquerque, 2004). This suggest that there are more expectations on local government
authorities to promote LED in their localities that was previously been the role of central
government (Akudugu, 2013).
University of Ghana http://ugspace.ug.edu.gh

62
In summary, FD seems to have a potential useful role in contributing to LED, but the translation
of these potentials to actual economic benefits are subject to a number of important factors and
conditions including local institutions responsiveness to local wellbeing which is also
contingent on the proper fiscal institutional structures (Oates, 1993) of the country.
2.7. Empirical Studies
This section presents the review of related works categorised into two main areas; review of
literature on the positive link between fiscal decentralization and economic development, and
the negative link between fiscal decentralization and economic development.
2.7.1. Positive Relationship between Fiscal Decentralization and Economic Development
The assumption that fiscal decentralization contributes to economic efficiency could have a
corresponding impact on the dynamic setting of economic growth (Oates, 1993).
Decentralization has enhanced the claim of basic rights (in health, economic, education, water
and sanitation) by the local communities but with support from NGOs, even though with some
shortfalls in NGOs strategies (Crawford, 2010). Without the help of local NGOs as in the case
of Northern Ghana, Crawford (2010) found that local authorities were not responsive to the
local needs. While it is generally believed that the constraints of the District Assemblies are
limited finances, the locals argued that they are just not willing to meet their rights and needs.
This explanation is given as a result of the fact that, there are no strong downward
accountability mechanisms to propel duty bearers to be responsive, and this is a manifestation
of “democratic deficits in the national political framework of decentralization in Ghana”
(Crawford, 2010). Decentralization actually has the potential of enhancing the poor to make
claims for their basic rights, if the right context is put in place, for instance, strengthening the
University of Ghana http://ugspace.ug.edu.gh

63
strategies of the local NGOs which are found to play a major role in the enhancement of rights
by the rural poor.
The effect of decentralization on health and education jointly as proxies for measuring human
development was assessed. The study showed a significant positive correlation between fiscal
decentralization and human development. In specific terms, fiscal decentralization was found
to be positively related with educational output (Habibi, et al., 2003).
According to Akai and Sakata (2002), fiscal decentralization indeed contributes significantly
to economic growth though there are other factors (such as political stability and inflation) that
affect economic growth. They explained that their results were able to unveil the benefits of
fiscal decentralization because of the method they adopted which was quite different from other
researchers who found no effect of FD on economic development.
Meanwhile, the implementation of higher amount of tax decentralization is also associated with
household income disparity (Sacchi & Salotti, 2014). Though the study used limited data, it
was recommended that the study should be replicated upon the availability of data. Also, a
study of developing countries is very important as they have also implemented some kinds of
reforms to enhance the success of their decentralization programme.
Despite the positive influence of decentralization on poverty reduction (Asante et al., 2010),
there are counter findings that proved negative or no relationship between fiscal
decentralization and poverty reduction (Xie, et al., 1999; Zhang & Zou, 1998). A single view
of decentralization will not have any significant impact on poverty. Instead, political, fiscal and
administrative decentralization must be considered jointly to ascertain the overall benefits.
These contradictory findings may be attributed to the fact that some aspect of decentralization
(only Fiscal Decentralization) was considered by some scholars (Xie, et al., 1999; Zhang &
Zou, 1998) in determine the impact on growth and development rather than simultaneously
assessing all the forms of decentralization at the same time as done by Asante and Ayee (2010).
University of Ghana http://ugspace.ug.edu.gh
64
Asante and Ayee (2010) noted that access to political power and resources as well as
transparency and accountability in the management of citizens have a link with poverty.
Complete devolution of resources and authority to local units can create opportunities for local
leaders, community members, Non-governmental Organisations (NGOs) and private sector
operators to be engaged fully in the development process of their areas. Development of local
economic infrastructure such as market sheds, good roads, access to credit and farming inputs
can enhance local businesses and hence would liberate citizens out of poverty. But the extent
to which this can be achieved depends largely on the relationship between central and local
authorities and the commitment of national government to pursue decentralization to its
maximum conclusion.
Ogawa and Yakita (2009) have analysed fiscal decentralization and equalization transfers in a
two region model of endogenous growth and found out that the desire tax rate preferred by the
local governments is positively linked with fiscal decentralization. Their findings also showed
that there is an optimum level of fiscal decentralization to achieve national government’s target
of growth maximisation, however, the degree of fiscal decentralization preferred by the
national government is too much to include the highest regional wellbeing.
2.7.2. Negative Link between Decentralization and Economic Development
Throughout the literature, some of the empirical findings of the impact of decentralization on
economic development suggest no successful positive relationship between the two variables
despite the predominant widespread view that fiscal decentralization contributes to local
economic development (Moche, et al., 2014; Sacchi & Salotti, 2014). What is not done right
enough to achieve the economic benefits of fiscal decentralization? The move by many policy
makers to implement fiscal decentralization in their countries must be informed by certain
benefits. This study though did not seek to identify those other factors that were highly
University of Ghana http://ugspace.ug.edu.gh

65
associated with decentralization, the main aim was to find out whether the monetary allocations
made to local governments were used to enhance the growth of micro and small enterprises.
The results obtained from these papers below have not been able to substantiate the potential
benefits of fiscal decentralization and local economic development.
Some scholars have found that fiscal decentralization intensifies poverty in South Africa
(Moche, et al., 2014). They however postulated that the findings should be interpreted with
caution since the study had used limited sample size. That notwithstanding that, the findings
might not be strange because district assemblies may be receiving mainly intergovernmental
transfers that could be used for poverty reduction but may be diverted for other purposes other
than poverty alleviation. Studies in Ghana have shown that there is there is insufficient
evidence of the positive link between poverty alleviation and FD using non-monetary
measurements (Azila-Gbettor, et al., 2014).
It was observed that implementation of fiscal decentralization may result in adverse
consequence on income (Sacchi & Salotti, 2014). As rightly stated by Sacchi and Salotti
(2014), there has however not been any general consensus in the existing economic literature
that proves the size and sign of the impact of decentralization on inequality and the channels
involved.
A study in Turkish provinces was conducted to investigate the effect of decentralization on
economic growth and development using a panel data set comprising of sixty-seven provinces
from a period of twenty-five years. The main objective of the study was to determine whether
there is any major impact on economic growth and development in the provinces as a result of
variations in local decentralization across the provinces and time. The results of the study
revealed a weak economic development among some of the municipalities (Tosun & Yilmaz,
2010). The findings also showed that the formation of additional provinces from the current
University of Ghana http://ugspace.ug.edu.gh

66
ones had no substantial effect on economic growth and development. It must be noted that,
Tosun and Yilmaz used the number of local units per capita and the number of local units per
square kilometers as proxies for decentralization.
A longitudinal study on the effect of decentralization on economic development was conducted
using a set of time series data of sixty-three countries ranging from 1960 to 2000. The results
of the study indicated an inverse relationship between fiscal decentralization and Gross
Domestic Product (GDP) growth and between GDP growth and political decentralization (Im,
2010).
Habibi et al. (2003) also discovered a negative relationship between fiscal decentralization and
infant mortality in his study on fiscal decentralization and human development. Similar studies
conducted by scholars in the US and China (Xie, et al., 1999; Zhang et al., 1998) proved an
inverse relationship between fiscal decentralization and economic growth.
Tax revenue was shown to have a slight undesirable impact on economic growth in Ghana
(Kwakye, 2013). But the relationship became statistically significant when it was interacted
with democracy. His findings indicated that tax evasion is ubiquitous in democratic regimes.
2.8. Conclusion
In this chapter, fiscal decentralization and local economic development theories behind the
study were discussed. Some perspectives on how fiscal decentralization affects LED were
explained. In addition, a review of the history of decentralization, the merits and demerits of
both FD and LED, actors and some determinants of local economic development were duly
explained.
University of Ghana http://ugspace.ug.edu.gh

67
CHAPTER THREE
METHODOLOGY
3.0. Introduction
The study examines the effect of fiscal decentralization on local economic development in the
Builsa North District. This chapter specifically comprises of the research setting and the
justification for the study area, the research design, the method of data collection, the method
of analysis and finally the chapter conclusion.
3.1. Research Setting
This section seeks to describe the political, physical, social and economic characteristics of the
Builsa North District. The section provides background information about the setting in which
LED policies are formulated and executed.
Beginning with physical characteristics, the chapter presents the location, resource base,
vegetation and climatic condition of the district. The chapter also examines the district local
economy, demographic characteristics, political and administrative set up of the district. The
source of information for this section is largely obtained from the 2014 Builsa North District
Medium Term Development Plan coupled with direct observations.
3.2. Builsa North District in Context
The Builsa North District is one of the thirteen districts in the Upper East Region. The Builsa
North District Assembly (BNDA) was created by a Legislative Instrument (LI) 2148 on the
15th day of March, 2012. The district capital is Sandema. The district was initially known as
Builsa District and had been in existence for more than twenty years until the current
demarcations that led to its present name, Builsa North District (Builsa North District
Composite Budget, 2015).
University of Ghana http://ugspace.ug.edu.gh

68
The total estimated land area covered by the district is 816.44km2, which comprises of about
12.1% of the total land area of the Upper East Region. The District is surrounded to the east,
by the Kassena-Nankana West District Assembly and to the north by the Kassena-Nankana
East Municipal Assembly. It is also bordered to the west, by the Sissala East District Assembly
and to the south by the Builsa South District Assembly. The district profile was obtained from
the Builsa North District 2015 Composite Budget.
3.2.1. Demographic Characteristics
The District population as per the 2010 population and housing census was 56,477 with a
population growth rate of 1.1 percent representing 5.4 percent of the regions’ total population.
There are more females (50.8%) than males (49.2%). About ninety-eight percent (98.2%) of
the population is rural and is more youthful (13.8%) of the 5-9 age groups indicating a broad
base population pyramid. The age dependency ratio for the district is 88.0 and is higher for
males (91.0) than of females (85.2) (GSS, 2010).
About 50.5 percent of the population who are 11 years and older are literate with almost half
(49.5%) of the population, not literate. The proportion of literates are higher for males ((52.6%)
than that of females (47.4%) (GSS, 2010).
This growing trend of the population of the district has implications for local development. A
youthful population would require more educational facilities and employment. Based on these
demographics, a study on FD was necessary to ascertain how the district uses its resources for
LED.
3.2.2. Administrative and Political Set up
The District Assembly is the highest political and decision making authority of the district.
The District Assembly is responsible for promoting both political and socio-economic
development within their administrative area. The district chief executive is the political head
University of Ghana http://ugspace.ug.edu.gh

69
and chairman of the District Security Council (DISEC) in the district. There are forty-five (45)
Assembly Members including the member of parliament. From the forty-five Assembly
Members, only seven are women. The District is clustered into five town and area councils,
thirty-one (31) electoral areas with 98 communities as part of the decentralization programme
to promote citizens’ involvement or participation in local decision making. The District has
three main towns namely; Sandema, Wiaga and Chuchuliga. The political map of the Builsa
North District is provided at appendix five.
The BNDA has staff strength of about 140 comprising of 134 established staff (on government
pay roll) and six non-established staff (Assembly IGF pay roll). Twenty-seven of the
established staff are senior staffs.
The decentralized departments in the Builsa North District include the District Agricultural
Development Unit, the District Health Directorate, the District Community Development and
Social Welfare Department, Physical Planning Department, Birth and Deaths Registry, the
Information Services Department and the District Environmental Health Unit, which support
the DA to implement its policies. Most of these departments are still operating as line agencies
under their mother ministries. Currently in the new decentralization policy, efforts are being
taken to include all decentralized departments in the District Assembly System.
The national agencies which do not form part of the departments of the Assembly that exist
in the District include; the National Service Secretariat, the National Commission for Civic
Education, the Immigration Service, the Customs Excise and Preventive Service (CEPS), the
Police Service, and the National Fire Service.
The paramount chief of the Builsa traditional area is the political head of the traditional
political structure in the District. There are chiefs and sub-chiefs under the paramount chief.
The chiefs are the custodians of the Builsa culture and are responsible for traditional political
University of Ghana http://ugspace.ug.edu.gh

70
functions such as arbitration of disputes and organisation of local festivals (example Feok1
festival). Traditional leaders play significant roles including participation in decision making
and implementation of developmental policies of the district.
3.2.3. The Local Economy
The district’s local economy is comprised of four main sectors; agriculture, industry, commerce
and services (Builsa North District Assembly MTDP, 2014). Petty trading and small-scale
business enterprises are the major components of commerce in the district. The agricultural
sector is the predominant economic activity and remains the main occupation of the citizens
with about 67 percent engaged in it. Cereal crops growing, poultry and livestock rearing
constitute the major agricultural activities of the people in the district. The main crops
cultivated in the district include, rice, millet, groundnut, beans and maize while cattle, goat,
sheep, poultry and donkey rearing are the livestock raised in the district. It is also common in
the district to find people engaged in almost all the four sectors of the economy as a means of
diversifying their livelihood. Petty trade revolves around the three-day market cycles that take
place in all the major towns and communities in the district. The main marketing centres in the
district involve the Sandema Market, Wiaga Market, Chuchuliga Market, Siniensi Market and
Kadema Market. Commodities that are traded in these markets are most often food or food
stuff such as groundnuts, millets, sorghum, pito2, beans, shea nuts and shea butter, livestock,
poultry and other provisions such as clothes, cooking utensils. Commerce in the district is
predominated by the women group in the district.
The local industry is not well development. This is a common trend of development in Ghana,
where the rural areas are predominantly engaged in agricultural activities while the urban areas
1 Feok festival: it is an annual festival celebrated by the Builsa traditional area to commemorate the victory of
their forefathers who fight against the slave masters. 2 Pito: It is a type of beer produced from fermented millet or sorghum in Northern Ghana
University of Ghana http://ugspace.ug.edu.gh

71
are otherwise (Akudugu, 2013). There are however various local industrial activities in the
district. Some of these activities involve rice processing (rice parboil), groundnut oil extraction,
shea butter processing, dawadawa3 processing, pito brewing as well as the handiwork industry
that comprises the smock weaving, basket weaving and rope making.
Few individuals are engaged in the service industry in the Builsa North District. The 2008
Ghana Living Standard Survey indicates that, “the proportion of urban public service workers
is higher compared to that of their counterparts in the rural areas” (Ghana Statistical Service,
2008, p. 37). The main group of people in formal employment in the district are teachers, health
workers and local government workers. The Builsa Community Bank is still the only bank
since the creation of the district that provides banking services to the people in the district. The
rapid growth of the telecommunication sector has provided business for some people in the
sale of mobile phones, and recharge cards. Tourism potentials exist in the district although
unexplored. Notable tourist sites or activities in the district that could be promoted include, the
Feok Festival, Akumcham4 in Siwaransa, Fiisa Shrine, Akumgieng Historical Fish Pond in
Wiaga as well as baskets, smocks, pottery, hats and leather works produced in various parts of
the district (Builsa North District Assembly DMTDP, 2014).
Agricultural production in the district is predominantly for domestic consumption than for
market or income. However, farmers sell some of their crops, animals and poultry birds in order
to earn income to be able to acquire what they do not produce. Despite the fact that agriculture
is the predominant economic activity of the people, its economic potentials are largely
hampered by poor soil nutrients caused by severe bad farming practices and erratic rainfalls
3 Dawadawa: It is a flavour, made from fermented seed of a tropical tree; Parkia biglobosa. It is used for
preparing variety of meals in Ghanaian homes 4 Akumcham: It means the creeping shea tree, symbolically referring to Babatu’s (Slave master) wife’s agony
at the spot
University of Ghana http://ugspace.ug.edu.gh

72
(Builsa North District Assembly DMTDP, 2014). The district experiences long periods of
drought and five months unstable raining season. This situation causes poor harvest resulting
in food insecurity in the district. This negative condition has made the district one of the poorest
districts in Ghana.
3.2.4. Justification for the Study Area
The study has purposively selected Builsa North District as its study area due to the following
reasons: the BNDA is one of the poorest districts in Ghana. Right from the time the district was
established, it is still characterised with high rate of illiteracy (49.5%) (GSS, 2010) and majority
of the youth is not gainfully employed. This raises the poverty levels in the district. Farming is
the predominant occupation with majority of the citizens engaged in crop production. However,
farming in the district is largely dependent on one season. In occasions of adverse rainfalls or
droughts, there will be poor yields. This affects the living conditions of the people who have
no alternative source of livelihood. This condition of poor rainfalls and its adverse effects on
food insecurity calls for attention to diversify the local economy. One of the aims of
implementing decentralization was to ensure efficiency and reduction in poverty. The effect of
fiscal decentralization in reducing these problems in the district, which has influence on local
economic development requires urgent investigation. With similar characteristics like other
districts in Northern, Upper East and Upper West Regions, the findings that would be
discovered from this study would likely be applicable to other districts.
Secondly, LED and decentralization are closely linked in the Ghana Shared Growth and
Development Agenda (GSGDA) and are localized in the district action plans as development
strategies. The success or otherwise of LED in the districts raised the question: to what degree
is fiscal decentralization contributing to LED in a district that is severely inflicted with poverty?
University of Ghana http://ugspace.ug.edu.gh

73
Builsa North District is very suitable in investigating the link between fiscal decentralization
and LED.
Finally, searching through the literature, LED studies were found in LED piloted districts like
Bongo District but not much of these studies were found in non-LED piloted districts like the
Builsa North District. All these factors necessitated for the selection of the Builsa North District
as the case study.
3.3. Research Design
The study has adopted the qualitative research method within the case study design. Qualitative
research method would enable the researcher to “explore the meanings, attitudes, values and
beliefs people associate with a phenomenon in order to establish a better understanding, rather
than to test to either support or disprove a relationship” (Boateng, 2014, p. 133). Patton (2002)
view qualitative research as an attempt to understand situations in their natural or unique
context and the interactions there. On that note, this method is very useful in describing the
nature of the problem, issues, and the situation or phenomenon.
A case study was conducted to determine the profile of the Builsa North District and the barriers
or challenges of implementing full FD and LED at the district level. Boateng (2014, p. 142)
noted that a case study is used when ‘how’ and ‘why’ questions are being asked about a present
group of events over which the researcher has little or no control. Yin (1994 cited in Boateng,
2014, p. 142) has discovered four applications of a case study research: first “to explain
complex casual links in real-life interventions; to describe the real life context in which the
intervention has occurred; to explain the intervention itself and to explore those situations in
which the interventions being evaluated have no clear set of outcomes”.
University of Ghana http://ugspace.ug.edu.gh

74
Case studies facilitate both description and explanation of complex casual relationships (Yin,
1994).
The use of multiple sources of evidence in case studies allows an investigator to address
a broader range of historical, attitudinal, and observational issues. However, the most
important advantage presented by using multiple sources of evidence is the
development of converging lines of inquiry, a process of triangulation. Thus any finding
or conclusion in a case study is likely to be much more convincing and accurate if it is
based on several different sources of information, following a corroboratory mode (Yin,
1984: 91).
Whilst the questionnaires were designed to gather descriptive answers to research questions in
line with the guidelines of Yin (2003), the study collected descriptive data on the knowledge
of Assembly Staff on FD, LED and the constraints faced by the Assembly in promoting LED
at the district level by using descriptive statistics. In addition to using mainly questionnaire,
interviews and observations, the study has also used secondary data including the District
Medium Term Development Plan (DMTDP), District Annual Action Plan and the Rural
Enterprise Programme Action Plans.
3.3.1. Study and Target Population
The population of the study included all staff working in the Builsa North District Assembly
(BNDA), the Ghana Education Service Office (GES), the District Agricultural Development
Unit (DADU) and the District Health Directorate (DHD). The target population was senior
staff members of the BNDA and heads of decentralized departments who are core managers of
the DA. Staff members whose work procedure has no relationship with the formulation and
implementation of the district development plans were excluded from the study.
University of Ghana http://ugspace.ug.edu.gh

75
3.3.2. Sampling Techniques and sampling size
For this study, purposive sampling was used to select BNDA as the case study setting. The
district is one of the poorest districts in the Upper East Region, which was also characterised
by higher rate of unemployment (10.8%) (Ghana Living Standard Survey Round Six (GLSS6),
2014, p.38). Secondly, the researcher is a native of the case district favouring the ability to gain
access to subjects and to obtain data especially secondary data.
The study employed a purposive sampling technique to select 22 staff members of the DA and
in addition to three others namely, one person each from the DHD, the GES and the Fiscal
Decentralization Unit (FDU) of the Ministry of Finance and Economic Planning (MoFEP).
These technical staff are the key managers of the DA and therefore have a lot of information
about FD and LED in the district.
The sample size was dependent on the available staff with the required technical expertise in
relation to the fiscal decentralization and LED. The sample for the study included; the District
Internal Auditor, the District Coordinating Director, the District Budget Officer, the District
Planning Officers, the District Finance Officer, the Accounts Officers, the Community
Development Officers, the District Internal Auditor, and the Business Advisory Centre Staff
who were administered with the structured questionnaire. In addition to that, the Directors of
BNDA, GES and DHD, the head of Business Advisory Centre (BAC) in charge of Rural
Enterprise Programme and a staff of the Fiscal Decentralization Unit of the Ministry of Finance
were interviewed using the semi-structured questionnaire. In all 22 structured questionnaires
were administered and eight semi-structured questionnaires were conducted.
3.4. Method of Data Collection
The qualitative method of data collection was employed by the study. The qualitative data
were sourced purposively from the staff members of the Builsa North District in the Upper East
University of Ghana http://ugspace.ug.edu.gh

76
Region through the administration of questionnaires and interviews to gather information from
respondents. This technique was employed to solicit the knowledge and experience of the staff
members of the BNDA on the use of intergovernmental transfers and tax for LED. This
research strategy was also adopted in other similar studies (Azila-Gbettor, et al, 2014). This
has enabled the investigator to examine the Medium Term Development Plan (MTDP) and the
Annual Action Plan (AAP) of the District Assembly on how they promote LED at the district
level.
The study also examined secondary data obtained from the Assembly, GES and BAC. The
researcher has also picked information through naturalistic observation. The qualitative
research method was employed to allow the study explore well into the area by finding how
FD contributes to LED.
3.4.1. Sources of Data
The sources of data for the current study were both primary and secondary. The primary sources
of data were acquired through the administration of questionnaires and face-to-face interviews,
while the secondary data were obtained through the examination of the DMTDPs, the LED
action plans, the district composite budget and the annual statements of accounts.
3.4.2. Data Collection Procedure
An introductory letter from the Department of Public Administration and Health Services was
taken to obtain permission from the District Assembly under study and the individuals that
information was obtained. Based on the research questions and the varied nature of information
needed, the qualitative method of data collection was adopted. In this current study, a case
study strategy was employed.
While the secondary data were taken from the MoFEP, and the District Assembly, the primary
data were basically obtained through the administration of questionnaires to senior staff
University of Ghana http://ugspace.ug.edu.gh

77
members of the Assembly and face to face interviews with core heads of departments within
the Assembly. The interviews were recorded for the purpose of transcription.
3.4.3. Questionnaire Administration
The questionnaire (in appendix one) consisted of mainly close ended questions designed and
administered to 22 staffs of the Builsa North District Assembly, the GES, the DHD and the
DADU. The questionnaires were administered personally to respondents. A pre-test was done
at the initial stage to identify the emerging challenges and gaps. The questionnaire was
therefore reviewed after the pre-test to ensure that it captured fully the information needed to
answer the research questions. The questionnaire was organised into five main sections as
follows; background data of the respondents, fiscal decentralization, local economic
development, constraints of LED, and the actors of LED in the district. This questionnaire was
basically designed to solicit views of staff members working in the District Assembly whose
roles contributes to LED.
3.4.4. Document Analysis
Analysis of documents is a major part of the data collection of this study. The study collected
and reviewed relevant documents related to FD and LED. This was done on the DMTDP, the
BAC action plans, the composite budget, the annual action plans, the national LED policy
document and the district fee fixing resolutions.
3.4.5. In-depth interviews
Semi-structured interview questionnaire (in appendix two) was adopted to obtain information
from people who were well versed on issues relating to fiscal decentralization and LED
promotion in the district or the country at large. In-depth interviews were conducted with the
District Coordinating Director, the District Planning Officer, the District Budget Analyst, the
Heads of Decentralized Departments, the Fiscal Decentralization Unit of the Ministry of
University of Ghana http://ugspace.ug.edu.gh

78
Finance and key workers of the BAC at the district level. The interview covers a range of issues
including the extent of implementation of FD, barriers to complete implementation of FD, how
the assembly promotes LED in the district, the challenges of implementing LED plans, and the
actors of LED and their roles.
3.5. Measures of Fiscal Decentralization and LED
There is no one single measure of fiscal decentralization. Many researchers measure FD by
using budget data approach. Some scholars used the ratio of district revenue or expenditure to
the general national revenue or expenditure as a proxy for FD (Bodman & Hodge, 2010). Other
sophisticated ways of measuring FD is dependent on the availability of data. The quantitative
measure of FD is not exclusively enough measure of FD. Fiscal decentralization in this study
is measured by four components: revenue generation autonomy, expenditure autonomy,
intergovernmental transfers (Bahl, 2008) and the viability of revenue sources which cannot be
measured by only quantitative method. Devolution of decision making to local units is also an
aspect of FD, the degree or level of authority is determined on the basis of the legal
relationships between higher and lower-level-units which are very difficult to measure
quantitatively. The level of fiscal autonomy of the Assembly to generate revenue and to spend
cannot also be quantified. Based on these reasons, FD in this study is measured qualitatively
but in addition to the administration of questionnaire to be able to gather more people’s views
on the topic.
3.6. Data presentation and Instruments for Data Analyses
The data collected were mainly analysed qualitatively. This was done in line with the research
objectives. The administered questionnaire was coded and analysed using the Statistical
Package for Social Science (SPSS). This has enabled the generation of descriptive statistics,
University of Ghana http://ugspace.ug.edu.gh
79
frequency tables and charts for easy analysis and inferences. The tables and charts would
provide patterns for written interpretation.
The qualitative data (interview responses documents) were analysed using content analysis. In
accordance with the research objectives, the analyses were to identify the main themes in
relation to FD and LED, the current state of FD and LED, and the explanation on how and why
certain things happened or did not occur. In other words, the study sought to identify how the
district assembly promotes LED. The interview data were first ordered to identify recurrent
themes on the data. Shorts note were made on the themes identified to ensure that key ideas
were appropriately captured. Data collected were analysed using Miles and Huberman’s data
analysis approach. Data were first displayed, condensed and conclusions were drawn (Miles
and Huberman, 1994).
3.7. Ethical Considerations
In dealing with human beings, ethical consideration is very critical which has been duly
considered in the study. A number of ethical issues were taken into consideration. These
include but not limited to the following:
Firstly, the study was conducted without any misrepresentation or deception. Interviews and
questionnaires were personally administered to respondents alone.
Secondly, the study took an introductory letter from the Public Administration and Health
Services Department, which sought for permission from individuals and organisations to which
information was sourced. The study had ensured that the introductory letter was always
presented to respondents anytime data were gathered from them.
Thirdly, the aim and purpose of the study were introduced to the institutions and interviewees
to which data were collected. After every self-introduction, the introductory letter was always
University of Ghana http://ugspace.ug.edu.gh

80
presented to seek the full consent of the institutions and respondents. There were instances
where some officers declined being interviewed stating reasons that they were busy. In other
cases, some officers rescheduled different times and dates to be interviewed while others
referred to their colleagues to be interviewed. In all these instances, the views and opinions of
respondents were duly respected accordingly.
Confidentiality is another area that the study held high in the study. The study ensured that the
identity of respondents such as names were not recorded or captured during the interviews or
the questionnaire administration. The names of respondents were also not used when citing
statements that they made. Though the names of respondents were not mentioned in the cited
statements, their work titles or positions and the names of some of the institutions were
inevitably used. Even in these instances, anonymity was still guaranteed.
Finally, the potential consequences of the research on the interviewees and the institutions were
avoided. The study has guaranteed the collection of information from subjects and institutions
without causing any negative consequences that might affect their image, position or funding.
3.8. Limitations of the Study
The study considered mainly staff members of one district as a case study. Similarly, LED in
this study was measured by determining only the infrastructure development, the participation
of citizens, employment creation, MSME/ entrepreneurial development support and MSME
access to financial support.
Poor financial record keeping over the years at the Assembly makes it difficult to segregate
actual expenditure on assets, goods and services using their financial statements. Therefore,
conducting trend analysis to assess how efficiently government transfers were utilized for
specific programmes/ projects were severely limited.
University of Ghana http://ugspace.ug.edu.gh

81
Only funds that flow to the Assembly were captured in the study. The study could not measure
funds (such as Ghana Education Trust Fund) that were transferred to the decentralized
departments by their mother ministries or donor agencies.
3.9. Chapter Conclusion
The research setting, design, population and sample as well as the mode of data collection and
analysis were captured in this chapter. The respondents of the study were mainly staff members
of the BNDA who were purposively selected. The data were sourced from both secondary and
primary sources using interviews and questionnaire, document analysis and direct
observations. The questionnaire data were analysed using SPSS to compute descriptive
statistics while the interview data were analysed by using Miles and Huberman data reduction
and condensation approach.
University of Ghana http://ugspace.ug.edu.gh

82
CHAPTER FOUR
RESULTS AND DISCUSSION 4.0. Introduction
This chapter entails the results from both the qualitative data gathered. The results are analysed
and organised under various sub-themes in accordance with the research objectives.
Descriptive statistics such as frequencies, tables and graphs are also used to present the
findings.
4.1. Demographic Characteristics of Respondents
The respondents of the study were mainly senior staff members of the Builsa North District
Assembly. Out of 27 senior staff, 22 of them, consisting of 4 females and 18 males were
administered with questionnaires. The demographic information of respondents is presented in
the table 4.1 below.
Table 4.1. Demographic Information of Respondents
VARIABLE CATEGORIES FREQUENCY PERCENTAGE
SEX Male
Female
18
4
81.8
18.2
AGE
15-25 Years
26-35 ‘’
36-45 ‘’
46-55 ‘’
55 and above
2
12
4
3
1
9.1
54.5
18.2
13.6
4.5
DURATION OF
STAY
0-1 Years
2-5 ‘’
Over 5 ‘’
3
10
9
13.6
45.5
40.9
LEVEL OF
EDUCATION
SHS
Tertiary
2
20
9.1
90.9
Source: Field Survey, 2016
There were more male workers than females in the Assembly and this resulted in the uneven
representation in sexes in the sample. Majority of the respondents had tertiary education (91%)
University of Ghana http://ugspace.ug.edu.gh

83
and about 55 percent are within the age range of 26 -35 years. This is an indication of a strong,
young and vibrant labour force in the Assembly. Similarly, most of them have equally worked
in the Assembly for more than a year (86%). This also shows that majority of the staff know
the developmental conditions of the District.
Eight respondents who were basically heads of departments with a lot of experience in local
development were also interviewed. Six respondents out of the eight were staff of the Assembly
who occupied key positions. They include the District Coordinating Director, The District
Finance Officer, Head of Business Advisory Centre, District Director of Education, District
Planning Officer and the District Budget Analyst. One staff member from the Fiscal
Decentralization Unit of the Ministry of Finance who is directly responsible for the fiscal
decentralization policy formulation and coordination was interviewed as well.
4.2.Contribution of Fiscal Decentralization to LED
The various sources of revenue and expenditure pattern would be assessed in this section.
Analysis of how these resources were used in the provision of infrastructure, citizen
participation, local capacity development, social services and general assessment of the
environment that could promote or contribute to LED would be determined here.
4.2.1. Provision of infrastructure
One of the purposes of decentralization is to provide socioeconomic infrastructure at the local
level. As a contribution of the Assembly towards development, there is the provision of
infrastructure such as roads, schools, boreholes, hospitals, markets and solid waste disposal
sites to boost community development. This is usually done based on community needs
assessment and in consultation with opinion leaders and citizens. The Assembly uses part of
their DACF and DDF to establish these physical projects. The views of staff concerning the
provision of these infrastructural facilities are captured in table 4.2 below.
University of Ghana http://ugspace.ug.edu.gh

84
Table 4.2: Infrastructural Development in the District
Rating
Educational
Facilities
Health
Facilities
Markets Solid Waste
Disposal sites
Roads
Freq % Freq % Freq. % Freq % Freq %
Poor 2 9.1 2 9.1 3 13.6 7 31.8
Fair 2 9.1 1 4.5 7 31.8 11 50.0 12 54.5
Good 15 68.2 16 72.7 13 59.1 8 36.4 3 13.6
Excellent 5 22.7 3 13.6
Total 22 100.0 22 100.0 22 100.0 22 100.0 22 100.0
Source: Field Survey, 2016
From Table 4.2, most of the respondents (representing 50%) were of the view that the DA is
doing well (good) in the provision of: educational facilities (68.2%), health facilities (72.7%)
and market structures (59.1). However, solid waste disposal sites (50.0%) and construction of
roads (54.5%) in the district were fairly provided by the Assembly. The percentages represent
the respondents rating on the above infrastructure. The 2010 Ghana Statistical Service
Population and Housing Census also supported these statistics. For instance, in terms of waste
disposal, about 36 percent of solid waste and 66 percent of liquid waste are thrown into open
spaces and into the streets respectively (GSS, 2010 PHC). The district does not have adequate
proper waste disposal sites. All these evidence points to the fact that the BNDA is doing little
in the provision of proper waste disposal sites.
Due to the deplorable nature of almost all the roads linking the towns and villages, respondents
rated the provision of road infrastructure as fair (54.5%) and poor (31.8%). The roads are
untarred and are always in bad condition especially in the raining season. The only road that is
tarred in the district is the major road linking the district capital (Sandema) to the regional
capital (Bolgatanga).
Infrastructure, institutional development and investment from the central or higher level
government supports LED if resources from the centre are transferred to the local level and are
supplemented by local efforts to mobilise their own revenues (Wekwete, 2014). To ensure local
University of Ghana http://ugspace.ug.edu.gh

85
economic development, the role of the central government and sector ministries should focus
primarily on shaping policies and investment instruments while implementation should be the
role of local government (district assembly). As rightly noted by Helmsing (2001),
infrastructure investment is dependent on the decision of government and the availability of
donor funding. This implies that LED of an area is largely influenced or dependent on the
interventions of the central government. For instance, allocations of resources to government
departments or agencies at the local level (like agriculture) are captured in the national budget
and such aids are allocated to localities based on general criteria and on policy requirements of
the aid.
However, the effectiveness of LED can be achieved by mainstreaming LED planning as a long
term economic development plan and not as a short term seasonal programme undertaken only
when donor funds are available (Wekwete, 2014). There is also evidence to accept that policies
made for the delivery of infrastructure and human capital which reflect the local conditions are
more likely to be effective in promoting economic development than centralised policies that
neglect these locational differences (Oates, 1993)
4.2.2. Social Services
The major formal service sectors in the district include educational service, health service,
water provision, electricity supply and technological services. The provision of these services
within the district with the exception of electricity is good. The respondents said the DA fairly
extends electricity (81.8%) in the district. This has largely been confirmed by the Ghana
Statistical Service findings that 23.6 percent of households in the district use electricity (GSS,
2010, PHC). However, the DA plays a significant role in the provision of streetlights and
support for rural electrification. The fact that electricity provision requires high capital
investment makes it unfordable and poses a great challenge for the District Assembly. The
provision of electricity remains largely the responsibility of the central government.
University of Ghana http://ugspace.ug.edu.gh

86
Table 4.3 below shows the distribution of responses on the provision of social services.
Table 4.3: Provision of Social Services
Rating
Telecommunic
ation
Water Supply Electricity Health
Services
Quality
Education
Freq % Freq % Freq. % Freq % Freq %
Poor 4 18.2 1 4.5 3 13.6
Fair 6 27.3 5 22.7 18 81.8 3 13.6 6 27.3
Good 11 50.0 16 72.7 1 4.5 14 63.6 15 68.2
Excellent 1 4.5 5 22.7 1 4.5
Total 22 100.0 22 100.0 22 100.0 22 100.0 22 100.0
Source: Field Survey, 2016
Fiscal decentralization indeed has contributed significantly in the area of education and health.
Since education is one of the surest ways of promoting development, the DA promotes sound
and quality education for the youth by funding most of the activities that would increase
enrolment, participation and quality teaching and learning through teacher motivation,
provision of teaching and learning materials.
The District Director of Education stated that:
Fiscal decentralization has an impact on education. The Assembly spent some part of
their funds on educational activities like My First Day in School, 6th
march/independence day celebration, science and mathematics quizzes, transportation
of goods (furniture) to schools and support for the conduct of examination for students.
The Assembly also puts up educational infrastructures and rehabilitates existing ones
(GES Director, Builsa North District).
As part of ensuring teacher commitment and retention in the district, monitoring and rewards
systems have been instituted.
University of Ghana http://ugspace.ug.edu.gh

87
This year, we did teacher motivation where best teachers were awarded. Certificates
were presented to best teachers and LED colour TVs were presented to the best 4
teachers from all the categories. That is KG level, primary, JHS and SHS levels (GES
Director, BNDA).
In fact, the study found that FD actually contributes to provision of social services with special
attention to the educational sector. This finding was also similar to findings of other scholars
on other local units. The provision of social services can contribute to local economic
development with respect to the following specific areas: generation of sustainable
employment in firms that make it more capable to endure changes in the global economic
environment; developing skills of individuals and groups towards high productivity; raising the
income of households and many more (Vazquez, 2002).
A significant step towards expanding the asset base of the local people is to enhance their
access to the full range of social services, which would generally consist of water supply, refuse
removal, flood protection, local roads, sanitation, public transport, street lighting, health service
and education. This observation is supported by Oates (1972) that, fiscal decentralization
makes possible for the DA to provide different blends of public goods and services that reflect
the preference of local needs than centralised government.
4.2.3. Citizens’ involvement in District Development Planning
Citizens’ involvement in the developmental processes of the district is not only to achieve
political points but also to ensure that the needs of members are properly assessed and taken
into consideration. The local people know their problems best and therefore are able to, with
technical guidance find solutions to these problems. To strengthen the inclusion of citizens in
the local developmental processes, citizen participation and consultation have been included in
the Ghana Shared Growth and Development Agenda (GSGDA) as a policy directive.
University of Ghana http://ugspace.ug.edu.gh

88
The data revealed that the level of citizen participation is good in relation to community
dialogue (50.0%), local economic development platforms (45.5%), local economic action
planning (63.6%) and fee fixing resolutions (54.5). However, mixed responses were observed
on the community diagnoses. While about 31.8 percent of respondents rated the DA as good,
others (31.8%) rated the DA as fair in terms of community diagnoses at the same time.
Data on citizens’ participation in local development is presented in figure 4.1 below.
Figure 4.1: Citizens Participation in Local Development
Source: Field Survey, 2016
The District Assembly as a lead actor in local development must encourage local level policy
participation that would give opportunity for actors such as institutions, private sector and civic
groups to participate fully in policy development. When key actors are engaged or involved,
their contributions to policy designs and strategies would increase ownership, increase long
term impacts and contribute to partnership building (City Alliance, 2007). This means that the
success of local economic development is dependent on local government participation
(Sjostrom, 2010). However, the danger sometimes is that, decentralization may increase
citizens’ participation in local governance at the local level, but it might favour the few
0
10
20
30
40
50
60
70
Community
Dialogue
Community
Diagnoses
LED Platforms LED Action
Planning
FFR
50
31.8
45.5
63.6
54.5
Poor
Fair
Good
Excellent
University of Ghana http://ugspace.ug.edu.gh
89
privileged elite class (Conyers, 1990) who may also focus in pursuing their own self-interest
at the expense of the citizens.
Participation in governance at the local level involves known actors or stakeholders such as
donors, the public, private sector, organised civil society, poor and vulnerable groups,
traditional authorities and local government officials (Adablah, 2003). As noted by Adablah
(2003, p. 10) all government systems make a “combination of these stakeholders in their
priority setting, policy making, resource allocation and/or programme implementation”. The
study indicated that Builsa North District is not an exception to this observation. The study
revealed that at the district level, these stakeholders actively participate in the formulation and
implementation of the District Development Plans and the Fee Fixing Resolutions usually at
General Assembly meetings and stakeholder forums. In the Builsa North District, formulation
and execution of Rural Enterprise Programmes in particular is usually done with full
participation of community members to help identify their business potentials. Through these
participatory interactions, the interests of stakeholders would be reflected in the decisions and
functions of local governments. The benefits of stakeholder/ citizen participation may vary
from country to country, locality to locality, but in the Builsa North District, it influences and
ensure local ownership of projects and programmes. With citizen inclusion in LED planning,
local level economic interventions are less likely to fail.
4.2.4. Support for Micro Small Medium Enterprise Developments
Promoting MSME development is a significant contribution to boosting the economic growth
of the district. In an interview with the Head of BAC, it was indicated that though there are lots
of business opportunities in the district that are untapped, direct support for MSMEs
development by the district appears to be limited. Establishment of business centres and
entrepreneurial training were fairly provided by the District Assembly. Most of the respondents
University of Ghana http://ugspace.ug.edu.gh

90
said entrepreneurial training (45.5%), provision of financial services to MSMEs (50%) and
business centres (63.6%) were fairly provided by the DA.
Meanwhile, granting of business permits/licences (50%) and tax administration (59%) were
given favourable attention by the local authorities. The possible reason for this is what Shin
(2001) has observed that when the local tax administration is strengthened, it reduces tax
evasion and collection costs.
Figure 4.2: Micro Small, Medium Enterprise development in the District
Source: Field Survey, 2016
Confirming the above. A respondent noted that:
Fiscal decentralization has an impact on employment or job creation for instance, the
LEAP programme is meant to help the poor especially persons with disabilities. For
those who are not working can at least utilise the money to start their own businesses
like basket and hat weaving. This in the end comes to boost the Assembly since these
small businesses will pay taxes back to the assembly. This governmental fiscal transfer
really helps to create employment within the district (GES Director, BNDA).
0
10
20
30
40
50
60
70
Entrepreneurial
Training
Granting of
Business
Licensing
Business
Centers
Provision of
financial
services
Tax
Administration
45.5
27.3
63.6
50
31.827.3
50
27.3
59.1
Poor
Fair
Good
Excellent
University of Ghana http://ugspace.ug.edu.gh

91
4.2.5. Employment Creation
“Labour force is the greatest asset for the rural people” (Rogerson, 1999, p. 517). Accordingly,
the District effort to create employment is a critical option for local economic development.
One direct role of local governments that has potential benefits to localities is to design
measures to improve the business opportunities by making available business support,
information or advice centres. The provision of markets is another strategy for enhancing LED.
Assemblies also give direct support for the start-up of micro-enterprises through resourcing of
and assistance to business development support agencies (Vanderschueren, Wegelin &
Wekwete, 1996; Rogerson, 1999). Local governments may also give indirect support for job
creation. There are a lot of examples where local governments in developing worlds create
more facilitative environments for the functioning and development of micro-enterprises (Stren
and Gombay, 1994; Rogerson, 1999). Currently, the District has a memorandum of
understanding with some development support agencies to provide training and start-up capital
for micro enterprises within the district. Other private sectors and NGOs such as FISTRAD,
Presby-Agric and CBR are contributing significantly towards creating employment for the
youth.
4.2.6. Assessing the General Environment for LED
Local businesses can flourish in the district if there are favourable conditions such as access to
financial services, technical skills development, good tax administration systems, good roads
and other infrastructure. Micro and small enterprises would grow under these conditions. As
shown in figure 4.3, about 68 percent of the respondents rated the general environment for local
business development in the district as ‘good’. This means that the Assembly is doing well in
promoting a convenient environment that stimulates local investment. Also about 95 percent
of respondents were very optimistic that there would be future growth of businesses in the
University of Ghana http://ugspace.ug.edu.gh

92
district. This is partly so because more farmer based organisations are being formed and the
district is gaining the attention of donor agencies (for example, the Japan Social Development
Fund).
Figure 4.3: Assessment of the General Environment for Local Business Development
Source: Field Survey, 2016
The local industry is quite diverse in the district. It includes shea butter extraction, livestock
rearing, leatherwork and pito brewing among others. However, these are produced in small
quantities, which are not exported outside the country to bring high income to the people. Some
respondents said there is limited market for the local products in the district while others are of
the view that it is the packaging and marketing that is not done properly.
One of the respondents expressed his opinion that
We have local industries in the district like poultry keeping, hat and basket weaving but
people are no longer patronising them these days. The market for these products is
going down (GES, Director, BNDA).
The Business Advisory Centre of the Assembly has been running programmes in most of these
local business areas to equip the local people with the necessary skills to adopt the use of
0
10
20
30
40
50
60
70
Poor Fair Good Excellent
4.5
22.7
68.2
4.5
University of Ghana http://ugspace.ug.edu.gh

93
modern technology in the processing and packaging of their products to improve their market
value.
Generally, there is greater opportunity for future development. The head of BAC made this
statement:
This district has great potentials as far as business activities are concerned. This is so
because the raw materials are available, for instance, talking about shea butter, there
is a lot of shea nuts in the district to which clients do not need to travel elsewhere for
raw materials. In terms of dawadawa processing, there is plenty beans. In the craft
industry, we have stores to which people can acquire. In terms of leatherwork, there is
availability of skins that can be turned into leatherwork. Overall, I can see that the
district is well endowed in terms of local businesses. Therefore, I rate the district 100%
in terms of business potentials (Head of BAC).
4.3. Factors Inhibiting Effective Fiscal Decentralization in Ghana
Fiscal decentralization can be fully realised if there is complete devolution. Fiscal
decentralization has three main components; revenue autonomy, expenditure autonomy and
intergovernmental transfers (Bahl, 2008). Analysis of the revenue and expenditure autonomy
of the District Assembly and the responses of interviewees would be presented in this section.
4.3.1. Sources of Revenue and Revenue generation capacity
The main sources of revenue for the Assembly include Internal Generated Fund (IGF), and
government grants, which comprise of the District Assembly Common Fund (DACF), the
District Development Fund (DDF), the MP Common Fund, the Ghana Social Opportunities
Project and the Ghana School Feeding Programme (GSFP). The Assembly has
autonomy/discretion over how much of internal revenue to raise and to spend. However, the
revenue generated internally is woefully inadequate to undertake any meaningful physical
University of Ghana http://ugspace.ug.edu.gh
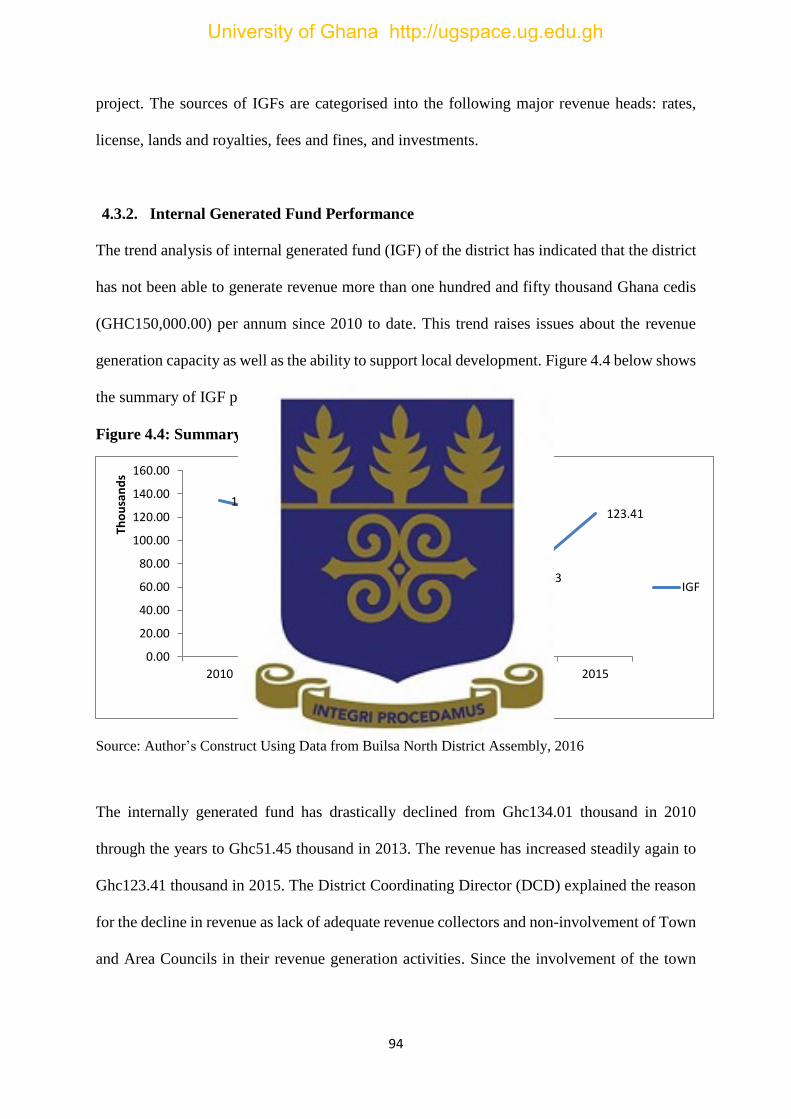
94
project. The sources of IGFs are categorised into the following major revenue heads: rates,
license, lands and royalties, fees and fines, and investments.
4.3.2. Internal Generated Fund Performance
The trend analysis of internal generated fund (IGF) of the district has indicated that the district
has not been able to generate revenue more than one hundred and fifty thousand Ghana cedis
(GHC150,000.00) per annum since 2010 to date. This trend raises issues about the revenue
generation capacity as well as the ability to support local development. Figure 4.4 below shows
the summary of IGF performance trend from 2010 to 2015.
Figure 4.4: Summary of IGF Performance Trends
Source: Author’s Construct Using Data from Builsa North District Assembly, 2016
The internally generated fund has drastically declined from Ghc134.01 thousand in 2010
through the years to Ghc51.45 thousand in 2013. The revenue has increased steadily again to
Ghc123.41 thousand in 2015. The District Coordinating Director (DCD) explained the reason
for the decline in revenue as lack of adequate revenue collectors and non-involvement of Town
and Area Councils in their revenue generation activities. Since the involvement of the town
134.01
119.79
86.99
51.45
68.33
123.41
0.00
20.00
40.00
60.00
80.00
100.00
120.00
140.00
160.00
2010 2011 2012 2013 2014 2015
Tho
usa
nd
s
YEARS
IGF
University of Ghana http://ugspace.ug.edu.gh

95
and area councils in their revenue mobilization in 2015, there has been an improvement of their
revenue performance in that same year.
On the whole, the study found that the total amount collected as IGF in a year is not enough to
undertake major developmental activities. This suggests the reason why the Assembly is over
relying on central government transfers. This according to Helmsing (2003) affects the fiscal
autonomy of the Assembly. This was confirmed in separate interviews with the DCD, the
District Budget Analyst and the District Finance Officer, that though they are currently doing
well in revenue mobilization, they could still not reach an amount that can finance capital
projects in the district. This is because of low IGF base, which can be attributed to the fact that
there are few businesses or investment activities in the district. For example, the DFO had this
to say:
Until there are more investments and economic activities in the district, IGF will
continue to remain low no matter how hard the revenue task force operates (DFO,
BNDA).
The low revenue generation in the district is also partly in line with Crawford’s (2010)
observation that raising internal revenue in deprived districts dwelled by people with critical
income poverty is always a challenge. The study revealed that the major barrier to effective
fiscal decentralization is the inability of the District Assembly to generate its own revenues
emanating from low income people and less economic activities in the district. This alone is a
good reason to make the central government reluctant to devolve its fiscal powers to local
governments.
In addition to that, the central government may even be more willing to reduce their
responsibilities to the districts than to devolve large proportions of their financial powers to
them because transferring much financial powers to the district assemblies implies that, the
University of Ghana http://ugspace.ug.edu.gh

96
central government will generate less revenue on its own. This will weaken the central
government’s ability to maintain fiscal balance and uniform development.
Further analysis of the main sources of IGF showed that, rates is the major source among others
that contributes significantly to the total IGF annually. Lands and royalties remain the least
source of revenue within the district. This trend was observed from 2013 to 2015 and is
presented in figure 4.5 below.
Figure 4.5: IGF Trends by Revenue Heads from 2013 to 2015
Source: Author’s Construction Using Data from Builsa North District Assembly, 2016
4.3.3. All Revenue Performance
No Institution can operate effectively without fiscal resources. Fiscal decentralization ensures
that central government transfers revenue generation and expenditure functions to the local
units. The major sources of funds transferred from the central government to the local unit
include the DACF, the DDF and Ghana Social Opportunities Project (GSOP).
The DACF that was established in 1994 by an Act of Parliament, Act 455 of 1993 was to
provide funds to support the decentralization programme that would facilitate the provision of
basic socioeconomic infrastructure and services in the districts (DACF, 2015). The fund
-
10.00
20.00
30.00
40.00
50.00
60.00
2013 2014 2015
12.60
22.23
52.20
0.89 2.19 3.29
Tho
usa
nd
s
YEARS
Rates
Lands
Fees &Fines
Licences
Rent
Investment
University of Ghana http://ugspace.ug.edu.gh

97
therefore contains as required by the 1992 constitution of Ghana, seven and a half percent of
national revenue to be shared among all District Assemblies in Ghana in accordance with a
formula approved by parliament. The DACF is actually a development fund for promoting
decentralization and ensuring that every citizen benefits from the national revenue (DACF,
2015). The DACF benefits all the 216 Metropolitan, Municipal and District Assemblies
(MMDAs), the Regional Coordinating Councils and other social intervention programmes
including persons with disability, Ghana School Feeding Programme, District HIV/AIDS
Committees and Cured Lepers.
The DDF is also government grants that are transferred to beneficiary districts based on their
performance on Functional and Organisational Assessment Tools (FOAT). The amount a
district receives is also dependent on the fulfilment of the minimum conditions and the overall
score of the District Assembly in the FOAT assessment. A district that could not meet the
minimum conditions is disqualified from benefitting from the fund. This fund is set up to ensure
that local authorities/ District Assemblies are performing their functions efficiently. The
payment of these funds is however, in arrears and its flow pattern is very unpredictable.
The Ghana Social Opportunities Project (GSOP) was set up to bridge the developmental gap
between the north and the south. Deprived and relatively deprived districts usually benefit from
this programme with about 61 beneficiary MMDAs nationwide. The essence of this is to
provide direct income to the poor by engaging them in labour works such as rehabilitation of
roads, dams and tree planting.
Trend analysis of the flow of these funds are presented in a bar chart below.
University of Ghana http://ugspace.ug.edu.gh
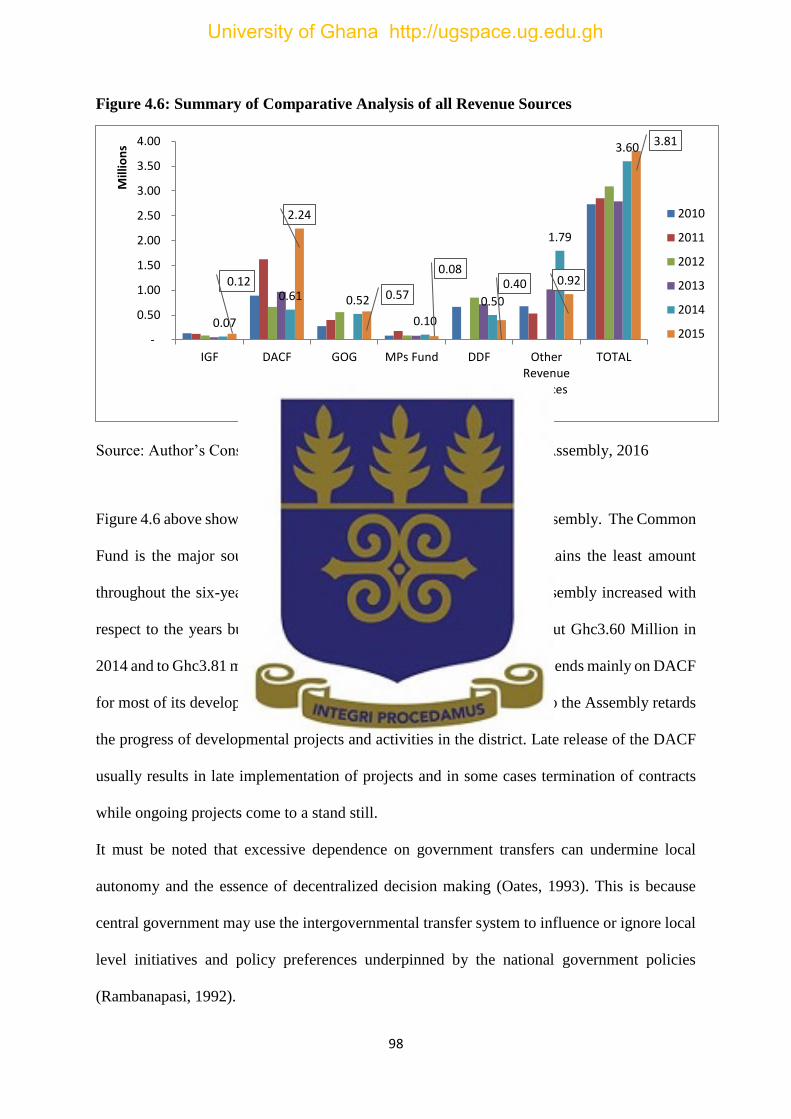
98
Figure 4.6: Summary of Comparative Analysis of all Revenue Sources
Source: Author’s Construction Using Data from Builsa North District Assembly, 2016
Figure 4.6 above shows a trend analysis of all revenue sources for the Assembly. The Common
Fund is the major source of fund for the Assembly and the IGF remains the least amount
throughout the six-year period. Generally, the total revenue of the Assembly increased with
respect to the years but declined in 2013 and rose significantly to about Ghc3.60 Million in
2014 and to Ghc3.81 million in 2015. This implies that the Assembly depends mainly on DACF
for most of its development. Therefore, the delay in release of DACF to the Assembly retards
the progress of developmental projects and activities in the district. Late release of the DACF
usually results in late implementation of projects and in some cases termination of contracts
while ongoing projects come to a stand still.
It must be noted that excessive dependence on government transfers can undermine local
autonomy and the essence of decentralized decision making (Oates, 1993). This is because
central government may use the intergovernmental transfer system to influence or ignore local
level initiatives and policy preferences underpinned by the national government policies
(Rambanapasi, 1992).
0.07
0.61 0.52
0.10
0.50
1.79
3.60
0.12
2.24
0.57
0.080.40 0.92
3.81
-
0.50
1.00
1.50
2.00
2.50
3.00
3.50
4.00
IGF DACF GOG MPs Fund DDF OtherRevenueSources
TOTAL
Mill
ion
s
Main Sources of Revenue
2010
2011
2012
2013
2014
2015
University of Ghana http://ugspace.ug.edu.gh

99
4.3.4. Expenditure Patterns
Expenditure is captured in three major categories; compensation, goods and services, and
Assets/ capital/ investment. Compensation consists of salaries and allowances of established
staff, which is paid directly by the government through the Controller and Accountant Generals
Department and salaries of non-established staff paid by the DA. Though the Assembly makes
budgetary allocation and report on expenditure, it makes payment only to non-established staff
under IGF payroll. Goods and services as captured in this study comprises of administrative
expenses of the Assembly. Capital investments consist of assets such as infrastructural projects,
Investment activities, and counterpart funding.
Figure 4.7: Expenditure patterns
Source: Author’s Own Construct Using Data from Builsa North District Assembly, 2016
Figure 4.7 shows the expenditure trend from 2010 to 2015. Capital expenditure remains the
highest throughout the period as compared to compensation and goods and services. In all 2013
recorded the lowest expenditure among all the years.
-
0.50
1.00
1.50
2.00
2.50
3.00
3.50
4.00
2010 2011 2012 2013 2014 2015
0.29 0.53
0.39 0.16 0.29
0.48
1.38
2.49
1.89
0.76
2.68
2.34
Mill
ion
s
YEAR
Compensation
Goods & Services
Capital Expenditure
TOTAL
University of Ghana http://ugspace.ug.edu.gh

100
Figure 4.8: 2015 Expenditure patterns
Source: Author’s Own Construction Using Data from Builsa North District Assembly, 2016
The expenditure pattern of 2015 fiscal year indicates higher spending on capital investment
activities and projects.
4.3.5. Revenue and Expenditure Autonomy of the District Assembly
In terms of policy, the District Assembly formulates policies in relation to their annual rates or
fee fixing resolutions. The DA has the autonomy to determine how much to collect and what
it should be used for. Though recently government has given a directive that twenty percent of
the total IGF should be used for capital project, however, the choice of the type of project to
undertake is still within the purview of the Assembly. As it is now, policies relating to the
utilization of IGF are fully under the control of the Assembly.
Other funding sources are largely controlled by the central government. Since these sources
are from the central government, they are usually accompanied with directives as to their
utilization. The guidelines for the utilization of the DACF under the mandatory requirements
indicate that: all MMDAs are required to allocate resources from their share of the Common
Fund towards; (1) Construction of at least two basic schools and (2) Construction of at least
two CHPs compound (see the Guidelines for the utilization of DACF for 2014 fiscal year).
Nevertheless, in the 2016 fiscal year, Assemblies are required not to make any allocation
Compensation
17%
Goods & Services
14%
Capital Expenditure
69%
University of Ghana http://ugspace.ug.edu.gh

101
towards the construction of any new mandatory projects. However, resources should be
committed towards the completion of all on-going mandatory projects (see the Guidelines for
the utilization of the DACF for 2016 fiscal year). For other funds, regulations regarding how
much to spend within a year is even dependent on how much government decides to transfer
to the DA.
Regarding the financial autonomy of the DA, the DCD submitted that:
The time that District Assemblies can become fiscally autonomous is when they are
allowed to hire and fire and elect their own DCEs. This is because the DCE who is the
political head of the Assembly may veto decisions in line with the ruling government or
party directives. Once the appointment of the administrative and political head of the
DA remains the preserve of central government, the District Assembly is not fully
autonomous. You could see that the Assembly is about 60% autonomous (DCD, BNDA).
The history of Ghana’s decentralization shows that the executives have the power to appoint
party loyalists as DCEs and Regional Ministers. Moreover, the power of the executive is deeply
rooted in the Constitution of Ghana. The danger with this is that, it does not allow participatory
democracy. In this case, the interest of the party and the executive in power are sometimes
favoured over the citizenry.
The study found that, the appointment of leaders of local governments greatly hinders the
autonomy and the fiscal capacity of the local governments. Local authorities are unable to take
their own fiscal policies that is aimed at bringing development to the local people. This
democratic deficit is also imbedded in the 1992 constitution of Ghana. As Antwi-Boasiako
(2010, p. 35) rightly advocated, Ghana needs “constitutional amendment to empower districts
and regions to elect their own leaders so that local governments in each district can be efficient
and accountable to the electorates”. Election of DCEs and Regional Ministers will force them
to perform effectively since their failure to do so, may result in their removal by the electorates.
University of Ghana http://ugspace.ug.edu.gh

102
Generally, studies tend to emphasize the importance of political decentralization over
centralisation in terms of accountability, innovation, responsiveness and leadership (Antwi-
Boasiako, 2010). However, the general correlation between political decentralization and
innovation has not been completely established. There are certainly no doubts of the potential
benefits of political decentralization to achieving; administrative efficiency, limits on central
government abuses and policy experimentation.
In terms of the role of the local governments in policy formulation and implementation, a
respondent from the Fiscal Decentralization Department of the Ministry of Finance has this to
say:
In terms of internally generated funds, the Assembly has the discretion to determine
how much to charge, as well as how much to spend which is done usually in
consultation with the citizens at the local level. In terms of policies especially in
relation to education and health, it is usually formulated by the central government and
implemented at the local level since these departments are not fully decentralized. I can
say that the assembly is about 70% autonomous (Staff of Fiscal Decentralization Unit
of Ministry of Finance).
Based on these observations, constitutional amendment that would empower local people to
elect their own leaders and to take their own decisions would be very indispensable in
promoting effective fiscal autonomy and accountability. However, since independence, the
history of Ghana’s political system (the blend of military and democracy), “has given leaders
the cause to be cautious of how to share power at the regional and district levels” (Antwi-
Boasiako, 2010, p. 45).
In terms of revenue, apart from the DACF and MP’s Common Fund, which by law is distributed
to every district, the DDF is contingent on the performance measurement of the Assembly. On
University of Ghana http://ugspace.ug.edu.gh

103
the other hand, GSOP is donor funded to the district to enable the district undertake
programmes and activities strictly within the fund policy. The Assembly is not autonomous
because almost all the developmental activities and projects are financed by the central
government who determines the distribution and to a large extent influence the spending pattern
of these funds. The DDF guideline for instance, specifies how much to be used for capacity
building and the amount for capital projects. Even with physical projects, the guidelines have
also stipulated the type of projects the Assembly can establish with the fund. The DDF may
be used to provide infrastructural projects mainly in the educational and health sectors.
The District needs to widen its revenue base by developing new tax tools. Bahl and Linn (1992)
noted that local governments need alternative revenue sources such as poll taxes, business
activity taxes and automotive taxation. Over reliance on non-tax revenues such as user charges,
fees and property rates may be stable and easy to collect. However, as the economy advances,
the traditional sources of revenue may turn to grow slowly overtime and cannot keep pace with
the expenditure requirements of local governments (Shin, 2001).
With respect to expenditure, the DDF, GSOP and largely DACF are regulated in terms of how
they are spent. However, the Assembly has the discretion to decide which project and the
location of the projects as captured in the District Medium Term Development Plans and
Annual Action Plan. An example of a disbursement guideline for the utilization of DACF is
presented below.
University of Ghana http://ugspace.ug.edu.gh

104
Table 4.4: Disbursement of DACF based on Sectors
NO ITEM %
1 Self-Help Project 5
2 Education Fund 2
3 Establishing and Strengthening of Sub-Structures 2
4 DRI/ Malaria Prevention 1
5 Administration 20
6 Others 50
7 Contingency 20
8 TOTAL 100
Source: District Assembly Common Fund Impact Assessment Report, 2015
Intergovernmental transfers usually come with strings attached (Oates, 1993) and over reliance
of the Assembly on these transfers invariably would envisage central government’s intrusion
in expenditure decisions. This interference does not only affect the autonomy of the Assembly,
but also they discourage local governments from being responsible. This is so because when
funding is from the central government, there will be little concern from the local governments
to make real economic cost and benefit analysis of the decisions taken to the locality (Oates,
1993). However, when funding is from the district’s own revenue sources in relation to
programmes and projects, there will be critical analysis of the cost of the decisions. This is very
instrumental for the proper function of the fiscal decentralization system.
In order for the District Assembly to exercise full fiscal discretion, it should be able to raise
large amounts of funds from its own internal sources. However, Bird (1986) cautioned that
proper checks and analysis should be made to ensure that, the assignment of revenue
instruments to collect local taxes do not induce extortion of the economic goods and activities
that bring benefits to the local people. This is also to prevent possible distortion of the right
kind of cost signals to the district on local fiscal decisions. Smoke (2003) equally shared the
same view, that local governments may become corrupt and divert the local resources for their
own interest when autonomy and power is granted them. Nevertheless, it is often times not
University of Ghana http://ugspace.ug.edu.gh

105
easy for developing countries and for that reason, deprived districts to pursue this agenda,
simply because of the lack of requisite institutions for revenue administration (Oates, 1993).
More so, deprived districts lack the administrative capacity to administer local taxes. Most
often, the staff recruited to mobilise local taxes lack the requisite knowledge and skills to ensure
efficient tax collections. This coupled with poor monitory and accountability of revenue
collectors, results in revenue leakages. The study revealed that, these factors militate against
effective FD.
However, some scholars have different opinions about the failure of districts to generate
sufficient revenue on their own. Some scholars have argued that local governments are not able
to generate enough revenue partly due to what Nkrumah (2000 cited in Crawford, 2008, p. 243)
has observed as the central government’s preference for the “lucrative tax fields”, while
dispatching the “low yielding taxes such as basic rates and market tolls” to the local
governments. But, when central government releases its lucrative tax fields to local
governments, it may also incapacitate itself. This is because, central government may not be
able to generate resources to provide public goods such as national security.
On the other hand, continuous government transfers to support local development without any
expenditure control would make some local authorities more autonomous. This also has its
own repercussions as poor districts inhabited by poor and non-literate population may not have
the capacity, confidence and ability to demand for accountability from their duty bearers. The
result of non-accountability is over exploitation and misappropriation of funds.
4.4. Factors Inhibiting Local Economic Development in the District
The joint effort between community-based organisations, private and public organisations to
bring about development is a significant contribution to local economic growth and
development. The DA exists to bring services closer to the people. The Assembly as part of its
University of Ghana http://ugspace.ug.edu.gh

106
core functions provides an enabling environment that would support the growth of local
businesses in the district. There are also few Non-Governmental Organisations such as Presby
Agriculture and Community Based Rehabilitation in the District Capital that support local
development most especially in the area of capacity building. Despite these contributions, there
are still challenges in relation to how the Assembly promotes and implements LED policies in
the District. The factors that impede local economic development in the district are categorised
into two main sections: administrative factors and cultural barriers.
4.4.1. Administrative factors
Significant among these challenges is the issue of financial limitations.
As shown in figure 4.9, about 86 percent of respondents said the Assembly is financially
challenged when it comes to promoting local businesses. The wing of the Assembly responsible
for the actual implementation of the rural enterprise programme has expressed the same worry
over the inability of the Assembly to fulfil their commitment to the counterpart funding meant
for the unit to carry out its duties.
Figure 4.9: Factors Hindering Local Economic Development in the District
Source: Field Survey, 2016
0
10
20
30
40
50
60
70
80
90
Funds Strategies /plans
Lack ofCooperation
Skilledpersonnel
Other
86.4
4.59.1
Percent
University of Ghana http://ugspace.ug.edu.gh

107
The study has indicated that inadequate funds (86.4%) is the major problem that hinders the
Assembly from ensuring LED. Lack of adequate personnel (9.1%) and ineffective LED
strategies and plans (4.5%) only constitutes the minor barriers to LED.
The extent to which this affects the Business Advisory Centre is stated by one of the
respondents below:
Late release of funds; at times you have planned your activities you are supposed to
execute and the funds are not released on time. As I speak, the first quarter funds of the
year have not been released for us to carry out the first quarter activities. This is a
challenge that we mostly face (Respondent from Business Advisory Centre, 2016).
Another serious impediment in the implementation of the Rural Enterprise Programme (REP)
is the inability of some of the clients of the REP to make their twenty percent contribution of
the cost as part funding of the training programme. This therefore means that depending on the
financial strength of the community groups, poor people may not be able to mobilise enough
resources as their share of the cost for the training programme. The REP requires that
beneficiaries of the programme should contribute twenty percent of the cost of training.
However, the local people do not believe this condition as a requirement of the programme.
Instead, some thought that the officers in the district just want to collect their monies and spend.
This can be attributed to the fact that certain NGOs have done similar trainings without taking
money and as such the locals really doubt the monetary requirement of the REP.
The Head of BAC narrates his challenge in mobilising the 20% contribution from participants:
The client contribution or the client commitment fee, which makes up the 20% of the
cost of their training, is difficult to collect. The REP requires that beneficiaries of the
programmes should contribute 20% of the cost of training. However, when you get to
University of Ghana http://ugspace.ug.edu.gh
108
the field and you begin to explain this to the people, they people will not believe you
(Head of BAC, 2016).
The head of the BAC stated that, it does not mean that when a client cannot pay his contribution,
he/ she would not be trained. Contribution in kind is accepted from those who realistically
cannot afford to pay the 20% of the cost of the training. Contribution in kind can be anything
such as provision of cooking pots, fetching of firewood and water needed for the process. All
these activities are usually quantified as contribution in kind in terms of monetary value
equivalent to the 20%.
Access to a variety of credit facilities or soft loans can boost LED. However, the challenge is
often times the inability of loan beneficiaries to repay their loans (Bank of Ghana, 2010). The
study revealed that the district lacks microfinance institutions that are more willing to support
MSMEs with soft loans at affordable rates. The district has only one rural bank that enjoys
monopoly within the district. This does not give business people the option of credit facility
package.
Obtaining suitable data to measure LED indicators has always been a challenge. For instance,
there are more data on infrastructure factors than financial factors (Wong, 2002). The possible
reason is the fact that some businesspersons reserve financial information as a commercial
secret.
Moreover, sources of quality data for LED measurement is limited. For instance, the District
Planning Officer said the current employment rate in the district is not available. It can only
be obtained through a survey (yet to be conducted) or an estimate based on the Ghana
Statistical Service 2010 census figures. The available data may either be too old (gathered
infrequently) or limited in terms of locality specifics such as district, city or town employment
figures. This issue greatly affects planning and development.
University of Ghana http://ugspace.ug.edu.gh

109
The study has also established that, finding suitable strategies for LED could be a challenge
given the limited number of LED experts in the district. There are only two staff members at
the BAC, which implies that the possibility of them not been able to design or implement the
most suitable LED strategies is most likely. As Lawrence and Hadingham (2008, p. 45) rightly
indicated “limited capacities of LED staff have the consequence that many small municipalities
focus on compliance with statutory requirements rather than attempting to proactively manage
economic opportunities that could have widespread local impact”. Rogerson (2010) also noted
that low skills in poorer districts and lack of qualified technical staff at the district result in
heavy reliance on consultants-driven strategies for LED. As the district lacks capacity to
monitor the quality of LED strategies, there will be compilation of low quality LED plans
linked to a project focus, unrealistic targets, inability to identify the drivers of local
development and poor implementation.
The mere involvement of local participants does not grantee LED success (Helmsing, 2001).
Political interference may set in altering the allocation of resources and beneficiaries. Short-
term policies that would win citizens votes would be pursued at the expense of long term
economic policies.
Monitoring and evaluation of plans and activities is key for the success of the programme.
However, means of transportation for officials of BAC was a challenge. Both the vehicle and
motorbike that could be used for monitoring activities of the programme were all broken down.
The head of Business Advisory Centre made this statement:
The means of transportation for officers for monitoring activities in the district is a
problem. The Rural Enterprise Programme has one motorbike that is out of use and
one but broken down vehicle, which was given to the DA for maintenance. How am I
going to visit the communities? As it is now, I have made plans to visit the communities
but the car is still at the maintenance shop and there is not even a motorbike for me to
University of Ghana http://ugspace.ug.edu.gh

110
undertake my activities. Enquiries at the DA who took the car for maintenance has not
shown any indication of when the maintenance of the car would be completed (Head of
BAC, 2016).
4.4.2. Cultural Barriers
The major cultural barrier to local development in the District is expensive funeral
performances. Funeral rites are one vital celebrations among the Builsas (GSS, 2010 PHC).
These rites mark the final passage of the deceased to the ancestors or the eternal world. The
funeral rites are in two parts, the first is known as the “kumka5” which is performed within the
shortest possible time from the time when a person dies. During this period some rituals are
performed for the deceased. The second part is “Juka6” which may be performed shortly or
several years after the first session (kumka) depending on the consensus of family heads (GSS,
2010).
Funeral rites itself is not a bad practice, but the excessive spending that the local people devote
their resources at the expense of investment leaves much to be desired. Because the people of
the district practice communal labour, they spend a lot of time attending family, neighbours
and friends’ funeral rites especially during the dry season. A typical funeral rite takes a period
of three to four days. During a funeral rite performance, one is required to provide food for
mourners, visitors, and the funeral performers. As custom demands, sometimes sheep, goats
and cattle, which are the major assets of the rural poor, are slaughtered to perform the rites of
the dead. This practice makes some people waste their precious livestock resources like goats,
cows and sometimes food items to perform funerals at the expense of investments. In the end,
they are unable to feed their families let alone to pay school fees for their wards.
5 Kumka: Meaning cry; which refers to the first funeral rite performed by the Builsas when a person died. 6 Juka: Meaning burning, which metaphorically referred to the last funeral rites performed to mark the transition
of the dead to the ancestors.
University of Ghana http://ugspace.ug.edu.gh

111
The desire to honour the dead through expensive funerals diverts many people or community
resources from proper utilization to funeral and related expenses. These practices are seriously
imbedded in Builsa’s tradition. Enquiry with some traditional leaders suggest that, the
paramount chief of the Builsa Traditional area has set time limits within the year from
November to April within which people can perform their funerals. Efforts are also being made
by the traditional authority to regulate the use of alcohol (Akpeteshie) and hiring of modern
entertainment gauges during funerals. If these rules by the traditional authorities are
appropriately monitored and enforced, excessive spending could be reduced. The rural poor
can save enough money to engage in other livelihood or investment activities.
The same effect is applicable to having large family size. Large family sizes are very common
in the district. The idea of giving birth to many children is still practiced well among the
population especially the illiterates. “The average household size in the district is about 5
persons per household. Children constitute the largest proportion of the household structure
accounting for 46.1 percent. Spouses form about 10.8 percent” while “extended family system
constitutes 38.0 percent of the number of households in the District” (GSS, 2010, p. ix [PHC
for Builsa North District]). Large family sizes coupled with the extended family system
requires large amount of resources for family care; their feeding, health and educational needs.
This hinders local economic development in the sense that what would have been used to
operate or expand businesses would be diverted for family support.
4.5. The Actors of LED and Their Roles
Local economic development is a collaborative effort of beneficiary communities/ community-
based organisations, the private sector and the government to utilise the available resources to
create jobs. The actors of LED identified by the study in Builsa North District include but not
limited to; public sector institutions (DA, BAC /NBSSI, District Agricultural Unit and
University of Ghana http://ugspace.ug.edu.gh

112
Community Development and Social Welfare Department) and the private sector (Community
Based Rehabilitation (CBR), Presby-Agriculture and FISTRAD) all located within the District
capital.
From Table 4.5, the respondents have rated all the organisations good in contributing to LED
in the District. While about 45 percent rated good for NBSSI, about 36 percent of the
respondents said NBSSI is excellent when it comes to local economic development. Similar
trend of responses were observed for Community Development (77.3%), the DA (54.5%),
NGO’s (54.5%) except MOFA (45.5%) which was rated fairly.
Table 4.5: The Actors or Agents of LED
Rating
NBSSI Community
Dev’t
MOFA DA NGOs
Freq % Freq % Freq. % Freq % Freq %
Poor 3 13.6 2 9.1 1 4.5 2 9.1
Fair 1 4.5 1 4.5 10 45.5 6 27.3 2 9.1
Good 10 45.5 17 77.3 8 36.4 12 54.5 12 54.5
Excellent 8 36.4 2 9.1 3 13.6 4 18.2 6 27.3
Total 22 100.0 22 100.0 22 100.0 22 100.0 22 100.0
Source: Field Survey, 2016
4.5.1. The role of the District Assembly in contributing to LED
The Assembly as part of its mandate is to provide services, create employment and to promote
development in the locality. The lead actors for local economic development are fundamentally
local people whose responsibility and commitment is to improve city development (see City
Alliance, 2007). The District Assembly as a lead actor of LED creates an enabling environment
for private sector and civic groups to participate in local development through partnership. This
implies that the DA plays the lead role in the provision of infrastructure (such schools,
hospitals, clinics, roads, market infrastructure, and irrigation dams), local skills training/
University of Ghana http://ugspace.ug.edu.gh

113
development and collaborating with donor agencies to provide financial support for local
entrepreneurs.
The success of decentralization depends on how well fiscal decentralization is designed (Berg,
2004, p.33). The District Assembly has set the platform for the promotion of local economic
development in the district and this has confirmed what Akudugu (2013) has said in his study
of Bongo District. It is also accepted that DAs play significant roles in the economic
development process and the success of local economic development is largely dependent on
effective local government participation (Sjostrom, 2010, p.10). The District Assembly alone
certainly cannot provide all the needs of the people but should transcend from only capacity
building of local authorities to effectively utilise revenue for their role as LED promoters
(Alberquerque, 2004) to include active roles in LED. The DA has taken a lead role in setting
the environment to stimulate private sector and civic society participation in the developmental
roles of the district. Builsa North District Assembly has contributed effectively in the provision
of infrastructure, increased access to education and health services. Electricity and water
supply has had an increasing coverage in the district with majority of rural communities hooked
to the national electricity grid. Water pipe systems are connected to the major towns
supplemented with the provision of boreholes. The boreholes and wells invariable serve the
rural population. There are two main irrigation dams in the district in addition to the Tono
irrigation dam in the Kasena Nakana District, which also serves the Chuchuliga environs that
shares boundary with the Kasena Nakana District. However, the two irrigation dams have
recently not been used because of the low water level. Reconstruction is needed to increase the
volume of water for more farmers to engage in dry season farming. Currently another new
irrigation dam is under construction to add up to the existing though out of used ones.
Agriculture farming is predominantly the major economic activity among the people, however,
poor rains and infertile lands (as a result of over cultivation due to limited farming lands) results
University of Ghana http://ugspace.ug.edu.gh

114
in low yielding. This food insecurity in the district is a major concern. The effort by the DA is
in a good direction to find alternative means of farming especially in the dry season where there
is rampant food insecurity among the rural poor. Despite these efforts by the Assembly, the
provision of public goods and services are done in a slow manner, if not limited.
In terms of roads, it must be noted that no road network in the district is tarred except the one
linking the district capital to the regional capital. While it appears to be well with the provision
of feeder roads in the district, there are however, limited means of transport systems linking
the towns and communities. This probably is because of the limited economic activities in most
of these towns. Commercial transport systems are only available at all times in the district
capital, Sandema linking the district to Navrongo, Bolga. Other towns like Wiaga, Chuchuliga,
Siniesi, and Kadema rarely have any transport systems that work on daily basis except on their
market days. The use of motorbikes are the most common means of transport within the district.
But this is basically a private means of transport and as such limited to private use.
The District Assembly as part of its roles in setting the environment also provides or ensures
the following: peace and security, sponsoring needy but brilliant students, monitoring and
evaluation of development plans, collaborating with donor agencies for credit facilities and
facilitating community sensitisation on decentralization and local development.
University of Ghana http://ugspace.ug.edu.gh

115
Figure 4.10: The Role of the District Assembly
Source: Field Survey, 2016
Figure 4.10 shows the major roles played by the DA to promote local economic development.
As shown in the figure, respondents rated the DA good with 56 percent in terms of
infrastructure provision and local capacity/skills development. Respondents noted that, the DA
is doing well in terms of the provision of educational and health facilities. There are primary
schools and CHPs compounds in almost all the communities in the district.
Regarding the role of DA in the development of the district, the District Director of Education
stated that:
The DA does not meet all our expectations but once it meets about 60 to 70% of our
expectations I think it is ok. Not everything can be done at a go. It will be solved
gradually. Most of our schools are no longer under trees (District Director of GES,
2016).
However, the DA is rated fairly in the provision of technical support to SMEs (40.9%) and
financial support to SMEs (50.0%). The District Assembly though provides financial support
for local skills development through counterpart funding. The DA allocates some percentage
of their common fund for rural enterprise programmes and community based self-initiated
0
10
20
30
40
50
60
Infrastructure Capacity building Technical support
to SMEs
Financial support
to SMEs
13.6 13.6
40.9
5054.5 54.5
22.7 22.7
Poor
Fair
Good
Excellent
University of Ghana http://ugspace.ug.edu.gh

116
projects. Other ways in which the District Assembly does support local people is the creation
of job opportunities through Ghana Social Opportunities Project (GSOP), Livelihood
Empowerment Against Poverty (LEAP) and the Disability Fund. The study therefore has
confirmed that, the DA contributes more to infrastructural development (in the areas of
education and health) than MSE growth and development.
4.5.2. The Role of NGOs and Donor Agencies
The role of NGOs in local economic development cannot be underestimated. Private sector and
civic groups in partnership with government can boost local development by identifying the
potentials in the district to create jobs. The major role of some of these NGOs is to identify
local business associations that have the potential to make income, expand and to create
employment in the district. For instance, the Rural Enterprise Programme of the District
Assembly had identified community-based groups and associations and empowered them
through business development training, financial support and facilitated them to develop their
own businesses. The programme has also facilitated them to open bank accounts with the
Builsa Community Bank (Buco Bank) and processed them through the Rural Enterprise
Development Fund and the Rural Enterprise Matching Grand.
Figure 4.11 presents the roles of NGOs in the district. Respondents rated NGOs fairly in the
provision of infrastructure in the District. However, NGOs are doing well in the areas of
capacity building of local entrepreneurs (63.6%), technical support to MSMEs (50.0%) and
financial support to MSMEs (50.0%).
University of Ghana http://ugspace.ug.edu.gh

117
Figure 4.11: The Role of NGO’s in LED
Source: Field Survey, 2016
Some of the NGOs that provide capacity, technical and financial support to MSMEs include;
FISRTRAD, Presby-Agriculture Development, Community Base Rehabilitation and Japan
Social Development Programme.
The role of NGOs in the district cannot be underestimated. NGOs play significant roles in the
areas of capacity building, provision of start-up capital and technical guidance for micro and
small enterprise entrepreneurs. Presby-Agriculture provides technical support and training to
farmer-based groups. The Community Based Rehabilitation also identifies the vulnerable, and
people with disabilities and offers them training skills and development. They equally offer
them start-up capital to enhance their livelihood. It is applied to FISTRAD. FISTRAD has also
identified local skills training as a major component of enhancing local development. They
train the youth basically in the following areas; hairdressing, cloth weaving and dressmaking
The Japan Social Development Programme has supported local business groups with skills
training in income generating activities and with the start-up capitals to start their own
businesses. After the training, monitoring was done to ensure that all clients actually benefited
0
10
20
30
40
50
60
70
Infrastructure Capacity building Technical support
to SMEs
Financial support
to SMEs
63.6
18.2
27.331.8
18.2
63.6
50 50
Poor
Fair
Good
Excellent
University of Ghana http://ugspace.ug.edu.gh

118
from the programme. The action plan of the Japan Social Development Programme (JSDP)
facilitated by the BAC unit of the DA is provided below.
Table 4.6: Japan Social Development Programme 2015 Action Plan
No
.
Activity No. of
Beneficiaries
Resource Person Location
Male Female
1 Technology improvement and
packaging in shea butter
processing
4 28 Presby-Agric Balansa
2 Malt processing - 30 Mr. Margaret
Azantilow
Sandema
3 Technology improvement and
packaging of soap making
1 10 Alhaji Sumala
(from Winchi)
4 Guinea fowl rearing training 20 44 MOFA
5 Sheep and goat rearing training 77 161 MOFA
6 Dowadowa processing 1 16
7 Groundnut processing - 12
8 Rice parboiling 2 6
Source: Builsa North District Business Advisory Centre, 2015
Donor Agencies usually transfer funds to the District Assembly or the Business Advisory
Centre to coordinate rural development programmes that are aimed at reducing poverty and
enhancing the living conditions of people through business or skills development training and
financial support. The skills development programmes are to equip individuals or groups with
skills in special or technical areas to enable them venture into micro and small scale businesses
that can generate income for them. Currently, the JSDP is into identifying income generating
activities such as leatherwork, soap making and packaging, shea butter processing and
packaging, dawadawa processing, livestock rearing and many more and empowering
individuals and groups to be able to establish or expand their own businesses. Beneficiaries of
this programme are supported with initial capital known as the Japan Social Development
Matching Grant coupled with supervision and monitoring to ensure that funds are actually
being utilised for their intended purposes.
University of Ghana http://ugspace.ug.edu.gh
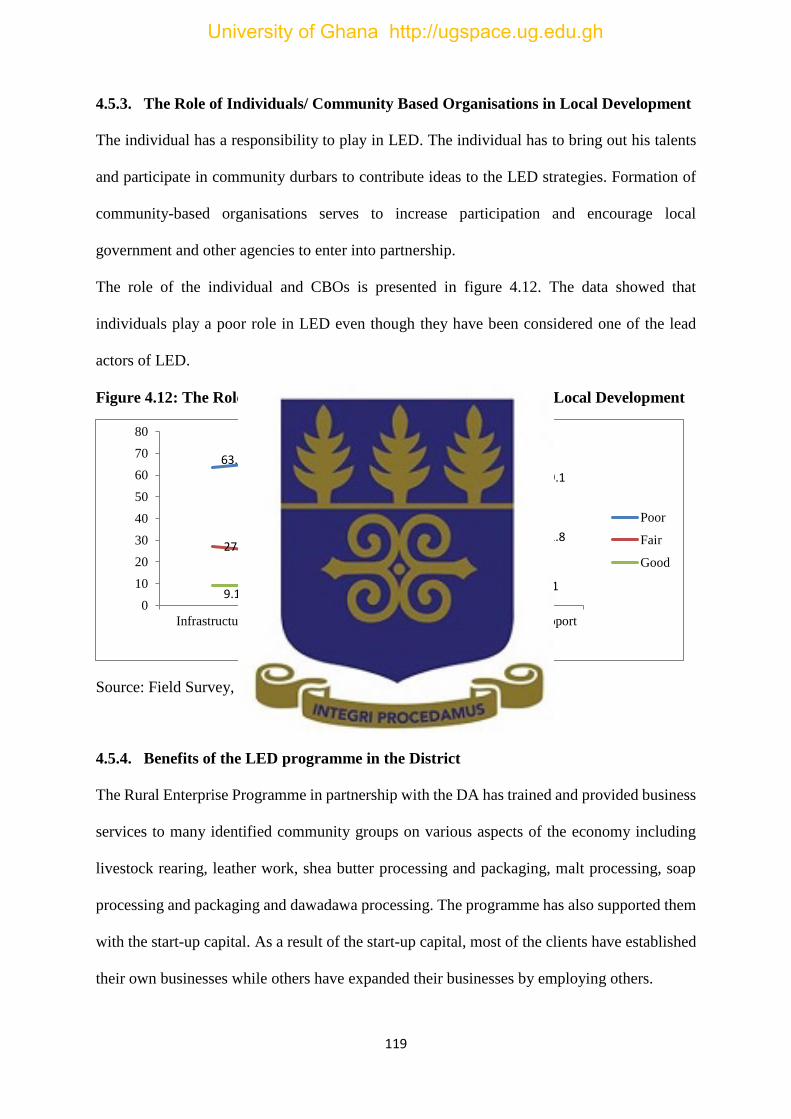
119
4.5.3. The Role of Individuals/ Community Based Organisations in Local Development
The individual has a responsibility to play in LED. The individual has to bring out his talents
and participate in community durbars to contribute ideas to the LED strategies. Formation of
community-based organisations serves to increase participation and encourage local
government and other agencies to enter into partnership.
The role of the individual and CBOs is presented in figure 4.12. The data showed that
individuals play a poor role in LED even though they have been considered one of the lead
actors of LED.
Figure 4.12: The Role of Individuals/ Community Organisations in Local Development
Source: Field Survey, 2016
4.5.4. Benefits of the LED programme in the District
The Rural Enterprise Programme in partnership with the DA has trained and provided business
services to many identified community groups on various aspects of the economy including
livestock rearing, leather work, shea butter processing and packaging, malt processing, soap
processing and packaging and dawadawa processing. The programme has also supported them
with the start-up capital. As a result of the start-up capital, most of the clients have established
their own businesses while others have expanded their businesses by employing others.
63.6 68.2
54.5 59.1
27.322.7
36.4 31.8
9.1
9.19.1 9.1
0
10
20
30
40
50
60
70
80
Infrastructure Capacity building Technical support
to SMEs
Financial support
to SMEs
Poor
Fair
Good
University of Ghana http://ugspace.ug.edu.gh

120
From figure 4.13, majority of the respondents (54.5%) said the programme has created
employment, built capacity of local entrepreneurs and provided infrastructure which brought
about a lot of benefits not only to the clients but to the entire district, since their products are
available to everyone. The DA also benefits a lot since more and more people are working and
they would in turn pay taxes to the Assembly. As Vazquez (2002) rightly noted, successful
LED would be beneficial in many ways including: employment creation, developing skills of
individuals and groups towards high productivity and raising the income of households.
Figure 4.13: The Benefits of LED Programmes in the District
Source: Field Survey, 2016
4.6. Conclusion
The chapter has presented the results of the data collected. Both frequency tables and graphs
were used to present the findings. The chapter particularly paid attention to: the effect of fiscal
decentralization on LED, the barriers of fiscal decentralization, the challenges of LED and
finally the LED actors and their roles in the district. The LED policy benefits in the district is
the generation of employment, building of capacity and enhancement of the provision of
infrastructure.
9.1
13.6
9.1 13.6
54.5
-
10.0
20.0
30.0
40.0
50.0
60.0
Created
employment
Reduced
poverty
Improved
infrast
All Employt,
capacity
building, &
infrast
Percent
University of Ghana http://ugspace.ug.edu.gh

121
CHAPTER FIVE
SUMMARY, CONCLUSION AND RECOMMENDATIONS
5.0. Introduction
This section contains the summary of findings that are captured under the four objectives of
the study. The section therefore entails the contribution of FD to LED, the constraints of FD,
actors of LED and their roles and challenges in promoting LED. Finally, the conclusion and
recommendations are also presented.
5.1. Summary of Findings
Findings of the study are presented here under the four research objectives: contribution of FD
to LED; the challenges to effective fiscal decentralization; challenges of LED in the district,
and the actors of LED and their responsibilities.
5.1.1. Contribution of Fiscal decentralization to LED
The contribution of fiscal decentralization to LED is analysed on the bases of: access to
infrastructure; access to social services; access to credit facilities; participation in local decision
making, LED capacity training and finally employment creation.
Access to infrastructure: It is argued that local governments are strategically placed to embark
on local long term planning in the area of local economic development in partnership with
NGOs, private sector and CBOs. As rightly noted by Rogerson (1999), that the function of
local authorities is to establish and manage local projects whose aim is to bridge inequalities
between citizens as the Assembly has the authority to facilitate the provision of public goods.
The study reveals that the Assembly over the years has been doing well in the provision of
infrastructure especially, schools, CHPs compounds and market stores and sheds. This has
direct and indirect effects on local development. Farmers have access to improved feeder roads
to transport their foodstuffs from the farm sites to the market. What this also means is that they
University of Ghana http://ugspace.ug.edu.gh
122
can produce more food and supply more since there is ready market. With fiscal
decentralization, schools under trees have also been eliminated (District Director GES,
BNDA). Because of the presence of CHPS compounds in almost every community, people
rarely have to travel over long distance to access health on minor illnesses. Most of the
communities are currently hooked to the national grid and are benefiting from electricity
through the rural electrification project.
These interventions themselves may not directly create jobs but set the stage and facilitate an
enabling environment for local enterprise growth and development (Stren & Gombay, 1994;
Rogerson, 1999).
Participation in local decision-making: Participation in local governance involves key
stakeholders such as the private sector, donor agencies, civil society, traditional authorities and
the public. The study found that these stakeholders actively participate in the formulation and
implementation of the district development plans, fee-fixing resolutions, usually at General
Assembly meetings and stakeholder forums. Decisions taken with the full involvement of the
citizens are less likely to fail.
Access to social services: In fact, the study found that FD actually contributes to provision of
social services with special attention to the educational sector. With special intervention
programmes like LEAP, Disability Fund and GSOP, the vulnerable and disadvantaged groups
in the communities were supported with funds to engage in economic ventures that would help
eradicate poverty. Ghana Social Opportunity Project (GSOP) has created some employment
opportunities for people to generate income for themselves through labour work on projects
that benefits the whole community directly; rehabilitation of roads, tree planting, and
University of Ghana http://ugspace.ug.edu.gh

123
construction/ rehabilitation of dams. The study however found that the provision of these social
services were very limited in scope and covers only small fraction of the population.
Access to credit facilities: Funding is a lifeblood of every organisation. Access to funding is
a necessary condition for the growth and development of micro-enterprises. Unfortunately,
there is only one rural community bank in the District that provides financial services. This
constitutes a challenge to LED. The DA also does not directly provide credit facilities to local
and micro-enterprises. Access to variety of credit facilities by individuals in the District is not
an option since there is only one financial institution in the District. As rightly put by Oates
(2005, p. 351) “without access to monetary prerogatives and with highly open local economies,
decentralized governments have only a very limited capacity to influence local levels of
employment and prices”.
LED Capacity Training: The Assembly through the Rural Enterprise Programme provides
local skills training. The department identifies local business groups and trains them to improve
upon their services. Some of the local skills training provided by the unit include, livestock
rearing, shea butter processing, leatherwork and many more. However, the number of
beneficiaries the department trains in a year is limited due to inadequate funds. Worsened by
the late releases of these funds from government and donor agencies, the Assembly is unable
to train many people at a go.
Besides, there is limited number of specialised LED trainers in the district to facilitate training
and planning of LED programmes.
Employment Creation: The study revealed that the DA does not directly create employment
for the citizens but instead as highlighted, by Blakely and Bradshaw (2002), the DA plays a
facilitation role in job creation. Though the DA has created labour jobs for some people under
the GSOP programme, these jobs were short-term measures to poverty reduction and are rarely
University of Ghana http://ugspace.ug.edu.gh

124
sustainable in themselves. The private sector institutions and individuals are the major creator
of employment within the District.
Funding LED: The main sources of funding for LED in the district is the District Assemblies
Common Fund (DACF), District Development Facility (DDF), Ghana Social Opportunity
Projects (GSOP), internally generated fund (IGF), Sector support from government
departments (Ministry of Trade and Industry) and donor funding (Japan Social Development
Fund (JSDF)) (Builsa North District Assembly Budget, 2015). It must be noted that in the
Builsa North District, most of these funds are not forthcoming. Sometimes, funds do not come
at periods where LED plans could be executed and even if they come they have certain
conditions attached (Oates, 1993). The District’s own internally generated revenue is woefully
inadequate to support local economic programmes. Poor districts struggle to access available
sources of funding due to low capacity limitations and their weak revenue base may debar them
from accessing standard concessionary loans.
Though the District Assembly can access funding from variety of sources, the district “often
lacks adequate, locally available funds and competencies to drive the LED process
independently” (Patterson, 2008, p. 11). Moreover, as stressed by Rogerson (2010) the funding
sources that are available to the district to a large extent are insecure. Patterson (2008) opined
that LED generally relied mostly on charitable donations and public grants. This implies that
local and international non-governmental organisations or donors are the key actors that
support many local governments including BNDA in respect of accessing or making available
direct funding for LED initiatives (Rogerson, 2008).
In summary, the District Assembly has not generated enough revenue on its own to meet the
developmental needs of its people. However, it was found that FD has some potential useful
roles in contributing to LED, but the translation of these potentials to actual local economic
University of Ghana http://ugspace.ug.edu.gh
125
development depends on a number of factors including local institutions responsiveness to
local welfare and the fiscal institutional structures (Oates, 1993). Much is needed to supplement
its internal revenue. Though donor agencies (both local and international) and central
government transfers have stepped-in in the right direction, these funds do not flow regularly
to the District Assembly and even if they flow, it comes with expenditure constrains (Crawford,
2008). The various social intervention programmes provided by the Assembly have brought a
significant contribution to education, employment, local skills development, infrastructure
investment and livelihood empowerment. This is what local economic development at the most
basic terms sought to address, investing in the livelihood activities of families and individuals
(Wekwete, 2014). With these contributions of the Assembly and in view of its resources
available, not everyone may directly feel its impact in the short run, but would greatly impact
the lives of people in the long run as the local economy continue to expand.
5.1.2. Constraints of Fiscal Decentralization
Fiscal decentralization is good but it is not without challenges. The various challenges
confronting fiscal decentralization are analysed in three main sections: legal and political
environment, quality of staff, revenue and expenditure autonomy and fiscal balance.
Legal framework of decentralization: There is no total devolution in Ghana. The Assembly
was supposed to be a comprehensive body comprising of all the decentralized departments
under one composite budget system that was introduced in 2012. However, some of the
decentralized departments such as health and education are not under the Assembly. The 1992
constitution and the local government act do not empower the District Assembly to hire and
fire its own staff. The power of the DA to hire and fire is limited to casual workers who are
usually paid from IGF.
University of Ghana http://ugspace.ug.edu.gh

126
It however must be noted that, a complete devolution that gives absolute powers to local
governments to raise their own revenue and control their own expenditure may also be a recipe
for disaster. It may lead to unequal development as wealthier districts may agitate to be
autonomous and to operate independently (Asante & Ayee, 2010) while poor and deprived
districts may not be well endowed with enough resource (natural resources) to effectively
influence their own development. The well-endowed districts would continue to grow and
expand while the poor districts would become poorer.
Political appointment of District Chief Executives: The study revealed that the appointment
of DCEs in the local government political system serves as a barrier to effective
decentralization. The overall boss of the Assembly is the District Chief Executive (DCE) who
is also the political head. The central government appoints the DCE subject to the approval of
the General Assembly. Some DCEs have little or no training about how public funds should be
managed. Such inexperienced leaders can cause a lot of spending to achieve their selfish
ambitions of remaining as political leaders (Asante & Ayee, 2010). They may focus too much
on championing the agenda of the political party to which their loyalty lies to the detriment of
the interest of the masses. This is a serious barrier to the full realization of fiscal
decentralization. The appointment of DCEs does not also ensure effective downward
accountability as the DCE would be more accountable to the president than to the local people.
Antwi-Boasiako (2010) shares similar views. Lack of downward accountability mechanism at
the local level to propel duty bearers to be responsive is a clear manifestation of “democratic
deficits in the national political framework of decentralization in Ghana” (Crawford, 2010, p.
92).
Quality and quantity of Staff: The quality and adequacy of local government revenue staff
in deprived districts may affect the implementation of FD. The calibre of staff posted to manage
resources at the district level especially the deprived districts cannot cause effective utilization
University of Ghana http://ugspace.ug.edu.gh

127
of public funds. Those who are highly qualified to mobilize public finances usually may not
accept postings to deprived districts. At the end, we may have a maximum of HND holders
mobilizing the whole resources of the Assembly. In the Builsa North District, as in most of the
District Assemblies in Ghana, the revenue staff have low-level qualifications (SHS). Lack of
capacity training for staff at the local level has serious implications for fiscal decentralization.
In addition to that, poor accountability of revenue collectors coupled with poor supervision and
monitory of the revenue staff results in revenue leakages. This is a serious impediment on
effective revenue generation in the district.
Control of revenue and expenditure: The study found that the Assembly is unable to generate
enough revenue on its own to finance its own development as a result of lack of adequate
economic activities in the district and also the district is inhabited by a lot of people with critical
income challenges. In addition to that, local governments have been mandated to raise their
own revenue in terms of market tolls and basic rates, but the central government takes most of
the lucrative tax areas (Nkrumah, 2000). This makes the Assembly unable to generate enough
revenue to meet its own expenditure. With paltry internally generated fund, the District
Assembly would continue to depend largely on central government’s transfers for the
implementation of its major development programmes and projects. Central government’s
transfers do not flow regularly to the Assembly and this affects the development of the locality.
That notwithstanding, the late releases of government funds and their accompanying regulated
expenditure are intended to benefit central government and not the locality. For instance, the
guidelines for the utilization of DACF for the 2014 fiscal year requires that, part of the grants
should be used to provide CHPs compound which might not be a priority area of the people.
Some aspects of government policies do not really provide support for the full realization of
fiscal decentralization.
University of Ghana http://ugspace.ug.edu.gh

128
Fiscal balance: Ensuring fiscal balance in the country is very important. Devolving fiscal
power to local governments can lead to either vertical or horizontal imbalances. If vertical
balance is not put in place then intergovernmental fiscal system would be badly compromised
(Bahl, 2008). When District Assemblies are given more expenditure functions relative to
revenue, some services might not be provided or may be shoddily provided (Bahl, 2008).
Eventually fiscal deficits would set in causing DAs to be indebted to their service providers.
Similarly, when the DAs are assigned more revenue functions relative to expenditure, central
government would not have enough resources to deliver services (Bahl, 2008) and this can
compel the government to increase taxes.
5.1.3. What are the Factors Hindering the Promotion of LED in the District?
There are numerous benefits of adopting LED strategies at the local level. Many local
governments are enthused by the perceived benefits that have propelled them to enact local
economic policies for implementation. This is however not without hindrances, the factors that
were identified that hinder the promotion of LED is captured into three main sections:
administrative, socio-cultural and human capacity.
Administrative challenges: From the study, almost all the respondents identified inadequate
funds as the major challenge the Assembly faces in the implementation of its plans. Some of
them have expressed worries over the late flow of funds. The head of BAC has actually
admitted that the counterpart funding from the Assembly is not forthcoming. Moreover, some
of the potential beneficiaries do not cooperate by contributing their quota to support local
business training programmes. The issue of lack of funds is a barrier in every organisation but
it is more of a chronic problem in the Builsa North District. They have attributed most of their
inabilities to develop to lack of adequate funds. Unfortunately, it is very difficult to ascertain
the truth about their finances. Crawford (2008) also expressed this view.
University of Ghana http://ugspace.ug.edu.gh

129
The Business Advisory Centre that is a department responsible for monitoring and evaluating
local/ rural enterprise development programmes is in fact incapacitated in terms of logistics to
undertake its core functions. This seriously hinders the promotion of local economic
development. It is amazing that the BAC of the District Assembly have had their vehicle broken
down several months before this study and still was not sure when the maintenance of the
vehicle would be done. What effective monitoring and evaluation can one expect from these
officials in the face of these challenges?
Political commitment and support is very important in the assessment and implementation of
LED policies. Bottom up policies are more effective than top down support from either regional
or national governments (See Citi Alliance, 2007). Top down support from central government
may dictate LED policies that may not reflect the local potentials but the District Assembly is
forced to comply because of the directives. Plans developed and imposed by government alone
may not receive community commitment (Blakely & Bradshaw, 2002).
Socio-cultural Factors: Funeral rites and large family size constitute a socio-cultural factor
that negatively affects community level development in the Builsa North District.
Capacity: Human capacity required to be able to identify and formulate community economic
development potentials was identified as a challenge. Quality human resource availability in
an area can attract industries or business to the area (Blakely & Bradshaw, 2002). It appears
from the data gathered that, quite a number of the respondents are unable to point out the local
economic potentials within the district. Similarly, community groups seem not to be fully aware
of their roles as key actors of LED. Though there were skills development training being carried
out among some segments of the population, local authorities require training in local economic
development to enable them be able to assess local potentials and formulate appropriate
policies to facilitate and coordinate local development.
University of Ghana http://ugspace.ug.edu.gh

130
Similarly, the study found that, the BAC and private sector institutions (FISTRAD and Presby-
Agric) contributes to capacity building/ training of local entrepreneurs in the district. However,
the number of people who benefit from these trainings are usually due to limited availability
of funds.
Data collection challenge: One of the challenges of LED in the district is the availability of
quality local data to enhance the understanding of the local economy that will identify local
competitors and inform local LED decision making. Rogerson (2008) also identified this
challenge.
5.1.4. Actors of LED and their Roles
Local economic policy formulation and implementation is most often a collaborative exercise
that involves a wide set of stakeholders from government institutions, civic groups and private
bodies (See City Alliance, 2007) and the lead actors of LED tend to be local who have a clear
responsibility and commitment to promote LED in the District. The lead actors of LED in the
district include, the District Assembly, Donor Agencies, NGOs and CBOs.
The DA plays a significant role in the economic development process of the district. The DA
mainly contributes to LED through mainly facilitation and coordination.
NGOs contribute to LED through the provision of capacity building, start-up capital and
technical guidance for micro and small scale enterprise entrepreneurs.
Donor agencies usually through the District Assembly and the Business Advisory Centre
supports LED in the district by funding some of the local economic development programmes.
Individuals play a poor role in LED
University of Ghana http://ugspace.ug.edu.gh
131
5.2. Conclusion
In this research, the context of fiscal decentralization and local economic development has been
reviewed. Fiscal decentralization was defined as the transfer of budgetary authority and
functions from the CG to LGs to make decisions regarding revenue mobilization and
expenditure (Boschmann, 2009). Local economic development was also defined as the process
by which local governments collaborate with community groups and the private sector to
establish and manage the existing resources to create jobs and stimulate the economy of a well-
defined area (Helmsing, 2001). The study focused on fiscal decentralization and local
economic development in the Builsa North District in the Upper East Region. The study has
determined the contribution of fiscal decentralization on local economic development, the
barriers of fiscal decentralization, factors that hinder local economic development and finally
the actors of LED and their respective roles. To address these objectives, the study adopted
qualitative research method within the case study design. This has allowed deeper analysis to
be able to come out with findings that would have otherwise not been possible using only
quantitative research method. Therefore, both structured questionnaires and semi-structured in-
depth interview questionnaires were administered to 22 staffs and 8 heads of departments
respectively.
It was found that, fiscal decentralization facilitates LED but with minimal effects. This is
because of the heavy reliance of the Assembly on central government’s transfers, which in turn
undermines the fiscal autonomy of the Assembly. The provision of public goods and services
within the assembly to a large extent is the result of negotiation between local authorities and
central government. Without central government’s interventions, the assembly is unable to
provide its basic services. The reason is simple, low IGF base rarely even meets its
administrative expenses.
University of Ghana http://ugspace.ug.edu.gh

132
The decentralization policy and local government acts, Act 462 have provided the legal
framework for the operation of decentralization in Ghana. There is however not complete
devolution that empowers the local authorities with absolute fiscal autonomy. There may be
several reasons for this incomplete decentralization, but the lack of revenue and expenditure
autonomy of the local authority is a limitation to fiscal decentralization. The reality is that the
District is unable to generate enough of its own revenue, hence it relies heavily on central
government’s transfers which flow is often times not regular. Most often, these transfers to the
Assembly have certain strings /conditions attached which may not favour local conditions.
Some experts of local government also said, the appointment of District Chief Executives and
Assembly Members does not ensure downward accountability. In addition, the result of
government’s appointment is that they will be directly accountable to the central government
instead of the local people. At the local level, many compromises would be made to suit the
central government in appreciation for their appointments. This is a reflection of the popular
saying ‘scratch my back and I will scratch yours too’. This greatly hinders the full realization
of fiscal decentralization.
The study also found that low economic activities contribute to low IGF base and in addition,
socio-cultural practices (expensive funeral rites, and high illiteracy rates) are predominantly
the barriers to local economic development in the district. Though funding has appeared to be
the major challenge faced by the assembly, lack of community-based groups’ cooperation
coupled with inadequate skilled LED experts within the district is an obvious impediment to
LED.
Finally, the study has identified the actors of LED within the district and their roles. These
actors include the local government (the Assembly), community-based groups, NGOs and
donor agencies. Any of these actors plays one or more of the roles of an entrepreneur, a
facilitator, a coordinator or a stimulator (Blakely & Bradshaw, 2002) in contributing to local
University of Ghana http://ugspace.ug.edu.gh

133
economic development in the district. The Assembly in this case is obviously the lead actor in
setting the stage for LED. The Assembly has provided infrastructure, ensured citizens
participation in its decision making process, contributed to capacity building of Micro, Small
Medium Enterprises (MSMEs), and is providing little direct technical and financial support to
MSMEs in the district. Based on the data gathered, the Assembly is playing the role of
facilitation but with little roles in coordination, stimulation and entrepreneurship. The NGOs
and community-based groups, which include FISTRAD and Preby-Agric jointly, play the role
of entrepreneurship and facilitation. They facilitate LED by providing local skills training and
technical support and to some extent start-up capital for young entrepreneurs to establish their
own businesses after their training. The Japan Social Development Fund and United Nations
International Children Education Fund (UNICEF) are the donor agencies that support the
capacity of the District Assembly in contributing to local business development and education
respectively.
5.3. Recommendation
The findings of this study would be relevant in two main ways: policy recommendation and
recommendation for further research.
5.3.1. Policy Recommendations
In terms of policy, the study would contribute to knowledge in relation to fiscal decentralization
challenges, how fiscal decentralization helps to promote LED, the actors of LED and their roles
and finally the factors inhibiting LED promotion within the local level. As a result, it would
help policy makers especially, local governments to design strategic plans to minimise their
challenges and to maximize local economic development.
University of Ghana http://ugspace.ug.edu.gh

134
The study made the following specific recommendations;
1. Fiscal decentralization could be made very effective through legal and political
commitment. However, this might sound an issue of national concern rather than local
governments who do not have the locus to effect any changes in the national
constitution. Nonetheless, local governments could call for amendments of the
constitution in view of its anticipated benefits.
2. In addition to the above, local governments should be empowered to elect their own
DCEs and hire and fire their own staff. With this, there will be downward
accountability.
3. Training or capacity building: local leaders should be trained on how to manage public
resources effectively to create local economic development. In addition, assessing,
designing and planning LED requires some special skills. District coordinating
directors, district planners, district budget analysts, district engineers and Rural
Enterprise Programme directors should be given special training to facilitate local
development planning and implementation since they are the key staff in the area of
planning and implementation of local policies in the district.
4. To strengthen LED at the local level, government should provide incentives or
motivation packages for well experienced staff who accept posting to work in rural
areas. Incentives in the form of allowances, salary increment should be given to staff to
induce them to stay in deprived districts. In addition, they should make logistical
support such as vehicles for monitoring available for districts that cannot afford to
acquire this logistics.
5. From the analysis, the data has shown considerable commitment of community
members in promoting the Builsa ‘Feok Festival’ (annual festival to commemorate the
work of their fore fathers in the fight against slavery) that attract people from far and
University of Ghana http://ugspace.ug.edu.gh

135
near to the district to witness the rich culture of the people and to contribute to
development. There are other local potentials such as leatherwork and shea butter
extraction that the DA can develop to attract investors. The study recommends that,
local governments, as part of their contribution to employment and revenue generation
in the districts, develop and publish their local potentials.
6. To reduce the barriers to LED, there should be regular sensitisation of community
members on the negative cultural practices that affect economic development.
Moreover, cultural values should be inculcated in the educational curriculum to
gradually discourage bad or negative cultural practices that have the tendency of
affecting development within the district. Non-formal education can also be intensified
within the district to reduce the illiteracy rate. The DA can help community members
to understand the benefits of forming community based organisations. The DA and
private bodies can provide training programmes to community-based groups on how
they can influence or contribute to their local development.
7. In general, LED in the District Assembly is doing somewhat well but not as much to
desire. Therefore, there is the need for the District Assembly to involve private sector
(Rogerson, 2010) in its LED operations. One important issue that concerns partnership
between the District Assembly and the private sector is ‘red tape’ or local regulatory
reform (Rogerson, 2010) and addressing it is a step forward to facilitating LED
initiative. Local authorities can eliminate severe bureaucratic processes and accord
importance to improving the local environment for private sector participation in the
district. One other way of helping small enterprises to grow is to reduce taxes and the
cost of business registration for new businesses.
University of Ghana http://ugspace.ug.edu.gh

136
5.3.2. Recommendation for Further Research
The study made the following recommendations for future research;
1. The current study has found how the District Assembly used its fiscal resources to
promote local economic development using the staff of the Assembly as its sample.
Further research should increase the scope of the study area and/ or the sample size to
include the public to contribute to the understanding of the effect of FD on LED.
2. There is still no consensus on the effect of complete fiscal devolution on local
development. In addition to that, the literature has not shown any clear justification for
absolute fiscal devolution in view of the Ghanaian situation. More research is needed
from different approaches and context on the subject matter to identify the best
strategies to increase local revenue and expenditure autonomy without causing negative
developmental consequences.
3. Further studies could also focus on looking at other aspects of human development such
as the contribution of public private partnership in local economic development.
University of Ghana http://ugspace.ug.edu.gh

137
REFERENCES
Adablah, C. (2003). The Role of Civil Society in Decentralized Governance for Poverty
Reduction: The Experience in West Africa. UN-DEBA Workshop paper.
Adomonline.com. (2014, 3rd November) Nkwanta South DCE Murdered in cold blood.
Retrieved on 10-11- 2015, from http://myjoyonline.com/news/2014/November-
3rd/breaking-news-nkwanta-south-dce-shot-dead.php
Ahwoi, K. (2010). Local Government and Decentralization in Ghana. Unimax Macmillan.
Akai, N. & Sakata, M. (2002) Fiscal Decentralization contributes to economic growth:
Evidence from state-level cross-section data for the United States: Journal of Urban
Economics 52 93–108.
Akudugu, J. A. (2013). Organizing and Implementing Local Economic Development Initiatives
at the District Level in Ghana. PhD. Thesis. Universitats-und Landesbibliothek, Bonn.
Antwi-Boasiako, K. (2010). Administrative Decentralization: Should Districts and Regions
elect their own Leaders in Ghana? African Social Science Review: Vol. 4(1): 35-51
Asante, F. A. & Ayee, J. R. A. (2010) Decentralization and Poverty Reduction. Research
Gate (Accessed on 29/11/2015 from
www.researchgate.net/publication/265047859_Decentralization_and_Poverty_Reduct
ion
Asthana, A. N. (2003) Decentralization and Supply Efficiency: The case of Rural Water
Supply in Central India. The Journal of Development Studies, 39:4, 148-159
Ayee, J. R. A. (1992) Decentralization under Ghana's Fourth Republican Constitution: Law
and Politics in Africa, Asia and Latin America, Vol. 25, No. 4 pp. 394-406
University of Ghana http://ugspace.ug.edu.gh
138
Ayee, J. R. A. (2003) Decentralization and local governance in Ghana: in Crawford, G. (2008)
Decentralization and the Limits to Poverty Reduction: Findings from Ghana. Oxford
Development Studies, Vol. 36, No. 2
Ayee, J. R. A. (2004) Ghana: a top-down/ initiative, in: Crawford, G. (2008) Decentralization
and the Limits to Poverty Reduction: Findings from Ghana. Oxford Development
Studies, ol. 36, No. 2
Azila-Gbettor, E. M., Adjimah, H. P. & Tibu, S. K. (2014) Fiscal Decentralization and
Poverty Reduction: Citizens View; Journal of Social Economics Research, 1(6): 118-
128
Bahl, R. (1999) Implementation rules for fiscal Decentralization: International Studies
Program. Working Paper 99-1
Bahl, R. (2008) The Pillars of Fiscal Decentralization. CAF Working Papers
Bahl, R. W., & Linn, J. F. (1992). Urban Public Finance in Developing Countries; Oxford
University Press (World Bank): New York
Bengt, J. (2007) Enacting local economic development – theoretical and methodological
challenges", Journal of Enterprising Communities: People and Places in the Global
Economy, Vol. 1 Iss 1 pp. 7 - 26
Berg, R. D. V. D. (2004). Lessons Learned on Donor Support to Decentralization and Local
Governance. DAC Evaluation Series. Paris, OECD.
Bird, M. R. & Vaillancourt, F. (1998) Fiscal Decentralization in developing countries. Edition
(1).Cambridge University press. New York
Bird, R. M. (1986). On Measuring Fiscal Centralisation and Fiscal Balance in Federal States.
Government and Policy 4. 405-18.
University of Ghana http://ugspace.ug.edu.gh

139
Bird, R. M. (1986). On Measuring Fiscal Centralisation and Fiscal Balance in Federal States.
In Oates, W. (1993). Fiscal Decentralization and Economic Development: National Tax
Journal, XLVI, 237–243.
Blakely, E. J. & Bradshaw, T. K. (2002). Planning Local Economic Development: Theory and
Practice. 3rd Ed. Sage Publications Ltd. London
Bluestone, B., Harrison, B. & Baker, L. (1981). Corporate Flight: The causes and
Consequences of Economic Dislocation. Washington, DC: Progressive Alliance
Books.
Boateng, R. (2014) Research Made Easy. 1Ed. PearlRichards Foundation. Accra, Ghana.
Bodman, P. & Hodge, A. (2010). What Drives Fiscal Decentralization? Further Assessing the
Role of Income: Fiscal Studies, Vol. 31, No. 3, pp. 373-404
Boschmann, N. (2009). Fiscal Decentralization and Options for Donor Harmonization
DPWG-LGD
Brennan, D. & Buchanan, J. (1980). The Power to Tax: Analytical Foundations of a Fiscal
Constitution. Cambridge University Press, Cambridge.
Builsa North District Assembly (2010). Annual Statements of Accounts (2010-2015). Sandema
Builsa North District Assembly (2014). District Medium Term Development Plan (2014-
2017). Sandema
Builsa North District Assembly (2014). District Composite Budget. Sandema
Cities Alliance (2007). Understanding Your Local Economy: A Resource Guide for Cities.
USA.
Conyers, D. (1990). Centralisation and Development Planning: a Comparative Perspective, Is
Decentralising for participatory Planning? Edited by P. de Valk and K. Wekwete,
Aldershot: Avebury
University of Ghana http://ugspace.ug.edu.gh

140
Crawford, G. (2008). Decentralization and the Limits to Poverty Reduction: Findings from
Ghana. Oxford Development Studies, Vol. 36, No. 2
Crawford, G. (2010). Decentralization and struggles for basic rights in Ghana: opportunities
and constraints. The International Journal of Human Rights, 14:1, 92-125
Creswell, J. W. (2009). Research Design –Qualitative and Mixed Methods Approaches-Third
Edition. Thousand Oaks: Sage Publication.
Crook, C. R. (2003). Decentralization and Poverty Reduction in Africa: The Politics of
Local–Central Relations. Public Administration Development. 23, 77–88
Crook, R. C. (2003). Decentralization and poverty reduction in Africa: the politics of local-
central relations. Public Administration and Development, 23, pp. 77–88.
DFID (2008). Growth, building jobs and prosperity in developing countries. Department for
International Development. Great Britain.
District Assemblies Common Fund (2014). Guidelines for the utilization of the DACF for 2014
fiscal year. Accra
District Assemblies Common Fund (2015). Impact Assessment Report. Accra
District Assemblies Common Fund (2016). Guidelines for the utilization of the DACF for 2016
fiscal year. Accra
Ebner, A. (2005). Entrepreneurship and Economic Development. Journal of Economic
Studies. Vol. 32 Iss 3pp. 256-274
Ghana Living Standard Survey Round 6 (2014). Labour Force Report. Ghana Statistical
Services, Ghana
Ghana Statistical Service (2010). Population and Housing Census. Builsa North District
Analytical Report. GSS, Ghana
University of Ghana http://ugspace.ug.edu.gh

141
Ghaus-Pasha, A., Pasha, H. A. and Khan, A. H. (2000). Devolution and Fiscal
Decentralization. Pakistan Development Review, Vol. 39, No. 4, Part II, pp. 981-1011
Habibi, N., Huang, C., Miranda, D., Murillo, V., Ranis, G., Sarkar, M., and Stewart, F.
(2003). Decentralization and Human Development in Argentina. Journal of Human
Development, 4:1, 73-101
Hammond, W. G. &Tosun, S. M. (2009). The Impact of Local Decentralization on Economic
Growth: Evidence from U.S. Counties. Discussion Paper No. 4574
Han, L. & Kung, K. J. (2015). Fiscal incentives and policy choices of local governments:
Evidence from China. Journal of Development Economics 116, 89–104
Helmsing, A. H. J. (2001). Local Economic Development: New generations of actors, policies
and instruments for Africa. A Summary Report Prepared for the UNCDF Symposium
on Decentralization Local Governance in Africa. Draft Papers for the 2001 Cape
Town Symposium. Cape Town
Helmsing, A. H. J. (2003). Local economic development: New generations of actors, policies
and instruments for Africa. Public Administration and Development 23(1): 67-76.
ILGS, (2010). A Guide to District Assemblies in Ghana: published by Friedrich-Ebert-
Stiftung Ghana.
Im, T. (2010). Does Decentralization Reform Always Increase Economic Growth? A Cross
Country Comparison of the Performance. International Journal of Public
Administration, 33:10, 508-520,
Jia, J., Guo, Q., & Zhang, J. (2014). Fiscal Decentralization and local expenditure policy in
China, China Economic Review 28, 107–122
University of Ghana http://ugspace.ug.edu.gh
142
Kwakye, P. (2013). Democracy and Economic Growth in Ghana: Master’s Thesis. (Accessed
from http:ugspace.ug.edu.gh on 8/12/2015)
Lawrence, F. & Hadingham, T. (2008). Decentralization and the challenge of institutionalising
local economic development: Some practical insights from the South African
experience, @local. glob 5. 41–5.
Lin, J. Y. & Liu, Z. (2000). Fiscal Decentralization and Economic Growth in China:
Economic Development and Cultural Change, Vol. 49, No. 1, pp. 1-21
Liou, K. T. (2009). Local Economic Development in China and the United States: Strategies
and Issues. Public Administration Review, Vol. 69, Supplement to Volume 69:
Comparative Chinese/ American Public Administration, pp. S29-S37
Local Government Act, Act 462 of 1993
Martinez-Vazquez, J., Lago-Penas, S. & Sacchi, A. (2015). The Impact of Fiscal
Decentralization: A Survey. GEN Working Paper A – 5
Mensah, J. K., Domfeh, K. A., Ahenkan, A. & Bawole, J. N. (2013). Policy and Institutional
Perspectives on Local Economic Development in Africa: The Ghanaian Perspective.
Journal of African Studies and Development. Vol.5 (7), p. 163-170.
Midgley, J. & Livermore, M. (1998). Social Capital and Local Economic Development:
Implications for Community Social Work Practice. Journal of Community Practice,
5:1-2, 29-40
Miles, M. B. & Huberman, A. M. (1994). An Expanded Sourcebook Qualitative Data Analysis.
Sage Publications.
Ministry of Local Government and Rural Development (2010). Draft Decentralization Policy
Framework: Accelerating Decentralization and local Governance for National
Development.
University of Ghana http://ugspace.ug.edu.gh

143
Moche, T. J., Monkam, N. & Aye, C. G. (2014). Fiscal Decentralization and Poverty in South
Africa: Evidence from panel data analysis, Investment Management and financial
innovations, volume 11, issue 2.
Nkrumah, S. A. (2000). Decentralization for good governance and development: The Ghanaian
experience. In Crawford, G. (2008). Decentralization and the Limits to Poverty
Reduction: Findings from Ghana. Oxford Development Studies, Vol. 36, No. 2
Oates, W. (1972). Fiscal Federalism. Harcourt-Brace, New York. Chapter five.
Oates, W. (1993). Fiscal Decentralization and Economic Development: National Tax Journal,
XLVI, 237–243.
Oates, W. (1993). The Role of Fiscal Decentralization in Local Economic Development.
National Tax Journal, Vol. XLVI, No. 2.
Oates, W. (2005). Toward a Second-Generation Theory of Fiscal Federalism. International
Tax and Public Finance, 12, 349–373.
Oduro, A. D. (2001). A note on public expenditure and poverty reduction in Ghana. Revised
version of the paper presented at a workshop on Microeconomic stability, growth and
poverty reduction in Ghana. Centre for Policy Analysis.
Ogawa, H. & Yakita, S. (2009). Equalization Transfers, Fiscal Decentralization, and Economic
Growth”: Finanz Archiv /Public Finance Analysis, Vol. 65, No. 1, pp. 122-140
Patterson, C. (2008). Country report on local economic development in South Africa. Report
prepared for GTZ (German Technical Cooperation), Strengthening Local Governance
Programme in South Africa, Pretoria.
Patton, M. Q. (2002). Qualitative Research and Evaluation Methods, Third Edition. Thousand
Oaks: Sage Publications.
University of Ghana http://ugspace.ug.edu.gh

144
Porcelli, F. (2009). Fiscal Decentralization and Efficiency of Government. A brief Literature
Review. Department of Economics, University of Warwick, UK
Prud’homme, R. (1995). The dangers of decentralization. In Smoke (2003) Decentralization
in Africa. Goals, Dimensions, Myths. Journal of Public Admin and Development. 23,
pp. 7–16.
Rambanapasi, C. O. (1992). A Review of the Main Determinants and Characteristics of
Centre-Local Relations in Zimbabawe. International Journal of Public Administration,
15, pp.1397-1439; United Nations Development Programme. Human Development
Report 1993’ Oxford University Press (for the World Bank): New York, 1993.
Rees, J. C. & Hossain, F. (2010). Perspectives on Decentralization and Local Governance in
Developing and Transitional Countries. International Journal of Public Administration,
33:12-13, 581-587
Rodden, J. (2003). Reviving Leviathan: Fiscal Federalism and the Growth of Government.
International Organization, 57(4):695–729.
Rodriguez-Pose, A. & Tijmstra, S. (2009). On the Emergence and Significance of Local
Economic Development Strategies. CAF Working Paper N° 2009/07
Rodriguez-Pose, A. & Bwire, A. (2004). The Inefficiency of Devolution. Environment and
Planning A 36(11) 1907-1928.
Rodriguez-Pose, A. & Kroijer, A. (2009). Fiscal Decentralization and Economic Growth in
Central and Eastern Europe. LEQS Paper No. 12.
Rodriguez-Pose, A., & Tijmstra, S. (2007). Local Economic Development as an Alternative
Approach to Economic Development in Sub-Saharan Africa. A report for the World
Bank, World Bank.
University of Ghana http://ugspace.ug.edu.gh

145
Rodriguez-Pose, A., & Tijmstra, S. (2009). On the Emergence and Significance of Local
Economic Development Strategies. CAF Working Paper, CAF. 7.
Rogerson, C. M. (1999). Local Economic Development and Urban Poverty Alleviation. The
Experience of Post-Apartheid South Africa. Habitat International 23(4): 511-534.
Rogerson, C. M. (2008). Consolidating local economic development in South Africa. Urban
Forum 19, 307–28.
Rogerson, C. M. (2010a). In search of public–private sector partnerships for local economic
development in South Africa. Urban Forum 20, in press.
Rogerson, C. M. (2010b). Local economic development in South Africa: strategic challenges.
Development Southern Africa 27(4): 481-495.
Rogerson, C. M. (2014). Reframing place-based economic development in South Africa: The
example of local economic development, Bulletin of Geography. Socio–economic
Series No. 24: 203–218.
Rogerson, C. M., & Rogerson, J. M. (2010). Local Economic Development in Africa. Global
Context and Research Directions. Development Southern Africa 27(4): 465-480.
Rogerson, C. M., (2014). Reframing place-based economic development in South Africa: The
Example of Local Economic Development. In: Szymanska, D. and Bieganska, J. (Ed.),
Bulletin of Geography. Socio-economic Series, No. 24, Torun: Nicolaus Copernicus
University Press, pp. 203-218.
Rondinelli, D. A., & Nellis, J. R. (1986). Assessing decentralization policies in developing
countries: The case for cautious optimism. In Rees and Hossain (2010) Perspectives on
Decentralization and Local Governance in Developing and Transitional Countries.
International Journal of Public Administration, 33:12-13, 581-587
Sacchi, A. & Salotti, S. (2014). The Effects of Fiscal Decentralization on Household income
inequality: Some empirical evidence: Spatial Economic Analysis, Vol.9, No.2, 202-222
University of Ghana http://ugspace.ug.edu.gh

146
Sakyi, E. K., Azunu, R., & Bawole, J. N. (2011). Does Decentralization Lead to
Improvement in Planning of Health Services? Findings from Six District Health
Administrations in Ghana. Accessed from www.ugspace. On 28th December, 2015
Scott, Z. (2009). Decentralization, Local Development and Social Cohesion: An Analytical
Review, GSDRC Research Paper.
Shin, R. (2001). Strategies for Economic Development under Decentralization: A
Transformation of the Political Economy. International Journal of Public
Administration, 24:10, 1083-1102.
Sjostrom, M. (2010). Evaluating the Economic Role of BC Local Governments. A Snapshot of
Community Effort and Opportunity. Victoria, Union of British Colombia
Municipalities.
Smoke, P. (2003). Decentralization in Africa: Goals, Dimensions, Myths and Challenges.
Journal of Public Administration and Development. 23, pp. 7–16.
Sosin, M. R. (2012). Decentralization, Devolution, Financial Shortfalls, and State Priorities in
Service Programmes in the Early 2000s: Journal of Public Administration Research
and Theory 22: 701-730.
Stren, R. & Gombay, C. (1994). The alleviation of urban poverty at the municipal level: a
review of the literature. Unpublished Report for the Urban Management Programme,
UNCHS (Habitat).
The 1992 Constitution of Ghana
The Ghana Statistical Service (2005). Ghana population Data Analysis. Report Vol. 2
Tiebout, C. M. (1956). A Pure Theory of Local Expenditures. The Journal of Political
Economy, 64(5):416–424. Chicago.
University of Ghana http://ugspace.ug.edu.gh

147
Tosun, M. S. & Yilmaz, S. (2010). Decentralization, Economic Development, and Growth in
Turkish Provinces. Emerging Markets Finance and Trade, 46:4, 71-91.
Townroe, P. M. (1979). The Design of Local Economic Development Policies. The Town
Planning Review, Vol. 50, No. 2, pp. 148-163.
Treisman, D. (2006). Explaining Fiscal Decentralization: Geography, Colonial History,
Economic Development and Political Institutions: Commonwealth & Comparative
Politics Vol. 44, No. 3, 289–325.
United Nations (2010). United Nations Millennium Campaign Strategy.
Vanderschueren, F., Wegelin, E. & Wekwete, K. (1996). Policy programme options for urban
poverty reduction. Policy Paper No. 20, Urban Management Programme, World Bank,
Washington DC.
Vazquez-Barguero, A. (2002). Endogenous Development: Networking, Innovation,
Institutions and Cities. Routledge publishing company, London
Wekwete, K (2014). Local Governments and Local Economic Development in South Africa.
Commonwealth Local Government Forum. South Africa.
Wong, C. (2002). Developing Indicators to Inform Local Economic development in England.
Urban Studies, Vol. 39, No. 10, 1833–1863, 2002
Xie, D., Zou, H. &Davoodi, H. (1999). Fiscal Decentralization and Economic Growth in the
United States. Journal of Urban Economics 45, 228–239.
Yamoah, A. B. (2007). The Effects of Fiscal Decentralization on Economic Growth in U.S.
Counties. Dissertation.
Yin, R. K. (1984). Case study research: Design and Methods. Beverly Hills. SAGE
Publications.
University of Ghana http://ugspace.ug.edu.gh
148
Yin, R. K. (1994). Case Study Research, Design Methods, 2nd Edition. In Boateng, R. (2014)
Research Made Easy. 1Ed. PearlRichards Foundation. Accra, Ghana.
Yin, R. K. (2003). Case Study Research: Design and Methods (3rd edition, volume 5). London:
Stage Publications.
Zhang, T. & Zou, H. (1998). Fiscal Decentralization, public spending, and economic growth
in China. Journal of Public Economics, 67, 221–240.
University of Ghana http://ugspace.ug.edu.gh

149
APPENDICES
APPENDIX ONE
Structured Questionnaire
University of Ghana
Research Questionnaire
I am undertaking a study, which seeks to examine “fiscal decentralization and local economic
development in Builsa North District”. This study is being conducted as part of my studies
towards Master’s Degree Programme in Public Administration. Results from this study will be
used primarily for research purposes and your responses will be treated confidentially.
I greatly appreciate your co-operation.
You can thick ( ) or provide your response in writing where applicable.
Section One: Biodata
1. Sex (a) Male (b) Female
2. What is your age? (a) 15-25yrs (b) 26-35yrs (c) 36-45yrs (d) 46 -55yrs (e) 56-65yrs (f)
66+
3. How long have you stayed in this District (a) 0-1 year (b) 2-5years (c) over 5years
4. Level of education (a) Uneducated (b) Primary education (c) JHS (D) SHS (e)
Tertiary (f) Non-formal
Section Two: Fiscal Decentralization
5. What are the main sources of revenue to the
Assembly………………………………………..
…………………………………………………………………………………………
………..
6. What is the extent of fiscal decentralization in the district with respect to revenue
generation, expenditure and fiscal autonomy as shown in the table below;
Select by ticking the options from the scale of 1 for poor to 4 for excellent
University of Ghana http://ugspace.ug.edu.gh

150
Question Poor Fair Good Excellent
a. Are the revenue sources viable
b. Is the revenue generated enough to meet
LED
c. The Assembly’s capacity to generate
revenue
d. Is IGF used for LED
e. Does central government control the
revenue and expenditure of the Assembly
Section Three: Local Economic Development
7. What factors contribute to LED
……………………………………………………..............
…………………………………………………………………………………………
…………………………………………………………………………………………
…………
8. To what extent has fiscal transfers and revenue to the assembly contributed to the
development of the following areas in the district?
Select by ticking the options from the scale of 1 for poor to 4 for excellent
Poor Fair Good Excellent
Question 1 2 3 4
a. The provision of school infrastructure
b. The present availability of Teachers
c. Education as a priority in the district
d. Access to health services in the District
e. The present availability of health facilities
(hospitals/ clinics)
9. a). What is your view about the future growth of businesses in the District?
(a) Optimistic (b) Pessimistic
b). Reasons…………………………………………………………………………
University of Ghana http://ugspace.ug.edu.gh

151
……………………………………………………………………………………………
10. With respect to District Assemblies’ contribution towards micro and small enterprise
development, how would you rate the performance of the Builsa North District
Assembly in the following areas?
Item Poor Fair Good Excellent
a. Entrepreneurial and managerial training for
MSE operators
b. Provision of road infrastructure
c. Business licensing or granting of operating
permits
d. Electricity supply
e. Water supply
f. Telecommunication
g. Disposal of industrial solid waste
h. Establishment of industrial zones or business
centres
i. Provision of market infrastructure
j. Promoting dialogue with the business
community
k. Provision of financial services to MSEs
l. Tax administration
11. With respect to District Development planning and management, how would you rate
the involvement or participation of MSE operators in the following areas?
Activity Poor Fair Good Excellent
a. Community diagnosis
b. Preparation of community action plans
c. Public hearing on draft district development
plans
d. Fee fixing resolution
e. Local economic development platforms
University of Ghana http://ugspace.ug.edu.gh

152
f. Local economic development Action planning
session
g. Implementation of local economic
development action plans
Section Four: Constraints of LED
12. What are the main challenges faced by the Assembly in implementing LED (a) Funds
(b) Skilled Personnel (c) Strategies/ plans (d) lack of cooperation (e) Others please
specify……………………………………………………………………………………
……………………………………………………………………………………………
………………
13. State three key factors that constrain local enterprise growth and development in the District.
……………………………………………………………………………………………
……………………………………………………………………………………………
……………………………………………………………………………………………
…………………………………………………………………………………
14. What socio-cultural factors constrain business development in the district?
………………………………………………………………………..
15. How does each of these socio-cultural factors constrain business development in the
district?
.............................................................................................................................................
............
..........................................................................................................................................
..........................................................................................................................................
..........................................................................................................................................
16. What socio-cultural factors enable business development in the district?
………………………………………………………………………..
17. How do those factors identified in 17 above promote business development?……
………………………………………………………………………………………...
………………………………………………………………………………………..
18. State three enabling factors for local enterprise growth and development in the district
……………………………………………………………………………………………
……………………………………………………………………………………………
………………
University of Ghana http://ugspace.ug.edu.gh

153
19. With your experience in business, assess the general environment for doing business in
your district. (a) Poor (b) Fair (c) Good (d) Excellent
Part Five: Actors of LED and Their Roles
20. Who is/are the agent(s) of the programme in the District? (a). District Assembly (b) NGO
(c)Rural Enterprise Unit (d)Individuals (e) Other………………………………
21. Mention some actors and/or organizations involved in the LED activities…………
…………………………………………………………………………………………
…………………………………………………………………………………………
………
22. Please rate the contribution of the following departments or organisations to the growth
and development of micro and small enterprises in your district.
Organisation/ Institutions Poor Fair Good Excellent
a. District planning and coordinating unit
(DPCU)
b. National Board for small –scale industries
c. Department of community development
d. NGOs
e. Ministry of food and Agriculture
f. Other (specify)
23. Please using a scale of 1 -poor, 2- fair, 3 -good, 4-excellent; rank the following institutions
against the major activities.
Institutions Capacity
building/
Training
Infrastructure
provision
Financial
support to
SMEs
Technical
support to
SME
a. District
Assembly
b. NGOs
c. Individuals
University of Ghana http://ugspace.ug.edu.gh

154
24. How has the content met the needs of the beneficiaries (a) Created employment (b)
Built capacity of local people (c) Reduced Poverty/Unemployment (d) Improved
infrastructure (road network, schools, clinics, water etc.) (e) Manufacturing of local
commodity
25. What development projects have been initiated since LED programme/policies were
introduced? (a) Schools (b) market structures (c) roads (d) local Skills training (e)
Other……………………………………………………..
26. What roles does the assembly play in contributing to LED?
……………………………………………………………………………………………
……………………………………………………………………………………………
……………………………………………………………………………………………
……………………………………………………………………………………………
…………………...
University of Ghana http://ugspace.ug.edu.gh

155
APPENDIX TWO
Interview Guide
Interview Guide for Local Staff and Participants
in LED Programme
FD
1. How is the current state of fiscal decentralization in Ghana?
2. What are the factors militating against effective implementation of fiscal
decentralization in Ghana?
3. Does the Assembly depend on their own generated revenue?
4. How autonomous is the Assembly in taking fiscal policies?
LED
5. Do Government transfers have any impact on education, health, markets, roads, local
enterprise development? If yes, in what ways?
6. What are the interventions in relation to fiscal transfers within the district that enhances
enrolment, Health delivery, capacity building, and businesses?
7. Does FD have any impact on employment (Creation of jobs) in the District? Name them
8. What are the major activities engaged in by the Assembly to create jobs for the people
within the district?
9. What are the major activities of the assembly that promote local enterprises?
10. What can be done in the short to medium term with local resources to promote growth
and competitiveness of the actors, economic sectors and the local economy as a
whole?
Constrains
11. What challenges/constraints do the Assembly encounter in promoting LED
Programmes?
University of Ghana http://ugspace.ug.edu.gh
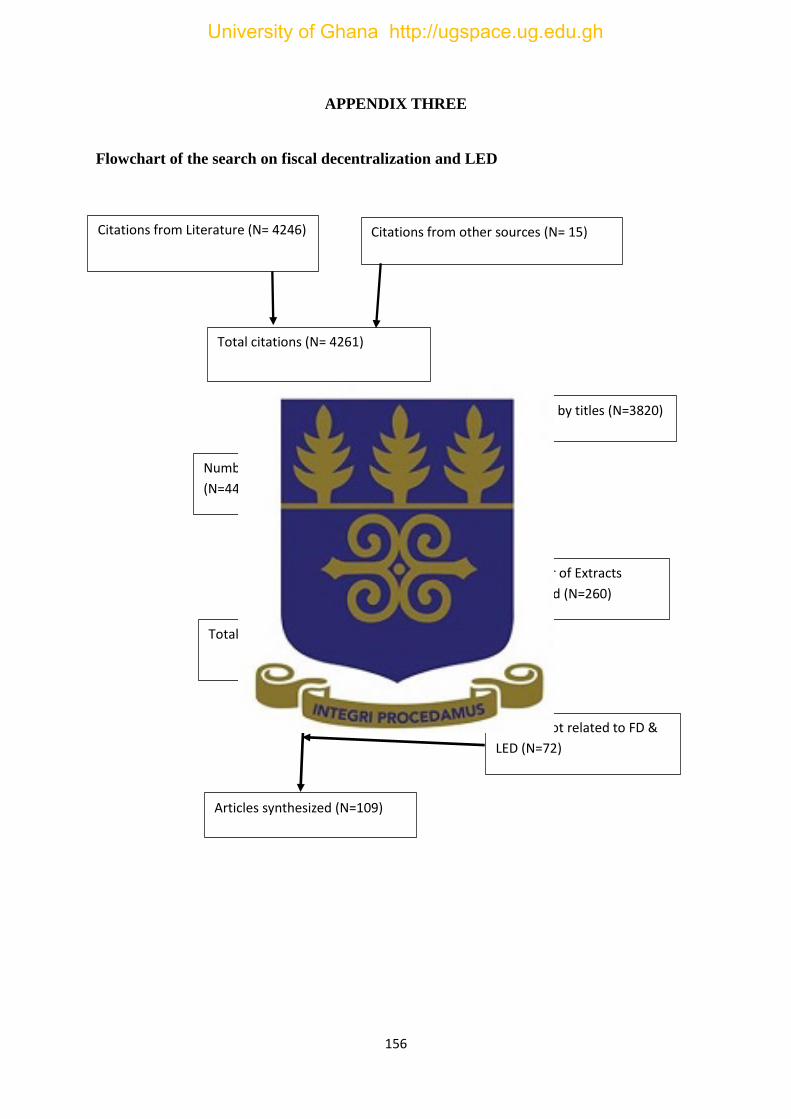
156
APPENDIX THREE
Flowchart of the search on fiscal decentralization and LED
APPENDIX FOUR
Articles not related to FD &
LED (N=72)
Citations from Literature (N= 4246) Citations from other sources (N= 15)
Articles synthesized (N=109)
Number of Extracts
excluded (N=260)
Total citation screened (N= 181)
Excluded by titles (N=3820)
Number of citations remaining
(N=441)
Total citations (N= 4261)
University of Ghana http://ugspace.ug.edu.gh

157
Table of Sub-Metropolitan Councils
Sub-Metropolitan District Council under Respective Metropolitan Assemblies
Accra Metro
Assembly
Kumasi
Metro
Assembly
Secondi –
Takoradi Metro
Assembly
Tema
Metro
Assembly
Tamale
Metro
Assembly
Cape
Coast
Metro
Assembly
11 10 4 3 3 2
Okaikoi
South
Asokwa Sekondi Tema West Tamale
central
Cape
Coast
South
Okaikoi
North
Bantama Takoradi Tema East Tamale
North
Cape
Coast
North
Ashiedu
Keteke
Manhyia Effiakwasimintsim Kppone-
Katamanso
Tamale
South
Ablekuma
North
Subin EssikadoKentan
Ablekuma
South
Oforikrom
Ayawaso
Central
Tafo-
Pankrono
Ayawaso
East
Nhyiaeso
Ayawaso
West
Kwadaso
AbosseyOkai Suame
La Asawase
Osu Clottey
Source: Compiled from Composite Budgets of AMA, KMA, STMA, TMA, TAMA, CCMA
(2014)
University of Ghana http://ugspace.ug.edu.gh
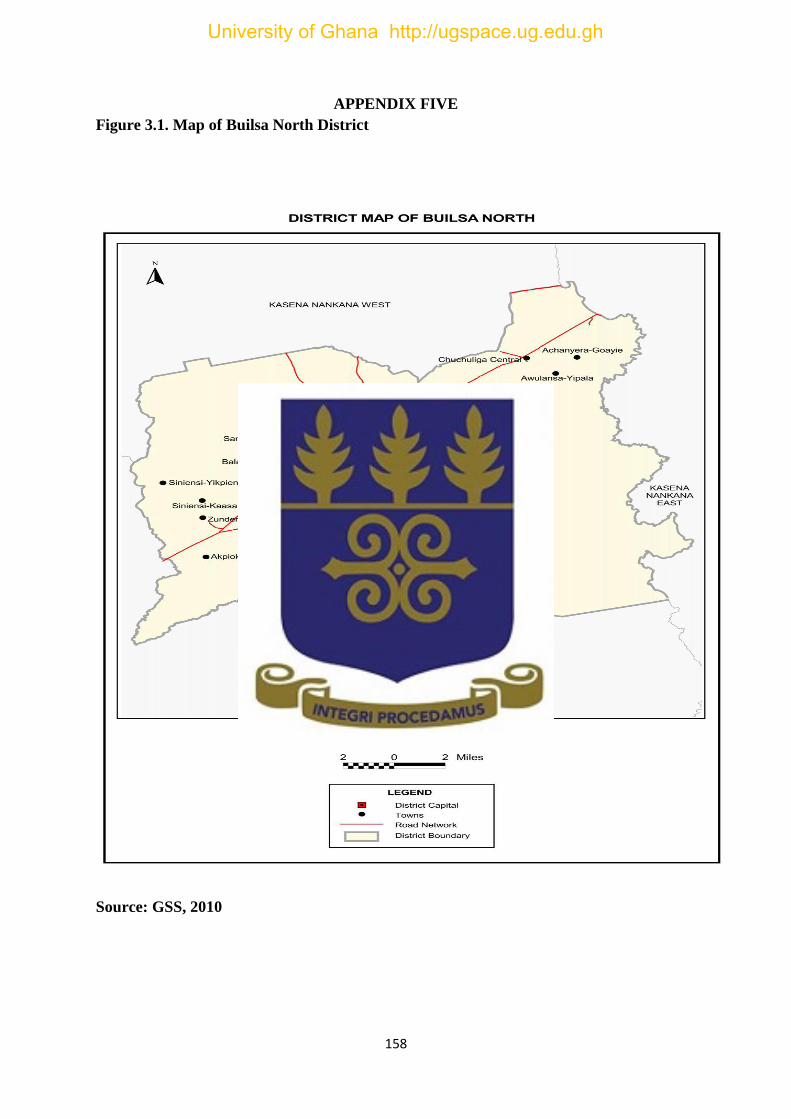
158
APPENDIX FIVE
Figure 3.1. Map of Builsa North District
Source: GSS, 2010
University of Ghana http://ugspace.ug.edu.gh