Fiscal Decentralisation in Philippines
56
FISCAL DECENTRALIZATION IN THE PHILIPPINES
-
Upload
united-nations-human-settlements-programme-un-habitat -
Category
Documents
-
view
228 -
download
1
Transcript of Fiscal Decentralisation in Philippines

8/12/2019 Fiscal Decentralisation in Philippines
http://slidepdf.com/reader/full/fiscal-decentralisation-in-philippines 1/56
FISCALDECENTRALIZATIONIN THE PHILIPPINES

8/12/2019 Fiscal Decentralisation in Philippines
http://slidepdf.com/reader/full/fiscal-decentralisation-in-philippines 2/56
8/12/2019 Fiscal Decentralisation in Philippines
http://slidepdf.com/reader/full/fiscal-decentralisation-in-philippines 3/56
Sec1:iii
United Nations Human Settlements ProgrammeNairobi 2011
FISCAL DECENTRALIZATIONIN THE PHILIPPINES
8/12/2019 Fiscal Decentralisation in Philippines
http://slidepdf.com/reader/full/fiscal-decentralisation-in-philippines 4/56
iv
Te Global Urban Economic Dialogue Series
Fiscal Decentralisation in Philippines
First published in Nairobi in 2011 by UN-HABIA.Copyright © United Nations Human Settlements Programme 2011
All rights reservedUnited Nations Human Settlements Programme (UN-HABIA)P. O. Box 30030, 00100 Nairobi GPO KENYAel: 254-020-7623120 (Central Office)
www.unhabitat.org
HS/129/11EISBN Number(Series): 978-92-1-132027-5ISBN Number(Volume): 978-92-1-132414-3
Disclaimer
Te designations employed and the presentation of the material in this publication donot imply the expression of any opinion whatsoever on the part of the Secretariat of
the United Nations concerning the legal status of any country, territory, city or areaor of its authorities, or concerning the delimitation of its frontiers of boundaries.
Views expressed in this publication do not necessarily reflect those of the UnitedNations Human Settlements Programme, the United Nations, or its Member States.
Excerpts may be reproduced without authorization, on condition that the source is indicated.
Acknowledgements:
Director: Oyebanji Oyeyinka
Principal Editor and Manager: Xing Quan Zhang
Principal Author: Gilberto M. Llanto
English Editor: Roman Rollnick
Design and Layout: Peter Cheseret

8/12/2019 Fiscal Decentralisation in Philippines
http://slidepdf.com/reader/full/fiscal-decentralisation-in-philippines 5/56
v
U r b a n i z a t i o n
is one of themost powerful,irreversible forcesin the world. Itis estimated that93 percent ofthe future urbanpopulation growth
will occur in thecities of Asia and
Africa, and to a lesser extent, Latin Americaand the Caribbean.
We live in a new urban era with most ofhumanity now living in towns and cities.
Global poverty is moving into cities, mostlyin developing countries, in a process we callthe urbanisation of poverty .
Te world’s slums are growing and growingas are the global urban populations. Indeed,this is one of the greatest challenges we face inthe new millennium.
Te persistent problems of poverty andslums are in large part due to weak urbaneconomies. Urban economic development isfundamental to UN-HABIA’s mandate.Cities act as engines of national economicdevelopment. Strong urban economies
are essential for poverty reduction and the
provision of adequate housing, infrastructure,
education, health, safety, and basic services.
Te Global Urban Economic Dialogue seriespresented here is a platform for all sectorsof the society to address urban economicdevelopment and particularly its contributionto addressing housing issues. Tis work carriesmany new ideas, solutions and innovativebest practices from some of the world’sleading urban thinkers and practitioners
from international organisations, nationalgovernments, local authorities, the privatesector, and civil society.
Tis series also gives us an interestinginsight and deeper understanding of the widerange of urban economic development andhuman settlements development issues. It willserve UN member States well in their questfor better policies and strategies to address
increasing global challenges in these areas
Joan ClosUnder-Secretary-Generalof the United Nations,
Executive Director, UN-HABIA
FOREWORD

8/12/2019 Fiscal Decentralisation in Philippines
http://slidepdf.com/reader/full/fiscal-decentralisation-in-philippines 6/56
vi

8/12/2019 Fiscal Decentralisation in Philippines
http://slidepdf.com/reader/full/fiscal-decentralisation-in-philippines 7/56
CONTENTS
FOREWORD III
CONTENTS IV
CHAPTER 1 INTRODUCTION 1
Objective of the Report 2
CHAPTER 2 THE CONCEPT AND ELEMENTS OF FISCALDECENTRALIZATION 5
Oates decentralization theorem 5
An adequate enabling policy environment 7
CHAPTER 3 TAX-EXPENDITURE ASSIGNMENT 11
Local government tax revenues: trend and composition,
1989-2009 11
Local government expenditures: trend and composition,
1989-2003 19
CHAPTER 4 INTERGOVERNMENTAL FISCAL TRANSFERS 31
Instruments of intergovernmental fiscal transfers 31
Designing fiscal transfers 31
Philippine internal revenue allotment 33
Distributable resource pool 36
Distributive and allocative formula 38
CHAPTER 5 LOCAL GOVERNMENT FINANCING48 40
CHAPTER 6 CONCLUSIONS AND RECOMMENDATIONS 43
BIBLIOGRAPHY 44
8/12/2019 Fiscal Decentralisation in Philippines
http://slidepdf.com/reader/full/fiscal-decentralisation-in-philippines 8/56
viii
FISCAL DECENTRALIZATION IN THE PHILIPPINES
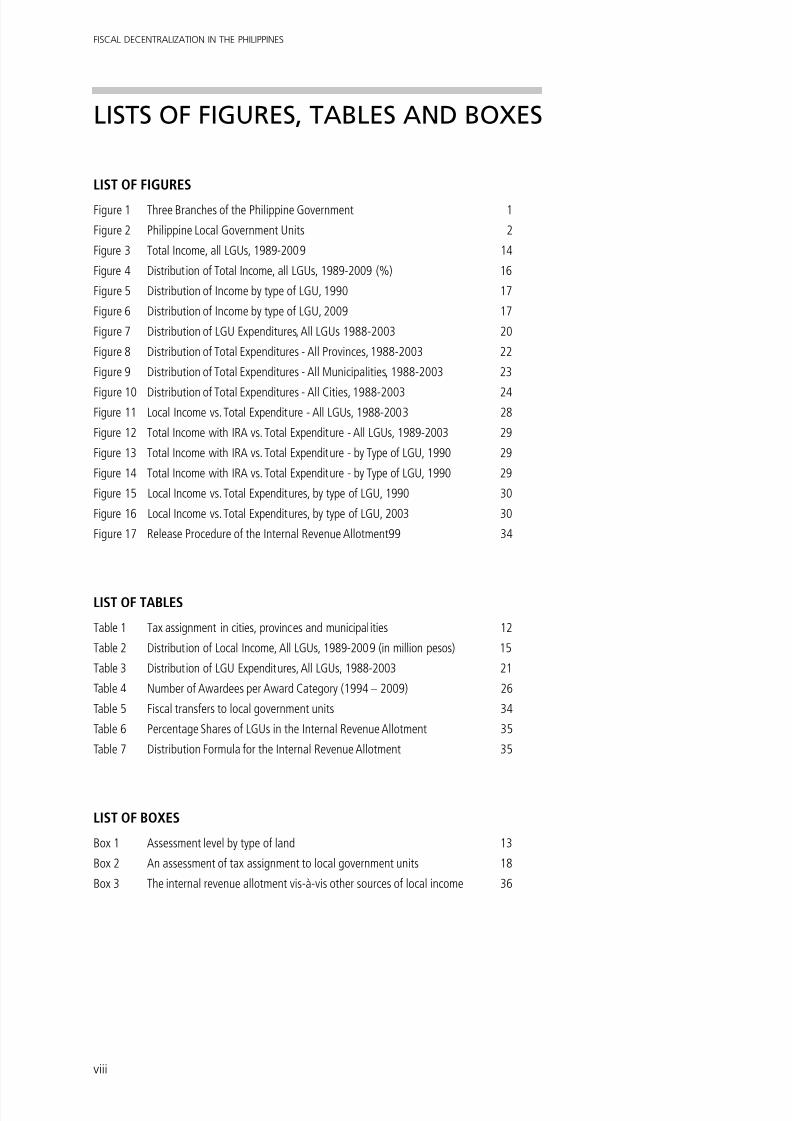
LISTS OF FIGURES, TABLES AND BOXES
LIST OF FIGURES
Figure 1 Three Branches of the Philippine Government 1
Figure 2 Philippine Local Government Units 2
Figure 3 Total Income, all LGUs, 1989-2009 14
Figure 4 Distribution of Total Income, all LGUs, 1989-2009 (%) 16
Figure 5 Distribution of Income by type of LGU, 1990 17
Figure 6 Distribution of Income by type of LGU, 2009 17
Figure 7 Distribution of LGU Expenditures, All LGUs 1988-2003 20
Figure 8 Distribution of Total Expenditures - All Provinces, 1988-2003 22
Figure 9 Distribution of Total Expenditures - All Municipalities, 1988-2003 23
Figure 10 Distribution of Total Expenditures - All Cities, 1988-2003 24Figure 11 Local Income vs. Total Expenditure - All LGUs, 1988-2003 28
Figure 12 Total Income with IRA vs. Total Expenditure - All LGUs, 1989-2003 29
Figure 13 Total Income with IRA vs. Total Expenditure - by Type of LGU, 1990 29
Figure 14 Total Income with IRA vs. Total Expenditure - by Type of LGU, 1990 29
Figure 15 Local Income vs. Total Expenditures, by type of LGU, 1990 30
Figure 16 Local Income vs. Total Expenditures, by type of LGU, 2003 30
Figure 17 Release Procedure of the Internal Revenue Allotment99 34
LIST OF TABLES
Table 1 Tax assignment in cities, provinces and municipalities 12
Table 2 Distribution of Local Income, All LGUs, 1989-2009 (in million pesos) 15
Table 3 Distribution of LGU Expenditures, All LGUs, 1988-2003 21
Table 4 Number of Awardees per Award Category (1994 – 2009) 26
Table 5 Fiscal transfers to local government units 34
Table 6 Percentage Shares of LGUs in the Internal Revenue Allotment 35
Table 7 Distribution Formula for the Internal Revenue Allotment 35
LIST OF BOXES
Box 1 Assessment level by type of land 13
Box 2 An assessment of tax assignment to local government units 18
Box 3 The internal revenue allotment vis-à-vis other sources of local income 36
8/12/2019 Fiscal Decentralisation in Philippines
http://slidepdf.com/reader/full/fiscal-decentralisation-in-philippines 9/56
1
CHAPTER 1INTRODUCTION
CHAPTER 1 INTRODUCTION
Many developing countries, the Philippinesincluded, have embarked on a major shiftin policy and approach to developmentby decentralizing and devolving centralgovernment powers, functions andresponsibilities to local government units.1 In 1991, the Philippine Congress enacted theLocal Government Code, which devolved to
local government units the great responsibilityof providing the local populace with a rangeof basic public goods and services.
Te Philippines has a presidential unitarygovernment system. Te national governmenthas three independent branches, namely, theexecutive, the legislature, and the judiciary.Te executive is headed by a popularly electedpresident. Te executive branch is functionally
organized into sectoral departments, eachheaded by a cabinet secretary appointed bythe president. Te legislature, or Congress, is
1 In the Philippines, these comprise provinces, cities andmunicipalities. In other countries, these local government unitsare commonly known as sub-national governments or sub-national units. Throughout this paper, I retain the conventionalterm used in the Philippines, namely “local government units”(LGUs).
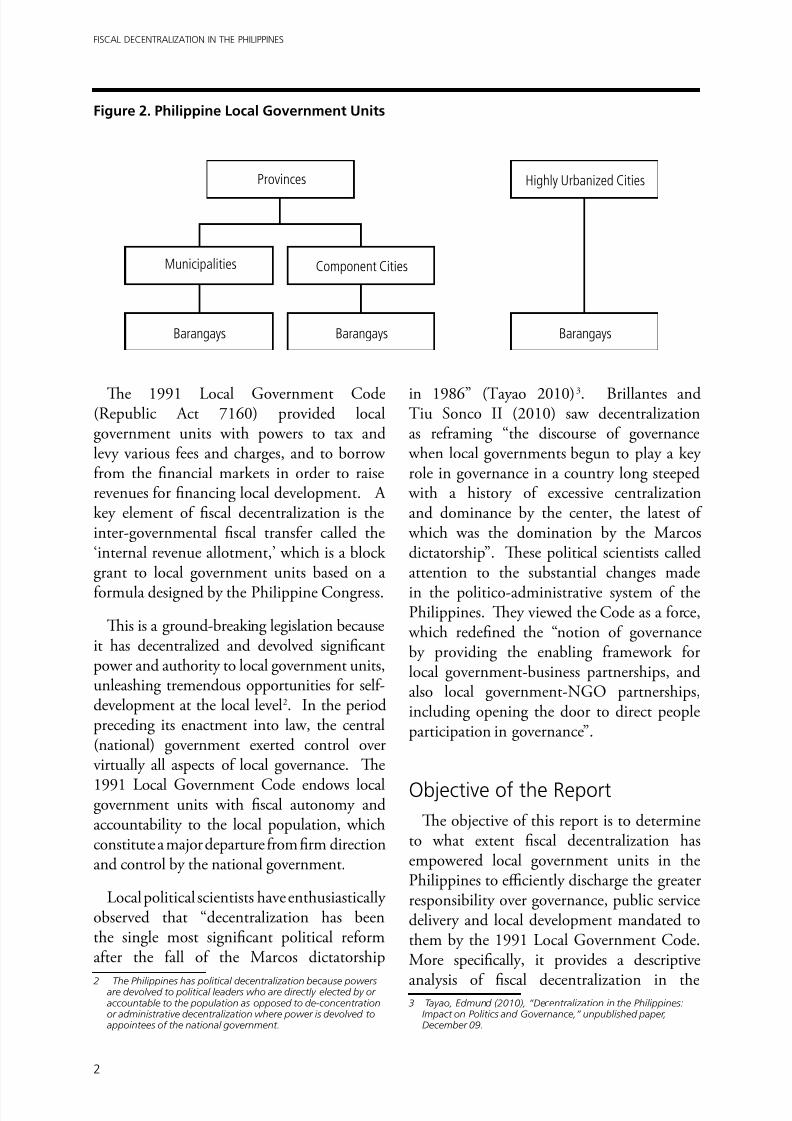
bicameral and is composed of the Senate andthe House of Representatives. Senators arenationally elected while representatives areelected by legislative districts. Te judiciary iscomposed of the Supreme Court and the lowercourts. As of 2011. the political subdivisionsare the 80 provinces, 138 cities, 1, 496municipalities, and 41, 945 barangays. Tey
are collectively referred to as local governmentunits. Te barangay is the lowest tier of localgovernance. A group of barangays comprisea municipality. Te more urbanized anddeveloped barangays comprise a city. Tereare two types of cities: (a) highly urbanized,
which is independent of the province, and(b) component cities (smaller cities). Acluster of municipalities or municipalitiesand component cities, comprise a province.
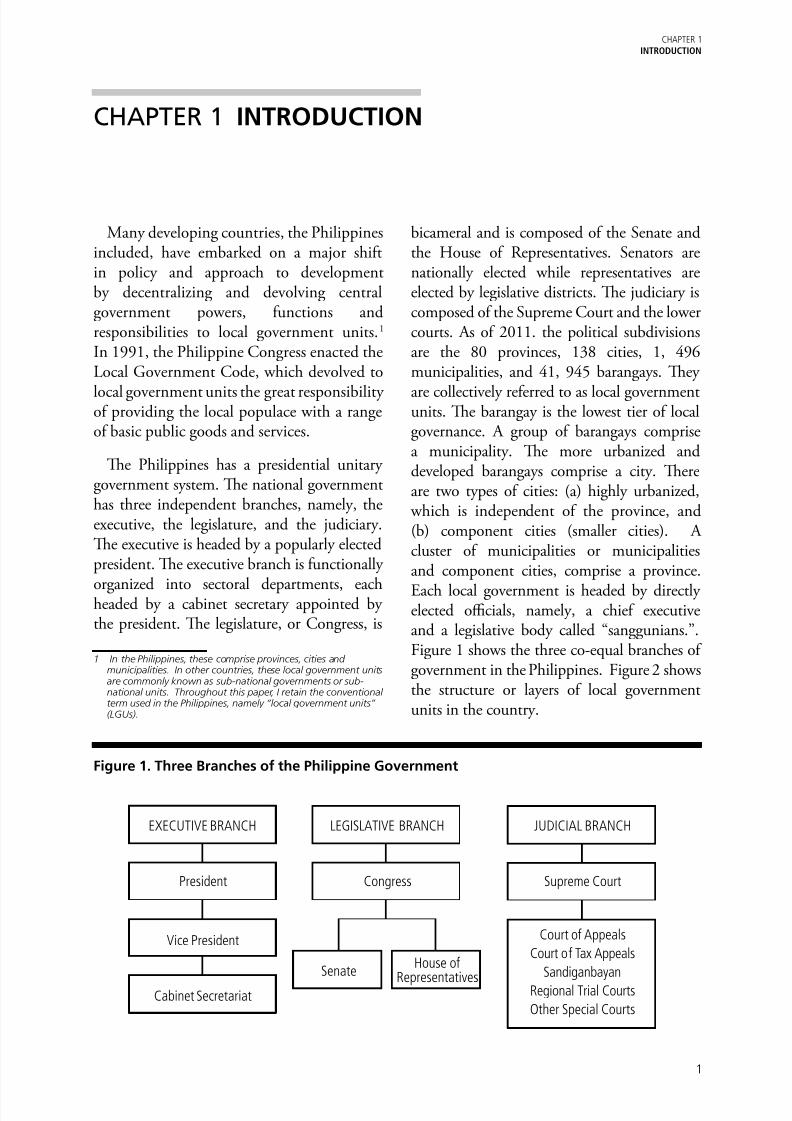
Each local government is headed by directlyelected officials, namely, a chief executiveand a legislative body called “sanggunians.”.Figure 1 shows the three co-equal branches ofgovernment in the Philippines. Figure 2 showsthe structure or layers of local governmentunits in the country.
Figure 1. Three Branches of the Philippine Government
EXECUTIVE BRANCH
President
Vice President
Cabinet Secretariat
LEGISLATIVE BRANCH
Congress
SenateHouse of
Representatives
JUDICIAL BRANCH
Supreme Court
Court of Appeals
Court of Tax Appeals
Sandiganbayan
Regional Trial Courts
Other Special Courts
8/12/2019 Fiscal Decentralisation in Philippines
http://slidepdf.com/reader/full/fiscal-decentralisation-in-philippines 10/56
2
FISCAL DECENTRALIZATION IN THE PHILIPPINES
Provinces
Municipalities
BarangaysBarangays
Highly Urbanized Cities
Component Cities
Figure 2. Philippine Local Government Units
Te 1991 Local Government Code(Republic Act 7160) provided localgovernment units with powers to tax andlevy various fees and charges, and to borrowfrom the financial markets in order to raiserevenues for financing local development. Akey element of fiscal decentralization is theinter-governmental fiscal transfer called the‘internal revenue allotment,’ which is a blockgrant to local government units based on a
formula designed by the Philippine Congress.
Tis is a ground-breaking legislation becauseit has decentralized and devolved significantpower and authority to local government units,unleashing tremendous opportunities for self-development at the local level2. In the periodpreceding its enactment into law, the central(national) government exerted control overvirtually all aspects of local governance. Te
1991 Local Government Code endows localgovernment units with fiscal autonomy andaccountability to the local population, whichconstitute a major departure from firm directionand control by the national government.
Local political scientists have enthusiasticallyobserved that “decentralization has beenthe single most significant political reformafter the fall of the Marcos dictatorship
2 The Philippines has political decentralization because powersare devolved to political leaders who are directly elected by oraccountable to the population as opposed to de-concentrationor administrative decentralization where power is devolved toappointees of the national government.
in 1986” (ayao 2010)3. Brillantes andiu Sonco II (2010) saw decentralizationas reframing “the discourse of governance
when local governments begun to play a keyrole in governance in a country long steeped
with a history of excessive centralizationand dominance by the center, the latest of
which was the domination by the Marcosdictatorship”. Tese political scientists calledattention to the substantial changes made
in the politico-administrative system of thePhilippines. Tey viewed the Code as a force,
which redefined the “notion of governanceby providing the enabling framework forlocal government-business partnerships, andalso local government-NGO partnerships,including opening the door to direct peopleparticipation in governance”.
Objective of the ReportTe objective of this report is to determine
to what extent fiscal decentralization hasempowered local government units in thePhilippines to efficiently discharge the greaterresponsibility over governance, public servicedelivery and local development mandated tothem by the 1991 Local Government Code.More specifically, it provides a descriptive
analysis of fiscal decentralization in the 3 Tayao, Edmund (2010), “Decentralization in the Philippines:
Impact on Politics and Governance,” unpublished paper,December 09.
Barangays

8/12/2019 Fiscal Decentralisation in Philippines
http://slidepdf.com/reader/full/fiscal-decentralisation-in-philippines 11/56
3
CHAPTER 1INTRODUCTION
Philippines. It focuses on local governmentfiscal policies and inter-governmental fiscaltransfer and identifies local finance policyreform issues, which policy makers shouldaddress to enable local government units to
improve their local revenue-raising effort.4 Te inability to raise adequate local revenues isat the core of the problem of local governmentunits in delivering local public services. Areason behind this is the inadequate taxingpowers assigned to local government units,resulting in a vertical fiscal imbalance, whichoccurs when the central government retainscontrol over major sources of tax revenues.
Te intergovernmental fiscal transfercalled the internal revenue allotment (IRA)significantly supplements or covers theinadequacy in local revenue collection. Teallocation or distribution formula for theinternal revenue allotment stands a close reviewand improvement even as it has become themost important source of revenue for manylocal government units, especially the poorermunicipalities. Te irony is that the internal
revenue allotment may have had a disincentiveeffect on local effort to raise revenues, makingmany local government units dependent on itfor funding local development and services.Te distribution formula for the IRA shouldbe improved but Philippine local governmentunits must exert effort to raise local revenuesbecause failure to do so results in inefficientlocal service delivery and diminishedaccountability. Te IRA received by local
government units has not been adequateenough to finance comprehensive servicedelivery and local development programs.
A case can also be made about the need forlocal government units to improve local publicexpenditure management. Under-spendingon vital local public goods and servicesaffects the level of welfare of households and
4 In the Philippines, sub-national governments are called “local
government units” (LGUs), which are comprised of provinces,municipalities, cities and “barangays.” Barangays are the
smallest political unit headed by a local elective officer called“barangay captain.” Municipalities and cities are comprised of
several barangays , respectively.
negates the advantages given to decentralizedregimes of better local service delivery arisingfrom closer matching of public services withlocal preferences and greater efficiency in theprovision of public goods. A recent paper by
Llanto and Quimba (2010) provides someempirical evidence that there has not beena significant improvement in the deliveryof health and education services despitedevolution5. Teir empirical analysis seems toindicate that decentralization has not resultedin an improvement in the delivery of localservices, contrary to the popular notion, whichtends to be based on anecdotal evidence.
Te report is organized as follows. oprovide context to the discussion, Section 2provides a brief review of the concept of fiscaldecentralization and its elements based onrecent literature. Section 3 discusses the tax-expenditure assignment at the local level. Itfirst discusses the structure and compositionof local tax revenues, fees and charges andthen describes the pattern of local governmentspending with focus on health and education,
major expenditure items for which data aremore readily available. A key finding is thepresence of an inefficient tax-expenditureassignment, which has constrained theenvisaged development of local areas by localpeople utilizing local resources. Tis confirmsearlier findings of Manasan (2007) who founda mismatch between revenue resources andexpenditure needs of the various levels of localgovernment.
An issue overlooked by many localresearchers is the need for local governmentunits to exert more effort to improve localexpenditure management. Te findings ofLlanto and Quimba (2010) show that manyLGUs have been under-spending, which pointouts out the need for more efficient localexpenditure management. Te key messageof this section is the importance of providing
5 Llanto, Gilberto M. and Francis Quimba (2010),“Decentralization and Local Service Delivery,” paper preparedfor the Local Government Foundation, unpublished.
8/12/2019 Fiscal Decentralisation in Philippines
http://slidepdf.com/reader/full/fiscal-decentralisation-in-philippines 12/56
4
FISCAL DECENTRALIZATION IN THE PHILIPPINES
local government units with ample powerand authority to raise the necessary revenuesto finance local development but at the sametime, local government units must exert utmosteffort in improving local public expenditure
management. It is commonplace to hear invarious forums in the country complaintsabout the inadequacy of local resources toaddress various development challenges.Llanto and Quimba (2010) indicate that thereis room for improving service delivery evenunder a regime of constrained resources.
Section 4 analyzes intergovernmental fiscaltransfers, basically the major block fiscal
grant called the “Internal Revenue Allotment(IRA).” Te IRA is the single biggest revenueitem for many LGUs and the section points outoutstanding issues affecting the efficacy of thisfiscal tool for helping with local development.Popular discourse on this topic inevitablygravitates around suggestions to increase theIRA from its current share of 40% of nationalinternal revenue taxes to 50 percent and even60 percent with apparent disregard about the
implications of the suggestion to the financingof the country’s overall national developmentagenda. Tere is a need for an in-depthresearch and analysis of the Philippineexperience with intergovernmental fiscal
transfers, which cover both conditional andunconditional fiscal grants. Te biggest part ofthe fiscal transfers is composed of the internalrevenue allotment. Te current discourse andproposals to increase the amount of the IRA,
and at the same time change the formula for itsdistribution has to be enlightened by findingsof systematic research and study that has yet tobe undertaken. Policy makers cannot simplyrely on the narrow metric of politics to decideon this significant issue. Tere is a cryingneed to produce an evidence-based policyrecommendation on how to improve the useof this important fiscal tool.
Section 5 summarizes the status of localgovernment units’ access to developmentcapital and identifies areas for policy reform.It looks at the outstanding constraints toaccess to the capital markets and officialdevelopment assistance and sketches pathwaysto reform6. Te final section pulls together thefindings in preceding sections, and draws someconclusions and policy recommendations.
6 The major issues on access to capital markets were first presented and analyzed in Llanto, Gilberto M., and others(1998), Local Government Units’ Access to the Private CapitalMarkets, Makati City: Philippine Institute for DevelopmentStudies. Some of those issues have been resolved, many othershave remained outstanding.
8/12/2019 Fiscal Decentralisation in Philippines
http://slidepdf.com/reader/full/fiscal-decentralisation-in-philippines 13/56
5
CHAPTER 2THE CONCEPT AND ELEMENTS OF FISCAL DECENTRALIZATION
CHAPTER 2 THE CONCEPT AND ELEMENTS OFFISCAL DECENTRALIZATION7
Oates decentralization theorem
A working definition of decentralizationis that by Faguet (2005) who defines it as“the devolution by central, (that is, national)government of specific functions, with all ofthe administrative, political and economic
attributes that these entail, to democraticlocal (i.e. municipal) governments which areindependent of the center within a legallydelimited geographic and functional domain”.
A common denominator behind policymakers’ decision to decentralize and devolve isthe belief that this paradigm shift can improvethe allocation problem in the economy,improve productive efficiency and bring aboutbetter cost recovery. In the last two decades,
decentralization has been at “the center stageof policy experiments in a large number ofdeveloping and transition economies in Latin
America, Africa and Asia” (Bardhan 2003,page 1) for a number of reasons. For example,a motivation for decentralization in Latin
America was the disenchantment with militaryrule and dictatorships, which has created apolitical culture that places a premium ondecentralized decision making to prevent a
return to the past. In China, decentralization was seen as a means for social cohesion,faster economic growth and preservation ofcommunist party rule (Shah, 1997).
In the Philippines, the enactment into lawof the Local Government Code in October10, 1991, which decentralized and and
7 The brief review of literature partly draws from GilbertoM. Llanto, “Decentralization, Local Finance Reforms and
New Challenges: The Philippines,” a paper presented at theThird Symposium on Decentralization and Local Finance atthe Institute for Comparative Studies in Local Governance(COSLOG), National Graduate Institute for Policy Studies, Tokyo,
Japan on March 10, 2009.
devolved vast powers to local governmentunits, introduced a significant shift in thepolicy and institutional framework fordevelopment. In their review of Philippinedecentralization, local scholars (Brillantesand iu, 2010; ayao, 2010) noted thatthe Philippine political and administrative
system has been dominated by the centralgovernment since the time of the Spanishcolonization. A long history of centralizationmeant that policies, programs, funding,allocation of resources, etc were controlledand implemented by the central governmentsituated in Manila (somewhat derisivelycalled “imperial Manila”). Tus, 1991 LocalGovernment Code (Republic Act No. 7160)
was a critical break point in the country’s
political and administrative framework. In hisreading of recent Philippine political history,ayao (2010) called decentralization as “singlemost significant political reform after the fallof the Marcos dictatorship in 1986.”
Te thinking behind this is that greaterinvolvement of LGUs or sub-national unitsin service provision, including the provisionof basic infrastructure such as local roads,
farm-to-market roads, communal irrigationfacilities, among others, will result in betterservice delivery and accountability, provideopportunities for people participationin development, and create an enablingenvironment for local private sectorinvestments.
Proponents of decentralization claim that ithas provided a framework for responsive and
accountable local governance. According toBird (1993) it has given local constituents whatthey want and are willing to pay for, and the
8/12/2019 Fiscal Decentralisation in Philippines
http://slidepdf.com/reader/full/fiscal-decentralisation-in-philippines 14/56
6
FISCAL DECENTRALIZATION IN THE PHILIPPINES
opportunity for greater local responsivenessand political participation. It has demonstrateda potential to lead to more appropriate andbetter-utilized facilities, lower costs per unitof service and improved operations and
maintenance (Klugman 1994)8. Devolutionis based on the subsidiarity principle andrests on the view that it results in improvedefficiency in the delivery of public services, andhence a more efficient allocation of resourcesin the economy (Dabla-Norris 2006)9. Tisperspective draws from the classic distinctiongiven by Musgrave about the different tasksof government in an economy: allocation(which is better done by local governments),
stabilization and redistribution (which arebetter done by central government).
Tese views echo the decentralization theorem(Oates,1972, page 55), which maintains that“each public service should be provided by the
jurisdiction having control over the minimumgeographical area that would internalizebenefits and costs of such provision.” Oates(1993) later observes that decentralization is a
mechanism to make policy more responsive tolocal needs and to involve the local populacein processes of democratic governance10. Teeconomic case for decentralization is theenhancement of efficiency that it introducesbecause locally provided public goods,
which are more responsive to local taste andpreferences are superior to centrally determinedgoods. Decentralization provides for “tailoringlevels of consumption to the preferences of
smaller, more homogeneous groups” (Wallisand Oates 1988, page 5). Decentralizationhas laid down the foundation of a new, major“institutional framework” for the provisionof a range of benefits to local constituents
8 However, according to Klugman (1994) greater efficiency neednot necessarily accompany decentralization, given the risk ofloss of economies of scale, duplication and overlap.
9 Shah (2004) points out that the principle of subsidiaritywas introduced by the Maastricht Treaty for assignment ofresponsibilities among members of the European Union.
According to this principle, taxing, spending and regulatoryfunctions should be exercised by the lowest levels of
government unless a convincing case can be made for assigningthe same to higher levels of government.
10 While a discussion of the opposing views may be interesting,this paper will not dwell on it because it is outside the scopeand objectives of the paper.
and the harnessing of local energy for localdevelopment, which could make governmentsto be “more responsive and efficient;” at thesame time decentralization offers a practicalavenue for “diffusing social and political
tensions and ensuring local cultural andpolitical autonomy” (Bardhan 2003, page 1).
Joumard and Kongsrud (2003) add that itcan strengthen the democratic process, allowgovernments to tailor the supply of publicgoods to local preferences and introduce somecompetition across jurisdictions, thus raisingpublic sector efficiency. At the same time, itmust be recognized that it can entail efficiency
losses, and make it difficult to implementredistributive policies and complicatemacroeconomic management (ibid). Acontrarian view is that “decentralization mayincrease the participation of people at thelocal level but sometimes it is only a smallprivileged elite group who get to participate”(Conyers 1990, page 18) quoted by Oates(1993). Faguet (2005) pointing out that thereis little agreement concerning the effects of
decentralization in the empirical literature,says that pessimists argue local governmentsare too susceptible to elite capture, and toolacking in technical, human and financialresources, to produce a heterogeneous rangeof public services that are both reasonablyefficient and responsive to local demand.
For political decentralization to beeffective, it should be accompanied by
fiscal decentralization. Many years ago in apaper prepared for the World Bank AnnualConference on Development Economics,anzi (1996) observed that decentralization offiscal activities can improve the allocation ofpublic spending by making it more consistent
with local preferences. Oates (1996) cites thepotential contribution of decentralization inenhancing allocative efficiency by providinga menu of local outputs that reflects the
8/12/2019 Fiscal Decentralisation in Philippines
http://slidepdf.com/reader/full/fiscal-decentralisation-in-philippines 15/56
7
CHAPTER 2THE CONCEPT AND ELEMENTS OF FISCAL DECENTRALIZATION
varying wishes and conditions in local areas11.Furthermore, it can provide “political glue forcountries with regional ethnic diversity” (anzi1996, page 295)12. Fiscal decentralizationis not always seen as conferring unmitigated
benefits to the local populace. Fiscaldecentralization is not without its share ofcontroversy. Oates (2006) mentions someanalysis that “reveals its dark side, especiallyin practice” and that “raises some seriousquestions about its capacity to provide anunambiguously positive contribution to animproved performance of the public sector”(pages 2-3). Smoke (2001) alludes to potentialmacroeconomic dangers and growth retarding
effects of fiscal decentralization, indicatinghowever that most of the evidence is anecdotaland relevant only under particular uncommoncircumstances or focused on correctable ratherthan inherent problems.
Tis is not the place to expound on thisinteresting facet of fiscal decentralization aspointed out by Oates and others but certainlyit poses a challenge to fiscal decentralization
analysts. Suffice it to say at this point thatthere is a need for more research and theproduction of comparative information onthe extent to which and the conditions under
which the alleged benefits and disadvantagesof fiscal decentralization have been realized(Smoke 2001).13
Te decentralization theorem argues thatsub-national governments can more efficiently
provide public services to identifiablerecipients up to the point at which the value
11 Oates, Wallace (1996), “Comment on ‘Conflicts and Dilemmasof Decentralization’ by Rudolf Hommes,” in Bruno, Michaeland Boris Pleskovic, editors, Annual World Bank Conference onDevelopment Economics, Washington, D.C.: The World Bank,
pages 351-353.12 Tanzi, Vito (1996), “Fiscal Federalism and Decentralization: A
Review of Some Efficiency and Macroeconomic Aspects,” inBruno, Michael and Boris Pleskovic, editors, Annual World BankConference on Development Economics, Washington, D.C.: TheWorld Bank, pages 295-316.
13 Smoke, Paul (2001) “Fiscal Decentralization in DevelopingCountries: A Review of Current Concepts and Practice,”Democracy, Governance and Human Rights ProgrammePaper Number 2, United Nations Research Institute for Social
Development, February. Professor Smoke declares thatanecdotal evidence and case studies provide some insights butthere is a need for more policy experimentation and systematicresearch to understand the prospects for fiscal decentralizationin developing countries.
placed on the marginal amount of services for which recipients are willing to pay is just equalto the benefit they receive (Ebel and Yilmaz,2002; Oates 1972, 2006 )14 o implementthis, sub-national (local) governments must be
given the authority to exercise “own source”taxation at the margin and be in a financialposition to do so. Tis is the essence of fiscaldecentralization (Ebel and Yilmaz 2002).
Following Smoke (2001), the key elementsthat should be included in a good fiscaldecentralization program are as follows:(a) an adequate enabling environment; (b)assignment of an appropriate set of functions
to local governments; (c) assignment of anappropriate set of local own-source revenuesto local governments; (d) the establishmentof an adequate intergovernmental fiscaltransfer system; and (d) the establishmentof adequate access of local governments todevelopment capital.
An adequate enabling policy
environmento begin with an enabling policy
environment for fiscal decentralization, whichis clearly stated in constitutional mandateor law, defining some minimum level ofautonomy, rights and responsibilities forlocal governments is important. Te return ofdemocratic governance in the Philippines afterthe 1986 People Power Revolution following
a long period of martial rule in the 70s and80s has provided an enabling environment fordecentralization. Te series of freely electeddemocratic governments since then havecontinued to recognize that it is good for afunctioning democracy to allow local leadersand people to have the power and responsibilityof deciding what goods and services to
14 Robert D. Ebel, Robert and Serdar Yilmaz (2002), “On theMeasurement and Impact of Fiscal Decentralization,” Policy
Research Working Paper 2809, The World Bank, March;Oates, Wallace (2006), “On the Theory and Practice of FiscalDecentralization,” IFIR Working Paper No. 2006-05, May;Oates, Wallace E. 1972. Fiscal Federalism. New York: HarcourtBrace Jovanovich
8/12/2019 Fiscal Decentralisation in Philippines
http://slidepdf.com/reader/full/fiscal-decentralisation-in-philippines 16/56
8
FISCAL DECENTRALIZATION IN THE PHILIPPINES
produce and finance. Te enactment into lawof the 1991 Local Government Code signals amajor departure from the traditionally centristapproach to governance and development indeveloping countries, which view the problem
of development as one requiring the presenceof a strong central government that will laydown policy directions and allocate resourcesaccordingly. It may be recalled that before theabove-mentioned period of martial rule, there
were a series of policy reforms leading towardlocal autonomy.
Atienza (2006) related the quest fordecentralization and autonomy in a recent
study 15
. Te 1991 Local Government Codemay be a radical piece of legislation but itis not the first decentralization law in thecountry and it passed after five years of debatein Congress (Uchimura and Suzuki 2009)16.Guevara (2004) recounted that in 1959 theLocal Autonomy Act (Republic Act 2264)
was passed to grant fiscal and regulatorypowers to local governments. In 1967, theDecentralization Act (Republic Act 5185)
increased the financial resources and powersof local governments. Te 1973 Constitutionof the Philippines mandated that the state“shall guarantee and promote the autonomyof local governments to ensure their fullestdevelopment as self-reliant communities.”Martial rule stymied those reform efforts.Te 1991 Local Government Code, then,“institutionalized a systematic allocation ofpowers and responsibility between the national
and local governments” (Guevara 2004, page1)17. Te 1991 Local Government Code wasa landmark legislation that gave rise to a majorshift in local governance (Manasan 2007).Te Code consolidated and amended theLocal Government Code of 1983, the Local
15 Atienza, Maria Ela (2006), “Local Governments and Devolutionin the Philippines,” in Noel Morada and Teresa Encarnacion,editors, Philippine Politics and Governance: An Introduction,Department of Political Science, University of the Philippines.
16 Uchimura, Hiroko and Yurika Suzuki (2009), “Measuring FiscalDecentralization in the Philippines,” IDE Discussion Paper No.209, Institute of Developing Economies, July.
17 Guevara, Milwida (2004), “The Fiscal Decentralization Processin the Philippines: Lessons from Experience,” http://www.econ.hit-u.ac.jp/~kokyo/APPPsympo04/PDF-papers-nov/guevara-i2004-revised2.pdf , date accessed August 29, 2011.
ax Code (Presidential Decree 231), and theReal Property ax Code (Presidential Decree464).
In the Philippines, the 1991 Local
Government Code devolved to localgovernment units the responsibility ofdelivering local and basic public servicesand raising local or own-source revenuesfor financing their expenditure assignment.Under the Local Government Code, localgovernment units have autonomy in decidingon the composition of local spending, taxingand borrowing that they would need to meetlocal development objectives. Tus, local
government units are now responsible for thefollowing areas: land use planning, agriculturalextension and research, community-based forestry, solid waste disposal system,environmental management, pollutioncontrol, primary health care, hospital care,social welfare services, local buildings andstructures, public parks, municipal servicesand enterprises such as public markets andabattoirs, local roads and bridges, health
facilities, housing, communal irrigation, watersupply, drainage, sewerage, flood control andinter-municipal telecommunications.
Te Local Government Code also transferredto local government units certain regulatoryfunctions. Te fiscal transfers to localgovernments were likewise increased, with40% of internally generated taxes allocatedto local governments through the Internal
Revenue Allotment (IRA). In addition, theCode encouraged the local government unitsto explore alternative sources of revenue byexercising their corporate powers in partnership
with the private sector. An innovationintroduced by the Code is the provision ofa framework for active participation of non-governmental organizations and civil societyin local governance18. Indeed, the new
18 For a detailed discussion, see Brillantes, Alex, GilbertoM. Llanto, James Alm and Gaudioso Sosmena (2009),“Decentralization and Devolution in the Philippines: Status,Triumphs, Tests and Directions,” Report submitted to theDepartment of the Interior and Local Government, unpublished
paper, April 29
8/12/2019 Fiscal Decentralisation in Philippines
http://slidepdf.com/reader/full/fiscal-decentralisation-in-philippines 17/56
9
CHAPTER 2THE CONCEPT AND ELEMENTS OF FISCAL DECENTRALIZATION
institutional framework for local developmenthas generated an enthusiastic response on thepart of local government units (LGUs) todeliver better public services to local citizens.It has promoted local autonomy by devolving
expenditure responsibilities and vested greatertaxing powers on local government units19.
19 The paper does not discuss the Organic Act of MuslimMindanao, which transfers to the regional government of theAutonomous Region of Muslim Mindanao all powers, functions,and responsibilities heretofore being exercised by the centralgovernment except (a) foreign affairs, (b) national defense, (c)postal service, (d) fiscal and monetary policy, (e) administrationof justice, (f) quarantine, (g) citizenship, naturalization andimmigration, (h) general auditing, civil service and elections,(i) foreign trade, (j) maritime, land and air transportation andcommunications that affect areas outside the ARMM, and(k) patents, trademarks, trade names and copyrights. For a
discussion see Manasan (2005).
Te succeeding sections of this paperfirst outline the current status of (a)the tax-expenditure assignment, (b) theintergovernmental fiscal transfer (IRA), and(c) the access of local government units to
development capital through borrowing, andthen highlight outstanding issues or problems
which should be addressed by policy makers.

8/12/2019 Fiscal Decentralisation in Philippines
http://slidepdf.com/reader/full/fiscal-decentralisation-in-philippines 18/56
10
FISCAL DECENTRALIZATION IN THE PHILIPPINES
8/12/2019 Fiscal Decentralisation in Philippines
http://slidepdf.com/reader/full/fiscal-decentralisation-in-philippines 19/56
11
CHAPTER 3TAX-EXPENDITURE ASSIGNMENT
A principal challenge faced by LGUsis finding the means to raise adequatefinancing for local development. Te LGUsare a heterogeneous group with varyingadministrative, financial and technicalcapacities. Tere is also great variation in thelevel of local development with the few highly
urbanized cities enjoying bigger and morebuoyant tax bases. Te rest of the LGUs arecomposed of smaller cities and municipalities
with weaker local economies. Provinces arealso a heterogeneous lot with great variationin economic, administrative, financial, andtechnical capacities. Te rising expectationsof the local populace for more and betterquality public services has to be matched bythe ability of local government units to find
substantial funding and to have better andmore efficient implementation of programsand project for local development. Te 1991Local Government Code assigned taxing andspending powers to local government units. Itis an acknowledged principle that matchingexpenditure and tax assignments is desirablebecause this will enable the local governmentsto shape the supply of public goods accordingto local preferences and willingness to pay
(Jourmard and Kongsrud 2003)20.
o assess the fiscal performance of the LGUs,time series data covering pre-decentralizationperiod (1989-1991) up to the present weretabulated21 Income data were obtained fromthe Statement of Income and Expenses (SIE)
while expenditure data were from the SAAOB(previously called Schedule of Appropriations
20 Joumard, Isabelle and Per Mathis Kongsrud. 2003. “Fiscal
relations across government levels.” Economics DepartmentWorking Papers No. 375, Organization for EconomicCooperation and Development, December 10.
21 Sources: Commission on Audit’s Annual Financial Reports forLocal Government Units
and Expenditures) from the Commission on Audit’s Annual Financial Reports for LocalGovernment Units for the years 1989 to 2009.
Local government tax revenues:trend and composition, 1989-2009
able 1 summarizes the various taxes thatare assigned to local government units bythe Local Government Code. Te Codehas empowered local government units toset local tax rates and collect own-sourcerevenues. Only cities and provinces can levythe real property tax. Te former shares theproceeds with their barangays while provincesshare the proceeds with the municipalities and
barangays. Both provinces and cities are also authorized to impose a tax on the transfer ofreal property, sand, gravel, and other quarryresources; amusement places; franchises;professionals; delivery vans and trucks; andidle lands. On the other hand, municipalitiesand cities, but not provinces, are allowed tolevy the community tax and the local businesstax (i.e.,turnover tax levied on the grossreceipts of businesses/traders)22.
Te main sources of local incomes arethe IRA, property tax, the business tax, andservice and business income from various localeconomic enterprises. However, Section 133 ofthe Code also provides a detailed list of taxes,
22 The first tier of government is the central government whichoperates through departments (ministries). The second tierof government is composed of local government units (LGUs)and one autonomous region, the ARMM. In general, the local
government structure is composed of three layers. Provincescomprise the first layer. In turn, the province is divided intomunicipalities and component cities, each of which is further
subdivided into barangays, the smallest political unit. At the same time, independent cities (or highly urbanized cities) existat the same level as the provinces, i.e., they share the samefunctions and authorities. Independent cities are divided directlyinto barangays (Manasan 2005).
CHAPTER 3 TAX-EXPENDITURE ASSIGNMENT

8/12/2019 Fiscal Decentralisation in Philippines
http://slidepdf.com/reader/full/fiscal-decentralisation-in-philippines 20/56
12
FISCAL DECENTRALIZATION IN THE PHILIPPINES
which are revenue-productive but which onlythe central government can impose. Teseinclude the individual and corporate income
taxes, customs duties, value-added tax, and theexcise taxes on alcoholic beverages, tobaccoproducts and petroleum products.
Table 1. Tax assignment in cities, provinces and municipalities
Tax base Cities Provinces Municipalities Barangays
Transfer of real property X X
Business of printing and publication X X
Franchise X X
Sand, gravel and other quarry resources X X * *
Amusement places X X *
Professionals X X
Real property X X * *
Delivery vans and trucks X XIdle lands X X
Business X X X
Community tax X X *
*shares in the proceeds of levy of province
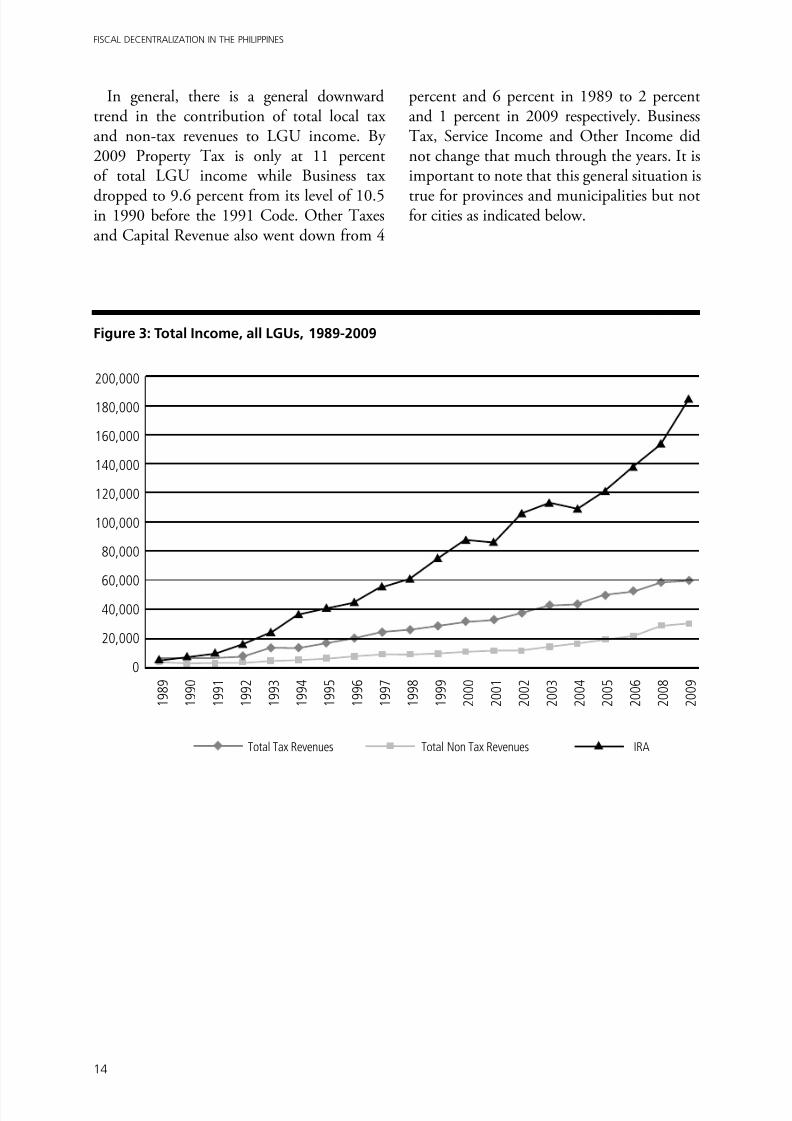
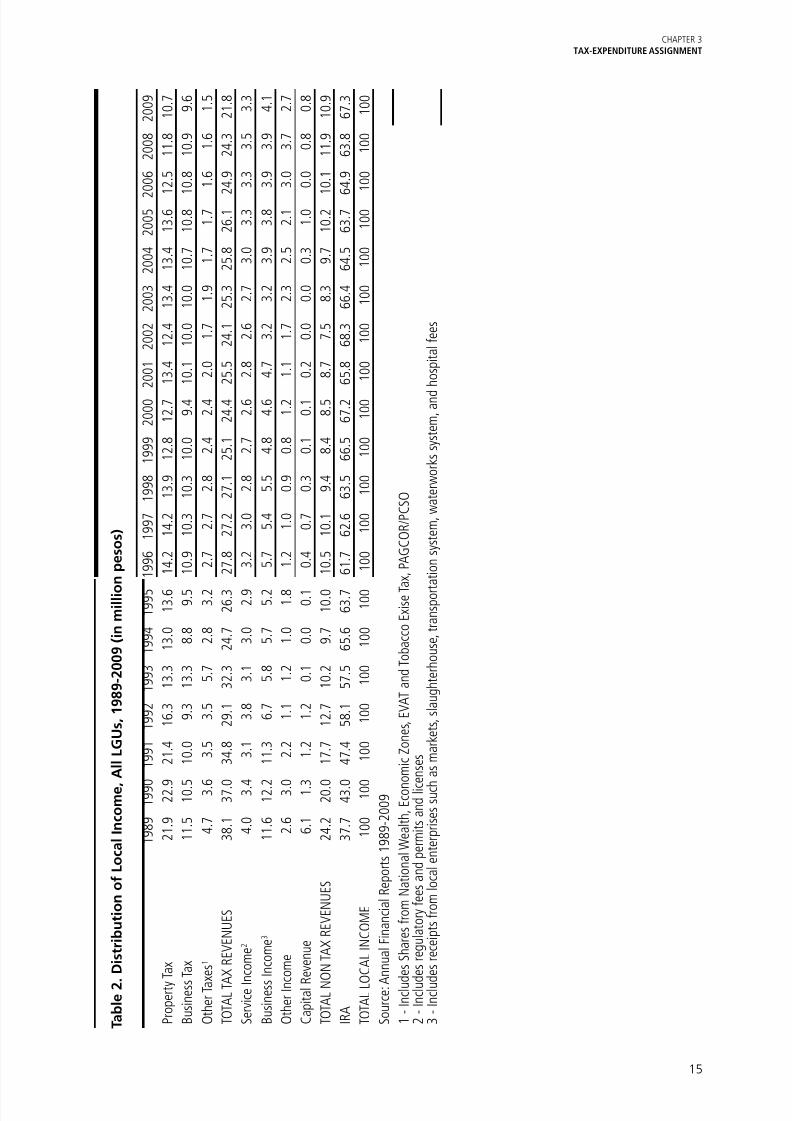
Local generated revenues are basically thetax revenues and non-tax revenues obtainedfrom regulatory fees, service charge, incomefrom local enterprises and other receipts. Teshare of local own source revenues and non-tax revenues to total LGU income was at 62percent in 1989, decreasing over time. In2009, it stood at 33 percent. As IRA’s sharein the total LGU income increased throughthe years, tax revenues and non-tax revenues’share decreased. Please see able 2 and Figure3. From 38 percent in 1989 ax Revenuesshares dropped to 29 percent in 1992, andto 22 percent by 2009. As for the Non-axRevenues, from 24 percent in 1989 it wasdown to 13 percent in 1992. By 2002 Non-ax Revenue was at its lowest at 7.5 percent,then slowly picked up and was 11 percent by2009.
Tax Revenues includes Property Tax, BusinessTax and Licenses and Other Taxes . Propertyax is composed of real property tax, propertytransfer tax, real property tax on idle lands,special assessment tax and special educationtax. Under Property Tax , the major one is thereal property tax. Provinces can levy a realproperty tax not exceeding 1% of the assessedvalue of the real property. For cities, the realproperty tax rate should not exceed 2% of theassessed value of the real property. Te LocalGovernment Code defines the maximumassessment level for each type of real property(Box 1). Te assessment level varies from localgovernment to local government based onlocal ordinances passed by the legislative body(“sanggunian”).
8/12/2019 Fiscal Decentralisation in Philippines
http://slidepdf.com/reader/full/fiscal-decentralisation-in-philippines 21/56
13
CHAPTER 3TAX-EXPENDITURE ASSIGNMENT
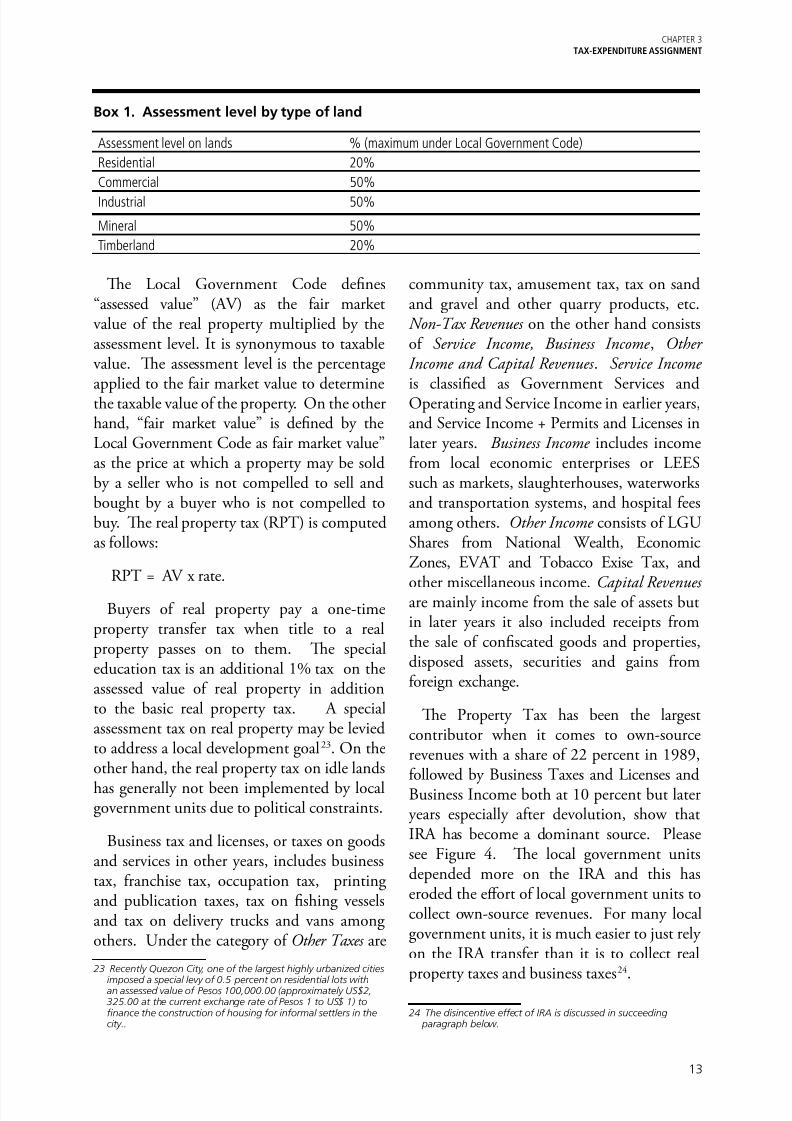
Box 1. Assessment level by type of land
Assessment level on lands % (maximum under Local Government Code)
Residential 20%
Commercial 50%
Industrial 50%
Mineral 50%
Timberland 20%
Te Local Government Code defines“assessed value” (AV) as the fair marketvalue of the real property multiplied by theassessment level. It is synonymous to taxablevalue. Te assessment level is the percentage
applied to the fair market value to determinethe taxable value of the property. On the otherhand, “fair market value” is defined by theLocal Government Code as fair market value”as the price at which a property may be soldby a seller who is not compelled to sell andbought by a buyer who is not compelled tobuy. Te real property tax (RP) is computedas follows:
RP = AV x rate.
Buyers of real property pay a one-timeproperty transfer tax when title to a realproperty passes on to them. Te specialeducation tax is an additional 1% tax on theassessed value of real property in additionto the basic real property tax. A specialassessment tax on real property may be leviedto address a local development goal23. On theother hand, the real property tax on idle lands
has generally not been implemented by localgovernment units due to political constraints.
Business tax and licenses, or taxes on goodsand services in other years, includes businesstax, franchise tax, occupation tax, printingand publication taxes, tax on fishing vesselsand tax on delivery trucks and vans amongothers. Under the category of Other Taxes are
23 Recently Quezon City, one of the largest highly urbanized cities
imposed a special levy of 0.5 percent on residential lots withan assessed value of Pesos 100,000.00 (approximately US$2, 325.00 at the current exchange rate of Pesos 1 to US$ 1) tofinance the construction of housing for informal settlers in thecity..
community tax, amusement tax, tax on sandand gravel and other quarry products, etc.Non-Tax Revenues on the other hand consistsof Service Income, Business Income , Other Income and Capital Revenues . Service Income
is classified as Government Services andOperating and Service Income in earlier years,and Service Income + Permits and Licenses inlater years. Business Income includes incomefrom local economic enterprises or LEESsuch as markets, slaughterhouses, waterworksand transportation systems, and hospital feesamong others. Other Income consists of LGUShares from National Wealth, EconomicZones, EVA and obacco Exise ax, and
other miscellaneous income. Capital Revenues are mainly income from the sale of assets butin later years it also included receipts fromthe sale of confiscated goods and properties,disposed assets, securities and gains fromforeign exchange.
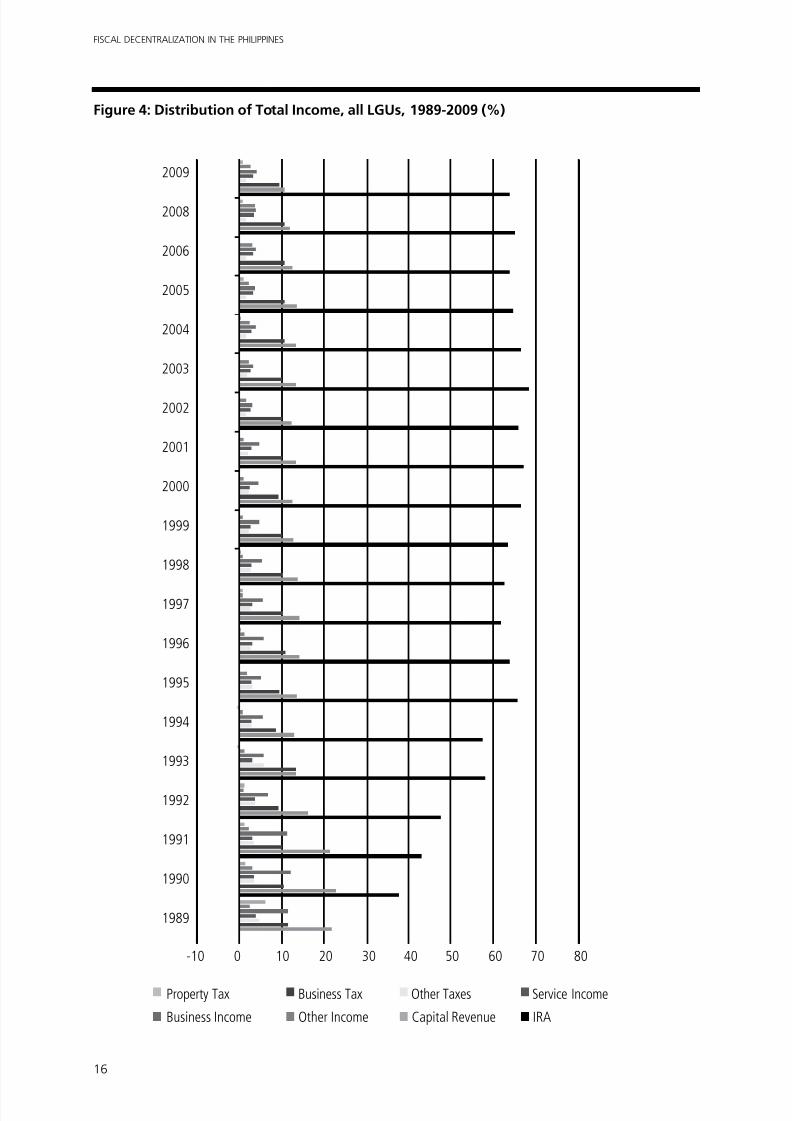
Te Property ax has been the largestcontributor when it comes to own-sourcerevenues with a share of 22 percent in 1989,followed by Business axes and Licenses andBusiness Income both at 10 percent but lateryears especially after devolution, show thatIRA has become a dominant source. Pleasesee Figure 4. Te local government unitsdepended more on the IRA and this haseroded the effort of local government units tocollect own-source revenues. For many localgovernment units, it is much easier to just relyon the IRA transfer than it is to collect real
property taxes and business taxes
24
.
24 The disincentive effect of IRA is discussed in succeeding paragraph below.
8/12/2019 Fiscal Decentralisation in Philippines
http://slidepdf.com/reader/full/fiscal-decentralisation-in-philippines 22/56
8/12/2019 Fiscal Decentralisation in Philippines
http://slidepdf.com/reader/full/fiscal-decentralisation-in-philippines 23/56
15
CHAPTER 3TAX-EXPENDITURE ASSIGNMENT
T a b l e 2 . D i s t r i b u t i o n o f L o c a l I n c o m e ,
A l l L G U s , 1 9 8 9 - 2 0 0 9 ( i n m i l l i o
n p e s o s )
1 9 8 9
1 9 9 0
1 9 9 1
1 9 9 2
1 9 9 3
1 9 9 4
1 9 9 5
1 9 9 6
1 9 9 7
1 9 9 8
1 9 9 9
2 0 0 0
2 0 0 1
2 0 0 2
2 0 0 3
2 0 0 4
2 0 0 5 2
0 0 6
2 0 0 8
2 0 0 9
P r o p e r t y
T a x
2 1 . 9
2 2 . 9
2 1 . 4
1 6 . 3
1 3 . 3
1 3 . 0
1 3 . 6
1 4 . 2
1 4 . 2
1 3 . 9
1 2 . 8
1 2 . 7
1 3 . 4
1 2 . 4
1 3 . 4
1 3 . 4
1 3 . 6
1 2 . 5
1 1 . 8
1 0 . 7
B u s i n e s s
T a x
1 1 . 5
1 0 . 5
1 0 . 0
9 . 3
1 3 . 3
8 . 8
9 . 5
1 0 . 9
1 0 . 3
1 0 . 3
1 0 . 0
9 . 4
1 0 . 1
1 0 . 0
1 0 . 0
1 0 . 7
1 0 . 8
1 0 . 8
1 0 . 9
9 . 6
O t h e r T a x e s 1
4 . 7
3 . 6
3 . 5
3 . 5
5 . 7
2 . 8
3 . 2
2 . 7
2 . 7
2 . 8
2 . 4
2 . 4
2 . 0
1 . 7
1 . 9
1 . 7
1 . 7
1 . 6
1 . 6
1 . 5
T O T A L T A
X R E V E N U E S
3 8 . 1
3 7 . 0
3 4 . 8
2 9 . 1
3 2 . 3
2 4 . 7
2 6 . 3
2 7 . 8
2 7 . 2
2 7 . 1
2 5 . 1
2 4 . 4
2 5 . 5
2 4 . 1
2 5 . 3
2 5 . 8
2 6 . 1
2 4 . 9
2 4 . 3
2 1 . 8
S e r v i c e I n c o m e 2
4 . 0
3 . 4
3 . 1
3 . 8
3 . 1
3 . 0
2 . 9
3 . 2
3 . 0
2 . 8
2 . 7
2 . 6
2 . 8
2 . 6
2 . 7
3 . 0
3 . 3
3 . 3
3 . 5
3 . 3
B u s i n e s s
I n c o m e 3
1 1 . 6
1 2 . 2
1 1 . 3
6 . 7
5 . 8
5 . 7
5 . 2
5 . 7
5 . 4
5 . 5
4 . 8
4 . 6
4 . 7
3 . 2
3 . 2
3 . 9
3 . 8
3 . 9
3 . 9
4 . 1
O t h e r I n c o m e
2 . 6
3 . 0
2 . 2
1 . 1
1 . 2
1 . 0
1 . 8
1 . 2
1 . 0
0 . 9
0 . 8
1 . 2
1 . 1
1 . 7
2 . 3
2 . 5
2 . 1
3 . 0
3 . 7
2 . 7
C a p i t a l R
e v e n u e
6 . 1
1 . 3
1 . 2
1 . 2
0 . 1
0 . 0
0 . 1
0 . 4
0 . 7
0 . 3
0 . 1
0 . 1
0 . 2
0 . 0
0 . 0
0 . 3
1 . 0
0 . 0
0 . 8
0 . 8
T O T A L N O N T A X R E V E N U E S
2 4 . 2
2 0 . 0
1 7 . 7
1 2 . 7
1 0 . 2
9 . 7
1 0 . 0
1 0 . 5
1 0 . 1
9 . 4
8 . 4
8 . 5
8 . 7
7 . 5
8 . 3
9 . 7
1 0 . 2
1 0 . 1
1 1 . 9
1 0 . 9
I R A
3 7 . 7
4 3 . 0
4 7 . 4
5 8 . 1
5 7 . 5
6 5 . 6
6 3 . 7
6 1 . 7
6 2 . 6
6 3 . 5
6 6 . 5
6 7 . 2
6 5 . 8
6 8 . 3
6 6 . 4
6 4 . 5
6 3 . 7
6 4 . 9
6 3 . 8
6 7 . 3
T O T A L L O
C A L I N C O M E
1 0 0
1 0 0
1 0 0
1 0 0
1 0 0
1 0 0
1 0 0
1 0 0
1 0 0
1 0 0
1 0 0
1 0 0
1 0 0
1 0 0
1 0 0
1 0 0
1 0 0
1 0 0
1 0 0
1 0 0
S o u r c e : A
n n u a l F i n a n c i a l R e p o r t s 1 9 8 9 - 2 0 0 9
1 - I n c l u d e s S h a r e s f r o m N a t i o n a l W e a l t h ,
E c o n
o m i c Z o n e s , E V A T a n d T o b a c c o E x i s e T a x ,
P A G C O R / P C S O
2 - I n c l u d e s r e g u l a t o r y f e e s a n d p e r m i t s a n d l i c e n s e s
3 - I n c l u d e s r e c e i p t s f r o m l o c a l e n t e r p r i s e s s u c h
a s m a r k e t s , s l a u g h t e r h o u s e ,
t r a n s p o r t a t i o n s y s t e m ,
w a t e r w o r k s s y s t e m ,
a n d
h o s p i t a l f e e s
8/12/2019 Fiscal Decentralisation in Philippines
http://slidepdf.com/reader/full/fiscal-decentralisation-in-philippines 24/56
16
FISCAL DECENTRALIZATION IN THE PHILIPPINES
Figure 4: Distribution of Total Income, all LGUs, 1989-2009 (%)
Property Tax Business Tax Other Taxes Service Income
Business Income Other Income Capital Revenue IRA
-10 0 10 20 30 40 50 60 70 80
2009
2008
2006
2005
2004
2003
2002
2001
2000
1999
1998
1997
1996
1995
1994
1993
1992
1991
1990
1989

8/12/2019 Fiscal Decentralisation in Philippines
http://slidepdf.com/reader/full/fiscal-decentralisation-in-philippines 25/56
17
CHAPTER 3TAX-EXPENDITURE ASSIGNMENT
Figures 5 and 6 compare the source ofincome of LGUs before (1990) the passage ofthe 1991 Code and after several years (2009).Te broad taxing powers benefited more thecities than provinces and municipalities. Tey
have been dominant in all types of local taxesand the internal revenue allotment. Te citieshave also the advantage of getting higher
amounts of IRA individually because there arefewer of them to divide the pie, so to speak.Tis has motivated municipalities to of gettinghigher amounts of IRA individually becausethere are fewer of them to divide the pie, so
to speak. Tis has motivated municipalitiesto convince legislators to pass special lawsconverting them into cities.
Figure 5: Distribution of Income by type of LGU, 1990
Provinces Cities Municipalities
80
70
60
50
40
30
20
10
0Property
taxBusiness
taxOthertaxes
ServiceIncome
BusinessIncome
OtherIncome
IRA TotalIncome
Figure 6: Distribution of Income by type of LGU, 2009
Provinces Cities Municipalities
80
70
60
50
40
30
20
10
0
Propertytax Businesstax Othertaxes ServiceIncome BusinessIncome OtherIncome IRA TotalIncome
8/12/2019 Fiscal Decentralisation in Philippines
http://slidepdf.com/reader/full/fiscal-decentralisation-in-philippines 26/56
18
FISCAL DECENTRALIZATION IN THE PHILIPPINES
An examination of revenue figures over theperiod 1989-2009 indicates a significant declinein the share of provinces and municipalities intotal LGU own-source revenue. Tis contrasts
with the continuous increase in the share
of cities in total LGU own-source revenue. An outstanding problem faced by provincesand municipalities is how to raise substantialrevenues when they do not have very productivetax bases to begin with. Te 1991 Code haveput certain limits on their taxing powers.Cities are more fortunate because they havebroader taxing powers than municipalities andprovinces. Please see able 1 above.
Because of an inefficient tax assignment,it is only the cities, which have the capacityto raise the needed revenues. As Manasan(2007) has observed the distribution ofown-source revenues is in favor of cities,and partly in favor of municipalities awayfrom provinces25. Te cities have larger taxbases and consequently, buoyant revenuesources but the majority of local governmentunits, that is, the municipalities have weaker
tax bases and thus, do not raise sufficientown-source revenues. Tey have remaineddependent on fiscal transfers, principally theinternal revenue allotment (IRA) for fundinglocal development activities.
Te dominance of IRA as revenue sourceis very obvious. Provinces and municipalities
25 Manasan, Rosario (2007), “Decentralization and Financingof Regional Development,” in Balisacan, Arsenio and Hal Hill,editors, The Dynamics of Regional Development: The Philippinesin East Asia, Quezon City: Ateneo de Manila University Press.
are most dependent on IRA. In an extremecase, the IRA allocations sometimes accountfor 95 percent of local revenues and, in at leastone case, 114 percent of total expenditures(ADB 2005)26. Te dependence on IRA
results in weaker local fiscal autonomy, whichcreates opportunities for greater control by thecentral government, contrary to the envisagedsituation of local governments able to respondto local needs and to match local outputs
with local preferences. o wean themselvesaway from central government control localgovernment units should strive for greater fiscalautonomy by working to significantly improveown-source revenues. Improving the collection
of real property and local business taxes is animportant step to boost local fiscal autonomy.
Limits on sub-national governmentdiscretion to determine tax rates and tax basessignificantly reduce local fiscal autonomy(Joumard and Kongsrud 2003).
Various researchers such as Manasan, Cuenca,Uchimura and Suzuki, Capuno, and Llanto,
among others have noted the inefficiency intax assignment to local government units inthe Philippines. Manasan (2005) provides agood summary 27 as shown in Box 2.
26 Asian Development Bank (2005), Decentralization in thePhilippines: Strengthening Local Government Financing &Resource Management in the Short Term, Mandaluyong City:
Asian Development Bank 27 Manasan, Rosario G. 2005. “Local Public Finance in the
Philippines: lessons in autonomy and accountability.” Philippine Journal of Development. Second Semester 2005, Vol. XXXIINo. 2: 32-102.
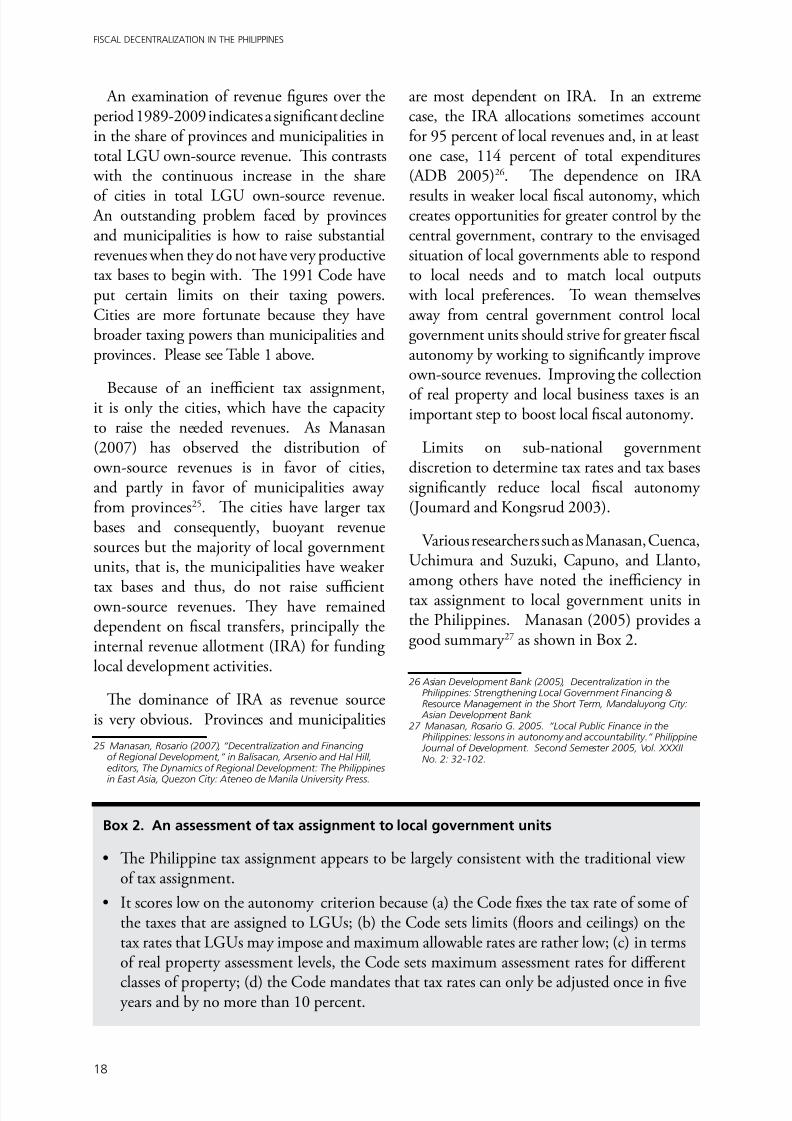
Box 2. An assessment of tax assignment to local government units
• Te Philippine tax assignment appears to be largely consistent with the traditional viewof tax assignment.
• It scores low on the autonomy criterion because (a) the Code fixes the tax rate of some ofthe taxes that are assigned to LGUs; (b) the Code sets limits (floors and ceilings) on thetax rates that LGUs may impose and maximum allowable rates are rather low; (c) in termsof real property assessment levels, the Code sets maximum assessment rates for different
classes of property; (d) the Code mandates that tax rates can only be adjusted once in fiveyears and by no more than 10 percent.

8/12/2019 Fiscal Decentralisation in Philippines
http://slidepdf.com/reader/full/fiscal-decentralisation-in-philippines 27/56
19
CHAPTER 3TAX-EXPENDITURE ASSIGNMENT
Tere are current legislative bills to modifythe taxing powers of LGUs, e.g., Senate Bill1458, which recommends transferring themandate to tax sand, gravel, and other quarryresources to cities and municipalities. HouseBill 1607 seeks to give additional sources ofrevenue to provinces by requiring componentcities to share their collection from realproperty taxes with the provinces. Tese
proposals should be carefully examined inview of the inequities in tax assignments andthe IRA allocation formula.
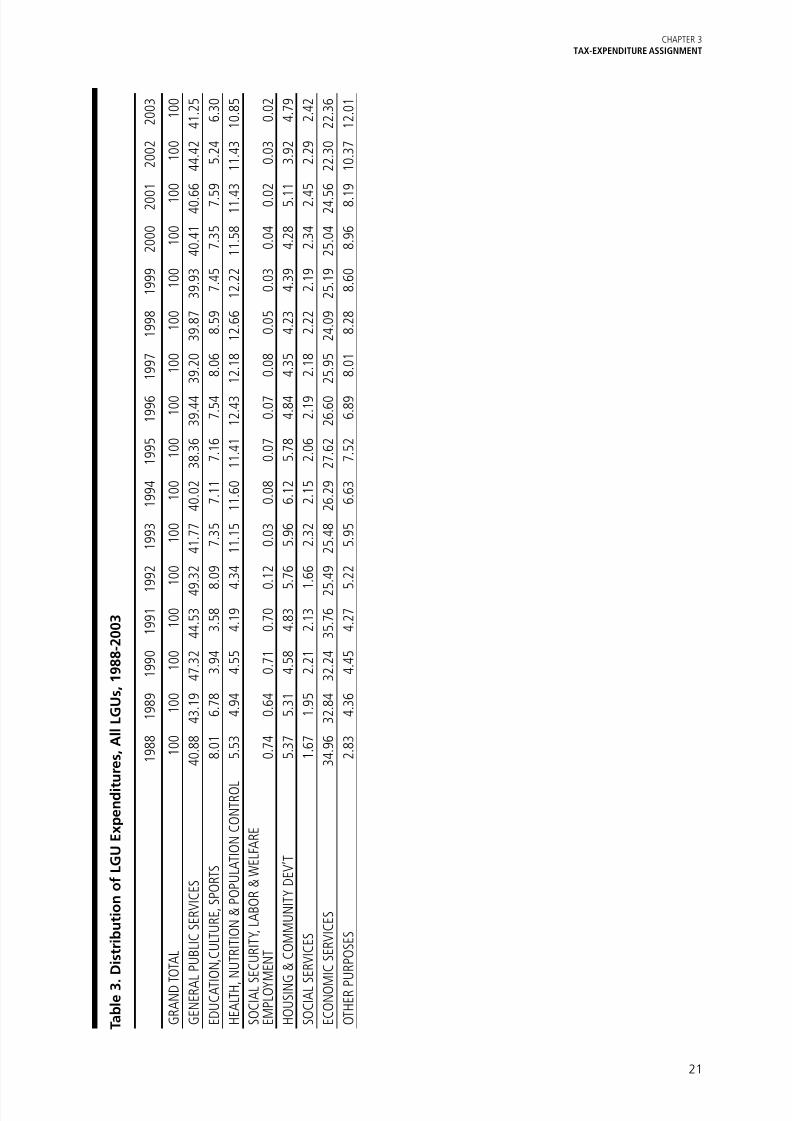
LOCAL GOVERNMENTEXPENDITURES: TREND ANDCOMPOSITION, 1989-200328
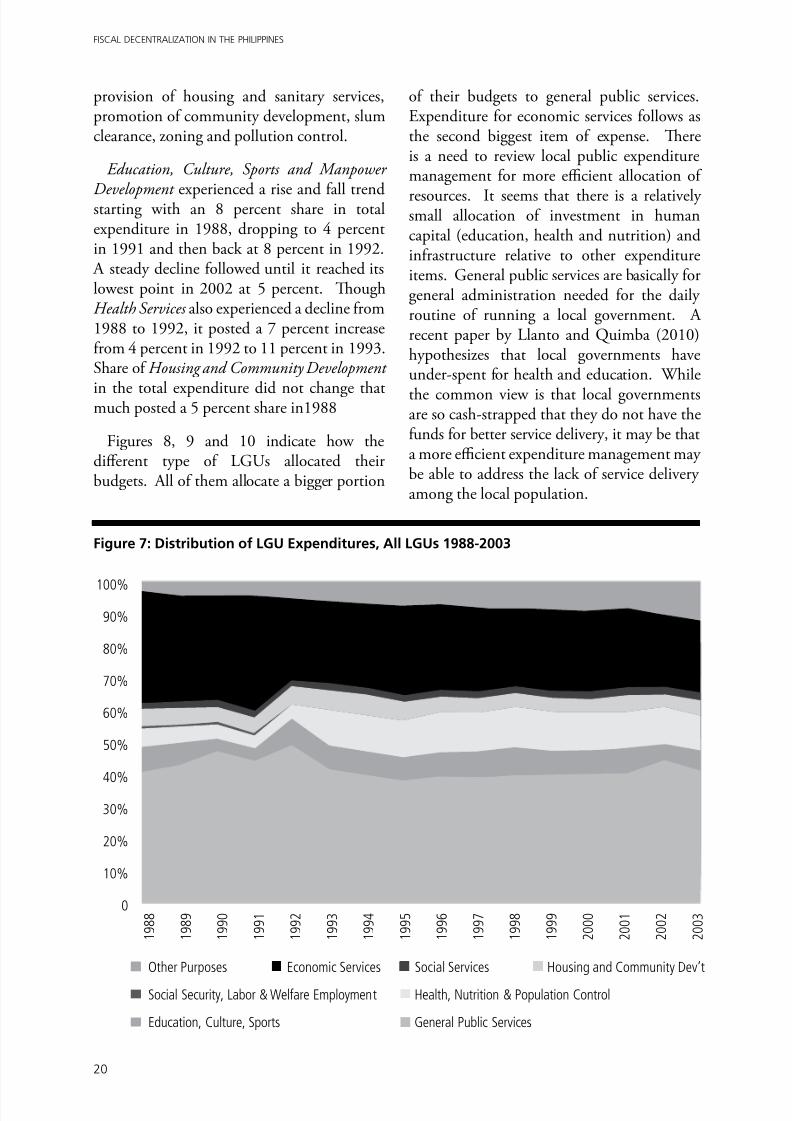
able 3 and Figure 7 show that local
governments spent most of their resources onGeneral Public Services. General Public Services (GPS) include the essential requirements torun the government such as the executiveand legislative services, treasury, assessment,budgeting and auditing services, propertyand supply administration, and informationservices. GPS is highest in the late 80s thruearly 90s, reaching its peak at 49 percent in
28 The period covered does not include the following years:
2004-2009 because of noise in the latter years. There is a needto review the Schedule of Appropriation, Allotment, Obligationand Balances (SAAOB) for local government units especially inview of the recent shift to the New Government AccountingSystem (NGAS).
1992. In 1993 it dropped to 40 percent andmaintained this level in the following years.
Te second largest local governmentexpense is on Economic Services with a shareof 35 percent in 1989 which steadily declinedthrough the years, with only 22 percent shareto total LGU expenditures by 2003.Economic Services refers to activities directed
towards the promotion and enhancementand the attainment of desired economicgrowth. Included in this category areagricultural, veterinary and natural resourceservices, architectural and engineeringservices, operation of local enterprises suchas markets, slaughter house, transportationand waterworks among others, cooperativeprograms, livelihood projects and othereconomic development programs.
Rounding up the major components of LGUexpenditure are education and health servicesand housing and community development.Education, Culture, Sports and ManpowerDevelopment covers expenditures for thesupport of schools and education facilities,planning and manpower development, sports,cultural preservation and enrichment. HealthServices pertains to expenditures for national
health programs including medical, dental andnutrition services. Housing and CommunityDevelopment includes expenditures for the
• Future Code amendments should consider giving LGUs greater discretion in setting taxrates by raising the maximum allowable tax rates.
• Tere is a need to move away from tax rates that are not indexed to inflation.
• Tere is a need to simplify the structure of local business tax because different categoriesof firms are subject to different rate schedules.
• Tere is a need to improve the tax administration machinery of local governments, e.g.,employ certified public accountants to improve tax audit capability; use automation toimprove revenue performance, etc.
• Tere is a need to revise the schedule of market values for real property purposes because manyprovinces and cities have done a general revision of such schedules only once since 1991.
• Tere is a need for many LGUs to revise their tax codes since only a few have made
revision since 1992 even if some tax rates are not indexed to inflation.
8/12/2019 Fiscal Decentralisation in Philippines
http://slidepdf.com/reader/full/fiscal-decentralisation-in-philippines 28/56
20
FISCAL DECENTRALIZATION IN THE PHILIPPINES
provision of housing and sanitary services,promotion of community development, slumclearance, zoning and pollution control.
Education, Culture, Sports and Manpower
Development experienced a rise and fall trendstarting with an 8 percent share in totalexpenditure in 1988, dropping to 4 percentin 1991 and then back at 8 percent in 1992.
A steady decline followed until it reached itslowest point in 2002 at 5 percent. ToughHealth Services also experienced a decline from1988 to 1992, it posted a 7 percent increasefrom 4 percent in 1992 to 11 percent in 1993.Share of Housing and Community Development
in the total expenditure did not change thatmuch posted a 5 percent share in1988
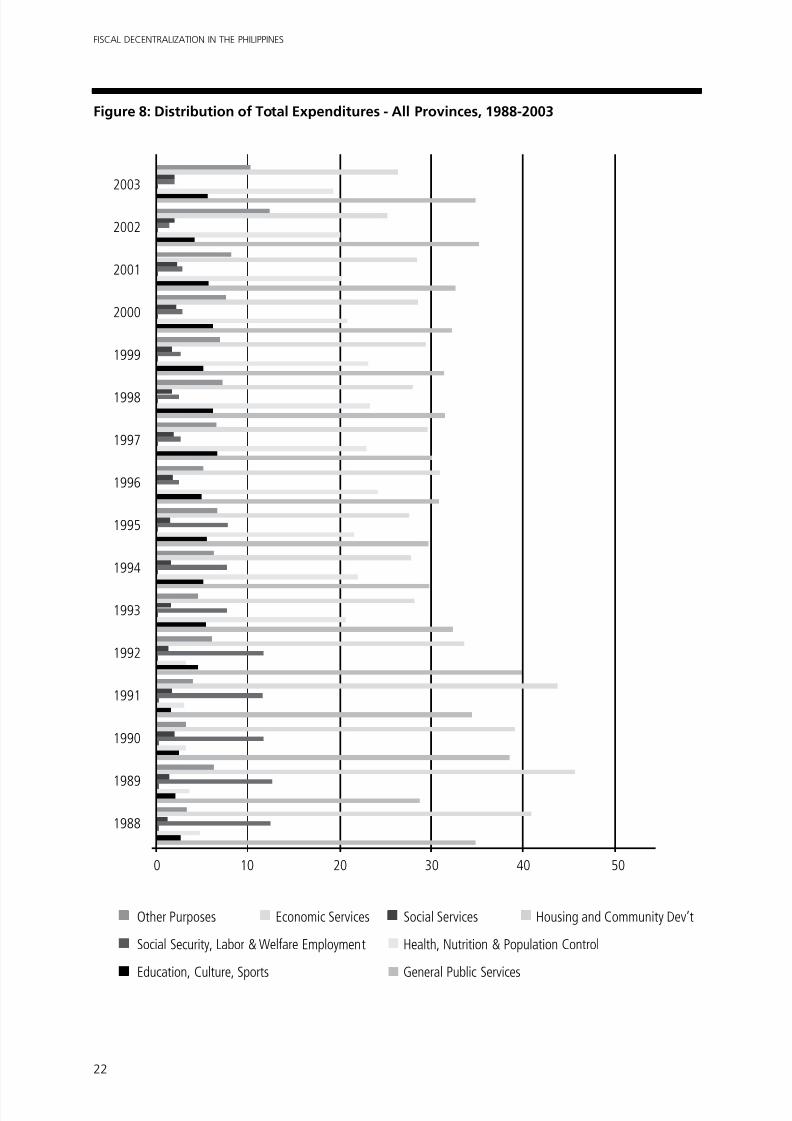
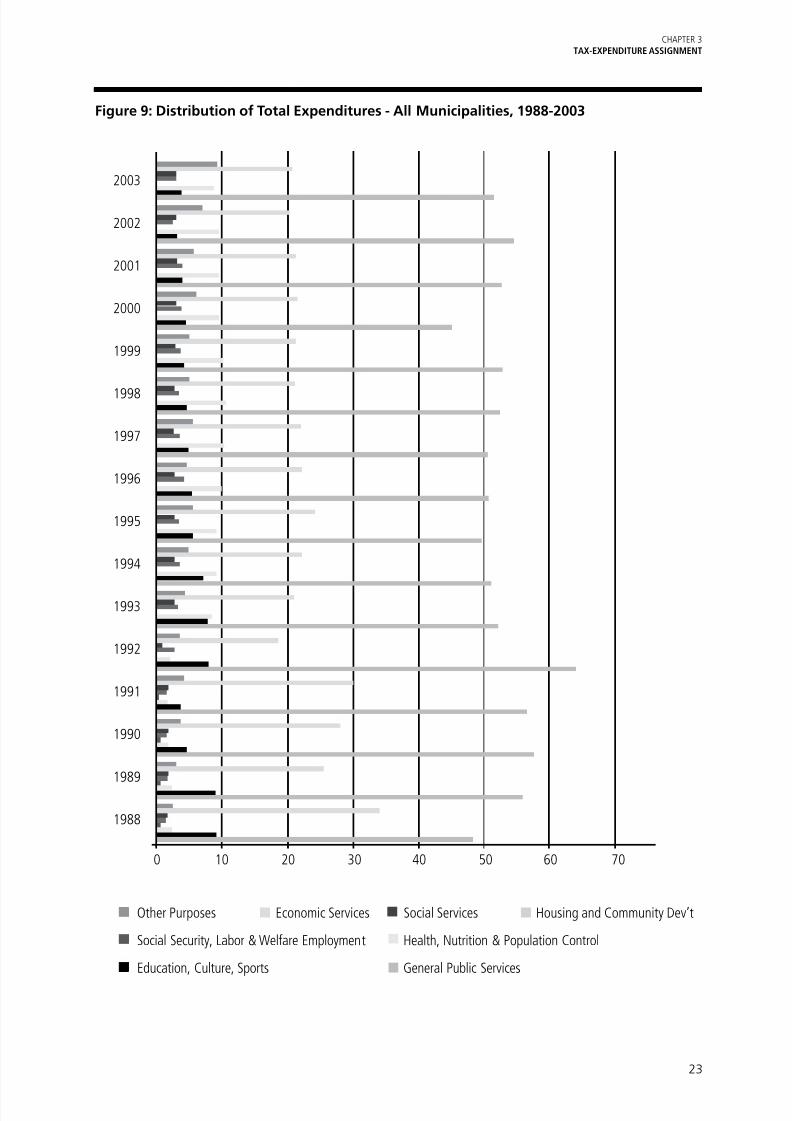
Figures 8, 9 and 10 indicate how thedifferent type of LGUs allocated theirbudgets. All of them allocate a bigger portion
of their budgets to general public services.Expenditure for economic services follows asthe second biggest item of expense. Tereis a need to review local public expendituremanagement for more efficient allocation of
resources. It seems that there is a relativelysmall allocation of investment in humancapital (education, health and nutrition) andinfrastructure relative to other expenditureitems. General public services are basically forgeneral administration needed for the dailyroutine of running a local government. Arecent paper by Llanto and Quimba (2010)hypothesizes that local governments haveunder-spent for health and education. While
the common view is that local governmentsare so cash-strapped that they do not have thefunds for better service delivery, it may be thata more efficient expenditure management maybe able to address the lack of service deliveryamong the local population.
100%
90%
80%
70%
60%
50%
40%
30%
20%
10%
0
1 9 8 8
1 9 8 9
1 9 9 0
1 9 9 1
1 9 9 2
1 9 9 3
1 9 9 4
1 9 9 5
1 9 9 6
1 9 9 7
1 9 9 8
1 9 9 9
2 0 0 0
2 0 0 1
2 0 0 2
2 0 0 3
Figure 7: Distribution of LGU Expenditures, All LGUs 1988-2003
Other Purposes Economic Services Social Services Housing and Community Dev’t
Social Security, Labor & Welfare Employment Health, Nutrition & Population Control
Education, Culture, Sports General Public Services
8/12/2019 Fiscal Decentralisation in Philippines
http://slidepdf.com/reader/full/fiscal-decentralisation-in-philippines 29/56
21
CHAPTER 3TAX-EXPENDITURE ASSIGNMENT
T a b l e 3 .
D i s t r i b u t i o n o f L G U E x p e n d i t
u r e s , A l l L G U s , 1 9 8 8 - 2 0 0 3
1 9 8 8
1 9 8 9
1 9 9 0
1 9 9 1
1
9 9 2
1 9 9 3
1 9 9 4
1 9 9 5
1 9 9 6
1 9 9 7
1 9 9 8
1 9 9 9
2 0 0 0
2 0 0
1
2 0 0 2
2 0 0 3
G R A N D T
O T A L
1 0 0
1 0 0
1 0 0
1 0 0
1 0 0
1 0 0
1 0 0
1 0 0
1 0 0
1 0 0
1 0 0
1 0 0
1 0 0
1 0
0
1 0 0
1 0 0
G E N E R A L P U B L I C S E R V I C E S
4 0 . 8
8
4 3 . 1
9
4 7 . 3
2
4 4 . 5
3
4 9 . 3
2
4 1 . 7
7
4 0 . 0
2
3 8 . 3
6
3 9 . 4 4
3 9 . 2
0
3 9 . 8
7
3 9 . 9
3
4 0 . 4
1
4 0 . 6
6
4 4 . 4
2
4 1 . 2
5
E D U C A T I O N , C
U L T U R E ,
S P O R T S
8 . 0
1
6 . 7
8
3 . 9
4
3 . 5
8
8 . 0
9
7 . 3
5
7 . 1
1
7 . 1
6
7 . 5 4
8 . 0
6
8 . 5
9
7 . 4
5
7 . 3
5
7 . 5
9
5 . 2
4
6 . 3
0
H E A L T H ,
N U T R I T I O N & P O P U L A T I O N C O N T R O L
5 . 5
3
4 . 9
4
4 . 5
5
4 . 1
9
4 . 3
4
1 1 . 1
5
1 1 . 6
0
1 1 . 4
1
1 2 . 4 3
1 2 . 1
8
1 2 . 6
6
1 2 . 2
2
1 1 . 5
8
1 1 . 4
3
1 1 . 4
3
1 0 . 8
5
S O C I A L S
E C U R I T Y , L A B O R & W E L F A R E
E M P L O Y M E N T
0 . 7
4
0 . 6
4
0 . 7
1
0 . 7
0
0 . 1
2
0 . 0
3
0 . 0
8
0 . 0
7
0 . 0 7
0 . 0
8
0 . 0
5
0 . 0
3
0 . 0
4
0 . 0
2
0 . 0
3
0 . 0
2
H O U S I N G
& C O M M U N I T Y D E V ’ T
5 . 3
7
5 . 3
1
4 . 5
8
4 . 8
3
5 . 7
6
5 . 9
6
6 . 1
2
5 . 7
8
4 . 8 4
4 . 3
5
4 . 2
3
4 . 3
9
4 . 2
8
5 . 1
1
3 . 9
2
4 . 7
9
S O C I A L S
E R V I C E S
1 . 6
7
1 . 9
5
2 . 2
1
2 . 1
3
1 . 6
6
2 . 3
2
2 . 1
5
2 . 0
6
2 . 1
9
2 . 1
8
2 . 2
2
2 . 1
9
2 . 3
4
2 . 4
5
2 . 2
9
2 . 4
2
E C O N O M
I C S E R V I C E S
3 4 . 9
6
3 2 . 8
4
3 2 . 2
4
3 5 . 7
6
2 5 . 4
9
2 5 . 4
8
2 6 . 2
9
2 7 . 6
2
2 6 . 6
0
2 5 . 9
5
2 4 . 0
9
2 5 . 1
9
2 5 . 0
4
2 4 . 5
6
2 2 . 3
0
2 2 . 3
6
O T H E R P U R P O S E S
2 . 8
3
4 . 3
6
4 . 4
5
4 . 2
7
5 . 2
2
5 . 9
5
6 . 6
3
7 . 5
2
6 . 8
9
8 . 0
1
8 . 2
8
8 . 6
0
8 . 9
6
8 . 1
9
1 0 . 3
7
1 2 . 0
1
8/12/2019 Fiscal Decentralisation in Philippines
http://slidepdf.com/reader/full/fiscal-decentralisation-in-philippines 30/56
22
FISCAL DECENTRALIZATION IN THE PHILIPPINES
Other Purposes Economic Services Social Services Housing and Community Dev’t
Social Security, Labor & Welfare Employment Health, Nutrition & Population Control
Education, Culture, Sports General Public Services
Figure 8: Distribution of Total Expenditures - All Provinces, 1988-2003
2003
2002
2001
2000
1999
1998
1997
1996
1995
1994
1993
1992
1991
1990
1989
1988
0 10 20 30 40 50
8/12/2019 Fiscal Decentralisation in Philippines
http://slidepdf.com/reader/full/fiscal-decentralisation-in-philippines 31/56
23
CHAPTER 3TAX-EXPENDITURE ASSIGNMENT
Figure 9: Distribution of Total Expenditures - All Municipalities, 1988-2003
Other Purposes Economic Services Social Services Housing and Community Dev’t
Social Security, Labor & Welfare Employment Health, Nutrition & Population Control
Education, Culture, Sports General Public Services
2003
2002
2001
2000
1999
1998
1997
1996
1995
1994
1993
1992
1991
1990
1989
1988
0 10 20 30 40 50 60 70

8/12/2019 Fiscal Decentralisation in Philippines
http://slidepdf.com/reader/full/fiscal-decentralisation-in-philippines 32/56
24
FISCAL DECENTRALIZATION IN THE PHILIPPINES
Figure 10: Distribution of Total Expenditures - All Cities, 1988-2003
Other Purposes Economic Services Social Services Housing and Community Dev’t
Social Security, Labor & Welfare Employment Health, Nutrition & Population Control
Education, Culture, Sports General Public Services
2003
2002
2001
2000
1999
1998
1997
1996
1995
1994
1993
1992
1991
1990
1989
1988
0 10 20 30 40 50
8/12/2019 Fiscal Decentralisation in Philippines
http://slidepdf.com/reader/full/fiscal-decentralisation-in-philippines 33/56
25
CHAPTER 3TAX-EXPENDITURE ASSIGNMENT
A joint study by the Asian DevelopmentBank and the World Bank in 2005 pronouncedthat overall the devolution of expenditureresponsibilities to LGUs is consistent with theprinciple of subsidiarity (ADB 2005)29. Te
report also noted that few devolved activitieshave spillover benefits outside LGU territorial
jurisdictions and that the Code allowed LGUsto regroup into larger cooperative units whenthey deem appropriate. As proof, it citedseveral cases of inter-LGU cooperation incoastal resource management, solid wastemanagement, water supply developmentand distribution, and construction of inter-municipal roads. Metropolitan arrangements
have also appeared in several places. Loehrand Manasan (1999) find that the devolutionof expenditure responsibilities to LGUs isgenerally consistent with the decentralizationtheorem. Te devolved activities are those “thatcan be provided at lower levels of government. . . and few of them have benefits that spillover outside the territorial jurisdiction ofthe LGUs with exception of those related toenvironmental management” (Manasan 2005,
page 37)30.
During the period after the enactment ofthe Local Government Code, there seems tobe a marked increase in LGU spending asmore resources had been made available toLGUs. A JICA study (2008) notes that the topthree service areas where improvement withdevolution was noted in sample provinces,cities and municipalities are: 1) social welfare;
2) health and nutrition; and 3) agricultureand fisheries. Undoubtedly the changesbrought about the passage of the 1991 LocalGovernment Code have resulted in an increasein LGU spending.
On the other hand, whether there has been anoverall improvement of public service delivery,governance and local development now thatthese functions are with local government
29 Asian Development Bank (2005), Decentralization in thePhilippines: Strengthening Local Government Financing &Resource Management in the Short Term, Mandaluyong City:
Asian Development Bank 30 An exception is education (Manasan, 2005).
units is an empirical question. Tere has beenan improvement in public service delivery butperhaps not in a significant way for all localgovernment units. Llanto and Quimba (2010)report recent findings of a survey conducted
by the Philippine Institute for DevelopmentStudies, namely that:
• For health, despite more than 10 yearsafter devolving this function to localgovernment units, there is still an overlap inthe provision of services by LGUs and thenational government. LGUs still have notfully built capacity to provide better healthcare services. Finally, LGUs and the central
government’s Department (Ministry) ofHealth have not clearly identified cost-sharing and assignment of functionsregarding delivery of health service.
• For education, the School BasedManagement approach which centers ongiving the authority to school principals andinvolving parents and other stakeholders inschool decisions is a good start for properphasing and right-sizing of functions yet
to be devolved. However, there is need forclear and proper delineation of functions,capacities and funds between local andnational offices.
• For LGUs to better manage their own water resources there is a need for a cleardelineation of powers, functions, andresponsibilities, institutional development,and source of financing.
Pending better data and the conduct ofmore systematic and in-depth studies, thereseems to be at best only anecdotal evidencesupporting claims of improvement in servicedelivery in several local government units.
For example, Klugman (1994) reportsa Philippine study by Jimenez and others(1988) that for given levels of enrolmentand quality, schools which rely more heavily
on local funding are more efficient. Tereis a lower cost of delivery of educationservices. Tey also find that students at
8/12/2019 Fiscal Decentralisation in Philippines
http://slidepdf.com/reader/full/fiscal-decentralisation-in-philippines 34/56
26
FISCAL DECENTRALIZATION IN THE PHILIPPINES
schools which relied more heavily upon localfunding had better ‘achievement scores’. Aspecial education fund, a surcharge on taxeson real property is administered by thelocal school board composed of the school
principal, local government representativeand parents. Te ADB (2005) noted agrowing number of examples of excellencein service delivery, which seem to indicatethat well-performing local governments maybe distinguished by their ability to accessresources more effectively, and managethem more transparently and accountably.
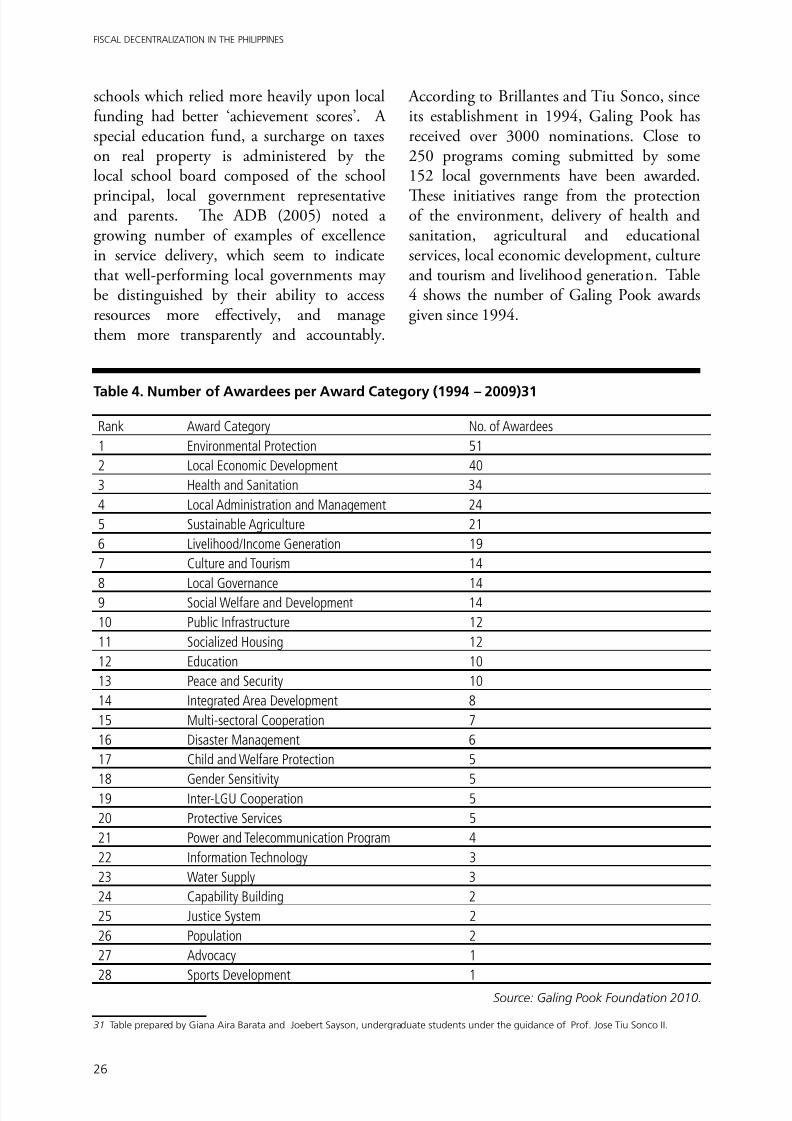
According to Brillantes and iu Sonco, sinceits establishment in 1994, Galing Pook hasreceived over 3000 nominations. Close to250 programs coming submitted by some152 local governments have been awarded.
Tese initiatives range from the protectionof the environment, delivery of health andsanitation, agricultural and educationalservices, local economic development, cultureand tourism and livelihood generation. able4 shows the number of Galing Pook awardsgiven since 1994.
Table 4. Number of Awardees per Award Category (1994 – 2009)31
Rank Award Category No. of Awardees
1 Environmental Protection 51
2 Local Economic Development 40
3 Health and Sanitation 34
4 Local Administration and Management 24
5 Sustainable Agriculture 21
6 Livelihood/Income Generation 19
7 Culture and Tourism 14
8 Local Governance 149 Social Welfare and Development 14
10 Public Infrastructure 12
11 Socialized Housing 12
12 Education 10
13 Peace and Security 10
14 Integrated Area Development 8
15 Multi-sectoral Cooperation 7
16 Disaster Management 6
17 Child and Welfare Protection 5
18 Gender Sensitivity 519 Inter-LGU Cooperation 5
20 Protective Services 5
21 Power and Telecommunication Program 4
22 Information Technology 3
23 Water Supply 3
24 Capability Building 2
25 Justice System 2
26 Population 2
27 Advocacy 1
28 Sports Development 1 Source: Galing Pook Foundation 2010.
31 Table prepared by Giana Aira Barata and Joebert Sayson, undergraduate students under the guidance of Prof. Jose Tiu Sonco II.

8/12/2019 Fiscal Decentralisation in Philippines
http://slidepdf.com/reader/full/fiscal-decentralisation-in-philippines 35/56
27
CHAPTER 3TAX-EXPENDITURE ASSIGNMENT
Tere is a need to have a closer look at theexpenditure assignment of local governmentunits. An ADB (2005) report indicatesthat surveys done to assess satisfaction
with public services point to mixed results
on local government performance in thePhilippines. Local areas continue to sufferfrom a myriad of problems — uncertain accessto potable water and electricity, decliningliteracy rates, environmental degradation,rising unemployment rates, lack of low-cost housing, and unreliable police and firedepartment services. Tere is a need to investin infrastructure and social services. Recentstudies have also pointed out the mixed results
on local government performance in thecountry (e.g., Capuno, 2007 and Brillantes,Llanto, Alm and Sosmena, 2009).
Te examination of the expenditureassignment of local government unitsindicates a room for improvement. Section 17(b) of the 1991 Code provides an explicit andclear expenditure assignment across levels ofgovernment with the exception of environment
and natural resources management. However,the following section 17 (c) allows national(central) government agencies to continue
with the implementation of devolved public works and infrastructure projects, andother programs and services. Te nationalgovernment has also issued Executive Order53, which empowers national governmentagencies to manage and control all foreign-assisted and nationally funded projects, even if
those projects may involve devolved activities.
In addition, Section 17 (f) allows thenational government to or the next higherLGU level to “provide or augment the basicservices and facilities assigned to a lowerlevel of local government unit when suchservices or facilities are not made available,of if made available, are inadequate to meetthe requirements of its inhabitants.32” Loehr
and Manasan (1999) observed that nationalgovernment agencies have exploited Section
32 See Manasan (2007) for an extended explanation.
17 (f) and Executive Order 53 to implementprojects involving devolved activities onthe justification that those projects supportnational objectives.
Section 17(c) and Section 17 (f) of the1991 Code have provided the opportunity forcentral government line agencies to continueto implement devolved public works andinfrastructure projects and other facilities,programs and services. Funding is madeavailable under (a) the central governmentbudget provided under the Annual General
Appropriations Act, (b) special laws, (c)executive orders and (d) foreign sources such
as official development assistance (ODA).
In sum, how should one characterize thecurrent status of tax-expenditure assignment?In general, local own-source revenues areinadequate and cannot effectively coverthe LGUs expenditure assignment. Teexperience in the almost twenty year periodafter the enactment of the law shows asignificant mismatch in the tax-expenditure
assignment33. Uchimura and Suzuki (2009)succinctly declare the issue as a case ofexpanding local expenditure responsibility
while the local fiscal capacity is notstrengthened. Tere is an obvious need for anappropriate matching of tax and expenditureassignments if local governments are toefficiently deliver public services.
Te 1991 Code looked at fiscal transfers asinstruments to close the fiscal gap. As shownin the following section, there is much roomfor improvement in the distribution formulafor the internal revenue allotment.
otal LGU expenditure is consistently largerthan the total local income and revenues(except 2002) as depicted in Figure 11. Incomegenerated from local taxes and other operatingincome are not enough to finance all of thelocal government activities and to implement
33 The 1991 Local Government Code was enacted into law onOctober 1991.
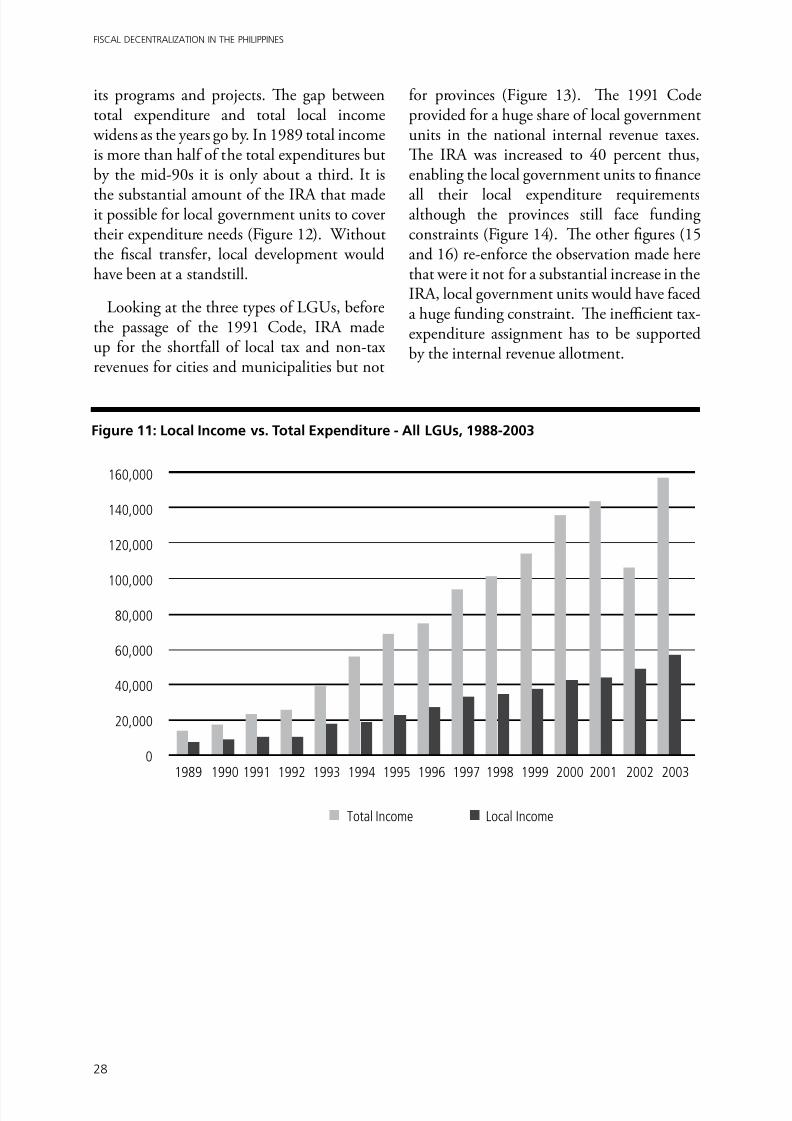
8/12/2019 Fiscal Decentralisation in Philippines
http://slidepdf.com/reader/full/fiscal-decentralisation-in-philippines 36/56
28
FISCAL DECENTRALIZATION IN THE PHILIPPINES
its programs and projects. Te gap betweentotal expenditure and total local income
widens as the years go by. In 1989 total incomeis more than half of the total expenditures butby the mid-90s it is only about a third. It is
the substantial amount of the IRA that madeit possible for local government units to covertheir expenditure needs (Figure 12). Withoutthe fiscal transfer, local development wouldhave been at a standstill.
Looking at the three types of LGUs, beforethe passage of the 1991 Code, IRA madeup for the shortfall of local tax and non-taxrevenues for cities and municipalities but not
for provinces (Figure 13). Te 1991 Codeprovided for a huge share of local governmentunits in the national internal revenue taxes.Te IRA was increased to 40 percent thus,enabling the local government units to finance
all their local expenditure requirementsalthough the provinces still face fundingconstraints (Figure 14). Te other figures (15and 16) re-enforce the observation made herethat were it not for a substantial increase in theIRA, local government units would have faceda huge funding constraint. Te inefficient tax-expenditure assignment has to be supportedby the internal revenue allotment.
Figure 11: Local Income vs. Total Expenditure - All LGUs, 1988-2003
Total Income Local Income
160,000
140,000
120,000
100,000
80,000
60,000
40,000
20,000
0 1989 1990 1991 1992 1993 1994 1995 1996 1997 1998 1999 2000 2001 2002 2003
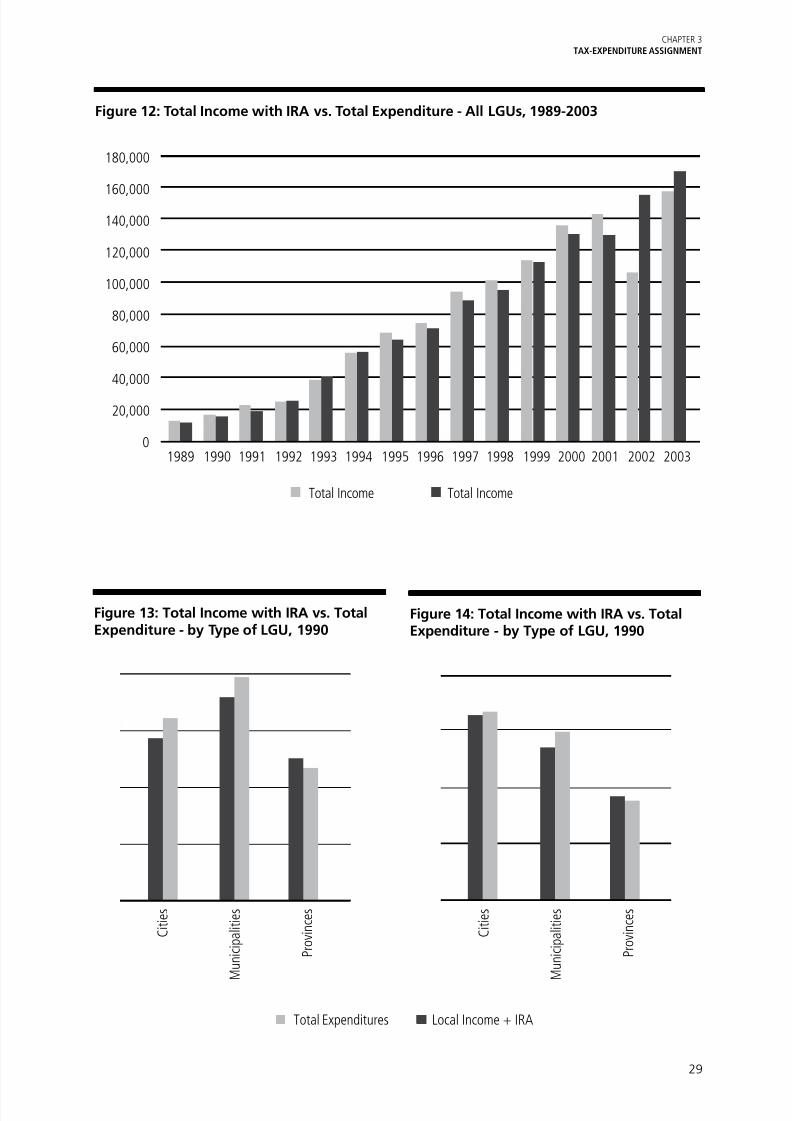
8/12/2019 Fiscal Decentralisation in Philippines
http://slidepdf.com/reader/full/fiscal-decentralisation-in-philippines 37/56
29
CHAPTER 3TAX-EXPENDITURE ASSIGNMENT
Figure 12: Total Income with IRA vs. Total Expenditure - All LGUs, 1989-2003
Total Income Total Income
180,000
160,000
140,000
120,000
100,000
80,000
60,000
40,000
20,000
0 1989 1990 1991 1992 1993 1994 1995 1996 1997 1998 1999 2000 2001 2002 2003
Figure 13: Total Income with IRA vs. TotalExpenditure - by Type of LGU, 1990
Total Expenditures Local Income + IRA
C i t i e s
M u n i c i p a l i t i e s
P r o v i n c e s
C i t i e s
M u n i c i p a l i t i e s
P r o v i n c e s
Figure 14: Total Income with IRA vs. TotalExpenditure - by Type of LGU, 1990
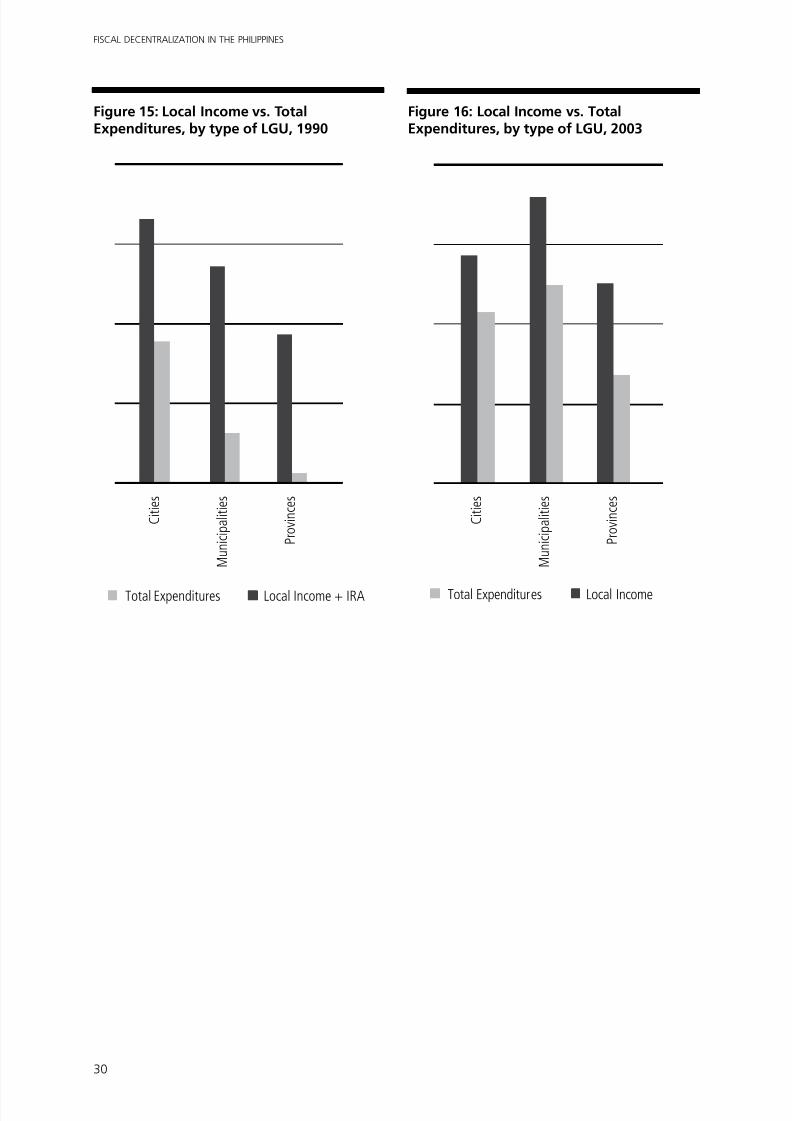
8/12/2019 Fiscal Decentralisation in Philippines
http://slidepdf.com/reader/full/fiscal-decentralisation-in-philippines 38/56
30
FISCAL DECENTRALIZATION IN THE PHILIPPINES
C i t i e s
M u n i c i p a l i t i e s
P r o v i n c e s
C i t i e s
M u n i c i p a l i t i e s
P r o v i n c e s
Figure 15: Local Income vs. TotalExpenditures, by type of LGU, 1990
Total Expenditures Local Income + IRA
Figure 16: Local Income vs. TotalExpenditures, by type of LGU, 2003
Total Expenditures Local Income
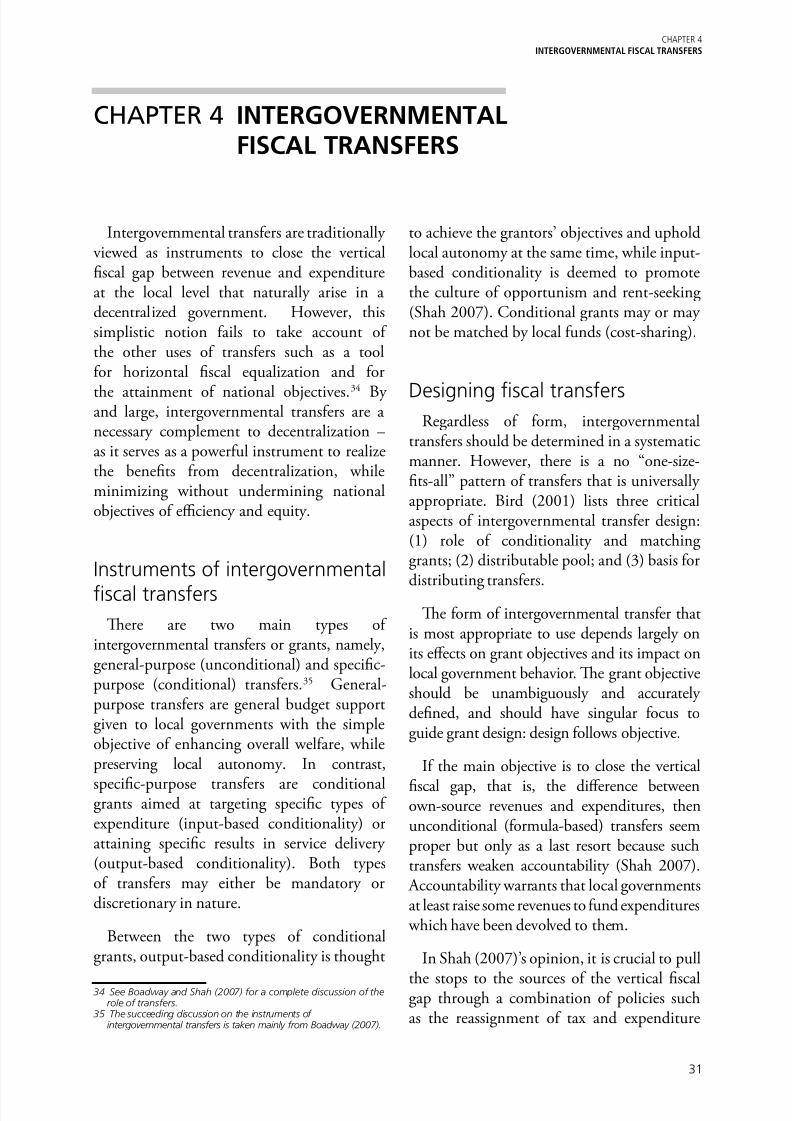
8/12/2019 Fiscal Decentralisation in Philippines
http://slidepdf.com/reader/full/fiscal-decentralisation-in-philippines 39/56
31
CHAPTER 4INTERGOVERNMENTAL FISCAL TRANSFERS
Intergovernmental transfers are traditionallyviewed as instruments to close the verticalfiscal gap between revenue and expenditureat the local level that naturally arise in adecentralized government. However, thissimplistic notion fails to take account ofthe other uses of transfers such as a toolfor horizontal fiscal equalization and for
the attainment of national objectives.34 Byand large, intergovernmental transfers are anecessary complement to decentralization –as it serves as a powerful instrument to realizethe benefits from decentralization, whileminimizing without undermining nationalobjectives of efficiency and equity.
Instruments of intergovernmental
fiscal transfersTere are two main types of
intergovernmental transfers or grants, namely,general-purpose (unconditional) and specific-purpose (conditional) transfers.35 General-purpose transfers are general budget supportgiven to local governments with the simpleobjective of enhancing overall welfare, whilepreserving local autonomy. In contrast,
specific-purpose transfers are conditionalgrants aimed at targeting specific types ofexpenditure (input-based conditionality) orattaining specific results in service delivery(output-based conditionality). Both typesof transfers may either be mandatory ordiscretionary in nature.
Between the two types of conditionalgrants, output-based conditionality is thought
34 See Boadway and Shah (2007) for a complete discussion of therole of transfers.
35 The succeeding discussion on the instruments ofintergovernmental transfers is taken mainly from Boadway (2007).
to achieve the grantors’ objectives and upholdlocal autonomy at the same time, while input-based conditionality is deemed to promotethe culture of opportunism and rent-seeking(Shah 2007). Conditional grants may or maynot be matched by local funds (cost-sharing).
Designing fiscal transfersRegardless of form, intergovernmental
transfers should be determined in a systematicmanner. However, there is a no “one-size-fits-all” pattern of transfers that is universallyappropriate. Bird (2001) lists three criticalaspects of intergovernmental transfer design:(1) role of conditionality and matchinggrants; (2) distributable pool; and (3) basis for
distributing transfers.Te form of intergovernmental transfer that
is most appropriate to use depends largely onits effects on grant objectives and its impact onlocal government behavior. Te grant objectiveshould be unambiguously and accuratelydefined, and should have singular focus toguide grant design: design follows objective.
If the main objective is to close the vertical
fiscal gap, that is, the difference betweenown-source revenues and expenditures, thenunconditional (formula-based) transfers seemproper but only as a last resort because suchtransfers weaken accountability (Shah 2007).
Accountability warrants that local governmentsat least raise some revenues to fund expenditures
which have been devolved to them.
In Shah (2007)’s opinion, it is crucial to pull
the stops to the sources of the vertical fiscalgap through a combination of policies suchas the reassignment of tax and expenditure
CHAPTER 4 INTERGOVERNMENTALFISCAL TRANSFERS
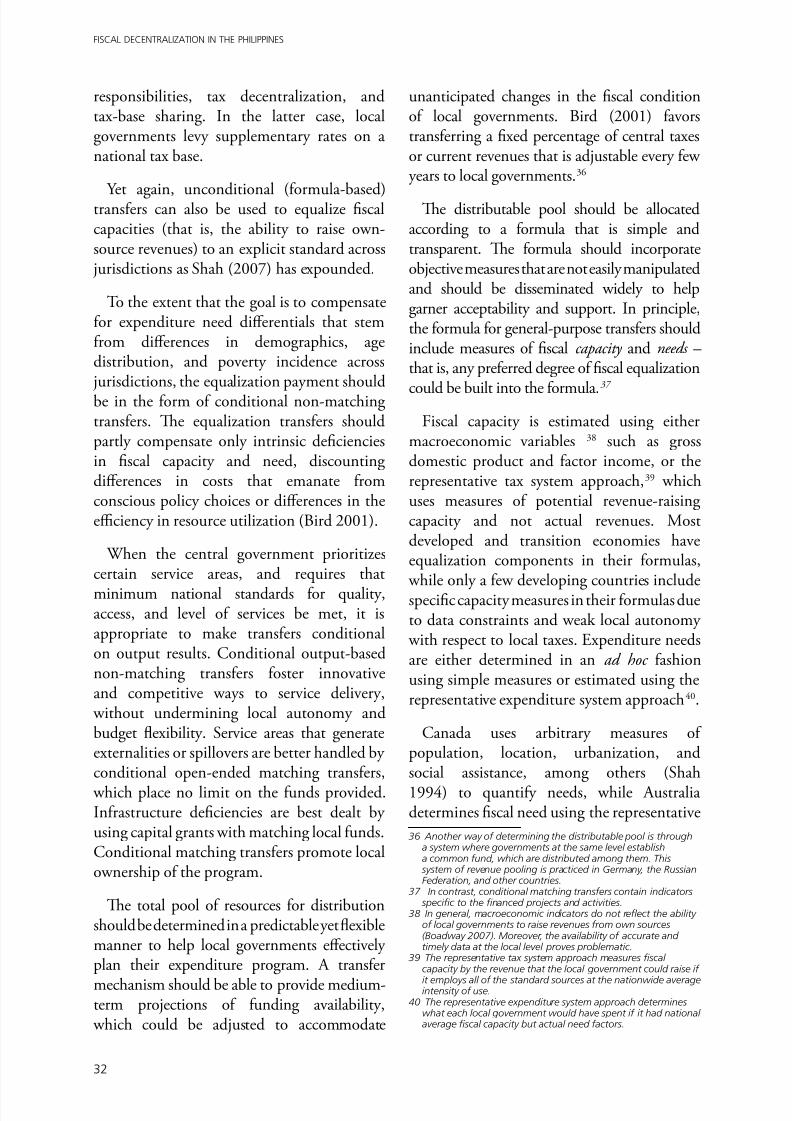
8/12/2019 Fiscal Decentralisation in Philippines
http://slidepdf.com/reader/full/fiscal-decentralisation-in-philippines 40/56
32
FISCAL DECENTRALIZATION IN THE PHILIPPINES
responsibilities, tax decentralization, andtax-base sharing. In the latter case, localgovernments levy supplementary rates on anational tax base.
Yet again, unconditional (formula-based)transfers can also be used to equalize fiscalcapacities (that is, the ability to raise own-source revenues) to an explicit standard across
jurisdictions as Shah (2007) has expounded.
o the extent that the goal is to compensatefor expenditure need differentials that stemfrom differences in demographics, agedistribution, and poverty incidence across
jurisdictions, the equalization payment shouldbe in the form of conditional non-matchingtransfers. Te equalization transfers shouldpartly compensate only intrinsic deficienciesin fiscal capacity and need, discountingdifferences in costs that emanate fromconscious policy choices or differences in theefficiency in resource utilization (Bird 2001).
When the central government prioritizescertain service areas, and requires that
minimum national standards for quality,access, and level of services be met, it isappropriate to make transfers conditionalon output results. Conditional output-basednon-matching transfers foster innovativeand competitive ways to service delivery,
without undermining local autonomy andbudget flexibility. Service areas that generateexternalities or spillovers are better handled byconditional open-ended matching transfers,
which place no limit on the funds provided.Infrastructure deficiencies are best dealt byusing capital grants with matching local funds.Conditional matching transfers promote localownership of the program.
Te total pool of resources for distributionshould be determined in a predictable yet flexiblemanner to help local governments effectivelyplan their expenditure program. A transfer
mechanism should be able to provide medium-term projections of funding availability,
which could be adjusted to accommodate
unanticipated changes in the fiscal conditionof local governments. Bird (2001) favorstransferring a fixed percentage of central taxesor current revenues that is adjustable every fewyears to local governments.36
Te distributable pool should be allocatedaccording to a formula that is simple andtransparent. Te formula should incorporateobjective measures that are not easily manipulatedand should be disseminated widely to helpgarner acceptability and support. In principle,the formula for general-purpose transfers shouldinclude measures of fiscal capacity and needs –that is, any preferred degree of fiscal equalization
could be built into the formula. 37
Fiscal capacity is estimated using eithermacroeconomic variables 38 such as grossdomestic product and factor income, or therepresentative tax system approach,39 whichuses measures of potential revenue-raisingcapacity and not actual revenues. Mostdeveloped and transition economies haveequalization components in their formulas,
while only a few developing countries includespecific capacity measures in their formulas dueto data constraints and weak local autonomy
with respect to local taxes. Expenditure needsare either determined in an ad hoc fashionusing simple measures or estimated using therepresentative expenditure system approach40.
Canada uses arbitrary measures ofpopulation, location, urbanization, andsocial assistance, among others (Shah1994) to quantify needs, while Australiadetermines fiscal need using the representative
36 Another way of determining the distributable pool is througha system where governments at the same level establisha common fund, which are distributed among them. This
system of revenue pooling is practiced in Germany, the RussianFederation, and other countries.
37 In contrast, conditional matching transfers contain indicators specific to the financed projects and activities.
38 In general, macroeconomic indicators do not reflect the abilityof local governments to raise revenues from own sources(Boadway 2007). Moreover, the availability of accurate andtimely data at the local level proves problematic.
39 The representative tax system approach measures fiscalcapacity by the revenue that the local government could raise if
it employs all of the standard sources at the nationwide averageintensity of use.40 The representative expenditure system approach determines
what each local government would have spent if it had nationalaverage fiscal capacity but actual need factors.

8/12/2019 Fiscal Decentralisation in Philippines
http://slidepdf.com/reader/full/fiscal-decentralisation-in-philippines 41/56
33
CHAPTER 4INTERGOVERNMENTAL FISCAL TRANSFERS
expenditure system approach as part of itsfiscal equalization program.
Clearly, ad hoc or discretionary transfers arenot advisable. In Canada and Germany, both
the resource pool and its distribution are basedon a formula, as opposed to the arbitrarydetermination of the distributable resourcepool by the central government through anact of parliament in Australia and Switzerland(Shah 2007).
As a general rule, there is room for bothgeneral-purpose and specific-purpose transfers(Smart 2007). General-purpose transfersmay incorporate fiscal equalization: transfersshould be inversely proportional to fiscalcapacity and vary directly with fiscal needfactors. However, only a handful of countrieschoose to implement a comprehensive fiscalequalization program, despite the generalconsensus in the academic literature thatit enables local governments to provide astandard package of public services with astandard level of taxes on the bases at its
disposal. Most countries only opt for a fiscalcapacity equalization program due to its relativetransparency and achievability. Fiscal needequalization, though important, necessitatesusing subjective judgments and inexactanalytical methods. Rather than implement itas part of a comprehensive fiscal equalizationprogram, fiscal needs compensation is betterachieved through conditional output-basednon-matching transfers for merit goods,
as practiced in many industrial countries(Boadway and Shah 2007).
Te point made by Boadway and Shah (2007)on the basic tasks in transfer design aboutmaking local governments fully accountable
to their citizens for the actions they undertake– at least at the margin of decision-making iscrucial. Te basic challenge in transfer designis thus how to provide local governments
with sufficient fiscal transfers or block grants
to carry out responsibilities devolved to them without generating perverse incentives to localgovernment behavior. Tere is good case formatching transfers with local contributionsor counterpart funding to create a sense ofownership and thus, encourage accountabilityof local governments. Moreover, a well-designed transfer system should be able toaccord budgetary flexibility and autonomy insetting priorities to local governments.
Philippine internal revenueallotment
Fiscal decentralization leads to the transferof responsibility for delivery of certain publicgoods to local government units, whichtypically may not be adequately covered bylocal revenues (Bird and Rodriguez, 1999)41.
Te enactment of the 1991 Local GovernmentCode has resulted in a remarkable increase inthe size and composition of central governmenttransfers to local government units. Te localgovernments in the Philippines heavily relieson the internal revenue allotment (IRA)or central government transfers to LGUs,to close the vertical fiscal gap. Figure 17shows how the internal revenue allotment(the intergovernmental fiscal transfer) is
transferred from the central government to thelocal government units.
41 Source: Department of Budget and Management website( http://www.dbm.gov.ph/ira.php )
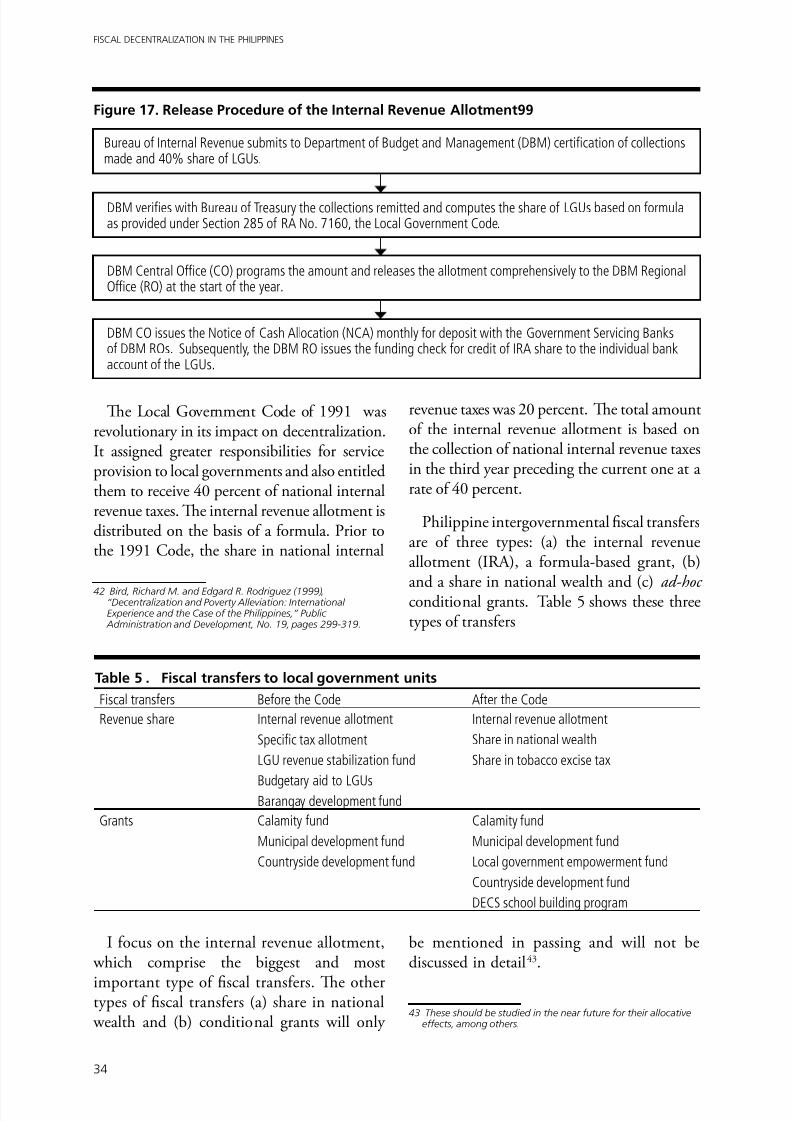
8/12/2019 Fiscal Decentralisation in Philippines
http://slidepdf.com/reader/full/fiscal-decentralisation-in-philippines 42/56
34
FISCAL DECENTRALIZATION IN THE PHILIPPINES
Te Local Government Code of 1991 wasrevolutionary in its impact on decentralization.It assigned greater responsibilities for serviceprovision to local governments and also entitledthem to receive 40 percent of national internalrevenue taxes. Te internal revenue allotment isdistributed on the basis of a formula. Prior tothe 1991 Code, the share in national internal
42 Bird, Richard M. and Edgard R. Rodriguez (1999),“Decentralization and Poverty Alleviation: InternationalExperience and the Case of the Philippines,” Public
Administration and Development, No. 19, pages 299-319.
revenue taxes was 20 percent. Te total amountof the internal revenue allotment is based onthe collection of national internal revenue taxesin the third year preceding the current one at arate of 40 percent.
Philippine intergovernmental fiscal transfersare of three types: (a) the internal revenueallotment (IRA), a formula-based grant, (b)
and a share in national wealth and (c) ad-hoc conditional grants. able 5 shows these threetypes of transfers
Figure 17. Release Procedure of the Internal Revenue Allotment99
Table 5 . Fiscal transfers to local government units
Fiscal transfers Before the Code After the Code
Revenue share Internal revenue allotment
Specific tax allotment
LGU revenue stabilization fund
Budgetary aid to LGUsBarangay development fund
Internal revenue allotment
Share in national wealth
Share in tobacco excise tax
Grants Calamity fund
Municipal development fund
Countryside development fund
Calamity fund
Municipal development fund
Local government empowerment fund
Countryside development fund
DECS school building program
Bureau of Internal Revenue submits to Department of Budget and Management (DBM) certification of collectionsmade and 40% share of LGUs.
DBM verifies with Bureau of Treasury the collections remitted and computes the share of LGUs based on formulaas provided under Section 285 of RA No. 7160, the Local Government Code.
DBM Central Office (CO) programs the amount and releases the allotment comprehensively to the DBM RegionalOffice (RO) at the start of the year.
DBM CO issues the Notice of Cash Allocation (NCA) monthly for deposit with the Government Servicing Banksof DBM ROs. Subsequently, the DBM RO issues the funding check for credit of IRA share to the individual bankaccount of the LGUs.
I focus on the internal revenue allotment, which comprise the biggest and most
important type of fiscal transfers. Te othertypes of fiscal transfers (a) share in national
wealth and (b) conditional grants will only
be mentioned in passing and will not bediscussed in detail43.
43 These should be studied in the near future for their allocativeeffects, among others.
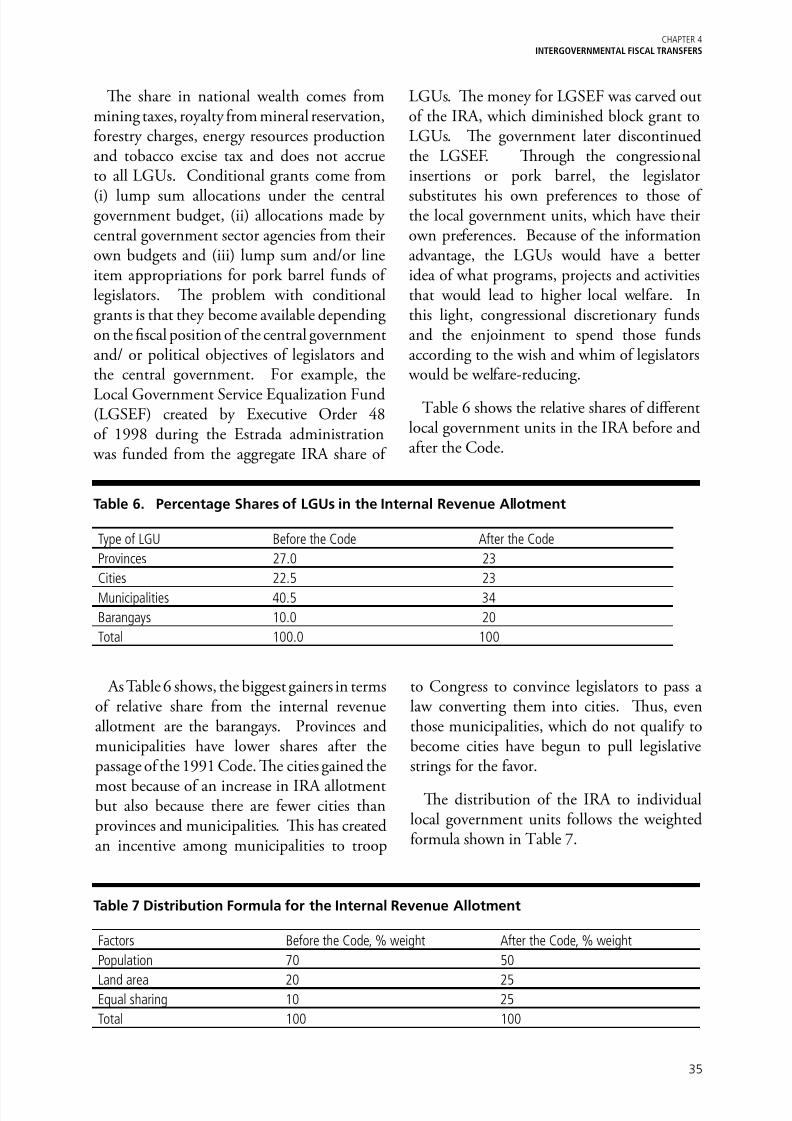
8/12/2019 Fiscal Decentralisation in Philippines
http://slidepdf.com/reader/full/fiscal-decentralisation-in-philippines 43/56
35
CHAPTER 4INTERGOVERNMENTAL FISCAL TRANSFERS
Te share in national wealth comes frommining taxes, royalty from mineral reservation,forestry charges, energy resources productionand tobacco excise tax and does not accrueto all LGUs. Conditional grants come from
(i) lump sum allocations under the centralgovernment budget, (ii) allocations made bycentral government sector agencies from theirown budgets and (iii) lump sum and/or lineitem appropriations for pork barrel funds oflegislators. Te problem with conditionalgrants is that they become available dependingon the fiscal position of the central governmentand/ or political objectives of legislators andthe central government. For example, the
Local Government Service Equalization Fund(LGSEF) created by Executive Order 48of 1998 during the Estrada administration
was funded from the aggregate IRA share of
LGUs. Te money for LGSEF was carved outof the IRA, which diminished block grant toLGUs. Te government later discontinuedthe LGSEF. Trough the congressionalinsertions or pork barrel, the legislator
substitutes his own preferences to those ofthe local government units, which have theirown preferences. Because of the informationadvantage, the LGUs would have a betteridea of what programs, projects and activitiesthat would lead to higher local welfare. Inthis light, congressional discretionary fundsand the enjoinment to spend those fundsaccording to the wish and whim of legislators
would be welfare-reducing.
able 6 shows the relative shares of differentlocal government units in the IRA before andafter the Code.
Table 6. Percentage Shares of LGUs in the Internal Revenue Allotment
Type of LGU Before the Code After the Code
Provinces 27.0 23
Cities 22.5 23
Municipalities 40.5 34
Barangays 10.0 20
Total 100.0 100
As able 6 shows, the biggest gainers in termsof relative share from the internal revenueallotment are the barangays. Provinces andmunicipalities have lower shares after thepassage of the 1991 Code. Te cities gained the
most because of an increase in IRA allotmentbut also because there are fewer cities thanprovinces and municipalities. Tis has createdan incentive among municipalities to troop
to Congress to convince legislators to pass alaw converting them into cities. Tus, eventhose municipalities, which do not qualify tobecome cities have begun to pull legislativestrings for the favor.
Te distribution of the IRA to individuallocal government units follows the weightedformula shown in able 7.
Table 7 Distribution Formula for the Internal Revenue Allotment
Factors Before the Code, % weight After the Code, % weight
Population 70 50
Land area 20 25Equal sharing 10 25
Total 100 100
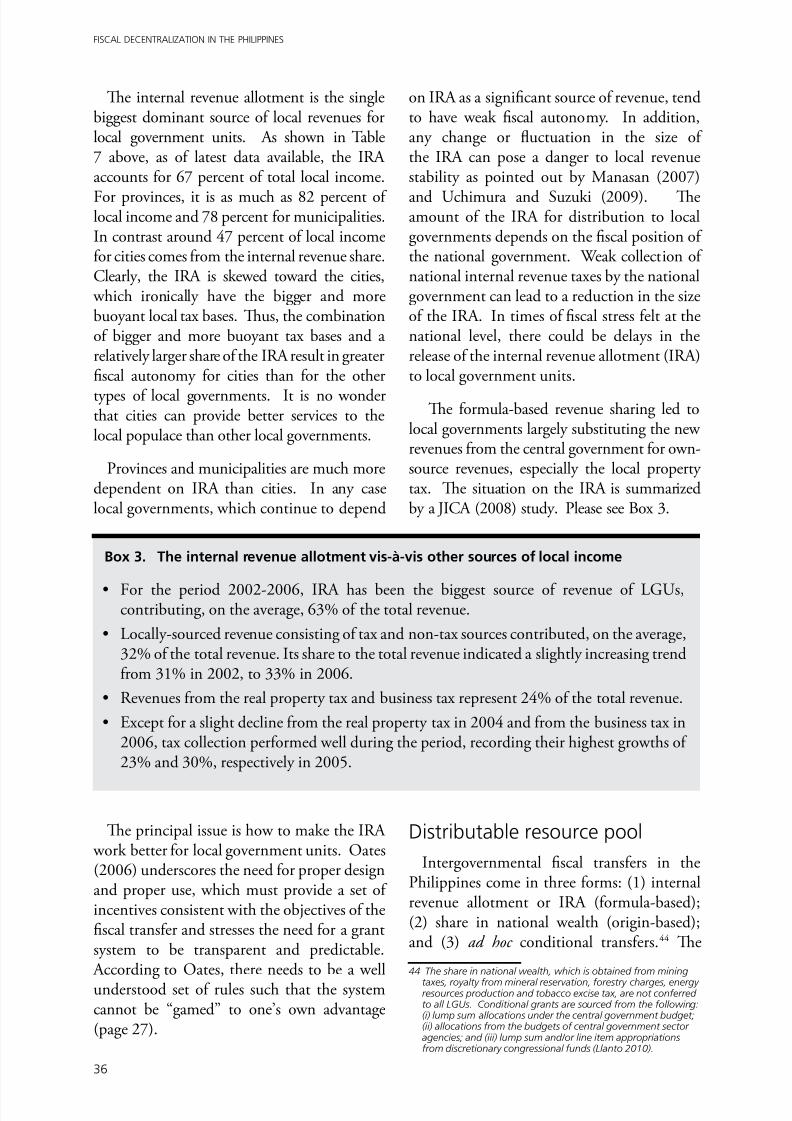
8/12/2019 Fiscal Decentralisation in Philippines
http://slidepdf.com/reader/full/fiscal-decentralisation-in-philippines 44/56
36
FISCAL DECENTRALIZATION IN THE PHILIPPINES
Te internal revenue allotment is the singlebiggest dominant source of local revenues forlocal government units. As shown in able7 above, as of latest data available, the IRAaccounts for 67 percent of total local income.
For provinces, it is as much as 82 percent oflocal income and 78 percent for municipalities.In contrast around 47 percent of local incomefor cities comes from the internal revenue share.Clearly, the IRA is skewed toward the cities,
which ironically have the bigger and morebuoyant local tax bases. Tus, the combinationof bigger and more buoyant tax bases and arelatively larger share of the IRA result in greaterfiscal autonomy for cities than for the other
types of local governments. It is no wonderthat cities can provide better services to thelocal populace than other local governments.
Provinces and municipalities are much moredependent on IRA than cities. In any caselocal governments, which continue to depend
on IRA as a significant source of revenue, tendto have weak fiscal autonomy. In addition,any change or fluctuation in the size ofthe IRA can pose a danger to local revenuestability as pointed out by Manasan (2007)
and Uchimura and Suzuki (2009). Teamount of the IRA for distribution to localgovernments depends on the fiscal position ofthe national government. Weak collection ofnational internal revenue taxes by the nationalgovernment can lead to a reduction in the sizeof the IRA. In times of fiscal stress felt at thenational level, there could be delays in therelease of the internal revenue allotment (IRA)to local government units.
Te formula-based revenue sharing led tolocal governments largely substituting the newrevenues from the central government for own-source revenues, especially the local propertytax. Te situation on the IRA is summarizedby a JICA (2008) study. Please see Box 3.
Box 3. The internal revenue allotment vis-à-vis other sources of local income
• For the period 2002-2006, IRA has been the biggest source of revenue of LGUs,contributing, on the average, 63% of the total revenue.
• Locally-sourced revenue consisting of tax and non-tax sources contributed, on the average,32% of the total revenue. Its share to the total revenue indicated a slightly increasing trendfrom 31% in 2002, to 33% in 2006.
• Revenues from the real property tax and business tax represent 24% of the total revenue.
• Except for a slight decline from the real property tax in 2004 and from the business tax in2006, tax collection performed well during the period, recording their highest growths of23% and 30%, respectively in 2005.
Te principal issue is how to make the IRA work better for local government units. Oates(2006) underscores the need for proper designand proper use, which must provide a set ofincentives consistent with the objectives of thefiscal transfer and stresses the need for a grantsystem to be transparent and predictable.
According to Oates, there needs to be a wellunderstood set of rules such that the systemcannot be “gamed” to one’s own advantage(page 27).
Distributable resource pool
Intergovernmental fiscal transfers in thePhilippines come in three forms: (1) internalrevenue allotment or IRA (formula-based);(2) share in national wealth (origin-based);and (3) ad hoc conditional transfers.44 Te
44 The share in national wealth, which is obtained from mining
taxes, royalty from mineral reservation, forestry charges, energyresources production and tobacco excise tax, are not conferredto all LGUs. Conditional grants are sourced from the following:(i) lump sum allocations under the central government budget;(ii) allocations from the budgets of central government sectoragencies; and (iii) lump sum and/or line item appropriationsfrom discretionary congressional funds (Llanto 2010).
8/12/2019 Fiscal Decentralisation in Philippines
http://slidepdf.com/reader/full/fiscal-decentralisation-in-philippines 45/56
37
CHAPTER 4INTERGOVERNMENTAL FISCAL TRANSFERS
IRA is the major transfer bestowed by thecentral government to the LGUs as a fixedshare (40 percent) of actual internal revenuetax collections of the central government threeyears prior to the current year. Tis tax-sharing
arrangement45 adopted in the Philippines hasthe advantage of guaranteeing LGUs a suresource of revenue, while leaving room for fiscalautonomy 46. Just as important as increasingthe size of the IRA, its predictability helpsLGUs program and manage their expenditureseffectively.
On the downside, this type of revenuesharing, that is, the IRA creates disincentives
to both the central government and the localgovernment. Manasan (1995) finds that theIRA substituted for local tax revenues in eachtier of local government in 1992 and 1993,
while it had a neutral effect on local revenueperformance prior to the Code (1985).
On the part of the central government,the IRA represents a substantial cut fromthe resources that are finally made available
to it after deducting payments for principaland interest charges of various foreign loans.Te relatively low tax effort on the part of thecentral government leaves a relatively thinmargin of resources for financing nationalgovernment development programs andprojects.
Terefore, the proposal by the Senate to widen the distributable pool by tapping intoall national taxes and not only the internalrevenue taxes (Senate Bill 118) should be
weighed in the light of its effects on localautonomy and incentives, and also on centralgovernment fiscal behavior. Te emergingview is that the percentage share will beincreased from 40 percent to 50 percent ofnational internal revenue taxes. One variationof this view is that the incremental 10 percent
45 Tax sharing is a type of revenue sharing where the central
government collects and shares its revenue (the IRA in the caseof the Philippines) with the LGUs. The second type is tax base
sharing in which the higher-level government sets the tax baseand lower levels either piggyback or charge supplementaryrates on higher-level government taxes.
46 Assuming that the local government units will be serious aboutraising own-source revenues.
should be distributed to local governmentsaccording to performance. Policy makershave yet to agree on what the performanceindicators would look like.
An alternative to tax sharing could betax base sharing, in which several levels ofgovernment share the same tax base. However,tax base sharing can lead to tax disharmony,higher compliance costs, and distortions infiscal policy progressivity, and if the sharingis not properly designed. Hence, revenuedecentralization (through tax base sharing) toenhance accountability comes at the price ofefficiency and equity. Tis alternative needs
careful study.
Te upshot is that tax harmonization schemescould be instituted without stripping LGUs ofthe accountability to decide on the amountof own-source revenues to be raised. Whilesuch harmonization would not completelyeliminate unhealthy tax competition or taxexporting, it would certainly diminish thecomplexity of the tax system and thwart more
detrimental forms of fiscal competition suchas sector-specific taxes or subsidies. Canadahas been successful in harmonizing its taxsystem because tax abatement at the centrallevel gave room to sub-national governmentsto levy supplementary rates on the nationaltax base.
Te choice of the appropriate type of revenue-sharing system has to consider issues of impacton fiscal autonomy, incentives, efficiency,and equity. Under a tax-base sharing system,it is important that the central governmentregulate intergovernmental competition forthe sake of efficiency and equity in resourceallocation. Although tax base sharing couldonly be used for destination-based taxes, itis instrumental in getting to the bottom ofboth vertical and horizontal fiscal gaps, whileallowing LGUs fiscal autonomy. ax basesharing that incorporates an equalizationformula is less targeted than unconditionaltransfers (from tax sharing).
8/12/2019 Fiscal Decentralisation in Philippines
http://slidepdf.com/reader/full/fiscal-decentralisation-in-philippines 46/56
38
FISCAL DECENTRALIZATION IN THE PHILIPPINES
Distributive and allocativeformula
wo of the most contentious issues in theIRA debate are the proportion of national
revenues (the IRA) to be shared by the nationalgovernment with LGUs, and the formula forthe allocation of transfers.
On the first issue, there are proposals toincrease the size of the IRA from 40 percentto 50 percent of national internal revenuetaxes by the various leagues of government, orto even as high as 60 percent by the Senate(Senate Bill 8). Tese proposals have to take
into account the disincentive effect of simplyincreasing the size of the IRA transfer fromits current level. Simply increasing the sizeof the IRA will not automatically close thevertical fiscal gap because of the demonstratedincentive of LGUs to substitute it for own-source revenues, which will erode the gainsfrom an increased transfer. A variant of thisproposal is to award incremental IRA overand above the current levels conditional to
local government performance. A conditionaltransfer of incremental amounts could betied to some measure of performance, e.g.,demonstrated increase in local own-sourcerevenue effort, better local expendituremanagement, and others. A matching effortto improve governance, make more efficientprocurement, better management of the localenvironment by the local governments maybe used to justify a share in the envisaged
incremental IRA.
Currently, the IRA is distributed to LGUsaccording to this formula: population (50percent); land area (25 percent); and equalshare (25 percent). Tere are proposals toinclude additional variables in the formulasuch as poverty index, municipal waters aspart of the LGU “territory”, which will be inaddition to “land” as an item in the formula,
revenue capacity, and fiscal effort. Adding“municipal coastal waters” to the distributionformula is a ploy to increase the size of the
LGU territory arising from the combinationof the land and municipal coastal waters.Te proponents believe that a redefinition of“land” to include coastal waters will lead to anincrease in their share of the IRA.
As pointed out by several analysts, the IRAformula lacks an equalizing feature, that is,measures of fiscal capacity and fiscal need.Legislators may have chosen proxy indicatorssuch as population, land area and equal sharingto stand for fiscal need. Size of the populationand land area tend to bias the share in the IRAin favor of cities, which as earlier shown, enjoybroader taxing powers and a more revenue
buoyant tax base.
A proposed change to the IRA distributionformula is to increase the weight given toequal sharing, which has increased from 10percent to 25 percent under the 1991 Code.Te proposal ignores the heterogeneity oflocal government units with vast differences inresources available and needs.
At present, the IRA formula does not include
fiscal capacity measures either, promptinga proposal to include fiscal effort into theequation. Fiscal effort is hard to measure,and even if it could be calculated in a reliablefashion, incorporating it in the IRA equation
would pose some difficulties (See Shah 2007for a complete treatment). An example wouldbe the incentives it would have on LGUs,especially the poor ones47, to impose highertaxes so as to profit from larger transfers.Te poor LGUs have smaller or weaker taxbases because of weak local economies, andemigration of the local population, mostlythe young and educated to the richer (that is,higher income) LGUs and to foreign countries
where job opportunities are present. Tisdoes not mean that the design of the fiscaltransfer should exclude fiscal or tax effort as adeterminant. It is certainly useful to consider
47 The ‘poor’ LGUs are those belonging to the 4th to the 6th income class and are mostly municipalities. The Bureau ofLocal Government Finance of the Department of Finance has sixincome classification of local government units.

8/12/2019 Fiscal Decentralisation in Philippines
http://slidepdf.com/reader/full/fiscal-decentralisation-in-philippines 47/56
39
CHAPTER 4INTERGOVERNMENTAL FISCAL TRANSFERS
it but designing a distribution formula thatresponds to fiscal need especially of thelower income (poor) LGUs and at the sametime motivates them to mobilize significantamounts of own-source revenues is a very
challenging task.
Tere is a need for a thorough study ofall those proposals to arrive at the mostappropriate formula given the country’s socio-economic-political context. A haphazardformula without the benefit of an empirical
study may do more harm than good comparedto the present distribution formula.

8/12/2019 Fiscal Decentralisation in Philippines
http://slidepdf.com/reader/full/fiscal-decentralisation-in-philippines 48/56
40
FISCAL DECENTRALIZATION IN THE PHILIPPINES

8/12/2019 Fiscal Decentralisation in Philippines
http://slidepdf.com/reader/full/fiscal-decentralisation-in-philippines 49/56
41
CHAPTER 5LOCAL GOVERNMENT FINANCING
Te 1991 Code provides substantial48 borrowing powers to local government units.Tis is a radical departure from the pre-Code situation where they would need thepermission of the Department of Finance toincur borrowings. Te liberalization of LGUcredit markets has spurred lending by bothgovernment and private financial institutions.
Te 1991 Code has also allowed localgovernment units to float debt instrumentssuch as bonds and a few local governmentunits have actually ventured into tapping thecapital markets to finance revenue-generatingprojects.
However, despite the liberalization of LGUcredit markets, policy makers imposed certainlimitations to LGU borrowing powers: (a)
local government units cannot issue generalpurpose bonds, (b) debt service should notexceed 20 percent of their regular income,(c) they must budget for due debt service,(d) final clearance on bond flotation mustbe given by the central bank, which underthe New Central Bank Act must renderan opinion on the impact of the proposedbond flotation on monetary aggregates, theprice level, and the balance of payments, (e)
the central government does not provide asovereign guarantee to LGU borrowings. oborrow from any lending institution, localgovernments have to get a certification of theirborrowing and debt service capacity from theBureau of Local Government Finance of theDepartment of Finance.
Te principal sources of credit financingare government financial institutions: the
48 A more detailed discussion is given in Llanto, Gilbertoand others (1998). Local Government Units’ Access to thePrivate Capital Markets. Makati City: Philippine Institute forDevelopment Studies.
Land Bank of the Philippines, (the dominantlending institution), Development Bankof the Philippines and two specializedcredit institutions, the Local Water Utilities
Administration (LWUA)49 and the MunicipalDevelopment Fund Office (MDFO)50. Itis noted that these government lendinginstitutions have mostly used loans provided
from official development assistance bydonor institutions such as the World Bank,
Asian Development Bank, and the JapanInternational Cooperation Agency to financeLGU programs and projects.
Te LGU credit markets is dominated byloans from government lending institutionsbut recently it is reported that a few privatecommercial banks have started to lend to a
select group of local government units, that isthose belonging to the first and second incomeclass. Available data from the Bureau of LocalGovernment Finance and government lendinginstitutions indicate total LGU outstandingdebts of around Peso 68.02 billion as ofSeptember 2010, of which close to 86 percentare from government lending institutions.
Tere have been a few LGU bonds issued tothe public. Tis mode of financing failed tocatch on due primarily to the underdevelopednature of the Philippine domestic bondmarket, and also because the governmentlending institutions, using ODA funds, havemanaged to provide lower cost credit to localgovernment units. Data from the LocalGovernment Unit Guarantee Corporation(LGUGC), a private corporation that insuresbond issuances of local government units,
49 LGUs, which organize water districts, can borrow from LWUA.50 The MDFO is a unit under the Department of Finance, which is
used to channel official development assistance (ODA) to local governments. It caters mostly to the lower-income LGUs.
CHAPTER 5 LOCAL GOVERNMENT FINANCING48

8/12/2019 Fiscal Decentralisation in Philippines
http://slidepdf.com/reader/full/fiscal-decentralisation-in-philippines 50/56
42
FISCAL DECENTRALIZATION IN THE PHILIPPINES
indicate a total of Pesos 3.25 billion pesos worth of bonds issued by sixteen LGUs from1999 to 201051.
Overall, local government units have a
small appetite for credit financing withthe exception of a relatively small number, which have tapped both loans and bonds forfinancing various local projects. Te emergingLGU bond market has been effectively stifledby the availability of cheaper loans providedby government lending institutions. Onthe other hand, the interest expressed by afew private commercial banks in lending tolocal governments belonging to the first and
second income class is a good signal becausecompetition in credit markets is bound tobenefit the local government units in terms oflower cost credit and better service by lenders.
51 The LGUGC was organized by the Development Bank of thePhilippines (a government bank) and several private commercialbanks in 1997.
Te main issue is the reluctance ofgovernment banks to move from theirmonopoly (or more accurately, oligopoly)position in LGU credit markets. Tey havediscovered that LGU lending is very profitable
and almost risk-free because of the IRA-intercept wherein LGUs can pledge theirIRA as security for a loan. If they default ontheir loan amortization, the government bankcan seize the IRA. Tis privilege is accordedonly to government banks because they arethe designated depository banks for localgovernment units. Tere have been calls toallow private banks to also be designated asdepository banks, which will start a financial
relationship between them and the localgovernment units. Te financial relationship
will help deal with the information problemthat private banks have with local governmentunits, and thus encourage private banklending. Tis is a policy issue that should beaddressed by policy makers.
8/12/2019 Fiscal Decentralisation in Philippines
http://slidepdf.com/reader/full/fiscal-decentralisation-in-philippines 51/56
43
CHAPTER 6CONCLUSIONS AND RECOMMENDATIONS
CHAPTER 6 CONCLUSIONS ANDRECOMMENDATIONS
In conclusion, decentralization anddevolution have ushered a radical approachto steering Philippine development.Decentralization was done both on thepolitical and fiscal fronts. Tis paperprovided an overview of the situation of fiscaldecentralization in the Philippines.
Local governments have been given broadtaxing, spending and borrowing powers, whichthey have utilized to discharge the functionsand responsibilities that have been devolvedto them. Overall, it seems that there havebeen some improvements in service deliveryas indicated by the increase in local spendingfor various public goods and services. Teexpenditure assignment seems appropriatealthough there is a room for reform when it
comes to the need for a clearer delineation ofpublic expenditure responsibilities betweenthe central government and local governmentunits, especially in the fields of health,education, environment and natural resourcemanagement. Tere is also a case of moreefficient local public expenditure management.
Te tax assignment is also in order but thedrawback is that the more productive taxes
have not been assigned to local governmentunits. Te 1991 Code has set certain limitson the taxing powers of local governments and
has somewhat diminished the taxing power ofprovinces in favor of cities. Tere is a needto review the tax assignment in view of thevertical and horizontal fiscal gaps as shown bythe data.
Tere is also a great need to reviewthe policy and distribution formula for
intergovernmental fiscal transfers, basicallythe internal revenue allotment. It is not anefficient formula in the sense that it fails toaddress issues of local fiscal capacities andfiscal needs. Performance-based grantsseem to open pathways for instilling greateraccountability on the part of local governmentunits. At present, the central government anddonors are collaborating on the installationand implementation of performance-based
grants, which seems to have found resonanceamong the more progressive local governmentunits.
Tere is a case for policy reforms in LGUfinancing and credit markets to make it morecompetitive. Official development assistancecould be used to catalyze greater participationof private commercial banks in the LGU creditmarkets. Addressing risks and information
asymmetry will build confidence in LGU debtinstruments.

8/12/2019 Fiscal Decentralisation in Philippines
http://slidepdf.com/reader/full/fiscal-decentralisation-in-philippines 52/56
44
FISCAL DECENTRALIZATION IN THE PHILIPPINES

8/12/2019 Fiscal Decentralisation in Philippines
http://slidepdf.com/reader/full/fiscal-decentralisation-in-philippines 53/56
45
BIBLIOGRAPHY
Asian Development Bank (2005), Decentralization in the Philippines: Strengthening LocalGovernment Financing & Resource Management in the Short erm, Mandaluyong City: AsianDevelopment Bank
Atienza, Maria Ela (2006), “Local Governments and Devolution in the Philippines,” in NoelMorada and eresa Encarnacion, editors, Philippine Politics and Governance: An Introduction,Department of Political Science, University of the Philippines.
Bird, Richard M. and Edgard R. Rodriguez (1999), “Decentralization and Poverty Alleviation:
International Experience and the Case of the Philippines,” Public Administration and Development ,No. 19, pages 299-319.
Bird, Richard M., and Michael Smart. 2001. “Intergovernmental Fiscal ransfers: SomeLessons from International Experience.” Canada: University of oronto.
Boadway, Robin B., and Anwar Shah. 2007. “Intergovernmental Fiscal ransfers: Principlesand Practice.” Public Sector Governance and Accountability Series , Washington: World Bank.
Brillantes, Alex, Gilberto M. Llanto, James Alm and Gaudioso Sosmena (2009),“Decentralization and Devolution in the Philippines: Status, riumphs, ests and Directions,”Report submitted to the Department of the Interior and Local Government, unpublished paper,
April 29
Ebel, Robert and Serdar Yilmaz (2002), “On the Measurement and Impact of FiscalDecentralization,” Policy Research Working Paper 2809, Te World Bank, March;
Guevara, Milwida (2004), “Te Fiscal Decentralization Process in the Philippines: Lessonsfrom Experience,” http://www.econ.hit-u.ac.jp/~kokyo/APPPsympo04/PDF-papers-nov/guevara-i2004-revised2.pdf, date accessed August 29, 2011.
Joumard, Isabelle and Per Mathis Kongsrud. 2003. “Fiscal relations across government levels.”Economics Department Working Papers No. 375, Organization for Economic Cooperation andDevelopment, December 10.
Llanto, Gilberto M., Rosario Manasan, Mario Lambert and Jamie Laya (1998), LocalGovernment Units’ Access to the Private Capital Markets , Makati City: Philippine Institute forDevelopment Studies.
Llanto, Gilberto M. (2009) “Decentralization, Local Finance Reforms and New Challenges:Te Philippines,” a paper presented at the Tird Symposium on Decentralization and LocalFinance at the Institute for Comparative Studies in Local Governance (COSLOG), National
Graduate Institute for Policy Studies, okyo, Japan on March 10.
Llanto, Gilberto M. and Francis Quimba (2010), “Decentralization and Local Service
BIBLIOGRAPHY

8/12/2019 Fiscal Decentralisation in Philippines
http://slidepdf.com/reader/full/fiscal-decentralisation-in-philippines 54/56
46
FISCAL DECENTRALIZATION IN THE PHILIPPINES
Delivery,” paper prepared for the Local Government Foundation, unpublished.
Loehr, W. and R. Manasan (1999), “Fiscal Decentralization and Economic Efficiency:Measurement and Evaluation,” CAER II Discussion Paper No. 38, Harvard Institute forInternational Development, Cambridge, M.A.
Manasan, Rosario G. 2005. “Local Public Finance in the Philippines: lessons in autonomyand accountability.” Philippine Journal of Development . Second Semester 2005, Vol. XXXII No.2: 32-102.
Manasan, Rosario G. 2007a. “Decentralization and the Financing of Regional Development.”Te Dynamics of Regional Development: Te Philippines in East Asia. Ed. Arsenio M. Balisacanand Hal Hill. Asian Development Bank Institute. Manila: Edward Elgar Publishing Ltd. and
Ateneo de Manila University Press.
Manasan, Rosario G. 200b7. “IRA Design Issues and Challenges.” Policy Notes No. 2007-09.Philippines: Philippine Institute for Development Studies, December.
Oates, Wallace (1996), “Comment on ‘Conflicts and Dilemmas of Decentralization’ by RudolfHommes,” in Bruno, Michael and Boris Pleskovic, editors, Annual World Bank Conference onDevelopment Economics, Washington, D.C.: Te World Bank, pages 351-353.
Oates, Wallace (2006), “On the Teory and Practice of Fiscal Decentralization,” IFIR WorkingPaper No. 2006-05, May; Oates, Wallace E. 1972. Fiscal Federalism. New York: Harcourt Brace
Jovanovich
anzi, Vito (1996), “Fiscal Federalism and Decentralization: A Review of Some Efficiency andMacroeconomic Aspects,” in Bruno, Michael and Boris Pleskovic, editors, Annual World BankConference on Development Economics, Washington, D.C.: Te World Bank, pages 295-316.
ayao, Edmund (2010), “Decentralization in the Philippines: Impact on Politics andGovernance,” unpublished paper, December 09.
Smoke, Paul (2001) “Fiscal Decentralization in Developing Countries: A Review of CurrentConcepts and Practice,” Democracy, Governance and Human Rights Programme Paper Number2, United Nations Research Institute for Social Development, February.
Uchimura, Hiroko and Yurika Suzuki (2009), “Measuring Fiscal Decentralization in thePhilippines,” IDE Discussion Paper No. 209, Institute of Developing Economies, July.

8/12/2019 Fiscal Decentralisation in Philippines
http://slidepdf.com/reader/full/fiscal-decentralisation-in-philippines 55/56
8/12/2019 Fiscal Decentralisation in Philippines
http://slidepdf.com/reader/full/fiscal-decentralisation-in-philippines 56/56
UNITED NATIONS HUMAN SETTLEMENTS PROGRAMME
This report examines the fiscal decentralisation experience inPhilippines. Since 1991, the central government has devolvedsignificant spending, taxing, and borrowing powers to localgovernments. This paper discusses fiscal decentralization in the
Philippines. It reviews the tax regimes in view of the verticaland horizontal fiscal gaps. Local governments receive inter-governmental fiscal transfer or block grants called the ‘internalrevenue allotment’ based on a formula that has population, landsize and equal sharing as criteria. In contrast, performance-basedgrants seem to open pathways for instilling greater accountabilityon the part of local governments. To make financing moreaccessible and competitive to local governments, it demonstratesthe need to pursue further reforms in credit markets.
HS/129/11EISBN Number(Series): 978-92-1-132027-5ISBN Number(Volume): 978-92-1-132414-3
THE GLOBAL URBAN ECONOMIC DIALOGUE SERIES