Fiscal Architecture Prof. Sally Wallace Georgia State University Atlanta, GA.
28
Fiscal Architecture Prof. Sally Wallace Georgia State University Atlanta, GA
-
Upload
dinah-mcdowell -
Category
Documents
-
view
215 -
download
0
Transcript of Fiscal Architecture Prof. Sally Wallace Georgia State University Atlanta, GA.

Fiscal Architecture
Prof. Sally WallaceGeorgia State University
Atlanta, GA

Plan for the Afternoon
Discuss the basis and uses of fiscal architecture
Discuss the implications of fiscal architecture
Analyze an exercise (simple example)
Discuss uses as training material, and additional considerations

The Central Issue
Ministry of Health needs to forecast expenditures for the next 2 budget years
Ministry of Health seeking aid for long-term assistance in prevention programs for chronic disease

Simple Forecast 2 years
2003 2004 2005
Current PC health expenditures 1,345
Projected increase in medical price index 6.00% 6.00%
Projected increase in general population 1.20% 1.20%
Projected expenditures all else constant $1,443 $1,548
Projected percent increase in expenditures, all else constant 7.27% 7.27%

What Else Affects the Forecast?
Health statusby ageby gender
Expected changes in health statusChanges in age distribution of the
populationAttitudes toward health education

Alternative Forecasts
1 2 3 4 5 6 7 8 9 10 11
Series3
Series2
Series1

Extraordinary Circumstances
Over the next 20 years, the incidence of cancer is expected to increase:
65 percent in Eastern Asia200 percent in Eastern Europe80 percent in South-Eastern
Asia

What is Fiscal Architecture?
Central components/characteristics of a country that influence a country’s public finances and ability to adapt to more general public policies:

Demographics
Age and age distributionFamily size and compositionHousehold compositionRacial/ethnic composition of populationPopulation growthUrbanizationEducationHealth status

Economics
Concentration of industriesForm of doing businessDistribution of economic activityComposition of incomeResource endowmentSize/type of economy

Components, con’t.
Institutions: property rights, intergovernmental fiscal relations, ability to change tax structure, mandates, discretion over expenditures
Political economy

Why does it matter? In general..
Affect on expenditures, a simple relationship:
Expi = Qg * Cg (1)
dExpi = dQg*Cg + Qg * dCg (2)
Qg= f(client population)

Why does it matter, con’t.
Revenue side,
Revi = (taxbasei * taxratei)*popi
dRevi = dtaxbase i*taxratei*popi + taxbasei*dtaxratei*popi + taxbasei*taxratei*dpopi
Why does it matter for policy? Budgeting all levels of government
Revenue forecasting – stability of long-term revenue
Meeting expenditure needs – mandated, non-discretionary
Implications for deficits

Why does it matter for policy? Intergovernmental issues
Revenue sharing (forecasts, capacity) Grants development, allocation
(measurement of needs, capacity)
Other policy initiatives Poverty alleviation Social programs

Some specific components
AgeTrends:
elderly population growingPotential impacts:
pension spending, consumption pattern changes, labor supplyOptions?
additional payroll taxesreduced pension benefits

Components, con’t. Economic Base
Trends: Differential changes over a variety of countries, some move away from agriculture
Potential Impacts: Tax handles may change, demand for certain types of infrastructure
Options? Could call for major changes in revenue bases, shift in public services

Other types of components Mobility Health Status Urban/rural split Income distribution

Illustrative Matrix to Identify Fiscal Architecture: Expenditure Needs
Education Water Supply Social Sector Primary Health Roads/ Other
(ec. transport
dev/other)
Demographics Population Urban/Rural Age Composition Migration Health
Economic structure Level,trends, changes: Agriculture Manufacturing Trade Etc.
Institutional Business regs. Local tax authority Spending rules

Illustrative Matrix To Identify Fiscal Architecture: Revenue Pressures
Independent Var. VAT Import Duties CIT PITOther
Demographics Population Urban/Rural Age Composition Migration Health
Economic structure Level,trends, changes: Agriculture Manufacturing Trade Etc.
Institutional Business regs. Local tax authority Spending rules

Policy Options Variable Trend Summary of fiscal
impact Summary of options
Demographic Changes Age Increasing
percentage of elderly
Reduced tax base, reducing revenue growth, increased expenditure pressure from social services and housing (depends on what is covered in the tax base)
Adjust payroll tax system for pension payments, increase age for full benefits, means test benefits, means test income tax exemptions Institutional issues: Ability to means test benefits, importance of voter behavior (do the elderly vote? Do they have a large impact?)
Age Increasing percentage of children
Increased health and education expenditures
Encourage local governments to consolidate schools where local control is significant, exam cost structure of schools, consider cost-reimbursement for some services based on ability to pay (income) Institutional issues: Constitutionality of access to education and health care, availability of local discretion over potential user fees and charges

Aging Example
Financing pensions out of payroll taxes: Pb*B = t*Pw*w
Pb is the number of pensioners, B is the benefit per
pensioner, t is the payroll tax rate, Pw is the number of workers and w is the average wage per worker

t = (Pb/Pw) * (B/w)
RHS: Dependency ratio—the ratio of pensioners to
working population and the replacement ratio—the ratio of average benefits paid to wages that supply the financing for the pension system
What happens as the population ages?

Data on dependency ratio2000 2025
Guatemala 10.3 12.7Ethiopia 9.1 7.6Impact on tax ratesOptions?
Payroll tax rate Benefits Privatization options

Exercise II: Expenditures on Education
Formula driven in many countries
iii
n
i
PopCFTEneedeExpenditur *)*(1

Education Example
Staff salaries/FTE Operations expenses/FTE School administration expenses/FTE Staff development expenses/FTE Facility operation expenses/FTE
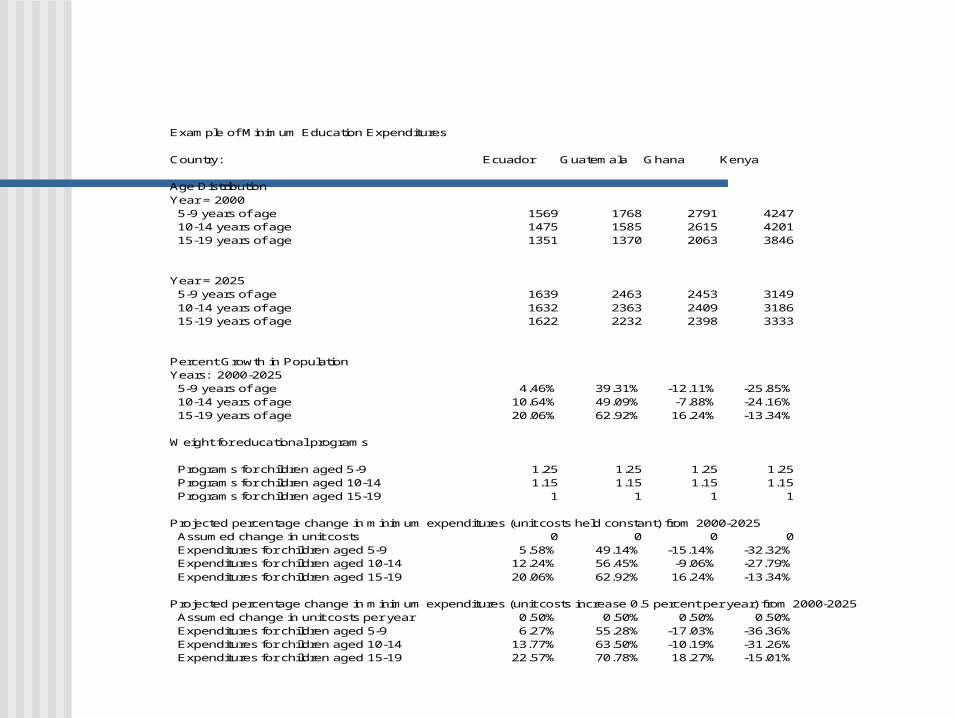
Example of Minimum Education Expenditures Country: Ecuador Guatemala Ghana Kenya Age Distribution Year = 2000 5-9 years of age 1569 1768 2791 4247 10-14 years of age 1475 1585 2615 4201 15-19 years of age 1351 1370 2063 3846 Year = 2025 5-9 years of age 1639 2463 2453 3149 10-14 years of age 1632 2363 2409 3186 15-19 years of age 1622 2232 2398 3333 Percent Growth in Population Years: 2000-2025 5-9 years of age 4.46% 39.31% -12.11% -25.85% 10-14 years of age 10.64% 49.09% -7.88% -24.16% 15-19 years of age 20.06% 62.92% 16.24% -13.34% Weight for educational programs Programs for children aged 5-9 1.25 1.25 1.25 1.25 Programs for children aged 10-14 1.15 1.15 1.15 1.15 Programs for children aged 15-19 1 1 1 1 Projected percentage change in minimum expenditures (unit costs held constant) from 2000-2025 Assumed change in unit costs 0 0 0 0 Expenditures for children aged 5-9 5.58% 49.14% -15.14% -32.32% Expenditures for children aged 10-14 12.24% 56.45% -9.06% -27.79% Expenditures for children aged 15-19 20.06% 62.92% 16.24% -13.34% Projected percentage change in minimum expenditures (unit costs increase 0.5 percent per year) from 2000-2025 Assumed change in unit costs per year 0.50% 0.50% 0.50% 0.50% Expenditures for children aged 5-9 6.27% 55.28% -17.03% -36.36% Expenditures for children aged 10-14 13.77% 63.50% -10.19% -31.26% Expenditures for children aged 15-19 22.57% 70.78% 18.27% -15.01%

Other Issues
Role of shocks
Relative size of the economySmall countriesIslands
Major shifts in politics
Deficits