Fiscal 2015 Third Quarter Resultss2.q4cdn.com/912924347/files/Fiscal-2015-Q3-Presentation...give...
20
1 Regionals Fiscal 2015 Third Quarter Results Tuesday, November 25, 2014
Transcript of Fiscal 2015 Third Quarter Resultss2.q4cdn.com/912924347/files/Fiscal-2015-Q3-Presentation...give...

1 Regionals
Fiscal 2015
Third Quarter Results
Tuesday, November 25, 2014

Forward Looking Statements & Other Disclosure Matters
Forward-Looking Statements - This presentation contains statements which are forward-looking statements within the meaning of the
Private Securities Litigation Reform Act of 1995. These statements, based upon management's beliefs and expectations as well as on
assumptions made by and data currently available to management, include statements regarding, among other things, Signet's results of
operation, financial condition, liquidity, prospects, growth, strategies and the industry in which Signet operates. The use of the words
"expects," "intends," "anticipates," "estimates," "predicts," "believes," "should," "potential," "may," "forecast," "objective," "plan," or "target,"
and other similar expressions are intended to identify forward-looking statements. These forward-looking statements are not guarantees of
future performance and are subject to a number of risks and uncertainties, including but not limited to general economic conditions, risks
relating to Signet being a Bermuda corporation, the merchandising, pricing and inventory policies followed by Signet, the reputation of Signet
and its brands, the level of competition in the jewelry sector, the cost and availability of diamonds, gold and other precious metals,
regulations relating to customer credit, seasonality of Signet's business, financial market risks, deterioration in customers’ financial condition,
exchange rate fluctuations, changes in consumer attitudes regarding jewelry, management of social, ethical and environmental risks,
security breaches and other disruptions to Signet's information technology infrastructure and databases, inadequacy in and disruptions to
internal controls and systems, changes in assumptions used in making accounting estimates relating to items such as extended service
plans and pensions, the impact of the acquisition of Zale Corporation on relationships, including with employees, suppliers, customers and
competitors, the impact of stockholder litigation with respect to the acquisition of Zale Corporation, and our ability to successfully integrate
Zale's operations and to realize synergies from the transaction.
For a discussion of these and other risks and uncertainties which could cause actual results to differ materially from those expressed in any
forward-looking statement, see the "Risk Factors" section of Signet's Fiscal 2014 Annual Report on Form 10-K filed with the SEC on March
27, 2014 and the "Risk Factors" section of Signet's Quarterly Report on Form 10-Q filed with the SEC on September 10, 2014. Signet
undertakes no obligation to update or revise any forward-looking statements to reflect subsequent events or circumstances, except as
required by law.
Non-GAAP Measures - Certain financial measures used during this presentation are considered to be 'non-GAAP financial measures'. For
a reconciliation of these to the most directly comparable GAAP financial measures and disclosure relating to usefulness of such non-GAAP
measures, please refer to slides 11 and 13 and Signet’s Form 10-K dated March 27, 2014, filed with the SEC and available through Signet’s
website, www.signetjewelers.com.
Regionals

3 Regionals
Q3 Fiscal 2015 Financial Results
Same store sales up 4.2% led by the Sterling Jewelers and
UK divisions.
Loss per share $0.02, in-line with guidance
Adjusted EPS1 $0.21, exceeds guidance
On comparable basis, EPS $0.47 up from $0.42 in third
quarter fiscal 2014; an increase of 11.9%
1 Non-GAAP measure. See slide 11.

4 Regionals
Signet Sales Performance Third Quarter Fiscal 2015
Total sales
(in millions)
Change in
same store sales 1
Change in
total sales 2
Kay $424.5 7.5% 10.9%
Jared $227.4 6.5% 13.0%
Regional brands $40.9 2.5% (13.5)%
Sterling Jewelers (division & operating segment) $692.8 6.8% 9.7%
Zales Jewelers $215.5 (0.6)% —
Gordon’s Jewelers $17.5 (1.3)% —
Zale US Jewelry $233.0 (0.7)% —
Peoples Jewellers $47.5 0.5% —
Mappins $8.6 (10.3)% —
Zale Canada Jewelry $56.1 (1.3)% —
Zale Jewelry (operating segment) $289.1 (0.8)% —
Piercing Pagoda (operating segment) $42.3 (1.5)% —
Zale (division) $331.4 (0.9)% —
H.Samuel $76.9 2.0% 5.2%
Ernest Jones $74.1 5.5% 11.9%
UK (division & operating segment) $151.0 3.7% 8.4%
Total Signet $1,177.9 4.2% 52.7%
1 Change in same store sales are at constant currency exchange rates 2 Includes the impact of foreign exchange rate for the UK division. Excluding this impact, change in total sales for the UK division were 4.7%

5 Regionals
Sterling Q3 Performance Drivers
Delivering an excellent
guest experience
Innovative and successful
merchandising initiatives
New creative marketing
Continued multi-channel
growth
®
®

6 Regionals
UK Q3 Performance Drivers
Store operations focus on guest
experience
Initiatives around bridal and
diamonds
Strong watch business
Continued multi-channel growth

7 Regionals
Zale Accomplishments
Completed store
operations conference
Strengthened marketing
activity
Launched market
segmentation study
Testing cross-
merchandising / selling
Innovative merchandise
assortment

8 Regionals
Store operations: Manager
leadership conferences, new
store concepts
Merchandise: Line extensions,
new collections, cross selling
Marketing: Better ad buys, new
creative, store events, strategic
promos
Ready to Win at Holiday

9 Regionals
Advancing Our Strategic
Diamond Sourcing Initiative Entered into rough diamond supply contract with DeBeers
Rough or unpolished diamonds continues to represent
~10% of value related to Sterling diamond procurement
Vast majority polished in our Botswana factory
Should be >20% over long term
Helps ensure stores are supplied a proper quantity and
quality of cuts they need.
10 Regionals
Third Quarter Fiscal 2015 Sales Performance
Sterling Zale UK Other¹ Total
Sales Q3 2015 $m 692.8 331.4 151.0 2.7 1,177.9
Sales Q3 2014 $m 631.3 — 139.3 0.8 771.4
Change in sales
%
%
%
%
%
Change in same store sales² 6.8 (0.9) 3.7 — 4.2
Non-same store sales, net³ 2.9 — 1.0 NM 47.5
Change in total sales at constant
exchange rate⁴ 9.7 — 4.7 NM 51.7
Exchange translation impact⁴ — — 3.7 — 1.0
Change in total sales 9.7 — 8.4 NM 52.7
1. Includes sales from Signet's diamond sourcing initiative. NM – not meaningful.
2. Based on stores opened for 12 months.
3. Includes all sales from stores not open for 12 months.
4. Non-GAAP measure.
11 Regionals
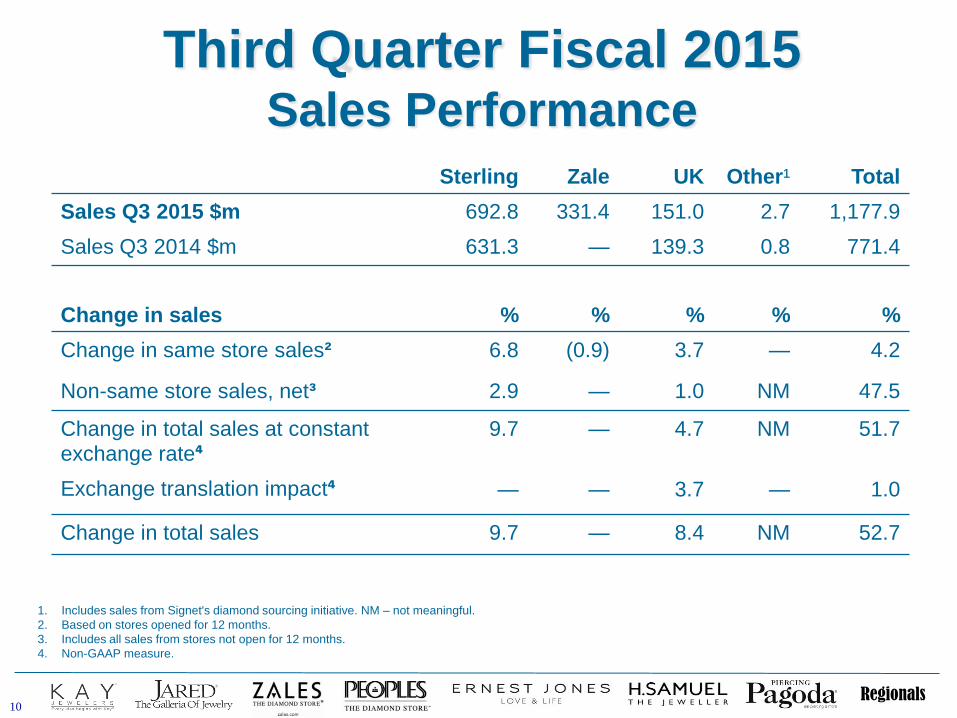
Third Quarter Fiscal 2015 Income Statement Highlights
The Company uses adjusted metrics, which adjust for purchase accounting, severance and transaction costs principally in relat ion to the Zale acquisition to
give investors information as to the Company’s results without regard to the expenses associated with the May 2014 acquisition of Zale Corporation and
certain severance costs.
Non-GAAP Reconciliation for the third quarter ended November 1, 2014
Adjusted
Signet
Purchase
Accounting
Severance
Costs
Transaction
Costs Signet
Sales 1,189.4 (11.5) - 1,177.9
Cost of goods sold (825.5) (6.5) - (832.0)
Gross margin 363.9 (18.0) - - 345.9
SGA (381.7) 4.4 (2.0) (9.4) (388.7)
Other operating income, net 53.5 - - - 53.5
Operating income (loss) 35.7 (13.6) (2.0) (9.4) 10.7
Interest expense, net (11.0) (1.6) - - (12.6)
Income (loss) before income taxes 24.7 (15.2) (2.0) (9.4) (1.9)
Income taxes (8.2) 5.8 0.8 2.2 0.6
Net income (loss) 16.5 (9.4) (1.2) (7.2) (1.3)
Earnings (loss) per share - diluted 0.21 (0.12) (0.02) (0.09) (0.02)
Signet's 3rd Quarter Guidance 0.12 - 0.18 (0.14) - (0.12) N/A (0.09) - (0.07) (0.11) - (0.01)
Adjustments

12 Regionals
Third Quarter Fiscal 2015
Operating Income (Loss)
Q3 FY2015 Q3 FY2014
$m
% of
Division
Sales $m
% of
Division
Sales
Sterling Jewelers Division 68.1 9.8 60.6 9.6
Zale Division1 (34.5) (10.4) - -
UK Division (2.7) (1.8) (4.4) (3.2)
Other2 (20.2) - (4.6) -
Signet 10.7 0.9 51.6 6.7 1 Zale Division includes $13.6 million in purchase accounting costs. 2 Other includes $11.4 million in severance and transaction costs.
13 Regionals
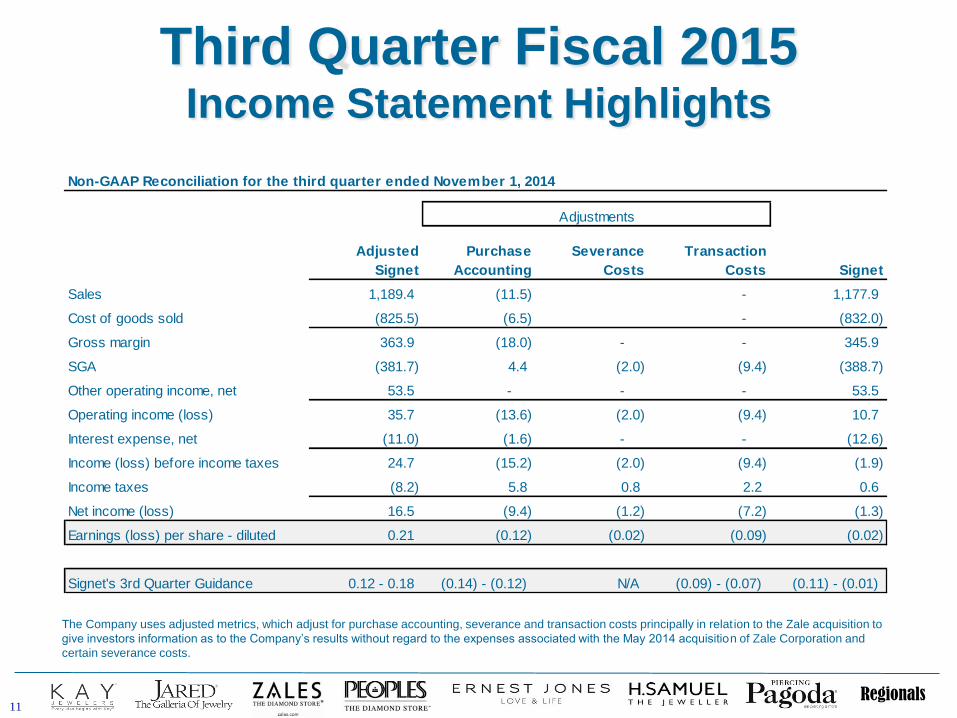
Third Quarter Fiscal 2015 Adjusted Signet Detail1
Adjusted Signet excluding
Zale2 Zale operations Adjusted Signet
$ % $ % $ %
Sales 846.5 100.0% 342.9 100.0% 1,189.4 100.0%
Cost of goods sold (580.4) (68.6)% (245.1) (71.5)% (825.5) (69.4)%
Gross margin 266.1 31.4% 97.8 28.5% 363.9 30.6%
SGA (263.0) (31.0)% (118.7) (34.6)% (381.7) (32.1)%
Other operating income, net 53.5 6.3% - 0.0% 53.5 4.5%
Operating income (loss) 56.6 6.7% (20.9) (6.1)% 35.7 3.0%
Interest expense, net (10.6) (1.3)% (0.4) (0.1)% (11.0) (0.9)%
Income (loss) before income taxes 46.0 5.4% (21.3) (6.2)% 24.7 2.1%
Income taxes (16.3) (1.9)% 8.1 2.4% (8.2) (0.7)%
Net income (loss) 29.7 3.5% (13.2) (3.8)% 16.5 1.4%
Earnings (loss) per share - diluted $ 0.38 $ (0.17) $ 0.21
1 Non-GAAP measure. See slide 11.
2 Includes capital structure and financing costs
14 Regionals
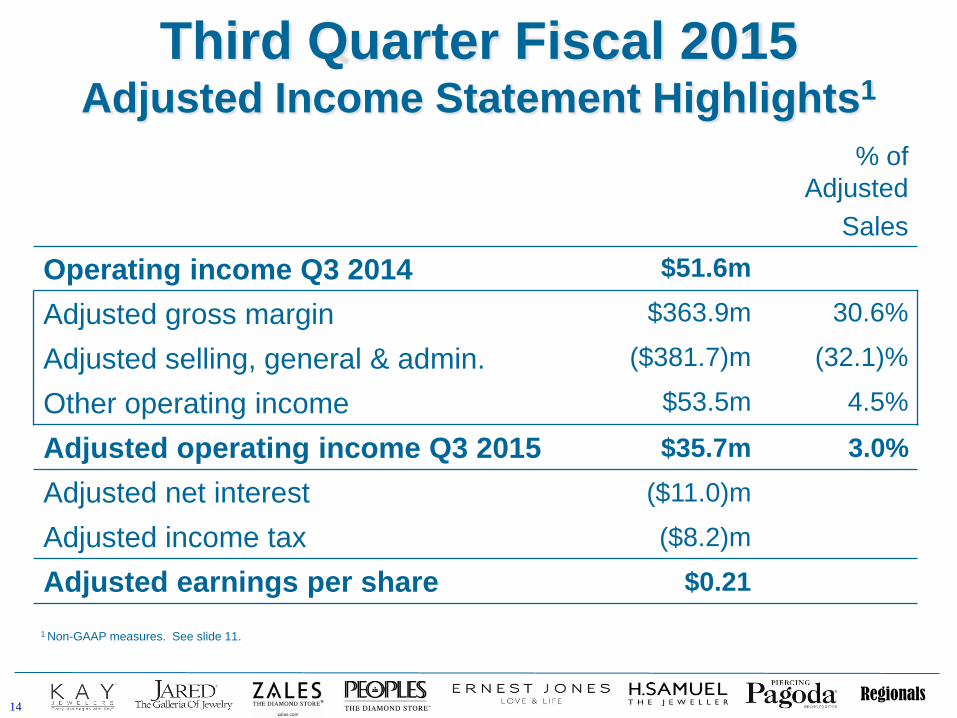
Third Quarter Fiscal 2015 Adjusted Income Statement Highlights1
% of
Adjusted
Sales
Operating income Q3 2014 $51.6m
Adjusted gross margin $363.9m 30.6%
Adjusted selling, general & admin. ($381.7)m (32.1)%
Other operating income $53.5m 4.5%
Adjusted operating income Q3 2015 $35.7m 3.0%
Adjusted net interest ($11.0)m
Adjusted income tax ($8.2)m
Adjusted earnings per share $0.21
1 Non-GAAP measures. See slide 11.

15 Regionals
Inventory Q3 Fiscal 2015
Ending inventory $2,674.6 million, up $1,029.7 million
due to:
Zale division – Inventory of $979.3 million
Sterling division – Primarily bridal brand extensions, loose
diamonds, and new stores $66.8 million
Inventory well-positioned for holiday season
16 Regionals
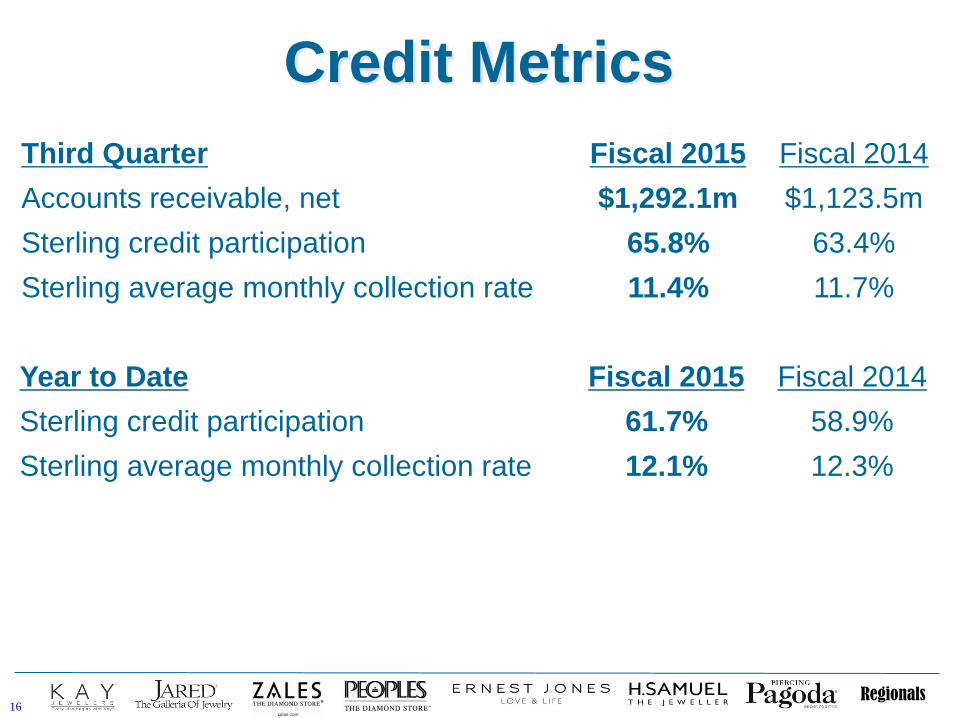
Credit Metrics
Third Quarter Fiscal 2015 Fiscal 2014
Accounts receivable, net $1,292.1m $1,123.5m
Sterling credit participation 65.8% 63.4%
Sterling average monthly collection rate 11.4% 11.7%
Year to Date Fiscal 2015 Fiscal 2014
Sterling credit participation 61.7% 58.9%
Sterling average monthly collection rate 12.1% 12.3%

17 Regionals
Credit Statistics Third Quarter Fiscal 2015 Fiscal 2014
Net bad debt ($41.7)m ($35.1)m
Other operating income, net $53.5m $45.8m
Net Impact $11.8m $10.7m
Year to Date Fiscal 2015 Fiscal 2014
Net bad debt ($105.8)m ($92.9)m
Other operating income, net $161.2m $139.1m
Net Impact $55.4m $46.2m
Allowance as a % of ending
accounts receivable 7.4% 7.5%

18 Regionals
Other Balance Sheet Highlights
Long-term debt $1.4B versus $0.0, due to financing of Zale
acquisition
2.6% weighted average interest cost of debt
$600M asset-backed securitization, $400M term loan, and $400M
senior notes at 4.7%
Utilized $145.0M of revolving credit facility for seasonal
needs
Capital structure expectations
Continue to evaluate cash flow characteristics of new business
model
Operate business through holiday selling season before making
repurchase commitment for Fiscal 2016

19 Regionals
Financial Guidance Fourth Quarter Fiscal 2015
Same store sales 3.0% to 4.0%
EPS ($2.69) to ($2.83)
Adjustments:
Purchase accounting ($0.17) to ($0.15)
Transaction costs ($0.09) to ($0.07)
Adjusted EPS (EPS less Adjustments) $2.95 to $3.05
Adjusted EPS expected to be favorably impacted by Zale operations in fourth quarter Fiscal 2015 by
$0.36 to $0.40.
Fiscal 2015
EPS $4.59 to $4.72
Adjusted EPS Adjusted EPS expected to be favorably impacted by Zale
operations in Fiscal 2015 by $0.20 to $0.24. $5.51 to $5.61
Effective tax rate 29.3%
Capital expenditures $240M to $250M
Net selling square footage growth 45.0% to 47.5%

20 Regionals
Fiscal 2015
Third Quarter Results
Tuesday, November 25, 2014