First step in optimizing LNG storages for offshore terminalsx
19
International Gas Union Research Conference 2011 First step in optimizing LNG storages for offshore terminals Yacine ZELLOUF Benoît PORTANNIER GDF SUEZ - France
Transcript of First step in optimizing LNG storages for offshore terminalsx
International Gas Union Research Conference 2011
First step in optimizing LNG storages for offshore terminals
Yacine ZELLOUF
Benoît PORTANNIER
GDF SUEZ - France

1. ABSTRACT
The development of new LNG offshore facilities addresses new technical challenges that need to be deeply investigated to overcome the new constraints raised from the offshore operability. One of the key issues concerns the management of LNG storages. As future offshore LNG projects could be implemented in areas with harsh environmental conditions, the motions of the floating structure combined to the design and operating parameters should widely affect the behavior of the LNG inside partially filled tanks. Therefore, the knowledge available from onshore LNG storages has to be completed taking into account the offshore environment.
The first concern deals with the production of Boil-Off Gas (BOG) during LNG’s unloading
and storage operations under offshore conditions, where specific offshore parameters would contribute in increasing the production of BOG. For that purpose, a new optimized LNG storage process based on an increased operating pressure (P = 500 mbarg) in the TRITON FSRU’s tanks has been investigated during LNG’s unloading and storage operations with LNG emission.
It mainly showed that by operating at 500 mbarg, the production of BOG is nearly 4 times
reduced during unloading operations compared to LNG carrier standard operating pressure (100 mbarg) and nearly suppressed during the storage phase.
The second concern deals with managing the rollover risk under offshore conditions. In this
context, GDF SUEZ performed a pioneer qualitative assessment to highlight the impact of the liquid motion on the rollover mechanisms in the TRITON FSRU’s tanks.
The liquid motion completely modifies the mixing mechanisms in LNG stratified layers. The
mixing is no longer governed by the molecular diffusion induced by the thermal effects but by the dynamic flow effects induced by the fluid wave movement into the layers. Moreover, this assessment showed that the time needed for a stratification to evolve up to a complete mix is severely reduced compared to the onshore LNG storage while the assessment of the induced BOG peak depends as usual on the energy stored in the stratification when being mixed and could be of the same order of magnitude as for onshore rollover.

TABLE OF CONTENTS
1. ABSTRACT
2. CHALLENGES FACED BY LNG OPERATORS
3. LNG STORAGE OPTIMIZATION: ONSHORE KNOWLEDGE
3.1. Tank filling operation optimization 3.2. Stratification management optimization
4. LNG offshore storage optimization: increased pressure operability solution
4.1. Impact of increased operating pressure on BOG production 4.1.1. BOG production: General trend
4.1.1.1. Reduced BOG production during unloading phases 4.1.1.2. No BOG exits tanks to the compressors during storage phases
4.1.2. Boil-Off Gas re-condensation 4.1.3. Economical benefits
4.2. Effect of an increased presure on the Rollover event
5. EFECT of the liquid motion on the stratification evolution: qualitative assessment
5.1. Mixing process 5.2. The total mixing BOG depends on the energy stored in a stratification
6. Conclusion
7. REFERENCE
8. LIST OF TABLES
9. LIST OF FIGURES
2. CHALLENGES FACED BY LNG OPERATORS
When mixing different LNG qualities in a same tank, terminal operators have to face three cases. The first case is “safe” to operators. The incoming LNG is lighter than the LNG heel in the tank to be filled. A tank bottom filling operation ensures a complete mix of the two LNG qualities with a limited boil-off gas (BOG) production and there is no risk of creating a stratification which can potentially lead to a rollover event.
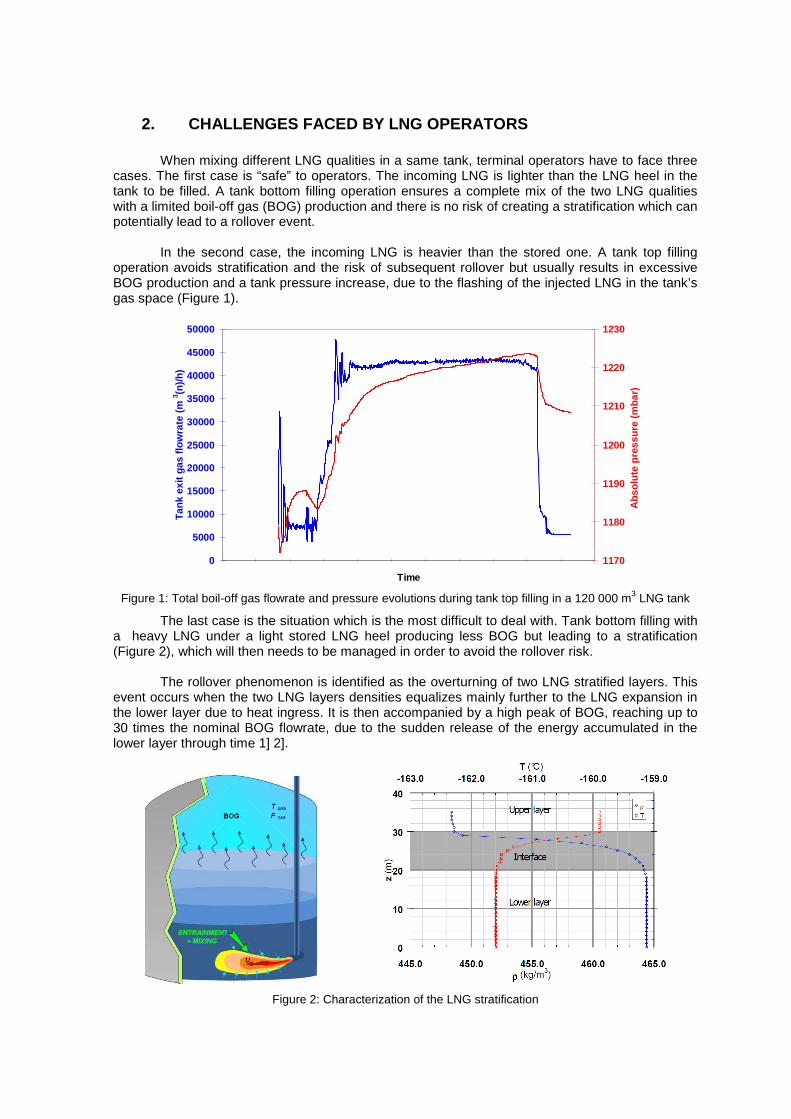
In the second case, the incoming LNG is heavier than the stored one. A tank top filling
operation avoids stratification and the risk of subsequent rollover but usually results in excessive BOG production and a tank pressure increase, due to the flashing of the injected LNG in the tank’s gas space (Figure 1).
Figure 1: Total boil-off gas flowrate and pressure evolutions during tank top filling in a 120 000 m3 LNG tank
The last case is the situation which is the most difficult to deal with. Tank bottom filling with a heavy LNG under a light stored LNG heel producing less BOG but leading to a stratification (Figure 2), which will then needs to be managed in order to avoid the rollover risk.
The rollover phenomenon is identified as the overturning of two LNG stratified layers. This
event occurs when the two LNG layers densities equalizes mainly further to the LNG expansion in the lower layer due to heat ingress. It is then accompanied by a high peak of BOG, reaching up to 30 times the nominal BOG flowrate, due to the sudden release of the energy accumulated in the lower layer through time 1] 2].
Figure 2: Characterization of the LNG stratification
0
5000
10000
15000
20000
25000
30000
35000
40000
45000
50000
Time
Tan
k ex
it g
as f
low
rate
(m
3 (n)/
h)
1170
1180
1190
1200
1210
1220
1230
Ab
solu
te p
ress
ure
(m
bar
)
3. LNG STORAGE OPTIMIZATION: ONSHORE KNOWLEDGE
3.1. Tank filling operation optimization
The LNG operator has several options in order to mitigate the tank filling consequences and reduce their effects. For instance, he can reduce the tank filling flowrate in order to decrease the gas flashing rate. However, this might not be possible due to constraints relative to the maximum staying time of the LNG carrier at berth. A judicious solution is to regulate the tank's operating pressure in order to minimize gas production during tank filling:
- First step: pre-cooling the tank heel before unloading occurs by lowering the operating
pressure. - Second step: before unloading, the operating pressure is increased above the nominal
operating pressure, in order to limit the amount of flashing of the injected LNG. This new operating pressure is maintained throughout the filling process.
- Third step: once tank filling is achieved, the pressure is then lowered progressively to the initial nominal value.
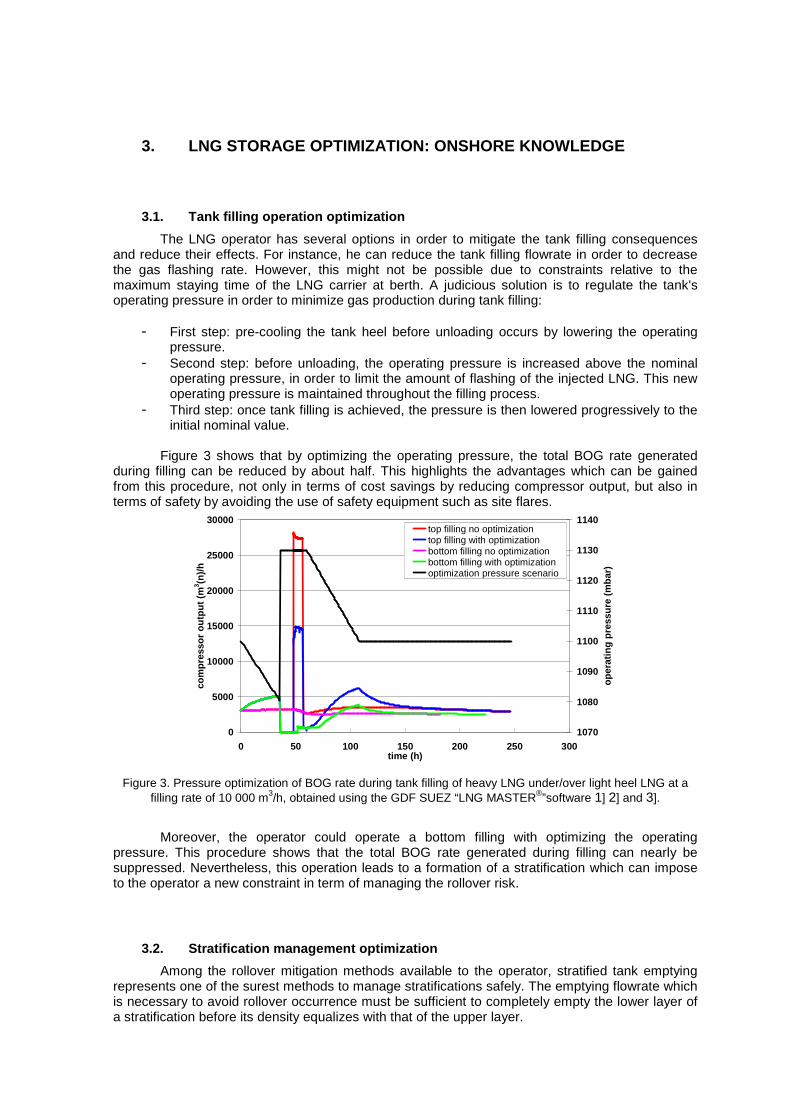
Figure 3 shows that by optimizing the operating pressure, the total BOG rate generated
during filling can be reduced by about half. This highlights the advantages which can be gained from this procedure, not only in terms of cost savings by reducing compressor output, but also in terms of safety by avoiding the use of safety equipment such as site flares.
Figure 3. Pressure optimization of BOG rate during tank filling of heavy LNG under/over light heel LNG at a filling rate of 10 000 m3/h, obtained using the GDF SUEZ “LNG MASTER®”software 1] 2] and 3].
Moreover, the operator could operate a bottom filling with optimizing the operating pressure. This procedure shows that the total BOG rate generated during filling can nearly be suppressed. Nevertheless, this operation leads to a formation of a stratification which can impose to the operator a new constraint in term of managing the rollover risk.
3.2. Stratification management optimization
Among the rollover mitigation methods available to the operator, stratified tank emptying represents one of the surest methods to manage stratifications safely. The emptying flowrate which is necessary to avoid rollover occurrence must be sufficient to completely empty the lower layer of a stratification before its density equalizes with that of the upper layer.
0
5000
10000
15000
20000
25000
30000
0 50 100 150 200 250 300time (h)
com
pre
sso
r o
utp
ut
(m3 (n
)/h
1070
1080
1090
1100
1110
1120
1130
1140
op
erat
ing
pre
ssu
re (
mb
ar)
top filling no optimizationtop filling with optimizationbottom filling no optimizationbottom filling with optimizationoptimization pressure scenario
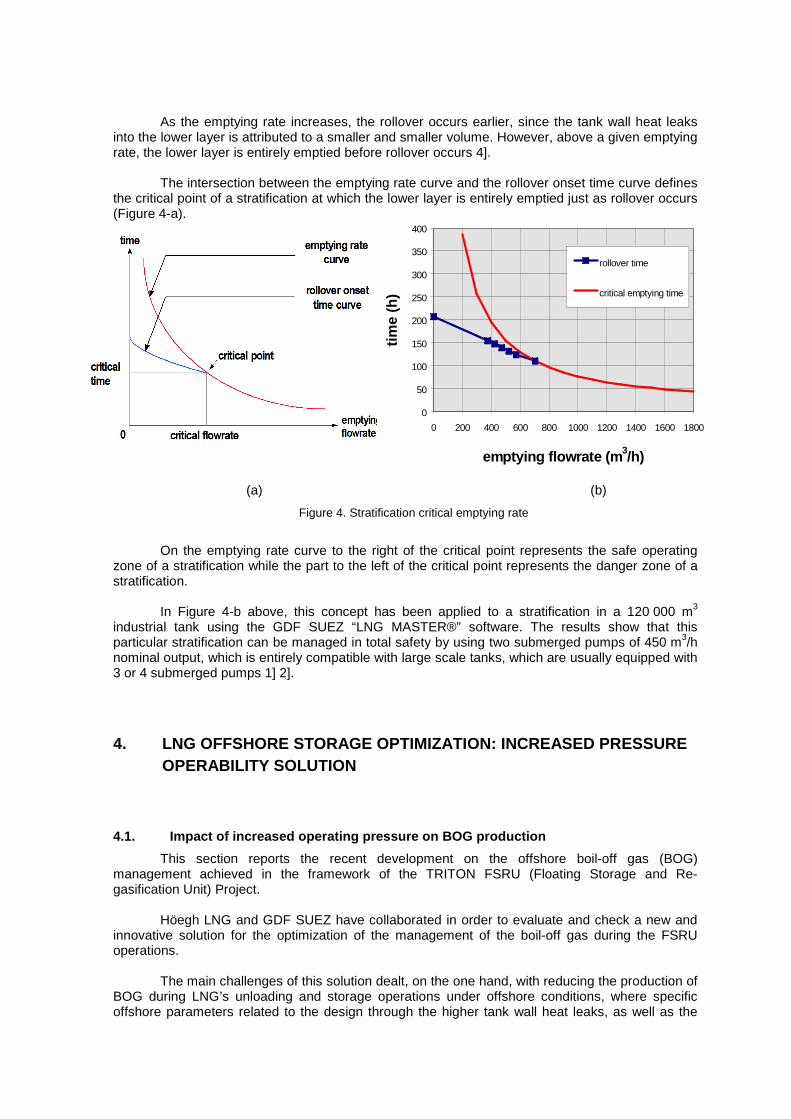
As the emptying rate increases, the rollover occurs earlier, since the tank wall heat leaks
into the lower layer is attributed to a smaller and smaller volume. However, above a given emptying rate, the lower layer is entirely emptied before rollover occurs 4].
The intersection between the emptying rate curve and the rollover onset time curve defines
the critical point of a stratification at which the lower layer is entirely emptied just as rollover occurs (Figure 4-a).
(a)
(b)
Figure 4. Stratification critical emptying rate
On the emptying rate curve to the right of the critical point represents the safe operating
zone of a stratification while the part to the left of the critical point represents the danger zone of a stratification.
In Figure 4-b above, this concept has been applied to a stratification in a 120 000 m3
industrial tank using the GDF SUEZ “LNG MASTER®” software. The results show that this particular stratification can be managed in total safety by using two submerged pumps of 450 m3/h nominal output, which is entirely compatible with large scale tanks, which are usually equipped with 3 or 4 submerged pumps 1] 2].
4. LNG OFFSHORE STORAGE OPTIMIZATION: INCREASED PRESSURE OPERABILITY SOLUTION
4.1. Impact of increased operating pressure on BOG production
This section reports the recent development on the offshore boil-off gas (BOG) management achieved in the framework of the TRITON FSRU (Floating Storage and Re-gasification Unit) Project.
Höegh LNG and GDF SUEZ have collaborated in order to evaluate and check a new and
innovative solution for the optimization of the management of the boil-off gas during the FSRU operations.
The main challenges of this solution dealt, on the one hand, with reducing the production of
BOG during LNG’s unloading and storage operations under offshore conditions, where specific offshore parameters related to the design through the higher tank wall heat leaks, as well as the
0
50
100
150
200
250
300
350
400
0 200 400 600 800 1000 1200 1400 1600 1800
emptying flowrate (m3/h)
tim
e (h
)
rollover time
critical emptying time
operating aspects through the liquid motion effect in a partially filled tank, would contribute in increasing the production of BOG.
On the other hand, the excess of BOG should be re-condensed and injected into the liquid
stream towards re-gasification unit with consideration of the amount of BOG used in the dual fuel engines for the FSRU’s energy consumption needs.
By operating in such a way, this solution would allow avoiding burning the excess of BOG
in the Gas Combustion Unit (GCU) nor venting it to the atmosphere during common operations of the FSRU, keeping high performance level as for onshore terminals.
The main characteristics of the BOG management solution adopted are the following:
- Storage/Emission phase: operating the FSRU at high pressure, up to 500 mbarg (instead of 100 mbarg for a conventional LNG carrier), in order to achieve a sub-cooling effect of the stored LNG and suppress the generation of BOG;
- Loading phase: loading simultaneously the FSRU’s tanks at high pressure, up to 500 mbarg (instead of 100 mbarg for a conventional LNG carrier), in order to reduce the injected LNG flowrate in each tank and achieve a sub-cooling effect of the loaded LNG and thus reducing the generation of BOG;
- Re-condensation unit: onboard re-condenser in connection to re-gasification unit in order
to re-condense the excess of BOG not used for power generation nor returned to LNG carrier.
The Figure 5 shows a general overview of the offshore BOG solution giving the main figures at
the process key points. This technical solution described in this section has been patented by Höegh LNG and GDF SUEZ in France and is under examination in Europe.

Figure 5 TRITON FSRU: Increased pressure operability solution diagram
4.1.1. BOG production: General trend
In this section, we present the results of the investigations in terms of maximum BOG generated during the common operations in an offshore LNG terminal, i.e. unloading and storage phases with LNG emission. The simulations has been performed using the LNG MASTER® software, a decision-support software for LNG storage management, developed by GDF SUEZ. Two successive unloading operations with a storage phase has been simulated. The simulations highlighted two main points:
4.1.1.1. Reduced BOG production during unloading phases
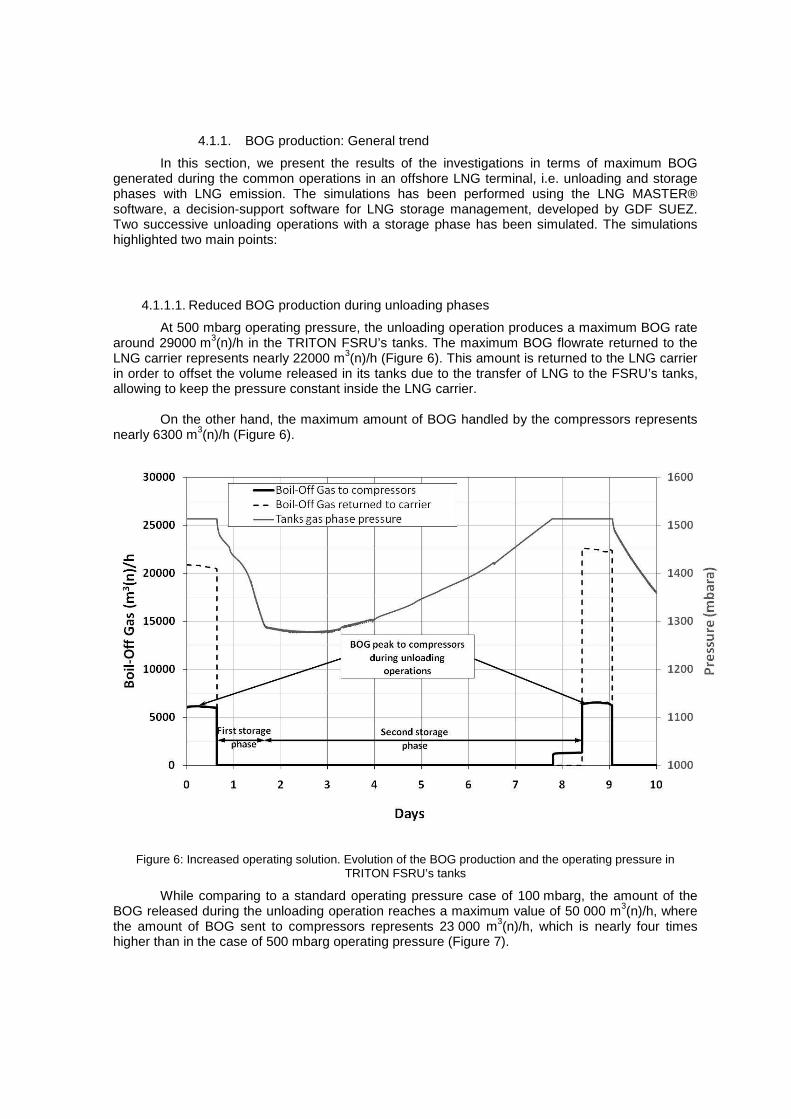
At 500 mbarg operating pressure, the unloading operation produces a maximum BOG rate around 29000 m3(n)/h in the TRITON FSRU’s tanks. The maximum BOG flowrate returned to the LNG carrier represents nearly 22000 m3(n)/h (Figure 6). This amount is returned to the LNG carrier in order to offset the volume released in its tanks due to the transfer of LNG to the FSRU’s tanks, allowing to keep the pressure constant inside the LNG carrier.
On the other hand, the maximum amount of BOG handled by the compressors represents
nearly 6300 m3(n)/h (Figure 6).
Figure 6: Increased operating solution. Evolution of the BOG production and the operating pressure in TRITON FSRU’s tanks
While comparing to a standard operating pressure case of 100 mbarg, the amount of the BOG released during the unloading operation reaches a maximum value of 50 000 m3(n)/h, where the amount of BOG sent to compressors represents 23 000 m3(n)/h, which is nearly four times higher than in the case of 500 mbarg operating pressure (Figure 7).

Figure 7: BOG production during TRITON FSRU’s common operations if operating at 100 mbarg pressure
4.1.1.2. No BOG exits tanks to the compressors during storage phases
At the end of the unloading operation, the stored LNG remains sub-cooled compared to the FSRU’s saturated conditions at 500 mbarg, leading to a high difference between the LNG bulk temperature and its equilibrium state. Then, the production of BOG at the LNG free surface in the FSRU’s tanks strongly decreases.
In addition, the LNG emission operation during the storage phase allows to reduce the
pressure inside the FSRU’s tanks (Figure 6), down to 1270 mbar (in this case), as the space released in the tank by the LNG emission is higher than the BOG volume produced. A buffer BOG storage is then created, suppressing thus the BOG exiting the tank to the compressors.
During the second phase of the storage, the LNG temperature increases again due to the
heat leaks in the FSRU’s tanks, reaching the saturated state. Then, the production of BOG increases but remains weak and does only contribute in increasing the pressure into the FSRU’s tanks (Figure 6).
This situation goes on for 8 days and the pressure remains lower than the operating
pressure up to one day before receiving a new LNG cargo, leading to a release of a very small amount of BOG to compressors. The whole duration remains within the LNG supply slot of the TRITON FSRU. However, as the FSRU will use BOG for power generation, a BOG amount will be extracted from tanks, depending on the LNG emission rate. The tank operation pressure will be then adjusted to comply with this.
In comparison to a standard operating pressure of 100 mbarg, the BOG volume released
during the 100 mbarg storage phase represents 1.3 Mm3(n), i.e. 13 times higher than the BOG volume released during the unloading operation at 500 mbarg, which is considered as a sizing case (Figure 7). In other words, by operating at 500 mbarg, the LNG offshore operator will be able, during the storage phase, to save energy equivalent to that consumed in recovering BOG during 13 “500 mbarg” unloading operations.

4.1.2. Boil-Off Gas re-condensation
As it was previously stated, among the challenges that are required for the optimal working of the LNG offshore increased pressure operability solution, the re-condensation of the BOG is a key element in the chain of the BOG management in order to avoid burning the BOG in the GCU nor venting it to the atmosphere.
Therefore, the amount of BOG generated in the tanks should comply with the operability
constraints of the FSRU in terms of minimum LNG emission flowrate required for the BOG re-condensation process, as the send-out LNG represents the cold source for the BOG re-condensation.
The principle of the BOG re-condensation is based on the mixing of a sub-cooled liquid
LNGvQ
with an overheated vapour BOGvQ
in the right amount, giving the re-condensation capacity η, to obtain a liquid that can be in boiling or sub-cooled state:
LNGv
BOGv
Q
Q=η
Then, the minimum LNG emission flowrate was investigated with regard to the amount of
Boil-Off Gas evaluated in the previous section, during normal operation of the FSRU and for three re-condensation capacity η representing:
- theoretical case with thη = 9.3 which corresponds to the production of liquid in a boiling
state;
- operational cases considering two values η = 4 and η = 6 commonly applied on LNG onshore terminals, allowing characterizing the operational margin in real conditions.
Figure 8: BOG re-condensation capacity in function of LNG flowrate and η
This assessment highlighted that in the worst case, where η = 4, an LNG emission flowrate of 405 m3/h is sufficient to re-condense up to a maximum BOG flowrate of 10 000 m3(n)/h, for a BOG temperature of -100°C. This LNG flowrate remains widely below the maximum LNG emission flowrate of 1200 m3/h expected for TRITON FSRU.
4.1.3. Economical benefits
From a financial point of view, the proposed solution has two quantifiable economical impacts on offshore LNG receiving terminal. The quantity of BOG to be treated being severely limited, the number of BOG compressors required is reduced which represents a CAPEX saving of approximately 1.5 million € calculated based on the TRITON project.
Moreover, the energy consumption to recover the BOG is reduced saving up to
100 k€/year during the operations (OPEX). Two other elements may be put forward for offshore LNG terminals but remains difficult to
quantify at this stage. It concerns reduction of equipment congestion and weight on the FSRU’s deck while the marinization of equipments such as the re-condenser will be improved thanks to its smaller size which is expected to provide less sensitivity to sea motions.
The combination of these elements would contribute to design and operate the FSRU with
high technical and environmental performance levels, making the offshore solution as competitive as the onshore terminals despite the offshore constraints.
4.2. Effect of an increased presure on the Rollover event
The impact of the operating pressure on the stratification evolution up to the rollover event has also been investigated. A quantitative assessment were then performed on a study case to assess the effect of the operating pressure on the rollover onset time under calm sea conditions (no liquid motion inside the FSRU’s tanks) using the LNG MASTER® software. Based on offshore design BOR value of 0.15%, the TRITON FSRU’s operating pressure were changed, ranging from 100 mbar to 500 mbarg.
The selected study case considers a stratification formation in one of the TRITON FSRU’s
tanks, following a bottom filling operation, with an LNG stratification layer ratio of fifty-fifty, between upper and lower layer. This layer height ratio provides a balance between two effects: the lower layer potential to accumulate heat and the additional hydrostatic head of the upper layer as it can sub-cool the lower layer and then delayed the rollover occurrence.
As it is showed in Figure 9, the rollover onset time increases linearly with the FSRU’s
operating pressure, showing that an increased operating pressure has a delayed effect on the rollover occurrence but not a stopping effect as the rollover always occurred. Indeed, the rollover event is twice time delayed at 500 mbarg operating pressure compared to 100 mbarg, giving the operator twice more time to take the mitigation measures in order to avoid the rollover occurrence.

Figure 9. Evolution of the rollover characteristics according to the operating pressure
However, this previous statements only took into account the effects of offshore heat ingress through the 0.15% BOR value, without any consideration of the liquid motion impact induced by the wave movement, on the evolution of stratification in terms of rollover onset time and its induced BOG peak.
5. EFECT OF THE LIQUID MOTION ON THE STRATIFICATION EVOLUTION: QUALITATIVE ASSESSMENT
The risk of a stratification in an LNG offshore installation seems to be higher than the onshore case according to the expected offshore design and operability constraints. Indeed, the utilization of only bottom filling device in offshore structures, for BOG production limitation purposes, would reduce the flexibility for the operator to mix different quality of LNGs preventing from the formation of stratifications.
The evolution of a such stratification is already well managed in the static case in terms of
rollover consequences prediction and the definition of the mitigation measures in order to prevent it.
In the offshore case, the LNG motion inside the tank induced by the sea movement would
widely impact the behavior of a stratification, where dynamic effects would play a major part in mixing the stratification.
5.1. Mixing process
So, in order to highlight the influence of the liquid motion on the LNG mixing mechanisms the consequences of such mixing on a stratification evolution, calculations on simplified cases, 2D tank with single degree motion, have been performed with the CFD code “EOLE” developed by Principia 5].
Calculations of liquid motion were then carried out where both dynamic effects induced by
the tank motion and both buoyancy and thermal effects were considered. The evaporation process at the LNG free surface was not considered at this stage of this study due to difficulties in its implementation so that we could not directly assess the BOG production. However, these simulations allowed to assess qualitatively the impact of liquid motion on the mixing process.
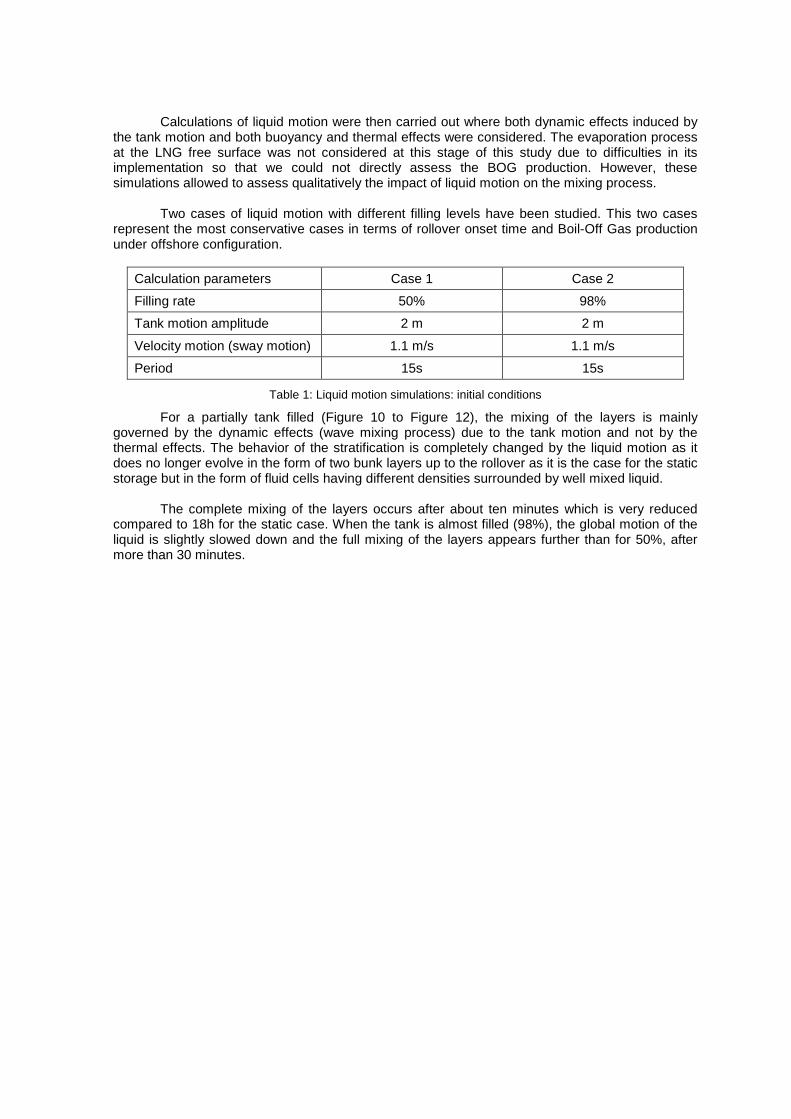
Two cases of liquid motion with different filling levels have been studied. This two cases
represent the most conservative cases in terms of rollover onset time and Boil-Off Gas production under offshore configuration.
Calculation parameters Case 1 Case 2
Filling rate 50% 98%
Tank motion amplitude 2 m 2 m
Velocity motion (sway motion) 1.1 m/s 1.1 m/s
Period 15s 15s
Table 1: Liquid motion simulations: initial conditions
For a partially tank filled (Figure 10 to Figure 12), the mixing of the layers is mainly governed by the dynamic effects (wave mixing process) due to the tank motion and not by the thermal effects. The behavior of the stratification is completely changed by the liquid motion as it does no longer evolve in the form of two bunk layers up to the rollover as it is the case for the static storage but in the form of fluid cells having different densities surrounded by well mixed liquid.
The complete mixing of the layers occurs after about ten minutes which is very reduced
compared to 18h for the static case. When the tank is almost filled (98%), the global motion of the liquid is slightly slowed down and the full mixing of the layers appears further than for 50%, after more than 30 minutes.

Figure 10. Case 1-50% - concentration at t=12s (left) and t=60s (right)
Figure 11. Case 1-50% - concentration at t=148s (left) and t=200s (right)
Figure 12. Case 1-50% - concentration at t=400s (left) and t=500s (right)

Figure 13. Case 2-98% - concentration at t=200s (left) and t=500s (right)
Figure 14. Case 2-98% - concentration at t=800s (left) and t=1200s (right)
Figure 15. Case 2-98% - concentration at t=1600s (left) and t=2300s (right)

5.2. The total mixing BOG depends on the energy stored in a stratification
Following these observations on the mixing mechanism of a stratification under liquid motion effect, could we still qualify the mixing process as a rollover phenomenon? Then what are the consequences that it could have in terms of BOG peak production compared to the onshore rollovers?
The answers to these questions lie in the state of the stratification when the liquid motion
becomes to be important, through the quantity of energy that the stratification has already stored by heat ingress, especially in the lower layer, before being destabilized. This energy will define the BOG flowrate which would be released during the mixing process.
Two main cases can be identified in this way (see Figure 16):
- The stratification is destabilized by liquid motion since the first moment of its creation. In this case, the energy stored by the stratification is still low. The BOG generated by such mixing would be smoothed during the mixing process leading to an increased in the nominal BOG with a relatively low peak (green curve in Figure 16).
- The stratification has evolved for relatively long time and start to be destabilized by the
liquid motion which would increase the LNG mix. In this case, the mixing process could be assimilated to a rollover event as it would generate a real but moderate peak of BOG (red curve in Figure 16). Moreover, The liquid motion could be an accelerator of rollover if the stratification has sufficiently incubated and is highly energy saturated. Then, the BOG that would be generated by a total mixing of the stratified layers is of the same order of magnitude as for static rollover (blue curve in Figure 16).
Figure 16 Qualitative assessment of the expected BOG peak at mixing. The BOG peak that would be generated by a total mixing of the stratified layers depends on the incubation time of the
stratification
Sloshing effect being important
Expected BOG peak at mixing Expected BOG peak
at rollover
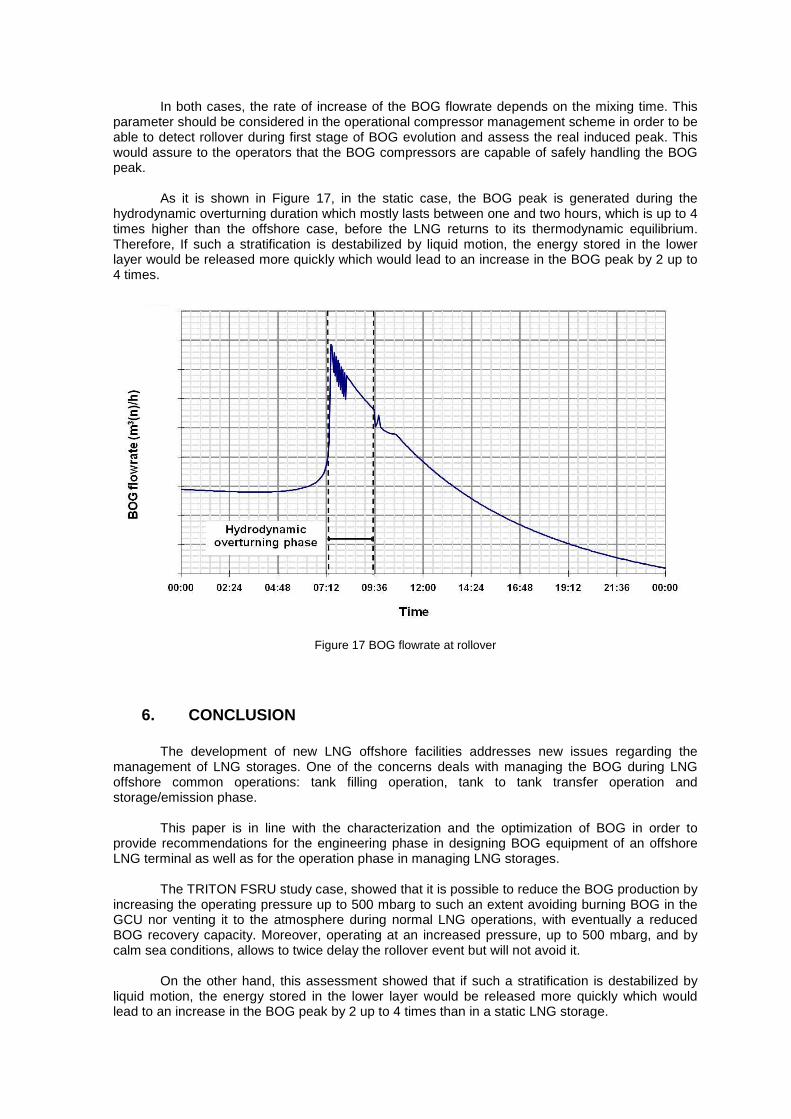
In both cases, the rate of increase of the BOG flowrate depends on the mixing time. This parameter should be considered in the operational compressor management scheme in order to be able to detect rollover during first stage of BOG evolution and assess the real induced peak. This would assure to the operators that the BOG compressors are capable of safely handling the BOG peak.
As it is shown in Figure 17, in the static case, the BOG peak is generated during the
hydrodynamic overturning duration which mostly lasts between one and two hours, which is up to 4 times higher than the offshore case, before the LNG returns to its thermodynamic equilibrium. Therefore, If such a stratification is destabilized by liquid motion, the energy stored in the lower layer would be released more quickly which would lead to an increase in the BOG peak by 2 up to 4 times.
Figure 17 BOG flowrate at rollover
6. CONCLUSION
The development of new LNG offshore facilities addresses new issues regarding the management of LNG storages. One of the concerns deals with managing the BOG during LNG offshore common operations: tank filling operation, tank to tank transfer operation and storage/emission phase.
This paper is in line with the characterization and the optimization of BOG in order to
provide recommendations for the engineering phase in designing BOG equipment of an offshore LNG terminal as well as for the operation phase in managing LNG storages.
The TRITON FSRU study case, showed that it is possible to reduce the BOG production by
increasing the operating pressure up to 500 mbarg to such an extent avoiding burning BOG in the GCU nor venting it to the atmosphere during normal LNG operations, with eventually a reduced BOG recovery capacity. Moreover, operating at an increased pressure, up to 500 mbarg, and by calm sea conditions, allows to twice delay the rollover event but will not avoid it.
On the other hand, this assessment showed that if such a stratification is destabilized by
liquid motion, the energy stored in the lower layer would be released more quickly which would lead to an increase in the BOG peak by 2 up to 4 times than in a static LNG storage.
7. REFERENCE
1. Uznanski, D. and Versluijs, P. (2003). Advanced LNG storage tank management. AIChE Spring Meeting, 3rd Natural Gas Utilization Topical Conference, Session LNG VI – Storage & Facilities, New Orleans, Louisiana.
2. Uznanski, D. (1999). Innovative Optimization Techniques for LNG Storage Tank Management”. Osaka Gas R&D Forum '99.
3. Uznanski, D., Malvos, H., Gorieu, O., Aoyagi, Y. and Benito, A. (2001). Recent advances in the optimized management of LNG storage tank filling operations. LNG 13 conference.
4. Gorieu, O., Uznanski, D. and Dupont, P.( 2004). How to operate LNG terminals with Flexibility / Safety despite the diversification of unloaded LNG qualities?. LNG 14 conference.
5. Zellouf, Y. and Mariotti, J. (2010). On assessing rollover under offshore conditions. Sixteenth International Conference & Exhibition on Liquefied Natural Gas, Oran, Algeria.
8. LIST OF TABLES
Table 1: Liquid motion simulations: initial conditions
9. LIST OF FIGURES
Figure 1: Total boil-off gas flowrate and pressure evolutions during tank top filling in a 120 000 m3 LNG tank Figure 2: Characterization of the LNG stratification Figure 3. Pressure optimization of BOG rate during tank filling of heavy LNG under/over light heel LNG at a filling rate of 10 000 m3/h, obtained using the GDF SUEZ “LNG MASTER®”software [1] [2] and [3]. Figure 4. Stratification critical emptying rate Figure 5 TRITON FSRU: Increased pressure operability solution diagram Figure 6: Increased operating solution. Evolution of the BOG production and the operating pressure in TRITON FSRU’s tanks Figure 7: BOG production during TRITON FSRU’s common operations if operating at 100 mbarg pressure Figure 8: BOG re-condensation capacity in function of LNG flowrate and η
Figure 9. Evolution of the rollover characteristics according to the operating pressure Figure 10. Case 1-50% - concentration at t=12s (left) and t=60s (right) Figure 11. Case 1-50% - concentration at t=148s (left) and t=200s (right) Figure 12. Case 1-50% - concentration at t=400s (left) and t=500s (right) Figure 13. Case 2-98% - concentration at t=200s (left) and t=500s (right) Figure 14. Case 2-98% - concentration at t=800s (left) and t=1200s (right) Figure 15. Case 2-98% - concentration at t=1600s (left) and t=2300s (right) Figure 16 Qualitative assessment of the expected BOG peak at mixing. The BOG peak that would be generated by a total mixing of the stratified layers depends on the incubation time of the stratification Figure 17 BOG flowrate at rollover