First Quarter Report 2017 def - gruppomol.it Quarter Report 2017_def.pdf · Defined benefit program...
14
Gruppo MutuiOnline S.p.A. (in breve Gruppo MOL S.p.A. o MOL Holding S.p.A.) Sede Legale: Via F. Casati, 1/A - 20124 Milano, Italy Sede Operativa: Via Desenzano, 2 - 20146 Milano, Italy Tel +39.02.83.443.1 - Fax +39.02.91.39.08.63 - internet: www.gruppomol.it C.F. e P.I. 05072190969 - REA 1794425 – CCIAA 05072190969 Capitale Sociale Euro 1.000.000 Interamente Versato CONSOLIDATED INTERIM REPORT ON OPERATIONS THREE MONTHS ENDED MARCH 31, 2017 (FIRST QUARTER 2017) Prepared according to IAS/IFRS Unaudited
Transcript of First Quarter Report 2017 def - gruppomol.it Quarter Report 2017_def.pdf · Defined benefit program...

Gruppo MutuiOnline S.p.A. (in breve Gruppo MOL S.p.A. o MOL Holding S.p.A.) Sede Legale: Via F. Casati, 1/A - 20124 Milano, Italy
Sede Operativa: Via Desenzano, 2 - 20146 Milano, Italy
Tel +39.02.83.443.1 - Fax +39.02.91.39.08.63 - internet: www.gruppomol.it
C.F. e P.I. 05072190969 - REA 1794425 – CCIAA 05072190969
Capitale Sociale Euro 1.000.000 Interamente Versato
CONSOLIDATED INTERIM REPORT ON OPERATIONS
THREE MONTHS ENDED MARCH 31, 2017 (FIRST QUARTER 2017)
Prepared according to IAS/IFRS
Unaudited

2
INDEX
1. GOVERNING BODIES AND OFFICERS AS OF MARCH 31, 2017 ....................................... 3
2. ORGANIZATIONAL STRUCTURE ................................................................................................. 4
3. CONSOLIDATED FINANCIAL STATEMENTS .......................................................................... 6
3.1. Income statement ................................................................................................................................. 6
3.1.1. Quarterly consolidated income statement ..................................................................................................... 6
3.1.2. Consolidated income statement for the three months ended March 31, 2017 and 2016 ............................... 7
3.2. Balance sheet ......................................................................................................................................... 8
3.2.1. Consolidated balance sheet as of March 31, 2017 and December 31, 2016 ............................................... 8
3.3. Net financial position ........................................................................................................................... 9
3.3.1. Net financial position as of March 31, 2017 and December 31, 2016 ...................................................... 9
4. EXPLANATORY NOTES TO THE FINANCIAL STATEMENTS......................................... 10
4.1. Accounting principles and general valuation criteria ..................................................................... 10
4.2. Consolidation area .............................................................................................................................. 10
4.3. Comments to the most significant changes in items of the consolidated financial statements ............................................................................................................................................ 10
4.3.1. Income statement ..................................................................................................................................... 10
4.3.2. Balance sheet ........................................................................................................................................... 11
4.3.3. Net financial position .............................................................................................................................. 11
4.4. Segment reporting .............................................................................................................................. 11
4.4.1. Revenues by Division ............................................................................................................................... 11
4.4.2. Operating income by Division .................................................................................................................. 11
5. DIRECTORS’ REPORT ON OPERATIONS AND SIGNIFICANT EVENTS ..................... 12
5.1. Evolution of the Italian retail credit market ................................................................................... 12
5.2. Report on operations and foreseeable evolution for the Broking Division .............................. 12
5.3. Report on operations and foreseeable evolution for the BPO Division .................................... 13
6. DECLARATION OF THE MANAGER RESPONSIBLE FOR PREPARING THE COMPANY’S FINANCIAL REPORTS............................................................................................ 14

3
1. GOVERNING BODIES AND OFFICERS AS OF MARCH 31, 2017 BOARD OF DIRECTORS
Chairman of the Board Marco Pescarmona (1) (3) (5) (7) Chief Executive Officer Alessandro Fracassi (2) (3) (5) Directors Anna Maria Artoni (4) Fausto Boni Chiara Burberi (4) Andrea Casalini (4) Matteo De Brabant (4) Daniele Ferrero (4) (6) Alessandro Garrone Klaus Gummerer (4) Valeria Lattuada (4) Marco Zampetti BOARD OF STATUTORY AUDITORS
Chairman of the Board Fausto Provenzano Active Statutory Auditors Paolo Burlando Francesca Masotti Substitute Statutory Auditors Gianluca Lazzati Maria Concetta Russano INDEPENDENT AUDITORS EY S.p.A. COMMITTEES
Audit and Risk Committee
Chairman Daniele Ferrero Chiara Burberi Marco Zampetti Remuneration and Share Incentive Committee
Chairman Andrea Casalini Anna Maria Artoni Matteo De Brabant Committee for Transactions with Related Parties
Chairman Andrea Casalini Valeria Lattuada Klaus Gummerer (1) The Chairman is the Company’s legal representative.
(2) The Chief Executive Officer legally represents the Company, dis-jointly from the Chairman, within the limits of the delegated powers.
(3) Member of the Executive Committee.
(4) Independent non-executive Director.
(5) Holds executive offices in some Group companies.
(6) Lead Independent Director.
(7) Executive Director in charge of overseeing the Internal Control System.

4
2. ORGANIZATIONAL STRUCTURE
Gruppo MutuiOnline S.p.A. (the “Company” or the “Issuer”) is the holding company of a group of firms with a leadership position in the Italian market for the online comparison, promotion and intermediation of products provided by financial institutions and e-commerce operators (main websites www.mutuionline.it, www.prestitionline.it, www.segugio.it and www.trovaprezzi.it) and in the Italian market for the provision of complex business process outsourcing services for the financial sector (the “Group”).
The Issuer controls the following companies:
• MutuiOnline S.p.A., Money360.it S.p.A., CreditOnline Mediazione Creditizia S.p.A., CercAssicurazioni.it S.r.l., Segugio.it S.r.l., Segugio Servizi S.r.l., 7Pixel S.r.l., ShoppyDoo S.L.U. (a company with registered office in Spain), Klikkapromo S.r.l. and Innovazione Finanziaria SIM S.p.A.: operating in the market for the online comparison, promotion and intermediation of products provided by financial institutions and e-commerce operators to retail consumers; together they represent the Broking Division of the Group;
• Centro Istruttorie S.p.A., Centro Finanziamenti S.p.A., Quinservizi S.p.A., CESAM S.r.l., Mikono S.r.l., Effelle Ricerche S.r.l., Centro Processi Assicurativi S.r.l., EuroServizi per i Notai S.r.l., IN.SE.CO. S.r.l. and Finprom S.r.l.: companies operating in the Italian market for the provision of complex business processes outsourcing services for financial institutions; together they represent the BPO (i.e. Business Process Outsourcing) Division of the Group;
• PP&E S.r.l.: offering real estate renting and support services to the other Italian subsidiaries of the Issuer.
In addition, the Issuer holds a 50% stake in the joint venture Generale Servizi Amministrativi S.r.l., which provides integrated outsourcing services preparatory to tax advice; the activity of the company is related to Asset Management BPO, however, as it is not controlled by the Group, its results are consolidated with the equity method. Finally, the Group holds 40% of the share capital of Zoorate S.r.l., a company that develops and sells technological solutions for the on-line collection and management of customer reviews and opinions in the Italian market, and a 10% stake of the share capital of Generale Fiduciaria S.p.A..
Therefore, the consolidation area as of March 31, 2017 is the following:

5

6
3. CONSOLIDATED FINANCIAL STATEMENTS
3.1. Income statement
3.1.1. Quarterly consolidated income statement
Three months ended
(euro thousand)
March 31,
2017
December 31,
2016
September 30,
2016
June 30,
2016
March 31,
2016
Revenues 38,534 39,524 31,257 34,454 32,834
Other income 528 559 511 703 566
Capitalization of internal costs 199 402 162 213 162
Services costs (13,979) (14,053) (11,632) (13,101) (11,916)
Personnel costs (12,170) (12,407) (9,691) (11,333) (10,398)
Other operating costs (1,503) (890) (1,189) (1,008) (1,208)
Depreciation and amortization (1,754) (1,882) (1,860) (1,746) (1,789)
Operating income 9,855 11,253 7,558 8,182 8,251
Financial income 36 53 6 28 12
Financial expenses (224) (261) (234) (252) (286)
Income/(Losses) from investments (66) (3) 21 1 -
Income/(Expenses) from financial assets/liabilities - 27 (27) 22 (118)
Net income before income tax expense 9,601 11,069 7,324 7,981 7,859
Income tax expense (2,884) (2,262) (2,309) (2,274) (2,573)
Net income 6,717 8,807 5,015 5,707 5,286

7
3.1.2. Consolidated income statement for the three months ended March 31, 2017 and 2016
Three months ended
(euro thousand)
March 31,
2017
March 31,
2016Change %
Revenues 38,534 32,834 5,700 17.4%
Other income 528 566 (38) -6.7%
Capitalization of internal costs 199 162 37 22.8%
Services costs (13,979) (11,916) (2,063) 17.3%
Personnel costs (12,170) (10,398) (1,772) 17.0%
Other operating costs (1,503) (1,208) (295) 24.4%
Depreciation and amortization (1,754) (1,789) 35 -2.0%
Operating income 9,855 8,251 1,604 19.4%
Financial income 36 12 24 200.0%
Financial expenses (224) (286) 62 -21.7%
Income/(losses) from participation (66) - (66) N/A
Income/(losses) from financial assets/liabilities - (118) 118 -100.0%
Net income before income tax expense 9,601 7,859 1,742 22.2%
Income tax expense (2,884) (2,573) (311) 12.1%
Net income 6,717 5,286 1,431 27.1%
Attributable to:
Shareholders of the Issuer 6,399 4,283 2,116 49.4%
Minority interest 318 1,003 (685) -68.3%
8
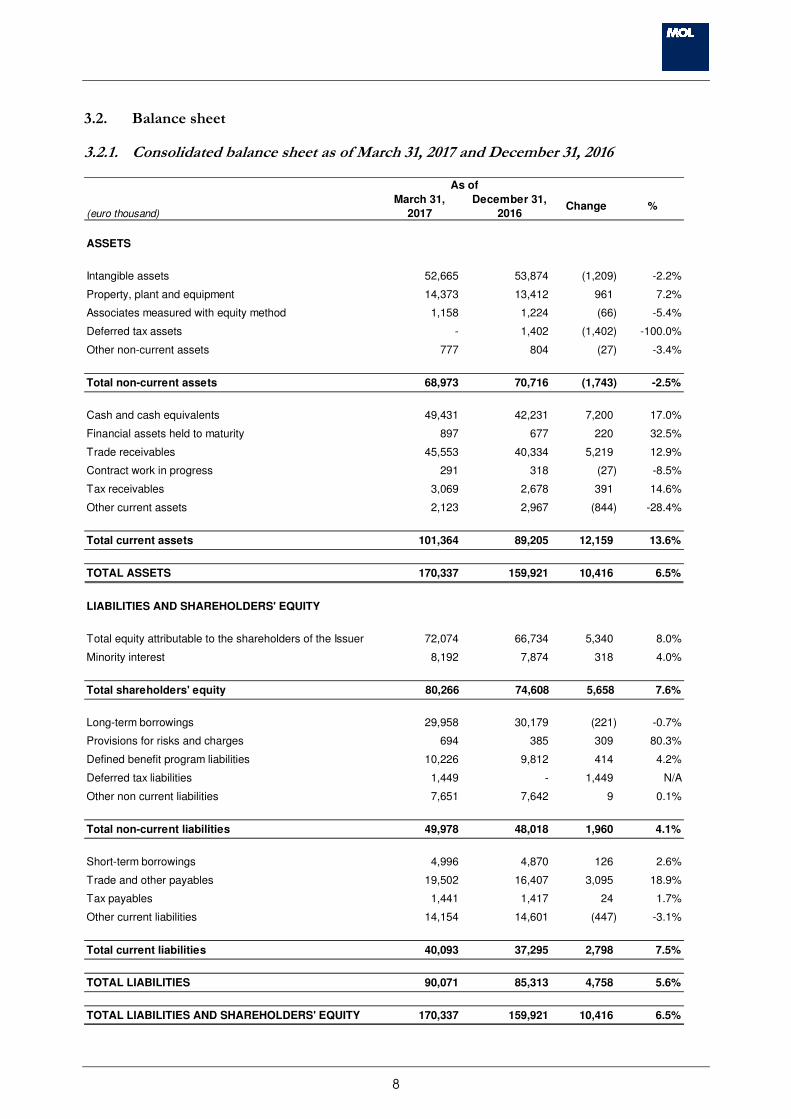
3.2. Balance sheet
3.2.1. Consolidated balance sheet as of March 31, 2017 and December 31, 2016
As of
(euro thousand)
March 31,
2017
December 31,
2016Change %
ASSETS
Intangible assets 52,665 53,874 (1,209) -2.2%
Property, plant and equipment 14,373 13,412 961 7.2%
Associates measured with equity method 1,158 1,224 (66) -5.4%
Deferred tax assets - 1,402 (1,402) -100.0%
Other non-current assets 777 804 (27) -3.4%
Total non-current assets 68,973 70,716 (1,743) -2.5%
Cash and cash equivalents 49,431 42,231 7,200 17.0%
Financial assets held to maturity 897 677 220 32.5%
Trade receivables 45,553 40,334 5,219 12.9%
Contract work in progress 291 318 (27) -8.5%
Tax receivables 3,069 2,678 391 14.6%
Other current assets 2,123 2,967 (844) -28.4%
Total current assets 101,364 89,205 12,159 13.6%
TOTAL ASSETS 170,337 159,921 10,416 6.5%
LIABILITIES AND SHAREHOLDERS' EQUITY
Total equity attributable to the shareholders of the Issuer 72,074 66,734 5,340 8.0%
Minority interest 8,192 7,874 318 4.0%
Total shareholders' equity 80,266 74,608 5,658 7.6%
Long-term borrowings 29,958 30,179 (221) -0.7%
Provisions for risks and charges 694 385 309 80.3%
Defined benefit program liabilities 10,226 9,812 414 4.2%
Deferred tax liabilities 1,449 - 1,449 N/A
Other non current liabilities 7,651 7,642 9 0.1%
Total non-current liabilities 49,978 48,018 1,960 4.1%
Short-term borrowings 4,996 4,870 126 2.6%
Trade and other payables 19,502 16,407 3,095 18.9%
Tax payables 1,441 1,417 24 1.7%
Other current liabilities 14,154 14,601 (447) -3.1%
Total current liabilities 40,093 37,295 2,798 7.5%
TOTAL LIABILITIES 90,071 85,313 4,758 5.6%
TOTAL LIABILITIES AND SHAREHOLDERS' EQUITY 170,337 159,921 10,416 6.5%

9
3.3. Net financial position
The following net financial position is calculated according with CONSOB communication N. DEM/6064293 dated July 28, 2006.
3.3.1. Net financial position as of March 31, 2017 and December 31, 2016
As of
(euro thousand)
March 31,
2017
December 31,
2016Change %
A. Cash and cash equivalents 49,431 42,231 7,200 17.0%
B. Other cash equivalents - - - N/A
C. Financial assets held to maturity or for trading 897 677 220 32.5%
D. Liquidity (A) + (B) + (C) 50,328 42,908 7,420 17.3%
E. Current financial receivables - - - N/A
F. Bank borrowings (4) (4) - 0.0%
G. Current portion of long-term borrowings (4,992) (4,866) (126) -2.6%
H. Other short-term borrowings - - - N/A
I. Current indebteness (F) + (G) + (H) (4,996) (4,870) (126) -2.6%
J. Net current financial position (I) + (E) + (D) 45,332 38,038 7,294 19.2%
K. Non-current portion of long-term bank borrowings (29,958) (30,179) 221 0.7%
L. Bonds issued - - - N/A
M. Other non-current borrowings - - - N/A
N. Non-current indebteness (K) + (L) + (M) (29,958) (30,179) 221 0.7%
O. Net financial position (J) + (N) 15,374 7,859 7,515 95.6%

10
4. EXPLANATORY NOTES TO THE FINANCIAL STATEMENTS
4.1. Accounting principles and general valuation criteria
This consolidated interim report on operations refers to the period from January 1, 2017 to March 31, 2017 (“first quarter 2017”) and has been prepared pursuant to Art. 154-ter of Consolidated Finance Law, introduced by Legislative Decree 195/2007, in accordance with CONSOB Communication n. DEM/8041082 dated April 30, 2008.
The valuation criteria and the income statement and balance sheet structures used for the preparation of this consolidated interim report on operations are the same used for the preparation of the consolidated financial report of Gruppo MutuiOnline S.p.A. as of and for the year ended December 31, 2016. Please refer to such documents for a description of those policies.
4.2. Consolidation area
All the companies controlled by Gruppo MutuiOnline S.p.A. are consolidated in this interim report on a line-by-line basis. The remaining companies participated by the Group are consolidated with the equity method.
The consolidation area, compared to December 31, 2016, date of reference for the consolidated annual financial report approved by the Board of Directors on March 14, 2017 and published afterwards, has not changed.
4.3. Comments to the most significant changes in items of the consolidated financial statements
4.3.1. Income statement
Revenues for the three months ended March 31, 2017 are Euro 38.5 million, up 17.4% compared to the same period of the previous financial year. For details of the Divisions’ contribution to revenues, please refer to section 4.4.1.
During the three months ended March 31, 2017, services costs show an increase of 17.3%. The increase is mainly due to the growth marketing costs, sustained by Broking Division, and of the costs for notarial services, due to the development of this area within Mortgage BPO.
Personnel costs for the three months ended March 31, 2017 increase by 17.0% compared to the same period of the previous financial year, in line with the growth of the operating activity of the Group.
Other operating costs show an increase of 24.4% in the three months ended March 31, 2017, compared to the same period of the previous financial year.
Depreciation and amortization for the three months ended March 31, 2017 are substantially stable compared to the same period of the previous financial year.
Consequently, the operating income for the three months ended March 31, 2017 grows by 19.4% compared to the same period of the previous financial year, passing from Euro 8.3 million in the first quarter 2016 to Euro 9.9 million in the first quarter 2017.
During the three months ended March 31, 2017, net financial income shows a negative balance, mainly due to the interest paid on the existing loans and to the losses deriving from the evaluation with the equity method of non-controlled participations.

11
4.3.2. Balance sheet
Cash and cash equivalents as of March 31, 2017 show an increase compared to December 31, 2016, mainly due to the growth of the cash generated by the operating activity.
Trade receivables and payables as of March 31, 2017 show an increase compared to December 31, 2016, due to the evolution of the operating activity during the period.
Deferred tax liabilities as of March 31, 2017, net of deferred tax assets, show an increase compared to December 31, 2016, following the estimation of the relevant income taxes of the period.
The other balance sheet items as of March 31, 2017, compared to December 31, 2016, do not show significant changes.
4.3.3. Net financial position The net financial position as of March 31, 2017 presents a cash balance equal to Euro 15.4 million, increasing by 95.6% compared to December 31, 2016, due, above all, to the cash generated by the operating activity.
4.4. Segment reporting
The primary segment reporting is by business segments, where the two business segments identified are the Broking and BPO Divisions (the “Divisions”).
The following is a description of revenues and operating income by Division.
4.4.1. Revenues by Division
Three months ended
(euro thousand)
March 31,
2017
March 31,
2016Change %
Broking Division revenues 17,527 14,386 3,141 21.8%
BPO Division revenues 21,007 18,448 2,559 13.9%
Total revenues 38,534 32,834 5,700 17.4%
Revenues for the three months ended March 31, 2017 increase by 17.4% compared to the same period of the previous financial year, due to the increase of both the revenues of the Broking Division, equal to 21.8%, and of the revenues of the BPO Division, equal to 13.9%.
The growth of the revenues of both Divisions is mainly pushed by the increase of the revenues of the mortgage-related business lines.
4.4.2. Operating income by Division
The following table displays the operating income by Division for the three months ended March 31, 2017 and 2016. The allocation of the costs incurred by the Issuer and by PP&E S.r.l. for the benefit of each Division is based on the relevant Italian headcount at the end of the period.

12
Three months ended
(euro thousand)
March 31,
2017
March 31,
2016Change %
Broking Division operating income 4,409 3,255 1,154 35.5%
BPO Division operating income 5,446 4,996 450 9.0%
Total operating income 9,855 8,251 1,604 19.4%
5. DIRECTORS’ REPORT ON OPERATIONS AND SIGNIFICANT EVENTS
5.1. Evolution of the Italian retail credit market
In the first quarter 2017, the purchase mortgage market continues to grow, due the progressive recovery of the residential real estate market, while the remortgage market continues to shrink, due to a physiological normalization process.
Data from Assofin, an industry association which represents the main lenders active in the sector, show a year on year growth of new residential mortgages equal to 17.0% in January and to 1.5% in February 2017, as a result of the growth of purchase mortgages and of the decrease of remortgages; according to the Assofin panel, mortgages for purposes different from house purchase, i.e. mainly re-financings, represent 32.7% of total origination flows in the first two months of 2017, compared to 41.2% to the first quarter 2016. Data from CRIF, a company which manages the main credit bureau in Italy, show a year on year increase of credit report inquiries for mortgages of 0.4% in the first quarter 2017 and of 1.7% in March 2017 alone.
For the rest of 2017, in a context of strengthening economic recovery and consumer confidence, we can expect a continuation of ongoing trends.
5.2. Report on operations and foreseeable evolution for the Broking Division
The current and foreseeable trend of the Broking Division, compared to the same period of the previous financial year, is the result of the positive contribution of Mortgage Broking and Insurance Broking, of the substantial stability of Personal Loan Broking and of the contraction of E-Commerce Price Comparison. New initiatives, which include utilities comparison services (broadband, energy), also provide a positive contribution to growth.
With respect to Mortgage Broking, results show significant year on year growth in the first months of 2017 thanks to the growth of purchase mortgages and a temporary unexpected recovery of re-mortgages, which still represent a very relevant portion of all brokered loans. For the following months, also as a function of the number of incoming applications, we can foresee a year on year increase of purchase mortgages and a decrease of remortgages, coherent with market trends.
Insurance Broking grows in the quarter, also thanks to the contribution of existing policy renewals, in a pricing environment in which we still do not see significant increases of motor TPL premiums, even if the reasons to expect a reversal of the insurance cycle during the year remain valid.
E-Commerce Price Comparison suffers of shrinking results, above all in terms of operating income, mainly due to the year on year decrease of organic traffic coming from the Google search engine, which started in December 2016 and is still ongoing.

13
5.3. Report on operations and foreseeable evolution for the BPO Division
The evolution of the results of the BPO Division in the three months ended March 31, 2017 was overall positive, in line with stated expectations. In fact, growth continues, even if at a slower pace compared to the previous year, with operating margins which remain at target levels.
Even the underlying trends are those already announced: Mortgage BPO grows (also thanks to the excellent performance of a new client), Insurance BPO recovers and Asset Management BPO confirms its organic growth. CQ Loan BPO is, however, substantially stable.
Therefore, we confirm the positive outlook which has been previously sketched, with the expectation of stable or slightly increasing revenues and operating income.

14
6. DECLARATION OF THE MANAGER RESPONSIBLE FOR PREPARING THE COMPANY’S FINANCIAL REPORTS
Declaration Pursuant to Art. 154/bis, Paragraph 2 – Part IV, Title III, Chapter II, Section V-bis, of Italian Legislative Decree No. 58 of 24 February 1998: “Consolidated Law on Financial Brokerage Pursuant to Articles 8 and 21 of Italian Law No. 52 of 6 February 1996”
Regarding: Consolidated interim report on operations for the three months ended March 31, 2017, issued on May 11, 2017
I, the undersigned, Francesco Masciandaro, the manager responsible for preparing the financial reports of Gruppo MutuiOnline S.p.A. hereby
CERTIFY
in accordance with the second paragraph of Art. 154-bis, Part IV, Title III, Chapter II, Section V-bis of Italian Legislative Decree No. 58 of 24 February 1998, that to the best of my knowledge, the consolidated interim report on operations for the three months ended March 31, 2017 corresponds with the accounting documents, ledgers and records.
Francesco Masciandaro
Gruppo MutuiOnline S.p.A.