First Quarter Presentation May 2021
14
First Quarter Presentation May 2021
Transcript of First Quarter Presentation May 2021

First Quarter Presentation May 2021

2
MATTERS DISCUSSED IN THIS DOCUMENT MAY CONSTITUTE FORWARD-LOOKING STATEMENTS. THE PRIVATE SECURITIES LITIGATIONREFORM ACT OF 1995 PROVIDES SAFE HARBOR PROTECTIONS FOR FORWARD-LOOKING STATEMENTS IN ORDER TO ENCOURAGECOMPANIES TO PROVIDE PROSPECTIVE INFORMATION ABOUT THEIR BUSINESS. FORWARD-LOOKING STATEMENTS INCLUDESTATEMENTS CONCERNING PLANS, OBJECTIVES, GOALS, STRATEGIES, FUTURE EVENTS OR PERFORMANCE, AND UNDERLYINGASSUMPTIONS AND OTHER STATEMENTS, WHICH ARE OTHER THAN STATEMENTS OF HISTORICAL FACTS.
FRONTLINE DESIRES TO TAKE ADVANTAGE OF THE SAFE HARBOR PROVISIONS OF THE PRIVATE SECURITIES LITIGATION REFORM ACTOF 1995 AND IS INCLUDING THIS CAUTIONARY STATEMENT IN CONNECTION WITH THIS SAFE HARBOR LEGISLATION. THE WORDS“BELIEVE,” “ANTICIPATE,” “INTENDS,” “ESTIMATE,” “FORECAST,” “PROJECT,” “PLAN,” “POTENTIAL,” “MAY,” “SHOULD,” “EXPECT” “PENDING”AND SIMILAR EXPRESSIONS IDENTIFY FORWARD-LOOKING STATEMENTS.
THE FORWARD-LOOKING STATEMENTS IN THIS DOCUMENT ARE BASED UPON VARIOUS ASSUMPTIONS, MANY OF WHICH ARE BASED, INTURN, UPON FURTHER ASSUMPTIONS, INCLUDING WITHOUT LIMITATION, MANAGEMENT'S EXAMINATION OF HISTORICAL OPERATINGTRENDS, DATA CONTAINED IN FRONTLINE’S RECORDS AND OTHER DATA AVAILABLE FROM THIRD PARTIES. ALTHOUGH FRONTLINEBELIEVES THAT THESE ASSUMPTIONS WERE REASONABLE WHEN MADE, BECAUSE THESE ASSUMPTIONS ARE INHERENTLY SUBJECT TOSIGNIFICANT UNCERTAINTIES AND CONTINGENCIES WHICH ARE DIFFICULT OR IMPOSSIBLE TO PREDICT AND ARE BEYOND FRONTLINE’SCONTROL, YOU CANNOT BE ASSURED THAT FRONTLINE WILL ACHIEVE OR ACCOMPLISH THESE EXPECTATIONS, BELIEFS ORPROJECTIONS. THE INFORMATION SET FORTH HEREIN SPEAKS ONLY AS OF THE DATES SPECIFIED AND FRONTLINE UNDERTAKES NODUTY TO UPDATE ANY FORWARD-LOOKING STATEMENT TO CONFORM THE STATEMENT TO ACTUAL RESULTS OR CHANGES INEXPECTATIONS OR CIRCUMSTANCES.
IMPORTANT FACTORS THAT, IN FRONTLINE’S VIEW, COULD CAUSE ACTUAL RESULTS TO DIFFER MATERIALLY FROM THOSE DISCUSSEDIN THE FORWARD-LOOKING STATEMENTS INCLUDE, WITHOUT LIMITATION: THE STRENGTH OF WORLD ECONOMIES AND CURRENCIES,GENERAL MARKET CONDITIONS, INCLUDING FLUCTUATIONS IN CHARTERHIRE RATES AND VESSEL VALUES, CHANGES IN DEMAND IN THETANKER MARKET, INCLUDING BUT NOT LIMITED TO CHANGES IN OPEC'S PETROLEUM PRODUCTION LEVELS AND WORLD WIDE OILCONSUMPTION AND STORAGE, CHANGES IN FRONTLINE’S OPERATING EXPENSES, INCLUDING BUNKER PRICES, DRYDOCKING ANDINSURANCE COSTS, THE MARKET FOR FRONTLINE’S VESSELS, AVAILABILITY OF FINANCING AND REFINANCING, ABILITY TO COMPLY WITHCOVENANTS IN SUCH FINANCING ARRANGEMENTS, FAILURE OF COUNTERPARTIES TO FULLY PERFORM THEIR CONTRACTS WITH US,CHANGES IN GOVERNMENTAL RULES AND REGULATIONS OR ACTIONS TAKEN BY REGULATORY AUTHORITIES, POTENTIAL LIABILITYFROM PENDING OR FUTURE LITIGATION, GENERAL DOMESTIC AND INTERNATIONAL POLITICAL CONDITIONS, POTENTIAL DISRUPTION OFSHIPPING ROUTES DUE TO ACCIDENTS OR POLITICAL EVENTS, VESSEL BREAKDOWNS, INSTANCES OF OFF-HIRE AND OTHER IMPORTANTFACTORS. FOR A MORE COMPLETE DISCUSSION OF THESE AND OTHER RISKS AND UNCERTAINTIES ASSOCIATED WITH FRONTLINE’SBUSINESS, PLEASE REFER TO FRONTLINE’S FILINGS WITH THE SECURITIES AND EXCHANGE COMMISSION, INCLUDING, BUT NOT LIMITEDTO, ITS ANNUAL REPORT ON FORM 20-F.
THIS PRESENTATION IS NOT AN OFFER TO PURCHASE OR SELL, OR A SOLICITATION OF AN OFFER TO PURCHASE OR SELL, ANYSECURITIES OR A SOLICITATION OF ANY VOTE OR APPROVAL.
Forward Looking Statements

Highlights
• Net income of $28.9 million, or $0.15 per diluted share
• Adjusted net income of $8.8 million, or $0.04 per diluted share
Q1 2021 Q2 2021 est. % done
$19,000 $18,100 70%
$15,200 $13,600 63%
$12,000 $14,200 59%
Reported earnings basis load to discharge
VLCC
LR2/Aframax
Suezmax
• The LR2 newbuildings Front Fusion and Front Future delivered in March and April 2021
• Acquisition through resale of six VLCCs – latest generation ECO-type currently under
construction at the HHI shipyard in South Korea
3

2021 2020 2020
(in thousands of $ except per share data) Jan - Mar Oct - Dec Jan - Dec
Total operating revenues (net of voyage expenses) 107 113 100 633 868 089
Other operating gain 537 6 996 29 902
Contingent rental (income) expense (663) 2 472 14 568
Ship operating expenses 39 427 50 456 183 063
Charter hire expenses 2 271 2 547 9 557
Administrative expenses 6 384 13 178 44 238
EBITDA 80 370 43 432 627 018
EBITDA adj (*) 59 050 31 144 632 407
Interest expense (14 760) (15 197) (72 160)
Net income 28 895 (9 187) 412 875
Net income adj (*) 8 774 (20 224) 421 602
Diluted earnings per share 0,15 (0,05) 2,09
Diluted earnings per share adjusted 0,04 (0,10) 2,13
4
Note: Diluted earnings per share is based on 197,775 and 197,692
weighted average shares (in thousands) outstanding for Q1 2021
and Q4 2020, respectively
*See Appendix 1 for reconciliation to nearest comparable GAAP
figures
Adjustment items for Q1 2021:
Income Statement – Highlights
• $3.1 million unrealized gain on marketable
securities
• $15.7 million gain on derivatives
• $0.1 million share of results of associated
companies
• $1.2 million amortization of acquired time
charters

2021 2020
(in millions $) Mar 31 Dec 31
Assets
Cash 154 190
Other current assets 221 189
Non-current assets
Vessels and newbuildings 3 423 3 418
Goodwill 112 112
Other long-term assets 18 10
Total assets 3 928 3 918
Liabilities and Equity
Short term debt and current portion of long term debt 172 167
Obligations under finance and operational lease 9 12
Other current liabilities 92 102
Non-current liabilities
Long term debt 1 961 1 969
Obligations under finance and operating lease 51 53
Other long-term liabilities 2 4
Noncontrolling interest (0) (0)
Frontline Ltd. stockholders' equity 1 641 1 612
Total liabilities and stockholders' equity 3 928 3 918
5
Balance Sheet - Highlights
Notes
• $380 million in cash and cash equivalents,
including undrawn amount of unsecured
facility, marketable securities and minimum
cash requirements bank as per 31.03.21
• No material debt maturities until 2023

Daily cash breakeven and OPEX
Note: Daily cash breakeven in USD based on estimate for remainder of 2021. Cash generation 365 days from 1. April 2021 and adjusted for NB deliveries
Cash sensitivity above breakeven levels
6
Cash Breakeven and Cash Generation PotentialLow cash breakeven levels provide significant operating leverage & protect our cash
flows during periods of market weakness
$18 100
$21 500
$17 700
$15 900
$7 300 $7 100 $7 200
-
5 000
10 000
15 000
20 000
25 000
VLCC Suezmax LR2
Cash breakeven 2021 Opex Q1 2021 Avg. breakeven Fleet 2021
$235
$458
$682
$905
$ 1,19
$ 2,32
$ 3,45
$ 4,58
-
0,50
1,00
1,50
2,00
2,50
3,00
3,50
4,00
4,50
5,00
-
200
400
600
800
1 000
$10 000 $20 000 $30 000 $40 000
$ p
er s
hare
/ ye
ar
$ m
illio
ns /
year
$/day above BE rates
Cash generation above BE rates Total cash generation per share
7Source: EIA May-21, Baltic Exchange
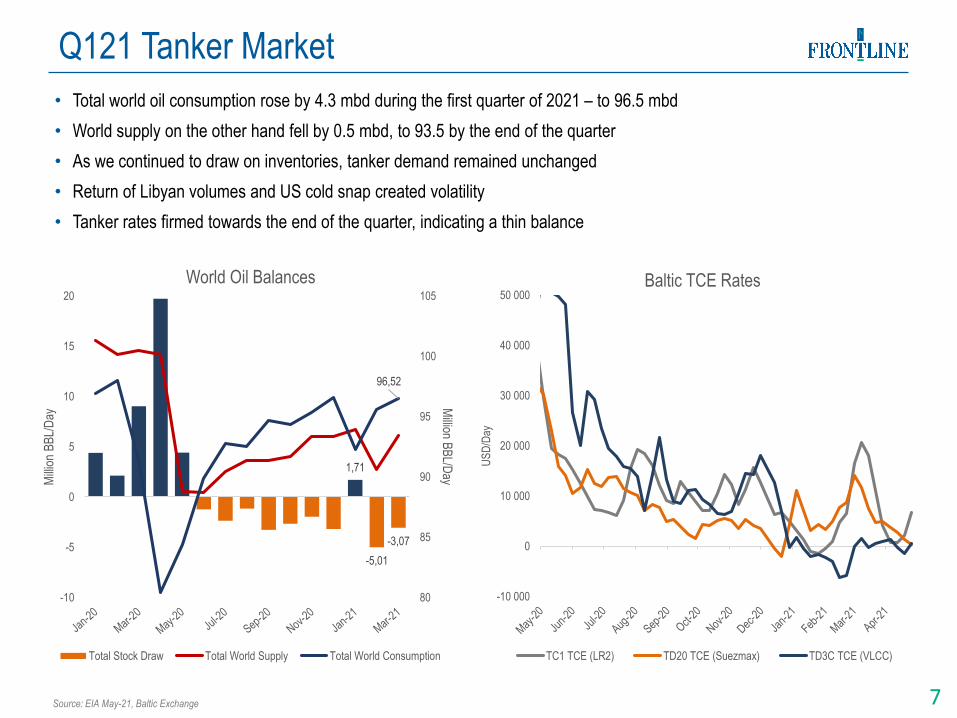
Q121 Tanker Market
• Total world oil consumption rose by 4.3 mbd during the first quarter of 2021 – to 96.5 mbd
• World supply on the other hand fell by 0.5 mbd, to 93.5 by the end of the quarter
• As we continued to draw on inventories, tanker demand remained unchanged
• Return of Libyan volumes and US cold snap created volatility
• Tanker rates firmed towards the end of the quarter, indicating a thin balance
1,71
-5,01
-3,07
96,52
80
85
90
95
100
105
-10
-5
0
5
10
15
20
Million B
BL/D
ayMill
ion
BB
L/D
ay
World Oil Balances
Total Stock Draw Total World Supply Total World Consumption
-10 000
0
10 000
20 000
30 000
40 000
50 000
US
D/D
ay
Baltic TCE Rates
TC1 TCE (LR2) TD20 TCE (Suezmax) TD3C TCE (VLCC)

8Source: Fearnleys; Frontline
Tanker OrderbooksTanker recycling activity muted as the fleet continues to age
3 1 5 7 9 11 14 13
2835
29
1218
713
2732 35
2029
10 11
14
189
-34
-13
-28
-40
-30
-20
-10
0
10
20
30
40
# of
ves
sels
LR2
Delivered Sum on Order Over 15Y
18 1424 21 25 23 25 23
14
4537
43 45
178 9
26
51
31 2618 14
8 31
3
-18 -24-15 -13 -7 -4 -1 -6 -10 -8
-19-4 -8
-1-12
-23
-4 -1
-32-24 -21
-40
-30
-20
-10
0
10
20
30
40
50
60
# of
ves
sels
Suezmax
Delivered Sum on order Scrapped Over 20Y
3827
36 36 29 3119
2839
53 58 6549
31 23 21
47 4940
68
37
14
-28 -26 -34 -28
-3 -1 -3 -9 -13 -6-16 -18
-7 -1 -2 -10-31
-4 -1 -3
-65
-36 -36
25 55
17
-80
-60
-40
-20
0
20
40
60
80
# of
ves
sels
VLCC
Delivered Scrapped Over20Y Sum on order
• On all asset classes we observe delayed recycling. We see little
support for keeping older tonnage in this market
• Recycling prices are up 30% year to date to 550 $/ldt or ~23 Million
USD for a VLCC
• We continue to see demand for vintage tonnage from undisclosed
buyers
• The overall tanker orderbook has shrunk year to date by ~4% as
vessels deliver, and new ordering has been relatively muted
• 28 new orders has been placed for VLCC’s year to date, as 25
vessels are delivered, the orderbook is flat

9Source: Clarkson-SIN
Asset prices on the moveSteel prices and high activity in other segments fuel the market
Commentary
• Over 170 new orders for Containerships
last 6m has kept yards busy
• New ordering on LPG and confirmation of
LNG orders has further contributed to
activity
• In line with the entire commodity space,
steel prices have appreciated sharply
• The fundamentals of the tanker market
suggest a tightening of capacity over the
coming years
• Regulatory tightening in respect of GHG
further supports the case of investing in
modern, fuel-efficient ships
• Propulsion is yet not the driver, yard
capacity is
200
300
400
500
600
700
800
900
35
55
75
95
115
135
155
Jan-
08
Jul-0
8
Jan-
09
Jul-0
9
Jan-
10
Jul-1
0
Jan-
11
Jul-1
1
Jan-
12
Jul-1
2
Jan-
13
Jul-1
3
Jan-
14
Jul-1
4
Jan-
15
Jul-1
5
Jan-
16
Jul-1
6
Jan-
17
Jul-1
7
Jan-
18
Jul-1
8
Jan-
19
Jul-1
9
Jan-
20
Jul-2
0
Jan-
21
US
D/T
on
Mill
ion
US
D
Newbuilding and Steel prices
Suezmax NB Price VLCC NB Price
LR2 NB Price China 20mm Steel Plate Price (RHS)

10Source: EIA May-21, S&P Global Platts Analytics
Short Term Outlook
• OPEC+ production increases are on going, slowly adding to transportation demand
• Asia, and in particular China, are coming out of refinery maintenance in May & June
• Oil demand continues to recover, now US and Europe in focus – coming out of lockdowns
• Inventories, both on land and floating, are now normalized - at pre Covid-19 levels
• From where we are now, oil supply is expected to grow ~6 mbd by year end
+ 1,84 + 1,33 + 1,20
+ 0,41 + 0,72
(3,32) (3,25)
(0,53) (0,53) (0,08)
- 4,00
- 3,00
- 2,00
- 1,00
+ 0,00
+ 1,00
+ 2,00
+ 3,00
Gasoline Jet Diesel Fuel oil Other
Mill
ion
BB
L/D
ay
Key to demand bounce in 2021
2021 2020

11Source: Clarkson SIN
Summary
• All key macro indicators points towards a firm recovery, Global GDP is expected up 6% this year
• Asset prices are on the move as yard capacity is tightening and steel prices are increasing
• Global oil supply is expected to grow by ~6 mbd by the end of 2021
• Covid-19 vaccination pace in the developed countries very encouraging, countries opening up
• The cyclical recovery run has started, all key shipping sectors are firm, tankers next?
• Frontline is ideally positioned to capitalize on the anticipated recovery in tanker markets with our modern,
spot exposed, fuel-efficient fleet
-15
-10
-5
0
5
10
15
20
25
Jan-18 Apr-18 Jul-18 Oct-18 Jan-19 Apr-19 Jul-19 Oct-19 Jan-20 Apr-20 Jul-20 Oct-20 Jan-21 Apr-21
Yea
r ov
er Y
ear
% G
row
th
Key Shipping Sectors
Dry Bulk Growth Indicator Container Trade Growth Indicator LNG Trade Growth Indicator LPG Trade Growth Indicator Oil+Product Trade Growth Indicator

Questions & Answers

www.frontline.bm

This presentation describes: total operating revenues net of
voyage expenses, net income attributable to the Company
adjusted for certain non-cash items ("Net income adj.") and
related per share amounts and Earnings Before Interest, Tax,
Depreciation & Amortisation adjusted for the same non-cash
items ("EBITDA adj."), which are not measures prepared in
accordance with US GAAP (“non-GAAP”).
We believe the non-GAAP financial measures presented in this
press release provides investors with a means of evaluating and
understanding how the Company’s management evaluates the
Company’s operating performance.
These non-GAAP financial measures should not be considered
in isolation from, as substitutes for, nor superior to financial
measures prepared in accordance with GAAP.
14
AppendixAppendix I
Reconciliation
(Million $ except per share) Q1 2021 Q4 2020 FY 2020
Total operating revenues net of voyage expenses
Total operating revenues 194 175 1 221
Voyage expenses -87 -74 -353
Total operating revenues net of voyage expenses 107 101 868
Net income adj.
Net income attributable to the Company 29 -9 413
Add back:
Unrealized loss on marketable securities 0 0 5
Share of losses of associated company 0 2 6
Loss on derivatives 0 0 22
Less:
Gain on sale of subsidiary 0 -7 -7
Gain on termination of lease (net of cash received) 0 0 -4
Share of results of associated company 0 0 -1
Gain on settlement of claim 0 0 -2
Unrealized gain on marketable securities -3 -2 -3
Gain on derivatives -16 -3 -3
Amortization of acquired time charters -1 -1 -4
Net income adj. 9 -20 422
(in thousands)
Weighted average number of ordinary shares (basic) 197 962 197 692 195 637
Weighted average number of ordinary shares (diluted) 197 775 197 692 197 808
(in $)
Basic earnings per share adjusted for certain non-cash items 0,04 -0,10 2,16
Diluted earnings per share adjusted for certain non-cash items 0,04 -0,10 2,13
EBITDA adj.
Net income attributable to the Company 29 -9 413
Add back:
Interest expense 15 15 72
Depreciation 36 36 139
Income tax expense 0 0 0
Net income attributable to the non-controlling interest 0 0 0
Share of losses of associated company 0 2 6
Unrealized loss on marketable securities 0 0 5
Loss on derivatives 0 0 22
Less:
Gain on sale of subsidiary 0 -7 -7
Gain on termination of lease (net of cash received) 0 0 -4
Unrealized gain on marketable securities -3 -2 -3
Gain on settlement of claim 0 0 -2
Share of results of associated company 0 0 -1
Gain on derivatives -16 -3 -3
Amortization of acquired time charters -1 -1 -4
EBITDA adj. 59 31 632