First quarter operations review - riotinto.com · Page 2 of 25 • On 8 April 2019, Rio Tinto...
25
First quarter operations review Page 1 of 25 Rio Tinto releases first quarter production results 16 April 2019 Rio Tinto chief executive J-S Jacques said “Our iron ore business faced several challenges at the start of this year, particularly from tropical cyclones. As a result, and following the continuing assessment of damage at the port resulting from the cyclones and other minor disruptions, 2019 guidance for Pilbara shipments is reduced to between 333 and 343 million tonnes. The quarterly operational performance in our other products was solid, generally higher than last year. Our focus remains on safety, delivering our ‘value over volume’ strategy and allocating capital with discipline, to continue delivering superior returns to our shareholders in the short, medium and long term.” Q1 2019 vs Q1 2018 vs Q4 2018 Pilbara iron ore shipments (100% basis) Mt 69.1 -14% -21% Pilbara iron ore production (100% basis) Mt 76.0 -9% -12% Bauxite kt 12,763 +1% +8% Aluminium kt 796 +0% -3% Mined copper kt 143.9 +3% -5% Titanium dioxide slag kt 296 +1% +1% IOC iron ore pellets and concentrate Mt 2.5 +5% -13% Operational update • Pilbara iron ore shipments of 69.1 million tonnes (100 per cent basis) in the first quarter were 14 per cent lower than the first quarter of 2018. Production was significantly impacted by the weather disruptions in March and a fire at Cape Lambert A in January. These events will have an impact on second quarter performance. • 2019 guidance for Pilbara shipments has been revised to between 333 and 343 million tonnes (previously between 338 and 350 million tonnes, 100 per cent basis). The reduction reflects a slower ramp up and ongoing disruption to shipments caused by weather and other disruptions. • Commissioning of the Amrun bauxite mine was completed in March 2019, with the project delivered under budget and ahead of schedule. Bauxite production of 12.8 million tonnes in the quarter was one per cent higher than the same period of 2018, despite several weather events throughout the quarter significantly impacting production at the Amrun, Weipa and Gove mines. • Aluminium production of 0.8 million tonnes was in line with the first quarter of 2018. Excluding the non-managed Becancour smelter, which was impacted by a lock-out, production was one per cent higher, reflecting continued productivity creep. • First quarter mined copper production of 144 thousand tonnes was three per cent higher than the first quarter of 2018, with strong contributions from Oyu Tolgoi and Rio Tinto Kennecott. • Titanium dioxide slag production of 296 thousand tonnes was one per cent higher than the first quarter of 2018. • First quarter production at Iron Ore Company of Canada was five per cent higher than the corresponding quarter of 2018, despite adverse weather conditions impacting production in February. • At the Oyu Tolgoi Underground Project the review of the mine design and the development schedule is continuing. The commissioning of the main production shaft (Shaft 2) is now expected to complete in October 2019. • On 27 February 2019, Rio Tinto announced it had discovered copper-gold mineralisation in the Paterson Province in the far east Pilbara region of Western Australia.
Transcript of First quarter operations review - riotinto.com · Page 2 of 25 • On 8 April 2019, Rio Tinto...

First quarter operations review
Page 1 of 25
Rio Tinto releases first quarter production results
16 April 2019
Rio Tinto chief executive J-S Jacques said “Our iron ore business faced several challenges at the start of
this year, particularly from tropical cyclones. As a result, and following the continuing assessment of
damage at the port resulting from the cyclones and other minor disruptions, 2019 guidance for Pilbara
shipments is reduced to between 333 and 343 million tonnes. The quarterly operational performance in our
other products was solid, generally higher than last year. Our focus remains on safety, delivering our ‘value
over volume’ strategy and allocating capital with discipline, to continue delivering superior returns to our
shareholders in the short, medium and long term.”
Q1 2019 vs Q1 2018 vs Q4 2018
Pilbara iron ore shipments (100% basis) Mt 69.1 -14% -21%
Pilbara iron ore production (100% basis) Mt 76.0 -9% -12%
Bauxite kt 12,763 +1% +8%
Aluminium kt 796 +0% -3%
Mined copper kt 143.9 +3% -5%
Titanium dioxide slag kt 296 +1% +1%
IOC iron ore pellets and concentrate Mt 2.5 +5% -13%
Operational update
• Pilbara iron ore shipments of 69.1 million tonnes (100 per cent basis) in the first quarter were 14
per cent lower than the first quarter of 2018. Production was significantly impacted by the weather
disruptions in March and a fire at Cape Lambert A in January. These events will have an impact on
second quarter performance.
• 2019 guidance for Pilbara shipments has been revised to between 333 and 343 million tonnes
(previously between 338 and 350 million tonnes, 100 per cent basis). The reduction reflects a
slower ramp up and ongoing disruption to shipments caused by weather and other disruptions.
• Commissioning of the Amrun bauxite mine was completed in March 2019, with the project delivered
under budget and ahead of schedule. Bauxite production of 12.8 million tonnes in the quarter was
one per cent higher than the same period of 2018, despite several weather events throughout the
quarter significantly impacting production at the Amrun, Weipa and Gove mines.
• Aluminium production of 0.8 million tonnes was in line with the first quarter of 2018. Excluding the
non-managed Becancour smelter, which was impacted by a lock-out, production was one per cent
higher, reflecting continued productivity creep.
• First quarter mined copper production of 144 thousand tonnes was three per cent higher than the
first quarter of 2018, with strong contributions from Oyu Tolgoi and Rio Tinto Kennecott.
• Titanium dioxide slag production of 296 thousand tonnes was one per cent higher than the first
quarter of 2018.
• First quarter production at Iron Ore Company of Canada was five per cent higher than the
corresponding quarter of 2018, despite adverse weather conditions impacting production in
February.
• At the Oyu Tolgoi Underground Project the review of the mine design and the development
schedule is continuing. The commissioning of the main production shaft (Shaft 2) is now expected
to complete in October 2019.
• On 27 February 2019, Rio Tinto announced it had discovered copper-gold mineralisation in the
Paterson Province in the far east Pilbara region of Western Australia.

Page 2 of 25
• On 8 April 2019, Rio Tinto announced the approval of the construction of the Zulti South project at
Richards Bay Minerals (RBM) in South Africa for $463 million (Rio Tinto share $343 million).
• On 15 April 2019, Rio Tinto announced it had committed $302 million ($166 million Rio Tinto share)
of additional expenditure to advance its Resolution Copper project in the US state of Arizona
All figures in this report are unaudited. All currency figures in this report are US dollars, and comments refer to Rio Tinto’s share of production, unless otherwise stated. To allow production numbers to be compared on a like-for-like basis, production from asset divestments completed in 2018 is excluded from Rio Tinto share of production data but assets sold in 2019 remain in comparisons.

Page 3 of 25
IRON ORE
Rio Tinto share of production (million tonnes)
Q1 2019 vs Q1 2018 vs Q4 2018
Pilbara Blend Lump 20.0 -4% -8%
Pilbara Blend Fines (a) 28.8 -3% -9%
Robe Valley Lump 0.6 -60% -55%
Robe Valley Fines 1.2 -60% -52%
Yandicoogina Fines (HIY) 13.5 -3% -9%
Total Pilbara production 64.1 -7% -11%
Total Pilbara production (100% basis) 76.0 -9% -12%
Total Pilbara shipments (100% basis) 69.1 -14% -21%
(a) Pilbara Blend Fines sales include 1.5 million tonnes of other lower grade materials in Q1 2019
Pilbara operations
Pilbara operations produced 76.0 million tonnes (Rio Tinto share 64.1 million tonnes) in the first quarter,
nine per cent lower than the same period in 2018. Production was impacted by a fire at Cape Lambert A in
January, which affected Robe Valley Lump and Fines production, and significant disruptions caused
primarily by Tropical Cyclone Veronica in March.
First quarter sales of 69.1 million tonnes (Rio Tinto share 58.2 million tonnes) were 14 per cent lower than
the same period of last year due to the lower production and damage to the port facilities caused by the
cyclone.
Approximately 16 per cent of sales in the first quarter were priced by reference to the prior quarter’s
average index lagged by one month. The remainder was sold either on current quarter average, current
month average or on the spot market.
Approximately 33 per cent of sales in the quarter were made free on board (FOB), with the remainder sold
including freight.
Pilbara projects
Following approval of the $2.6 billion investment in the Koodaideri replacement mine in November 2018,
the project is now progressing to plan with engineering and procurement activities on schedule and site
construction works commenced.
The two Robe River Joint Venture projects (West Angelas and Robe Valley), which will sustain production
capacity, are progressing. The projects are currently in the process of seeking environmental approvals.
Engineering and procurement activities are on schedule and establishment activities at both locations have
commenced.
2019 guidance On 1 April 2019, Rio Tinto announced that the impact of the disruption caused by Tropical Cyclone Veronica in March, combined with the impact of the fire at Cape Lambert A in January, was expected to result in a loss of approximately 14 million tonnes of production in 2019. Following further assessment, the damage to the port from Tropical Cyclone Veronica is expected to result in ongoing disruption to shipments, with recovery work further hindered by Tropical Cyclone Wallace. As a result, Rio Tinto’s Pilbara shipments in 2019 are now expected to be between 333 and 343 million tonnes (previously at the lower end of the guidance range of between 338 and 350 million tonnes, 100 per cent basis). The recovery in the second quarter will remain subject to weather.
On 6 April 2019, a minor fire occurred in a screen house at the East Intercourse Island port. Operations at
the facility have restarted. Rio Tinto’s Pilbara unit cost guidance in 2019 remains at $13 - $14 per tonne.

Page 4 of 25
ALUMINIUM
Rio Tinto share of production (‘000 tonnes)
Q1 2019 vs Q1 2018 vs Q4 2018
Rio Tinto Aluminium
Bauxite 12,763 +1% +8%
Bauxite third party shipments 8,842 +7% +20%
Alumina 2,008 +1% -1%
Aluminium 796 +0% -3%
Bauxite
First quarter bauxite production of 12.8 million tonnes was one per cent higher than the same period of
2018. Increased production capacity following the expansion of Amrun in Queensland was partly offset by
weather events throughout the quarter at Weipa, Amrun and Gove, which significantly impacted
production. Amrun ramp-up is progressing well, with production rates as per plan. The expansion project at
CBG, a non-managed JV, is progressing, with full ramp up expected in 2019.
8.8 million tonnes of bauxite were shipped to third parties in the first quarter, seven per cent higher than
same period of 2018.
Amrun
The Amrun project was officially opened on 8 March 2019 and commissioning is complete. The project and
construction workforce has been demobilised.
Alumina
Alumina production in the first quarter of 2019 was one per cent higher than the same period in 2018.
Aluminium
Aluminium production of 0.8 million tonnes in the first quarter was in line with the corresponding period of
2018. Excluding production from the non-managed Becancour smelter, which continues to be impacted by
a lock-out, production was one per cent higher, reflecting continued productivity creep.
Kemano
At the Kemano hydro-power facility at Kitimat, British Columbia, boring of the tunnel commenced on 9
March 2019. The $0.5 billion project is due to be completed by late-2020.
2019 guidance 2019 guidance is unchanged. Rio Tinto’s expected share of bauxite production in 2019 is between 56 and 59 million tonnes. Aluminium production guidance is between 3.2 and 3.4 million tonnes and alumina production guidance is 8.1 to 8.4 million tonnes.

Page 5 of 25
COPPER & DIAMONDS
Rio Tinto share of production (‘000 tonnes)
Q1 2019 vs Q1 2018 vs Q4 2018
Mined copper
Rio Tinto Kennecott 52.5 +48% -10%
Escondida 76.0 -16% -5%
Oyu Tolgoi 15.4 +18% +11%
Refined copper
Rio Tinto Kennecott 29.6 -16% -54%
Escondida 18.7 -10% -13%
Diamonds (‘000 carats)
Argyle 2,786 -22% -13%
Diavik 1,010 -5% -6%
Rio Tinto Kennecott
First quarter mined copper production was 48 per cent higher than the same period of 2018 as mining
activity continued in a higher grade area of the pit, coupled with productivity improvements and increased
plant throughput.
Refined copper was 16 per cent lower than the first quarter of 2018 and significantly lower than the
previous quarter due to a planned anode furnace shutdown at the smelter in February.
Rio Tinto Kennecott continues to toll and purchase third party concentrate to optimise smelter utilisation,
with 5.6 thousand tonnes of concentrate received for processing in the first quarter of 2019, compared with
51.8 thousand tonnes in the first quarter of 2018. Purchased and tolled copper concentrate are excluded
from reported production figures.
As previously guided, the production profile will see increased variability in grade in 2019 as operations
mine in lower levels of the pit, together with waste stripping related to the south wall pushback expansion.
Anticipated south wall pushback grades begin to increase in late-2020 and are expected to offset this
variability over the longer term.
Grades were also higher in the first quarter for molybdenum, with concentrate production 29 per cent
higher than the same quarter in 2018. Molybdenum concentrate production is expected to increase in the
second quarter of 2019.
Escondida
Mined copper production at Escondida in the first quarter of 2019 was 16 per cent lower than the same
period of 2018 due to lower grades.
Oyu Tolgoi
Mined copper production from the open pit in the first quarter of 2019 was 18 per cent higher than the
same period in 2018, with higher copper grades and recovery partly offset by lower plant throughput due to
the processing of harder ore.
Oyu Tolgoi Underground Project
Work is underway at the Oyu Tolgoi Underground Project to understand the overall cost and schedule
impacts resulting from the review of the mine design and delays with the fit-out and commissioning work on
Shaft 2, as announced in February 2019.
Work continues on critical Shaft 2 equipping activities, central heating plant, mine infrastructure,
underground materials handling systems and on priority underground development. Pre sinking works for
Shaft 3 and Shaft 4 have commenced.

Page 6 of 25
The mine design work, announced in February, to adjust to more detailed geotechnical information and
difficult ground conditions continues. Also as announced in February, there have been further delays in the
technically complex fit-out and commissioning work on the main production and services shaft (Shaft 2). It
is now anticipated that the commissioning of Shaft 2 will be completed by the end of October 2019. This
further delay in Shaft 2 will impact on the timeline for other activities in the underground development, and
the impact of this and of the mine design work referred to above on the overall project schedule and costs
will be announced once the necessary work has been completed.
The total project workforce was around 9,000 at the end of the first quarter, with a continued high (89 per
cent) participation rate of Mongolian nationals.
Resolution Copper
On 15 April 2019, Rio Tinto announced it had committed $302 million ($166 million Rio Tinto share) of
additional expenditure to advance its Resolution Copper project in the US state of Arizona. The investment
will fund additional drilling, ore-body studies, infrastructure improvements and permitting activities as Rio
Tinto looks to progress the project to the final stage of the project’s permitting phase.
Diamonds
At Argyle, carat production in the first quarter of 2019 was 22 per cent lower than the same period in 2018
due to lower recovered grade.
At Diavik, carats recovered in the first quarter were five per cent lower than the first quarter of 2018, as
lower recovered grades were partially offset by higher ore processing.
2019 guidance
2019 guidance is unchanged. Rio Tinto’s share of mined copper production for 2019 is expected to be
between 550 and 600 thousand tonnes, subject to grade availability. Refined copper production is
expected to be between 220 and 250 thousand tonnes.
Diamond production guidance for 2019 is between 15 and 17 million carats.

Page 7 of 25
ENERGY & MINERALS
Rio Tinto share of production
Q1 2019 vs Q1 2018 vs Q4 2018
Iron ore pellets and
concentrate (million tonnes)
IOC 2.5 +5% -13%
Minerals (‘000 tonnes)
Borates – B2O3 content 115 -7% -3%
Salt 1,310 -13% -12%
Titanium dioxide slag 296 +1% +1%
Uranium (‘000 lbs)
Energy Resources of Australia 793 +19% -14%
Rössing 802 -6% -18%
Iron Ore Company of Canada (IOC)
First quarter production at IOC was five per cent higher than the corresponding period of 2018, despite
adverse weather disruptions experienced in February.
Pellet production of 2.7 million tonnes (Rio Tinto share 1.6 million tonnes) was two per cent higher than the
first quarter of 2018. Concentrate production for sale of 1.5 million tonnes (Rio Tinto share 0.9 million
tonnes) was 11 per cent higher than the first quarter of 2018.
Borates
First quarter borates production was seven per cent lower than the first quarter of 2018, due to the impact
of higher than average rainfall and the temporary curtailment of production at the evaporator. Normal
production levels resumed in March, and production will continue to be aligned to customer demand.
Iron and Titanium
Titanium dioxide feedstock production in the first quarter was one per cent higher than the same period of
2018.
Three of nine furnaces at Rio Tinto Fer et Titane were idle for most of the first quarter, however two of
these furnaces are restarting and currently ramping up. Three of four furnaces at RBM are currently in
operation. A decision to re-start idle furnaces will be based on maximising value over volume.
On 8 April 2019, Rio Tinto approved the next stage in the development of RBM through the construction of
the Zulti South project. The $463 million (Rio Tinto share $343 million) investment will sustain RBM’s
current capacity and extend the mine life.
Salt
Salt production in the first quarter of 2019 was 13 per cent lower than the first quarter of 2018 due to the
impact of Tropical Cyclone Veronica. Production will continue to be aligned to customer demand.
Uranium
Energy Resources of Australia continues to process existing stockpiles. First quarter production was 19
per cent higher than the first quarter of 2018 due to higher mill throughput, grade and recoveries.
First quarter production at Rössing Uranium was six per cent lower than the same quarter of 2018, with
lower mill throughput partially offset by higher grade.
On 26 November 2018, Rio Tinto announced it had entered into a binding agreement with China National
Uranium Corporation for the sale of its entire 68.62 per cent stake in Rössing Uranium. The transaction is
subject to certain conditions precedent including merger approval from the Namibian Competition

Page 8 of 25
Commission. Subject to these conditions precedent being met, the transaction is expected to complete in
the first half of 2019.
2019 guidance
2019 guidance is unchanged. At IOC, guidance for Rio Tinto’s expected share of iron ore pellets and
concentrates production in 2019 is between 11.3 and 12.3 million tonnes. Titanium dioxide slag production
guidance is between 1.2 and 1.4 million tonnes, and boric oxide equivalent production guidance is 0.5
million tonnes.

Page 9 of 25
EXPLORATION AND EVALUATION
Pre-tax and pre-divestment expenditure on exploration and evaluation charged to the profit and loss
account in the first quarter of 2019 was $124 million, compared with $101 million in the first quarter of
2018. Approximately 51 per cent of this expenditure was incurred by central exploration, 38 per cent by
Copper & Diamonds, seven per cent by Energy & Minerals and the remainder by Iron Ore and Aluminium.
There were no significant divestments of central exploration properties in the first quarter of 2019.
Exploration highlights
Rio Tinto has a strong portfolio of projects with activity in 16 countries across seven commodities. The bulk
of the exploration expenditure in this quarter was focused on copper targets in Australia, Canada, Chile,
Kazakhstan, Mongolia, Papua New Guinea, Peru, Serbia, United States, Zambia and diamond projects in
Canada. Mine-lease exploration continued at a number of Rio Tinto managed businesses including Pilbara
Iron in Australia, Oyu Tolgoi in Mongolia, Weipa in Australia, Diavik in Canada, as well as Bingham,
Resolution and Boron in the US.
A summary of activity for the quarter is as follows:
Product
Groups
Studies stage Advanced exploration
projects
Greenfield/ Brownfield
programmes
Aluminium Cape York, Australia Amargosa, Brazil
Sanxai, Laos
Cape York, Australia
Copper &
Diamonds
Copper/molybdenum:
Resolution, US
Copper: La Granja, Peru
Nickel: Tamarack, US
Diamonds: FalCon,
Canada
Copper Greenfield:
Australia, Chile, China,
Kazakhstan, Mongolia,
Papua New Guinea, Peru,
Serbia, US, Zambia
Copper Brownfield:
Bingham, Resolution, US
Oyu Tolgoi, Mongolia
Nickel Greenfield:
Canada, Uganda
Diamonds Greenfield:
Canada
Diamonds Brownfield:
Diavik, Canada
Energy &
Minerals
Lithium borates: Jadar,
Serbia
Potash: KP405, Canada
Heavy mineral sands:
Mutamba, Mozambique
and Zulti South, South
Africa
Uranium: Roughrider,
Canada
Heavy mineral sands:
Tanzania
Industrial Minerals: Serbia
Iron Ore Pilbara, Australia Pilbara, Australia Pilbara, Australia

Page 10 of 25
Forward-looking statements
This announcement may include "forward-looking statements" within the meaning of the US Private Securities Litigation Reform Act of 1995. All statements other than statements of historical facts included in this announcement, including, without limitation, those regarding Rio Tinto’s production forecast or guidance, financial position, business strategy, plans and objectives of management for future operations (including development plans and objectives relating to Rio Tinto’s products and reserve and resource positions), are forward-looking statements. The words “intend”, “aim”, “project”, “anticipate”, “estimate”, “plan”, “believes”, “expects”, “may”, “should”, “will”, “target”, “set to”, “assumes” or similar expressions, commonly identify such forward looking statements. Such forward-looking statements involve known and unknown risks, uncertainties and other factors which may cause the actual production, performance or results of Rio Tinto to be materially different from any future production, performance or results expressed or implied by such forward-looking statements. Such forward-looking statements could be influenced by such risk factors as identified in Rio Tinto's most recent Annual Report and Accounts in Australia and the United Kingdom and the most recent Annual Report on Form 20-F filed with the United States Securities and Exchange Commission (the "SEC") or Form 6-Ks furnished to, or filed with, the SEC. Forward-looking statements should, therefore, be construed in light of such risk factors and undue reliance should not be placed on forward-looking statements. These forward-looking statements speak only as of the date of this announcement. Rio Tinto expressly disclaims any obligation or undertaking (except as required by applicable law, the UK Listing Rules, the Disclosure and Transparency Rules of the Financial Conduct Authority and the Listing Rules of the Australian Securities Exchange) to release publicly any updates or revisions to any forward-looking statement contained herein to reflect any change in Rio Tinto’s expectations with regard thereto or any change in events, conditions or circumstances on which any such statement is based. Nothing in this announcement should be interpreted to mean that future earnings per share of Rio Tinto plc or Rio Tinto Limited will necessarily match or exceed its historical published earnings per share.

Page 11 of 25
Contacts
[email protected] www.riotinto.com
Follow @riotinto on Twitter Media Relations, United Kingdom Media Relations, Australia Illtud Harri M +44 7920 503 600
Jonathan Rose T +61 3 9283 3088 M +61 447 028 913
David Outhwaite T +44 20 7781 1623 M +44 7787 597 493
Jesse Riseborough T +61 8 6211 6013 M +61 436 653 412
Media Relations, Canada Matthew Klar
T +1 514 608 4429
Investor Relations, EMEA/Americas Investor Relations, Australia/Asia John Smelt T +44 20 7781 1654 M +44 7879 642 675
Natalie Worley T +61 3 9283 3063 M +61 409 210 462
David Ovington T +44 20 7781 2051 M +44 7920 010 978
Rachel Storrs T +61 3 9283 3628 M +61 417 401 018
Nick Parkinson M +61 436 637 571
Rio Tinto plc 6 St James’s Square London SW1Y 4AD United Kingdom T +44 20 7781 2000 Registered in England No. 719885
Rio Tinto Limited Level 7, 360 Collins Street Melbourne 3000 Australia T +61 3 9283 3333 Registered in Australia ABN 96 004 458 404

Page 12 of 25
Rio Tinto production summary
Rio Tinto share of production
Quarter Full Year % Change
2018 Q1
2018 Q4
2019 Q1
2018
Q1 19 vs
Q1 18
Q1 19 vs
Q4 18
Principal Commodities
Alumina ('000 t) 1,990 2,020 2,008 7,980 1% -1%
Aluminium ('000 t) 795 817 796 3,231 0% -3%
Bauxite ('000 t) 12,653 11,790 12,763 50,421 1% 8%
Borates ('000 t) 124 118 115 512 -7% -3%
Copper - mined ('000 t) 139.3 151.9 143.9 607.6 3% -5%
Copper - refined ('000 t) 56.1 86.1 48.3 274.8 -14% -44%
Diamonds ('000 cts) 4,616 4,290 3,796 18,427 -18% -12%
Iron Ore ('000 t) 71,436 75,018 66,581 290,800 -7% -11%
Titanium dioxide slag ('000 t) 294 294 296 1,116 1% 1%
Uranium ('000 lbs) 1,515 1,904 1,595 6,764 5% -16%
Other Metals & Minerals
Gold - mined ('000 oz) 69.4 118.4 115.4 372.1 66% -2%
Gold - refined ('000 oz) 40.8 58.6 41.7 198.0 2% -29%
Molybdenum ('000 t) 1.5 2.2 1.9 5.8 29% -15%
Salt ('000 t) 1,514 1,496 1,310 6,153 -13% -12%
Silver - mined ('000 oz) 1,237 1,586 1,481 5,656 20% -7%
Silver - refined ('000 oz) 867 807 617 2,865 -29% -24%
Throughout this report, figures in italics indicate adjustments made since the figure was previously quoted on the equivalent page. Production figures are sometimes more precise than the rounded numbers shown, hence small differences may result between the total of the quarter figures and the year to date figures.
Page 13 of 25
Rio Tinto share of production
Rio Tinto interest
Q1 2018
Q2 2018
Q3 2018
Q4 2018
Q1 2019
Full Year 2018
ALUMINA
Production ('000 tonnes)
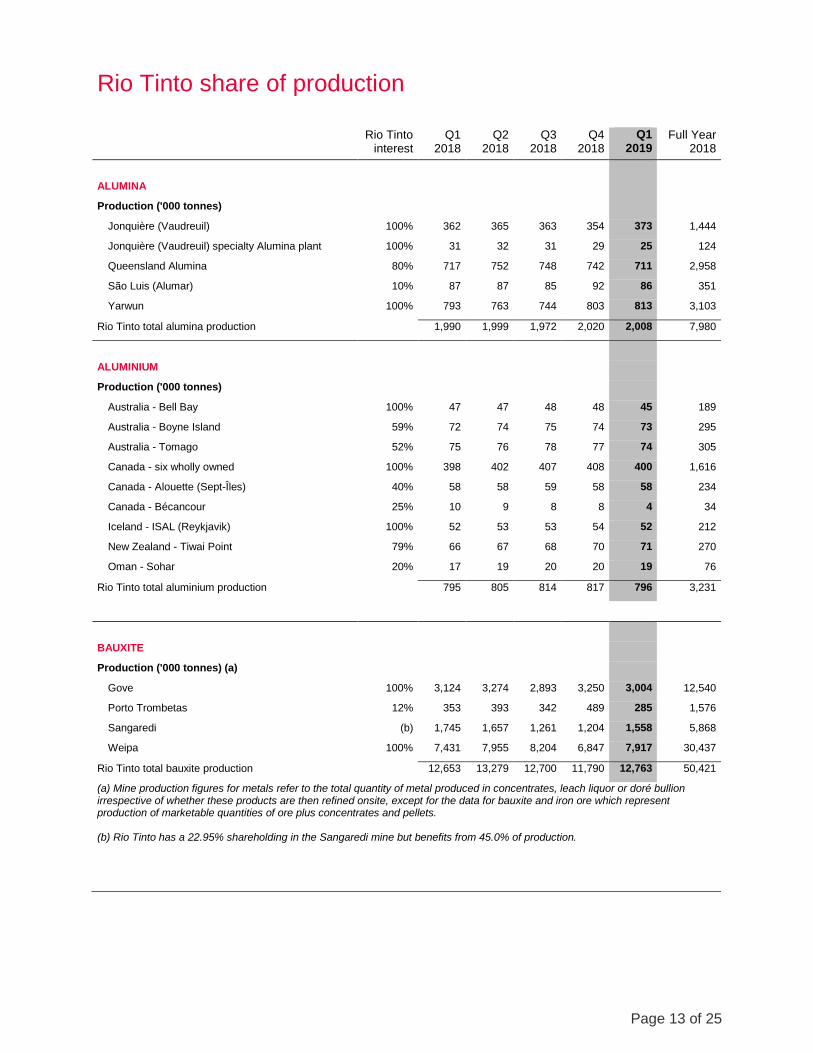
Jonquière (Vaudreuil) 100% 362 365 363 354 373 1,444
Jonquière (Vaudreuil) specialty Alumina plant 100% 31 32 31 29 25 124
Queensland Alumina 80% 717 752 748 742 711 2,958
São Luis (Alumar) 10% 87 87 85 92 86 351
Yarwun 100% 793 763 744 803 813 3,103
Rio Tinto total alumina production 1,990 1,999 1,972 2,020 2,008 7,980
ALUMINIUM
Production ('000 tonnes)
Australia - Bell Bay 100% 47 47 48 48 45 189
Australia - Boyne Island 59% 72 74 75 74 73 295
Australia - Tomago 52% 75 76 78 77 74 305
Canada - six wholly owned 100% 398 402 407 408 400 1,616
Canada - Alouette (Sept-Îles) 40% 58 58 59 58 58 234
Canada - Bécancour 25% 10 9 8 8 4 34
Iceland - ISAL (Reykjavik) 100% 52 53 53 54 52 212
New Zealand - Tiwai Point 79% 66 67 68 70 71 270
Oman - Sohar 20% 17 19 20 20 19 76
Rio Tinto total aluminium production
795 805 814 817 796 3,231
BAUXITE
Production ('000 tonnes) (a)
Gove 100% 3,124 3,274 2,893 3,250 3,004 12,540
Porto Trombetas 12% 353 393 342 489 285 1,576
Sangaredi (b) 1,745 1,657 1,261 1,204 1,558 5,868
Weipa 100% 7,431 7,955 8,204 6,847 7,917 30,437
Rio Tinto total bauxite production 12,653 13,279 12,700 11,790 12,763 50,421
(a) Mine production figures for metals refer to the total quantity of metal produced in concentrates, leach liquor or doré bullion irrespective of whether these products are then refined onsite, except for the data for bauxite and iron ore which represent production of marketable quantities of ore plus concentrates and pellets.
(b) Rio Tinto has a 22.95% shareholding in the Sangaredi mine but benefits from 45.0% of production.

Page 14 of 25
Rio Tinto share of production
Rio Tinto
interest
Q1
2018
Q2
2018
Q3
2018
Q4
2018
Q1
2019
Full Year
2018
BORATES
Production ('000 tonnes B2O3 content)
Rio Tinto Borates - borates 100% 124 132 137 118 115 512
COPPER
Mine production ('000 tonnes) (a)
Bingham Canyon 100% 35.4 51.2 59.1 58.3 52.5 203.9
Escondida 30% 90.9 92.4 87.4 79.7 76.0 350.4
Oyu Tolgoi (b) 34% 13.0 13.2 13.2 13.9 15.4 53.3
Rio Tinto total mine production
139.3 156.8 159.7 151.9 143.9 607.6
Refined production ('000 tonnes)
Escondida 30% 20.8 21.0 16.6 21.6 18.7 80.0
Rio Tinto Kennecott 100% 35.3 40.7 54.2 64.6 29.6 194.7
Rio Tinto total refined production 56.1 61.7 70.8 86.1 48.3 274.8
(a) Mine production figures for metals refer to the total quantity of metal produced in concentrates, leach liquor or doré bullion
irrespective of whether these products are then refined onsite, except for the data for bauxite and iron ore which represent
production of marketable quantities of ore plus concentrates and pellets.
(b) Rio Tinto owns a 33.52% indirect interest in Oyu Tolgoi through its 50.79% interest in Turquoise Hill Resources Ltd.
DIAMONDS
Production ('000 carats)
Argyle 100% 3,551 3,476 3,830 3,211 2,786 14,069
Diavik 60% 1,065 1,150 1,066 1,078 1,010 4,358
Rio Tinto total diamond production 4,616 4,626 4,896 4,290 3,796 18,427
GOLD
Mine production ('000 ounces) (a)
Bingham Canyon 100% 37.4 45.6 56.6 57.1 53.0 196.7
Escondida 30% 18.0 20.5 19.1 22.1 22.2 79.7
Oyu Tolgoi (b) 34% 14.0 16.8 25.8 39.1 40.2 95.7
Rio Tinto total mine production
69.4 82.8 101.4 118.4 115.4 372.1
Refined production ('000 ounces)
Rio Tinto Kennecott 100% 40.8 48.4 50.3 58.6 41.7 198.0
(a) Mine production figures for metals refer to the total quantity of metal produced in concentrates, leach liquor or doré bullion
irrespective of whether these products are then refined onsite, except for the data for bauxite and iron ore which represent
production of marketable quantities of ore plus concentrates and pellets.
(b) Rio Tinto owns a 33.52% indirect interest in Oyu Tolgoi through its 50.79% interest in Turquoise Hill Resources Ltd.

Page 15 of 25
Rio Tinto share of production
Rio Tinto interest
Q1 2018
Q2 2018
Q3 2018
Q4 2018
Q1 2019
Full Year 2018
IRON ORE
Production ('000 tonnes) (a)
Hamersley mines (b) 53,631 56,034 54,583 56,364 51,218 220,612
Hamersley - Channar 60% 1,136 1,227 604 1,337 931 4,304
Hope Downs 50% 5,342 5,783 5,713 5,845 5,957 22,684
Iron Ore Company of Canada 59% 2,364 871 2,880 2,836 2,481 8,952
Robe River - Pannawonica (Mesas J and A) 53% 4,672 4,048 4,208 4,004 1,870 16,932
Robe River - West Angelas 53% 4,290 4,373 4,021 4,631 4,125 17,316
Rio Tinto iron ore production ('000 tonnes)
71,436 72,336 72,010 75,018 66,581 290,800
Breakdown of Production:
Pilbara Blend Lump
20,714 21,901 20,554 21,674 19,978 84,843
Pilbara Blend Fines
29,769 31,239 29,921 31,652 28,779 122,582
Robe Valley Lump
1,587 1,431 1,470 1,409 635 5,897
Robe Valley Fines
3,086 2,617 2,738 2,595 1,235 11,035
Yandicoogina Fines (HIY)
13,916 14,277 14,446 14,852 13,473 57,491
Pilbara iron ore production ('000 tonnes)
69,072 71,465 69,129 72,182 64,101 281,848
IOC Concentrate
799 572 1,131 1,433 890 3,934
IOC Pellets
1,566 299 1,750 1,403 1,590 5,018
IOC iron ore production ('000 tonnes)
2,364 871 2,880 2,836 2,481 8,952
Breakdown of Sales:
Pilbara Blend Lump
18,062 19,424 17,967 18,439 15,772 73,892
Pilbara Blend Fines (c)
30,746 35,158 31,432 35,205 28,406 132,541
Robe Valley Lump
1,223 1,264 1,174 1,219 457 4,881
Robe Valley Fines
2,996 3,255 2,839 2,996 1,308 12,085
Yandicoogina Fines (HIY)
13,578 14,388 14,583 14,831 12,294 57,380
Pilbara iron ore sales ('000 tonnes)
66,604 73,489 67,995 72,690 58,236 280,778
IOC Concentrate
746 62 1,521 1,558 516 3,887
IOC Pellets
1,574 202 1,659 1,516 1,576 4,950
IOC Iron ore sales ('000 tonnes)
2,320 263 3,180 3,073 2,092 8,837
Rio Tinto iron ore sales ('000 tonnes) 68,925 73,752 71,175 75,763 60,328 289,614
(a) Mine production figures for metals refer to the total quantity of metal produced in concentrates, leach liquor or doré bullion irrespective of whether these products are then refined onsite, except for the data for bauxite and iron ore which represent production of marketable quantities of ore plus concentrates and pellets.
(b) Includes 100% of production from Paraburdoo, Mt Tom Price, Marandoo, Yandicoogina, Brockman, Nammuldi, Silvergrass and the Eastern Range mines. Whilst Rio Tinto owns 54% of the Eastern Range mine, under the terms of the joint venture agreement, Hamersley Iron manages the operation and is obliged to purchase all mine production from the joint venture and therefore all of the production is included in Rio Tinto's share of production. (c) Pilbara Blend Fines sales include 1.5m tonnes of other lower grade products in Q1 2019.

Page 16 of 25
Rio Tinto share of production
Rio Tinto interest
Q1 2018
Q2 2018
Q3 2018
Q4 2018
Q1 2019
Full Year 2018
MOLYBDENUM
Mine production ('000 tonnes) (a)
Bingham Canyon 100% 1.5 0.7 1.4 2.2 1.9 5.8
(a) Mine production figures for metals refer to the total quantity of metal produced in concentrates, leach liquor or doré bullion irrespective of whether these products are then refined onsite, except for the data for bauxite and iron ore which represent production of marketable quantities of ore plus concentrates and pellets.
SALT
Production ('000 tonnes)
Dampier Salt 68% 1,514 1,662 1,481 1,496 1,310 6,153
SILVER
Mine production ('000 ounces) (a)
Bingham Canyon 100% 461 615 708 736 741 2,520
Escondida 30% 702 758 599 771 657 2,830
Oyu Tolgoi (b) 34% 74 75 77 80 83 306
Rio Tinto total mine production
1,237 1,448 1,384 1,586 1,481 5,656
Refined production ('000 ounces)
Rio Tinto Kennecott 100% 867 461 730 807 617 2,865
(a) Mine production figures for metals refer to the total quantity of metal produced in concentrates, leach liquor or doré bullion irrespective of whether these products are then refined onsite, except for the data for bauxite and iron ore which represent production of marketable quantities of ore plus concentrates and pellets.
(b) Rio Tinto owns a 33.52% indirect interest in Oyu Tolgoi through its 50.79% interest in Turquoise Hill Resources Ltd.
TITANIUM DIOXIDE SLAG
Production ('000 tonnes)
Rio Tinto Iron & Titanium (a) 100% 294 232 297 294 296 1,116
(a) Quantities comprise 100% of Rio Tinto Fer et Titane and Rio Tinto's 74% interest in Richards Bay Minerals (RBM).
URANIUM
Production ('000 lbs U3O8) (a)
Energy Resources of Australia 68% 667 603 820 924 793 3,014
Rössing (b) 69% 848 928 994 979 802 3,750
Rio Tinto total uranium production 1,515 1,531 1,814 1,904 1,595 6,764
(a) ERA and Rössing production reported are drummed U3O8. (b) On 26 November 2018, Rio Tinto signed a binding agreement to sell its 68.62% interest in the Rossing mine in Namibia to China National Uranium Corporation Limited.
Production figures are sometimes more precise than the rounded numbers shown, hence small differences may result between the total of the quarter figures and the year to date figures.
The Rio Tinto percentage shown above is at 31 March 2019.
Rio Tinto's interest in the Kestrel, Hail Creek, Dunkerque and Grasberg operations were sold in 2018. No data for these operations are included in the Share of production table.

Page 17 of 25
Rio Tinto operational data
Rio Tinto interest
Q1 2018
Q2 2018
Q3 2018
Q4 2018
Q1 2019
Full Year 2018
ALUMINA
Smelter Grade Alumina - Aluminium Group
Alumina production ('000 tonnes)
Australia
Queensland Alumina Refinery - Queensland
80.0% 896 940 935 927 888 3,697
Yarwun refinery - Queensland 100.0% 793 763 744 803 813 3,103
Brazil
São Luis (Alumar) refinery 10.0% 871 869 851 918 859 3,509
Canada
Jonquière (Vaudreuil) refinery - Quebec (a) 100.0% 362 365 363 354 373 1,444
(a) Jonquière’s (Vaudreuil’s) production shows smelter grade alumina only and excludes hydrate produced and used for specialty alumina.
Specialty Alumina - Aluminium Group
Specialty alumina production ('000 tonnes)
Canada
Jonquière (Vaudreuil) plant – Quebec 100.0% 31 32 31 29 25 124
Rio Tinto percentage interest shown above is at 31 March 2019. The data represent full production and sales on a 100% basis unless otherwise stated.

Page 18 of 25
Rio Tinto operational data
Rio Tinto interest
Q1 2018
Q2 2018
Q3 2018
Q4 2018
Q1 2019
Full Year 2018
ALUMINIUM
Primary Aluminium
Primary aluminium production ('000 tonnes)
Australia
Bell Bay smelter - Tasmania 100.0% 47 47 48 48 45 189
Boyne Island smelter - Queensland 59.4% 122 124 126 125 122 497
Tomago smelter - New South Wales 51.6% 145 148 151 149 144 592
Canada
Alma smelter - Quebec 100.0% 115 116 117 118 115 465
Alouette (Sept-Îles) smelter - Quebec 40.0% 144 146 148 146 144 584
Arvida smelter - Quebec 100.0% 43 43 43 44 43 173
Arvida AP60 smelter - Quebec 100.0% 13 13 13 13 14 52
Bécancour smelter - Quebec 25.1% 39 35 32 30 17 136
Grande-Baie smelter - Quebec 100.0% 57 58 59 59 58 233
Kitimat smelter - British Columbia 100.0% 108 109 110 109 106 436
Laterrière smelter - Quebec 100.0% 63 64 65 65 64 257
France
Dunkerque smelter (a) 0% 51 52 66 57 - 227
Iceland
ISAL (Reykjavik) smelter 100.0% 52 53 53 54 52 212
New Zealand
Tiwai Point smelter 79.4% 83 84 85 88 89 341
Oman
Sohar smelter 20.0% 87 97 98 99 97 380
(a) On 14 December 2018, Rio Tinto completed the sale of its 100% interest in the Dunkerque smelter. Production is reported up to the date of completion.
Rio Tinto percentage interest shown above is at 31 March 2019. The data represent full production and sales on a 100% basis unless otherwise stated.

Page 19 of 25
Rio Tinto operational data
Rio Tinto interest
Q1 2018
Q2 2018
Q3 2018
Q4 2018
Q1 2019
Full Year 2018
BAUXITE
Bauxite production ('000 tonnes)
Australia
Gove mine - Northern Territory 100.0% 3,124 3,274 2,893 3,250 3,004 12,540
Weipa mine - Queensland 100.0% 7,431 7,955 8,204 6,847 7,917 30,437
Brazil
Porto Trombetas (MRN) mine 12.0% 2,939 3,273 2,848 4,073 2,372 13,134
Guinea
Sangaredi mine (a) 23.0% 3,878 3,683 2,803 2,675 3,463 13,039
Rio Tinto share of bauxite shipments
Share of total bauxite shipments ('000 tonnes) 12,551 12,936 12,427 11,622 12,725 49,536
Share of third party bauxite shipments ('000 tonnes) 8,248 8,738 8,441 7,387 8,842 32,813
(a) Rio Tinto has a 22.95% shareholding in the Sangaredi mine but benefits from 45.0% of production.
Rio Tinto percentage interest shown above is at 31 March 2019. The data represent full production and sales on a 100% basis unless otherwise stated.

Page 20 of 25
Rio Tinto operational data
Rio Tinto interest
Q1 2018
Q2 2018
Q3 2018
Q4 2018
Q1 2019
Full Year 2018
BORATES
Rio Tinto Borates - borates 100.0%
US
Borates ('000 tonnes) (a)
124 132 137 118 115 512
(a) Production is expressed as B2O3 content.
COAL
Rio Tinto Coal Australia
Hail Creek Coal mine (a) 0.0%
Queensland
Hard coking coal ('000 tonnes)
924 1,380 396 - - 2,700
Thermal coal ('000 tonnes)
1,293 1,018 449 - - 2,760
Kestrel Coal mine (b) 0.0%
Queensland
Hard coking coal ('000 tonnes)
430 1,303 484 - - 2,217
Thermal coal ('000 tonnes)
74 220 35 - - 329
Total hard coking coal production ('000 tonnes) 1,354 2,683 880 - - 4,917
Total thermal coal production ('000 tonnes) 1,367 1,238 485 - - 3,089
Total coal production ('000 tonnes)
2,721 3,921 1,365 - - 8,007
Total coal sales ('000 tonnes)
3,050 3,717 1,725 - - 8,492
Rio Tinto Coal Australia share (c)
Share of hard coking coal sales ('000 tonnes) 1,368 2,228 650 - - 4,246
Share of thermal coal sales ('000 tonnes) (d) 1,119 791 754 - - 2,664
(a) On 1 August 2018, Rio Tinto completed the sale of its 82% interest in the Hail Creek mine. Production is reported up to the date of completion. (b) On 1 August 2018, Rio Tinto completed the sale of its 80% interest in the Kestrel mine. Production is reported up to the date of completion. (c) Kestrel and Hail Creek produce hard coking coal and thermal coal through their mining operations. Both mines may blend coal types at ports. (d) Sales relate only to coal mined by the operations and exclude traded coal.
Rio Tinto percentage interest shown above is at 31 March 2019. The data represent full production and sales on a 100% basis unless otherwise stated.

Page 21 of 25
Rio Tinto operational data
Rio Tinto
interest
Q1
2018
Q2
2018
Q3
2018
Q4
2018
Q1
2019
Full Year
2018
COPPER & GOLD
Escondida 30.0%
Chile
Sulphide ore to concentrator ('000 tonnes) 32,203 31,732 30,513 30,507 32,027 124,956
Average copper grade (%)
0.96 0.96 0.94 0.87 0.82 0.93
Mill production (metals in concentrates):
Contained copper ('000 tonnes)
252.6 253.6 241.9 219.9 216.9 968.0
Contained gold ('000 ounces)
60 68 64 74 74 266
Contained silver ('000 ounces)
2,339 2,527 1,997 2,570 2,189 9,433
Recoverable copper in ore stacked for leaching ('000 tonnes) (a) 50.4 54.4 49.4 45.7 36.5 199.9
Refined production from leach plants:
Copper cathode production ('000 tonnes)
69.4 70.1 55.4 71.9 62.4 266.8
(a) The calculation of copper in material mined for leaching is based on ore stacked at the leach pad.
Freeport-McMoRan
Grasberg mine (a) 0.0% (b)
Papua, Indonesia
Ore treated ('000 tonnes)
15,625 17,101 17,535 14,049 - 64,310
Average mill head grades:
Copper (%)
1.12 1.06 1.00 0.73 - 0.99
Gold (g/t)
1.63 1.77 1.77 1.08 - 1.59
Silver (g/t)
4.68 5.09 4.49 2.09 - 4.17
Production of metals in concentrates:
Copper in concentrates ('000 tonnes)
159.9 165.7 158.7 85.4 - 569.7
Gold in concentrates ('000 ounces)
693 842 842 402 - 2,779
Silver in concentrates ('000 ounces)
1,513 1,548 1,439 545 - 5,045
Sales of payable metals in concentrates: (c)
Copper in concentrates ('000 tonnes)
157.4 145.3 170.6 82.7 - 556.0
Gold in concentrates ('000 ounces)
676 740 903 399 - 2,719
Silver in concentrates ('000 ounces)
1,184 1,098 1,221 426 - 3,928
(a) Through a joint venture agreement with Freeport-McMoRan (FCX), Rio Tinto is entitled to 40% of additional material mined as a
consequence of expansions and developments of the Grasberg facilities since 1998. The Q4 2018 results show the forecast from
FCX's most recent five-year plan. On 21 December 2018, Rio Tinto completed the sale of its entire interest in the Grasberg mine in
Indonesia to PT Indonesia Asahan Aluminium (Persero) (Inalum). Production is reported up to the date of completion.
(b) Rio Tinto share of Grasberg production is 40% of the expansion.
(c) Net of smelter deduction
Rio Tinto percentage interest shown above is at 31 March 2019. The data represent full production and sales on a 100%
basis unless otherwise stated.

Page 22 of 25
Rio Tinto operational data
Rio Tinto interest
Q1 2018
Q2 2018
Q3 2018
Q4 2018
Q1 2019
Full Year 2018
COPPER & GOLD (continued)
Rio Tinto Kennecott
Bingham Canyon mine 100.0%
Utah, US
Ore treated ('000 tonnes)
9,260 8,974 11,173 10,853 10,685 40,260
Average ore grade:
Copper (%)
0.43 0.63 0.58 0.59 0.55 0.56
Gold (g/t)
0.23 0.26 0.26 0.26 0.25 0.25
Silver (g/t)
2.25 2.73 2.62 2.76 2.76 2.60
Molybdenum (%)
0.025 0.025 0.030 0.032 0.032 0.028
Copper concentrates produced ('000 tonnes) 171 194 233 222 207 820
Average concentrate grade (% Cu)
20.7 26.4 25.3 26.0 25.3 24.8
Production of metals in copper concentrates:
Copper ('000 tonnes) (a)
35.4 51.2 59.1 58.3 52.5 203.9
Gold ('000 ounces)
37 46 57 57 53 197
Silver ('000 ounces)
461 615 708 736 741 2,520
Molybdenum concentrates produced ('000 tonnes): 2.8 1.5 2.8 4.5 3.8 11.6
Molybdenum in concentrates ('000 tonnes)
1.5 0.7 1.4 2.2 1.9 5.8
Kennecott smelter & refinery 100.0%
Copper concentrates smelted ('000 tonnes) 200 224 246 262 204 932
Copper anodes produced ('000 tonnes) (b) 42.4 44.4 58.1 62.4 33.3 207.3
Production of refined metal:
Copper ('000 tonnes)
35.3 40.7 54.2 64.6 29.6 194.7
Gold ('000 ounces) (c)
40.8 48.4 50.3 58.6 41.7 198.0
Silver ('000 ounces) (c)
867 461 730 807 617 2,865
(a) Includes a small amount of copper in precipitates. (b) New metal excluding recycled material. (c) Includes gold and silver in intermediate products.
Rio Tinto percentage interest shown above is at 31 March 2019. The data represent full production and sales on a 100% basis unless otherwise stated.

Page 23 of 25
Rio Tinto operational data
Rio Tinto interest
Q1 2018
Q2 2018
Q3 2018
Q4 2018
Q1 2019
Full Year 2018
COPPER & GOLD (continued)
Turquoise Hill Resources
Oyu Tolgoi mine (a) 33.5%
Mongolia
Ore Treated ('000 tonnes)
9,561 10,164 9,652 9,361 9,255 38,738
Average mill head grades:
Copper (%)
0.51 0.48 0.51 0.55 0.57 0.51
Gold (g/t)
0.25 0.26 0.38 0.56 0.58 0.36
Silver (g/t)
1.32 1.17 1.19 1.22 1.25 1.22
Copper concentrates produced ('000 tonnes) 177.3 178.8 179.8 189.0 210.1 724.9
Average concentrate grade (% Cu)
21.9 22.0 21.9 21.9 21.8 21.9
Production of metals in concentrates:
Copper in concentrates ('000 tonnes)
38.8 39.4 39.4 41.5 45.8 159.1
Gold in concentrates ('000 ounces)
41.8 50.0 77.0 116.7 120.1 285.4
Silver in concentrates ('000 ounces)
221 225 230 238 247 914
Sales of metals in concentrates:
Copper in concentrates ('000 tonnes)
34.3 46.1 36.0 40.2 38.5 156.7
Gold in concentrates ('000 ounces)
31 51 55 111 98 248
Silver in concentrates ('000 ounces)
206 250 201 216 200 873
(a) Rio Tinto owns a 33.52% indirect interest in Oyu Tolgoi through its 50.79% interest in Turquoise Hill Resources.
DIAMONDS
Argyle Diamonds 100.0%
Western Australia
AK1 ore processed ('000 tonnes)
1,260 1,428 1,465 1,292 1,248 5,444
AK1 diamonds produced ('000 carats)
3,551 3,476 3,830 3,211 2,786 14,069
Diavik Diamonds 60.0%
Northwest Territories, Canada
Ore processed ('000 tonnes)
556 652 670 651 620 2,530
Diamonds recovered ('000 carats)
1,774 1,916 1,776 1,797 1,683 7,264
Rio Tinto percentage interest shown above is at 31 March 2019. The data represent full production and sales on a 100% basis unless otherwise stated.

Page 24 of 25
Rio Tinto operational data
Rio Tinto interest
Q1 2018
Q2 2018
Q3 2018
Q4 2018
Q1 2019
Full Year 2018
IRON ORE
Rio Tinto Iron Ore
Western Australia
Pilbara Operations
Saleable iron ore production ('000 tonnes)
Hamersley mines (a) 53,631 56,034 54,583 56,364 51,218 220,612
Hamersley - Channar 60.0% 1,893 2,045 1,007 2,228 1,552 7,173
Hope Downs 50.0% 10,685 11,567 11,426 11,691 11,913 45,368
Robe River - Pannawonica (Mesas J and A) 53.0% 8,816 7,637 7,940 7,555 3,529 31,947
Robe River - West Angelas 53.0% 8,094 8,252 7,587 8,738 7,783 32,672
Total production ('000 tonnes) 83,120 85,534 82,542 86,576 75,995 337,772
Breakdown of total production:
Pilbara Blend Lump
24,831 26,253 24,461 26,084 24,068 101,629
Pilbara Blend Fines
35,556 37,368 35,696 38,085 34,924 146,705
Robe Valley Lump
2,993 2,699 2,774 2,659 1,198 11,126
Robe Valley Fines
5,823 4,937 5,166 4,896 2,331 20,821
Yandicoogina Fines (HIY)
13,916 14,277 14,446 14,852 13,473 57,491
Breakdown of total sales:
Pilbara Blend Lump
21,457 22,954 21,644 22,161 18,968 88,215
Pilbara Blend Fines (c)
37,320 42,638 38,100 42,497 34,558 160,555
Robe Valley Lump
2,307 2,386 2,215 2,301 863 9,209
Robe Valley Fines
5,652 6,141 5,356 5,652 2,468 22,801
Yandicoogina Fines (HIY)
13,578 14,388 14,583 14,831 12,294 57,380
Total sales ('000 tonnes) (b) 80,314 88,506 81,898 87,442 69,150 338,160
(a) Includes 100% of production from Paraburdoo, Mt Tom Price, Marandoo, Yandicoogina, Brockman, Nammuldi, Silvergrass and the Eastern Range mines. Whilst Rio Tinto owns 54% of the Eastern Range mine, under the terms of the joint venture agreement, Hamersley Iron manages the operation and is obliged to purchase all mine production from the joint venture and therefore all of the production is included in Rio Tinto's share of production. (b) Sales represent iron ore exported from Western Australian ports. (c) Pilbara Blend Fines sales include 1.5m tonnes of other lower grade products in Q1 2019.
Iron Ore Company of Canada 58.7%
Newfoundland & Labrador and Quebec in Canada
Saleable iron ore production:
Concentrates ('000 tonnes)
1,360 974 1,926 2,441 1,516 6,700
Pellets ('000 tonnes)
2,667 510 2,979 2,389 2,709 8,545
IOC Total production ('000 tonnes)
4,027 1,484 4,905 4,830 4,225 15,245
Sales:
Concentrates ('000 tonnes)
1,271 105 2,590 2,653 878 6,619
Pellets ('000 tonnes)
2,681 343 2,825 2,581 2,684 8,430
IOC Total Sales ('000 tonnes)
3,951 449 5,415 5,234 3,562 15,049
Global Iron Ore Totals
Iron Ore Production ('000 tonnes)
87,146 87,018 87,448 91,406 80,219 353,017
Iron Ore Sales ('000 tonnes)
84,265 88,954 87,314 92,676 72,712 353,209
Rio Tinto percentage interest shown above is at 31 March 2019. The data represent full production and sales on a 100% basis unless otherwise stated.

Page 25 of 25
Rio Tinto operational data
Rio Tinto interest
Q1 2018
Q2 2018
Q3 2018
Q4 2018
Q1 2019
Full Year 2018
SALT
Dampier Salt 68.4%
Western Australia
Salt production ('000 tonnes) 2,215 2,431 2,167 2,188 1,917 9,001
TITANIUM DIOXIDE SLAG
Rio Tinto Iron & Titanium 100.0%
Canada and South Africa
(Rio Tinto share) (a)
Titanium dioxide slag ('000 tonnes)
294 232 297 294 296 1,116
(a) Quantities comprise 100% of Rio Tinto Fer et Titane and Rio Tinto's 74% interest in Richards Bay Minerals' production. Ilmenite mined in Madagascar is being processed in Canada.
URANIUM
Energy Resources of Australia Ltd
Ranger mine (a) 68.4%
Northern Territory, Australia
U3O8 Production ('000 lbs)
975 881 1,199 1,351 1,160 4,407
(a) ERA production data are drummed U3O8.
Rössing Uranium Ltd (a) (b) 68.6%
Namibia
U3O8 Production ('000 lbs)
1,236 1,352 1,449 1,427 1,168 5,465
(a) Rössing production data are drummed U3O8. (b) On 26 November 2018, Rio Tinto signed a binding agreement to sell its 68.62% interest in the Rossing mine in Namibia to China National Uranium Corporation Limited.
Rio Tinto percentage interest shown above is at 31 March 2019. The data represent full production and sales on a 100% basis unless otherwise stated.