FIRST QUARTER BRIEF REPORT OF FINANCIAL RESULTS IFRS ... · first quarter. Additionally, the...
14
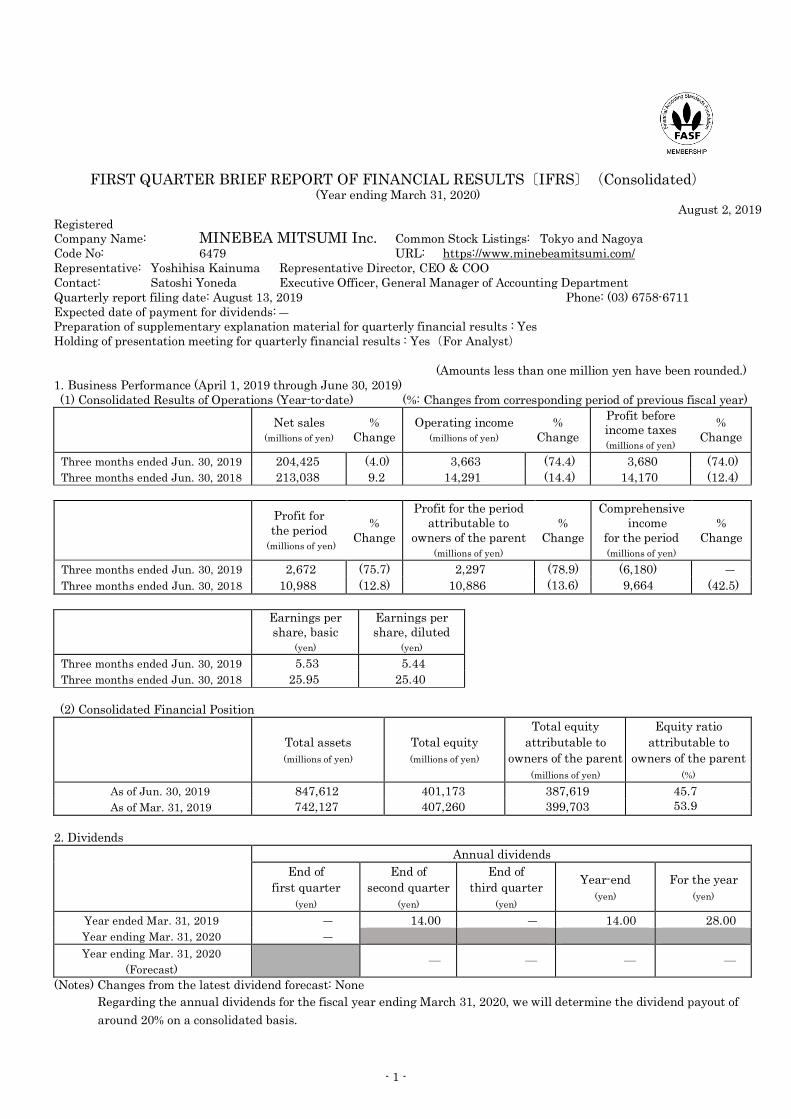
FIRST QUARTER BRIEF REPORT OF FINANCIAL RESULTS〔IFRS〕(Consolidated) (Year ending March 31, 2020) August 2, 2019 Registered Company Name: MINEBEA MITSUMI Inc. Common Stock Listings: Tokyo and Nagoya Code No: 6479 URL: https://www.minebeamitsumi.com/ Representative: Yoshihisa Kainuma Representative Director, CEO & COO Contact: Satoshi Yoneda Executive Officer, General Manager of Accounting Department Quarterly report filing date: August 13, 2019 Phone: (03) 6758-6711 Expected date of payment for dividends: ― Preparation of supplementary explanation material for quarterly financial results : Yes Holding of presentation meeting for quarterly financial results : Yes(For Analyst) (Amounts less than one million yen have been rounded.) 1. Business Performance (April 1, 2019 through June 30, 2019) (1) Consolidated Results of Operations (Year-to-date) (%: Changes from corresponding period of previous fiscal year) Net sales (millions of yen) % Change Operating income (millions of yen) % Change Profit before income taxes (millions of yen) % Change Three months ended Jun. 30, 2019 204,425 (4.0) 3,663 (74.4) 3,680 (74.0) Three months ended Jun. 30, 2018 213,038 9.2 14,291 (14.4) 14,170 (12.4) Profit for the period (millions of yen) % Change Profit for the period attributable to owners of the parent (millions of yen) % Change Comprehensive income for the period (millions of yen) % Change Three months ended Jun. 30, 2019 2,672 (75.7) 2,297 (78.9) (6,180) ― Three months ended Jun. 30, 2018 10,988 (12.8) 10,886 (13.6) 9,664 (42.5) Earnings per share, basic (yen) Earnings per share, diluted (yen) Three months ended Jun. 30, 2019 5.53 5.44 Three months ended Jun. 30, 2018 25.95 25.40 (2) Consolidated Financial Position Total assets (millions of yen) Total equity (millions of yen) Total equity attributable to owners of the parent (millions of yen) Equity ratio attributable to owners of the parent (%) As of Jun. 30, 2019 847,612 401,173 387,619 45.7 As of Mar. 31, 2019 742,127 407,260 399,703 53.9 2. Dividends Annual dividends End of first quarter (yen) End of second quarter (yen) End of third quarter (yen) Year-end (yen) For the year (yen) Year ended Mar. 31, 2019 ― 14.00 ― 14.00 28.00 Year ending Mar. 31, 2020 ― Year ending Mar. 31, 2020 (Forecast) ― ― ― ― (Notes) Changes from the latest dividend forecast: None Regarding the annual dividends for the fiscal year ending March 31, 2020, we will determine the dividend payout of around 20% on a consolidated basis. - 1 -
Transcript of FIRST QUARTER BRIEF REPORT OF FINANCIAL RESULTS IFRS ... · first quarter. Additionally, the...
FIRST QUARTER BRIEF REPORT OF FINANCIAL RESULTS〔IFRS〕(Consolidated) (Year ending March 31, 2020)
August 2, 2019 Registered Company Name: MINEBEA MITSUMI Inc. Common Stock Listings: Tokyo and Nagoya Code No: 6479 URL: https://www.minebeamitsumi.com/ Representative: Yoshihisa Kainuma Representative Director, CEO & COO Contact: Satoshi Yoneda Executive Officer, General Manager of Accounting Department Quarterly report filing date: August 13, 2019 Phone: (03) 6758-6711 Expected date of payment for dividends: ― Preparation of supplementary explanation material for quarterly financial results : Yes Holding of presentation meeting for quarterly financial results : Yes( For Analyst)
(Amounts less than one million yen have been rounded.) 1. Business Performance (April 1, 2019 through June 30, 2019)(1) Consolidated Results of Operations (Year-to-date) (%: Changes from corresponding period of previous fiscal year)
Net sales (millions of yen)
% Change
Operating income (millions of yen)
% Change
Profit before income taxes (millions of yen)
% Change
Three months ended Jun. 30, 2019 204,425 (4.0) 3,663 (74.4) 3,680 (74.0) Three months ended Jun. 30, 2018 213,038 9.2 14,291 (14.4) 14,170 (12.4)
Profit for the period
(millions of yen)
% Change
Profit for the period attributable to
owners of the parent (millions of yen)
% Change
Comprehensive income
for the period (millions of yen)
% Change
Three months ended Jun. 30, 2019 2,672 (75.7) 2,297 (78.9) (6,180) ― Three months ended Jun. 30, 2018 10,988 (12.8) 10,886 (13.6) 9,664 (42.5)
Earnings per share, basic
(yen)
Earnings per share, diluted
(yen)Three months ended Jun. 30, 2019 5.53 5.44 Three months ended Jun. 30, 2018 25.95 25.40
(2) Consolidated Financial Position
Total assets (millions of yen)
Total equity (millions of yen)
Total equity attributable to
owners of the parent (millions of yen)
Equity ratio attributable to
owners of the parent (%)
As of Jun. 30, 2019 847,612 401,173 387,619 45.7 As of Mar. 31, 2019 742,127 407,260 399,703 53.9
2. DividendsAnnual dividends
End of first quarter
(yen)
End of second quarter
(yen)
End of third quarter
(yen)
Year-end (yen)
For the year (yen)
Year ended Mar. 31, 2019 ― 14.00 ― 14.00 28.00 Year ending Mar. 31, 2020 ― Year ending Mar. 31, 2020
(Forecast) ― ― ― ―
(Notes) Changes from the latest dividend forecast: None Regarding the annual dividends for the fiscal year ending March 31, 2020, we will determine the dividend payout of around 20% on a consolidated basis.
- 1 -
mg3m287
ロゴ

3. Prospect for Consolidated Forecast for the Fiscal Year (April 1, 2019 through March 31, 2020)(%: Changes from corresponding period of previous fiscal year)
Net sales (millions of yen)
% Change
Operating income (millions of yen)
% Change
Six months ending Sep. 30, 2019 Year ending Mar. 31, 2020
496,500 1,030,000
10.5 16.4
27,000 77,000
(20.4) 6.9
Profit for the period attributableto owners of the parent
(millions of yen)
% Change
Earnings per share, basic (yen)
Six months ending Sep. 30, 2019 Year ending Mar. 31, 2020
21,400 62,000
(20.3) 3.1
51.55 149.35
(Notes) Changes from the latest consolidated results forecast: None
* Notes(1) Changes in significant subsidiaries during the period (Changes in certain subsidiaries resulting in change in the scope of
consolidation): YesAnew: 1 company U-Shin Ltd.
(2) Changes in accounting policies, or changes in accounting estimates1. Changes in accounting policies required by IFRS: Yes2. Changes in accounting policies other than ①: None3. Changes in accounting estimates: None
(3) Number of shares outstanding (Common stock)1. Number of shares outstanding at the end of each period (Including treasury stock)
As of June 30, 2019: 427,080,606 shares As of March 31, 2019: 427,080,606 shares
2. Number of treasury shares at the end of each periodAs of June 30, 2019: 11,949,359 sharesAs of March 31, 2019: 11,949,033 shares
3. Average number of shares (Quarterly cumulative period)Three months ended June 30, 2019: 415,131,317 sharesThree months ended June 30, 2018: 419,430,599 shares
* These quarterly financial results are not subject to quarterly review procedures by a certified public accountant or an auditcorporation.
* Explanation for appropriate use of financial forecasts and other special remarks(Caution Concerning Forward-Looking Statements)
The aforementioned forecasts are based on the information available as of the date when this information is disclosedas well as on the assumptions as of the disclosing date of this information related to unpredictable parameters that willmost likely affect our future business performance. As such, this is not intended for the Company to give assurance thatthe said forecast number would be achieved. In other words, our actual performances are likely to differ greatly from theseestimates depending on a variety of factors that will take shape from now on. As for the assumptions used for theseforecasts and other related items, please refer to (“1. Qualitative information related to the financial results for thequarter,” “(3) Explanation of Consolidated Forecast and Other Forecasts”) on page 5 of the documents attached hereunder.(Investor Briefing Materials for Analysts)
Investor briefing materials will be made available via our corporate website (https://www.minebeamitsumi.com/) onFriday, August 2, 2019.
- 2 -

Index
1. Qualitative information related to the financial results for the quarter ............................................. 4 (1) Explanation of Operating Results ................................................................................................. 4 (2) Explanation of Financial Position.................................................................................................. 5 (3) Explanation of Consolidated Forecast and Other Forecasts .......................................................... 5
2. Condensed Quarterly Consolidated Financial Statements and Major Notes ...................................... 6(1) Condensed Quarterly Consolidated Statements of Financial Position ........................................... 6 (2) Condensed Quarterly Consolidated Statements of Income
and Condensed Quarterly Consolidated Statements of Comprehensive Income ........................ 8 Condensed Quarterly Consolidated Statements of Income ............................................................ 8Condensed Quarterly Consolidated Statements of Comprehensive Income................................... 9
(3) Condensed Quarterly Consolidated Statements of Changes in Equity .......................................... 10(4) Condensed Quarterly Consolidated Statements of Cash Flows ..................................................... 12 (5) Notes on Condensed Quarterly Consolidated Financial Statements ............................................. 13
(Notes on Going Concern Assumptions) ....................................................................................... 13 (Change in Accounting Policy) ..................................................................................................... 13(Segment Information) ................................................................................................................. 14
- 3 -

1. Qualitative information related to the financial results for the quarter (1) Explanation of Operating Results During the first quarter of the fiscal year (April 1, 2019 through June 30, 2019), business sentiment continued to
worsen in the Japanese economy as corporate production activities slowed, especially in the manufacturing industry. This was due to declining external demand against a backdrop of trade friction between the United States and China, while inventory that had accumulated through the end of the previous year was liquidated. In the United States, there was increasing uncertainty over the future due to an increasing risk of additional tariffs, primarily in the manufacturing industry, and deceleration in the job market. The European economy was sluggish due to persistent uncertainty over the future resulting from the possibility of a no-deal Brexit as well as a slowdown in external demand and inventory adjustment in the manufacturing industry despite improvements in the employment and income environment. In Asia, the Chinese economy slowed due to continued sluggishness of exports, primarily to the United States, as well as stunted growth in the domestic automotive market in which investment control measures implemented through the previous year caused a delay in the recovery of internal demand.
Working against this backdrop, the MinebeaMitsumi Group concentrated on cutting costs, creating high-value-added products, developing new technologies, and enhancing its marketing approach to boost profitability further.
As a result, net sales were down 8,613 million yen (-4.0%) year on year to 204,425 million yen. Operating income was down 10,628 million yen (-74.4%) year on year to 3,663 million yen, profit before income taxes was down 10,490 million yen (-74.0%) to 3,680 million yen, and profit for the period attributable to owners of the parent was down 8,589 million yen (-78.9%) to 2,297 million yen.
U-Shin Ltd. was made a subsidiary through a tender offer on April 10. The company has been included in the scope of consolidation as of the date of the business integration. This includes the company’s profits and losses from the date of the business integration on.
Performance by segment was as follows:
In conjunction with the acquisition of U-Shin Ltd., the U-Shin business is disclosed as a reporting segment as of the first quarter. Additionally, the battery module products that were included under the MITSUMI business were transferred to the Electronic devices and components business. Accordingly, segment information has been updated to reflect this change in company organization.
The segment information disclosed for the first quarter of the previous year has been prepared based on the post-change reportable segments.
The main products in our Machined components segment include our anchor product line, ball bearings, in addition to
mechanical components such as rod-end bearings used primarily in aircraft and hard disk drive (HDD) pivot assemblies, etc. as well as fasteners for aircraft. Sales of ball bearings were down both in volume and amount due to decreased demand from fan motors despite solid demand in the automobile market. Rod-end bearing sales increased owing to favorable orders in the small and medium aircraft market. Pivot assembly sales were down both in volume and amount due to shrinking of the HDD market.
As a result, net sales were down 1,202 million yen (-2.5%) year on year to 46,053 million yen, and operating income was down 1,002 million yen (-8.6%) to 10,699 million yen.
The core products of our Electronic devices and components segment include electronic devices (devices such as LED
backlights for LCDs, sensing devices (measuring components), etc.), HDD spindle motors, stepping motors, DC motors, air movers, and special devices. Sales of stepping motors and other motors were down due to decreased demand in the automobile market. LED backlights for LCDs sales were down due to the shrinking of the smartphone market.
As a result, net sales were down 17,010 million yen (-18.0%) year on year to 77,639 million yen, and the operating loss increased 2,782 million yen year on year to total 577 million yen.
The main products in the MITSUMI business segment are semiconductor devices, optical devices, mechanical
components, high frequency components and power supply components. Although camera actuators, switches, protection IC, and connectors performed well, sales were down due to the decrease in game consoles and other mechanism components.
As a result, net sales were down 21,302 million yen (-30.0%) year on year to 49,654 million yen, and operating income was down 2,670 million yen (-99.4%) to 16 million yen.
The main products in the U-Shin business segment are key sets, door latches, door handles, and other automotive
components as well as industrial machinery components and housing equipment components (such as building and house locks). Automotive components performed well in the domestic market, but demand was sluggish in the European, Chinese, and Central and South American markets. Demand for industrial machinery components for use in agricultural and construction equipment was strong.
As a result, net sales were 30,734 million yen, and operating income was 1,016 million yen.
Machines produced in-house are the main products in our Other business segment. Net sales were up 167 million yen (94.3%) year on year to 345 million yen, while the operating loss increased 272 million yen year on year to total 367 million yen.
- 4 -

In addition to the figures noted above, 7,124 million yen in corporate expenses, etc. not belonging to any particular segment is indicated as adjustments. The total amount of adjustments was 2,206 million yen for the first quarter of the previous fiscal year.
(2) Explanation of Financial Position 1. Assets, liabilities and equity
Our Group sees “strengthening our financial position” as a top priority and is taking various steps, such as efficient controlling capital investments, asset management, and reducing interest-bearing debt.
Total assets at the end of the first quarter were 847,612 million yen, up 105,485 million yen from the end of the previous fiscal year. The main reason for this uptick was an increase in property, plant and equipment and inventories.
Total liabilities at the end of the first quarter were 446,439 million yen, up 111,572 million yen from the end of the previous fiscal year. The main reason for this was bonds and borrowings and trade and other payables.
Equity came to 401,173 million yen, bringing the equity ratio attributable to owners of the parent down 8.2 percentage points from the end of the previous fiscal year to 45.7%.
2. Cash flows Cash and cash equivalents at the end of the first quarter were 100,948 million yen, down 21,484 million yen from the
end of the previous fiscal year. Cash flows from various business activities during the first three months of the fiscal year and relevant factors were
as follows: Net cash provided by operating activities amounted to 2,934 million yen (compared to 14,907 million yen in the same
period of the previous year). This was primarily due to increases and decreases in profit before income taxes, depreciation and amortization, trade and other receivable, and inventories, etc. Net cash used in investing activities amounted to 11,787 million yen (compared to 14,754 million yen in the same period of the previous year). This was primarily due to purchase of property, plant and equipment, etc. Net cash used in financing activities amounted to 10,112 million yen (compared to 5,567 million yen in the same period of the previous year). This was primarily due to repayments of long-term borrowings and dividends paid, etc.
(3) Explanation of Consolidated Forecast and Other Forecasts It is difficult to get a clear picture of where the global economy is headed from the second quarter of this fiscal year
due to the trade policies of the United States and other countries, fluctuating exchange rates and geopolitical risks. This outlook does not have any changes to our earnings forecasts announced on May 8, 2019.
Full-year consolidated business forecast for the fiscal year ending March 31, 2020 (From April 1, 2019 to March 31, 2020) Net sales
(millions of yen) Operating income
(millions of yen)
Profit for the period attributable to owners of the parent
(millions of yen) Previous forecast(A) (announced on May 8, 2019) 1,030,000 77,000 62,000
Sharing profits with our shareholders is job one at MinebeaMitsumi. That's why our basic dividend policy gives
priority to enhancing equity efficiency and improving returns to our shareholders. Dividends, while reflecting performance, are determined in light of the overall business environment and with an eye to maintaining a stable and continuous distribution of profits.
Under this basic policy, we paid an interim dividend of 14 yen per share and a year-end dividend of 14 yen per share to make the annual dividend payout 28 yen per share in the previous fiscal year based on consolidated results. We plan to decide the specific amounts of the interim and year-end dividends this year with the aim of achieving a consolidated-basis dividend payout ratio of around 20%.
- 5 -
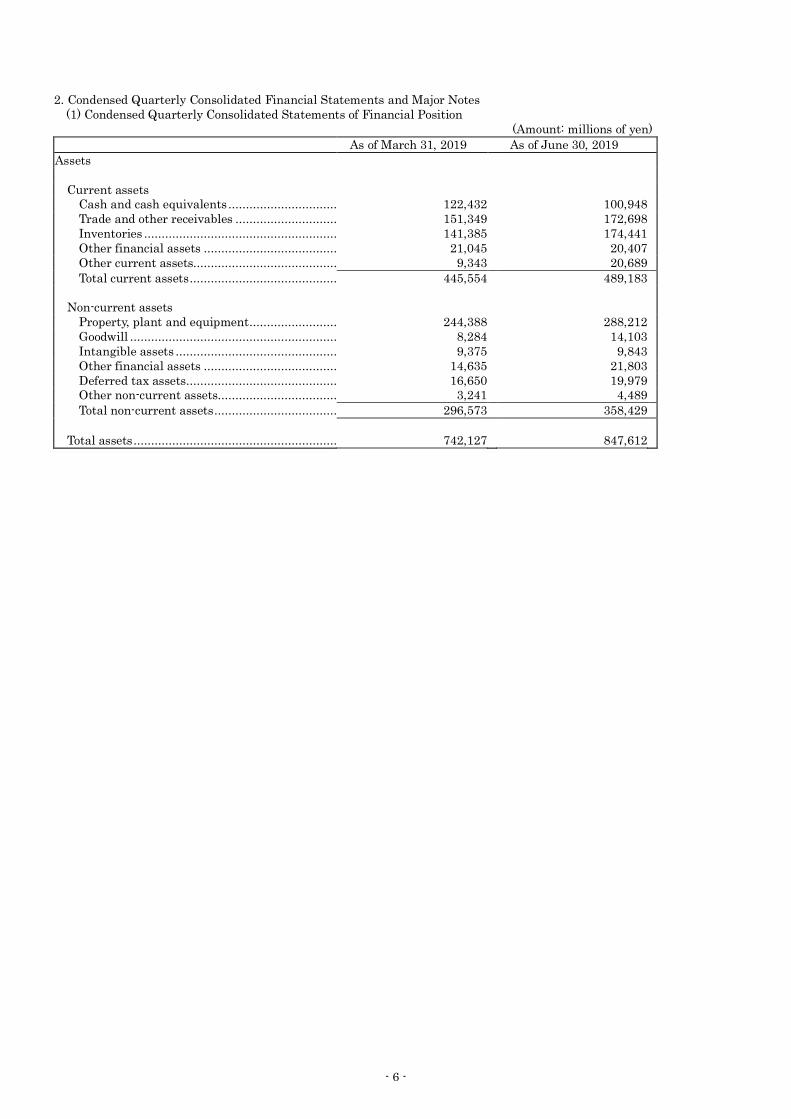
2. Condensed Quarterly Consolidated Financial Statements and Major Notes (1) Condensed Quarterly Consolidated Statements of Financial Position
(Amount: millions of yen) As of March 31, 2019 As of June 30, 2019
Assets
Current assets Cash and cash equivalents ............................... 122,432 100,948 Trade and other receivables ............................. 151,349 172,698 Inventories ....................................................... 141,385 174,441 Other financial assets ...................................... 21,045 20,407 Other current assets......................................... 9,343 20,689 Total current assets .......................................... 445,554 489,183
Non-current assets Property, plant and equipment ......................... 244,388 288,212 Goodwill ........................................................... 8,284 14,103 Intangible assets .............................................. 9,375 9,843 Other financial assets ...................................... 14,635 21,803 Deferred tax assets ........................................... 16,650 19,979 Other non-current assets.................................. 3,241 4,489 Total non-current assets ................................... 296,573 358,429
Total assets .......................................................... 742,127 847,612
- 6 -

(Amount: millions of yen) As of March 31, 2019 As of June 30, 2019
Liabilities and equity
Liabilities Current liabilities
Trade and other payables ................................. 109,344 139,228 Bonds and borrowings ...................................... 86,642 131,255 Other financial liabilities ................................. 1,983 9,787 Income taxes payable ....................................... 5,448 3,882 Provisions ......................................................... 200 4,310 Other current liabilities ................................... 31,848 38,585 Total current liabilities ..................................... 235,465 327,047
Non-current liabilities Bonds and borrowings ...................................... 75,400 78,762 Other financial liabilities ................................. 5,138 15,385 Net defined benefit liabilities ........................... 14,577 20,534 Provisions ......................................................... 1,196 1,310 Deferred tax liabilities ..................................... 1,754 1,696 Other non-current liabilities ............................ 1,337 1,705 Total non-current liabilities .............................. 99,402 119,392
Total liabilities ..................................................... 334,867 446,439
Equity Common stock .................................................. 68,259 68,259 Capital surplus ................................................. 137,464 137,464 Treasury stock .................................................. (19,448 ) (19,449 ) Retained earnings ............................................ 202,172 198,686 Other components of equity.............................. 11,256 2,659 Total equity attributable to owners of the parent ....................................................... 399,703 387,619 Non-controlling interests.................................. 7,557 13,554 Total equity ...................................................... 407,260 401,173
Total liabilities and equity ................................... 742,127 847,612
- 7 -

(2) Condensed Quarterly Consolidated Statements of Income and Condensed Quarterly Consolidated Statements of Comprehensive Income
(Condensed Quarterly Consolidated Statements of Income) (Amount: millions of yen)
Three months ended June 30, 2018
Three months ended June 30, 2019
Net sales .............................................................. 213,038 204,425 Cost of sales ......................................................... 175,663 175,091 Gross profit .......................................................... 37,375 29,334 Selling, general and administrative expenses ..... 23,499 26,796 Other income............................................................... 500 1,636 Other expenses............................................................ 85 511 Operating income ........................................................ 14,291 3,663 Finance income ......................................................... 390 554 Finance expenses ...................................................... 511 537 Profit before income taxes ........................................... 14,170 3,680 Income taxes................................................................ 3,182 1,008 Profit for the period ................................................ 10,988 2,672 Profit for the period attributable to:
Owners of the parent ............................................... 10,886 2,297 Non-controlling interests ......................................... 102 375 Profit for the period .................................................. 10,988 2,672
Earnings per share (EPS)
Basic (Yen) ............................................................... 25.95 5.53 Diluted (Yen) ............................................................ 25.40 5.44
- 8 -
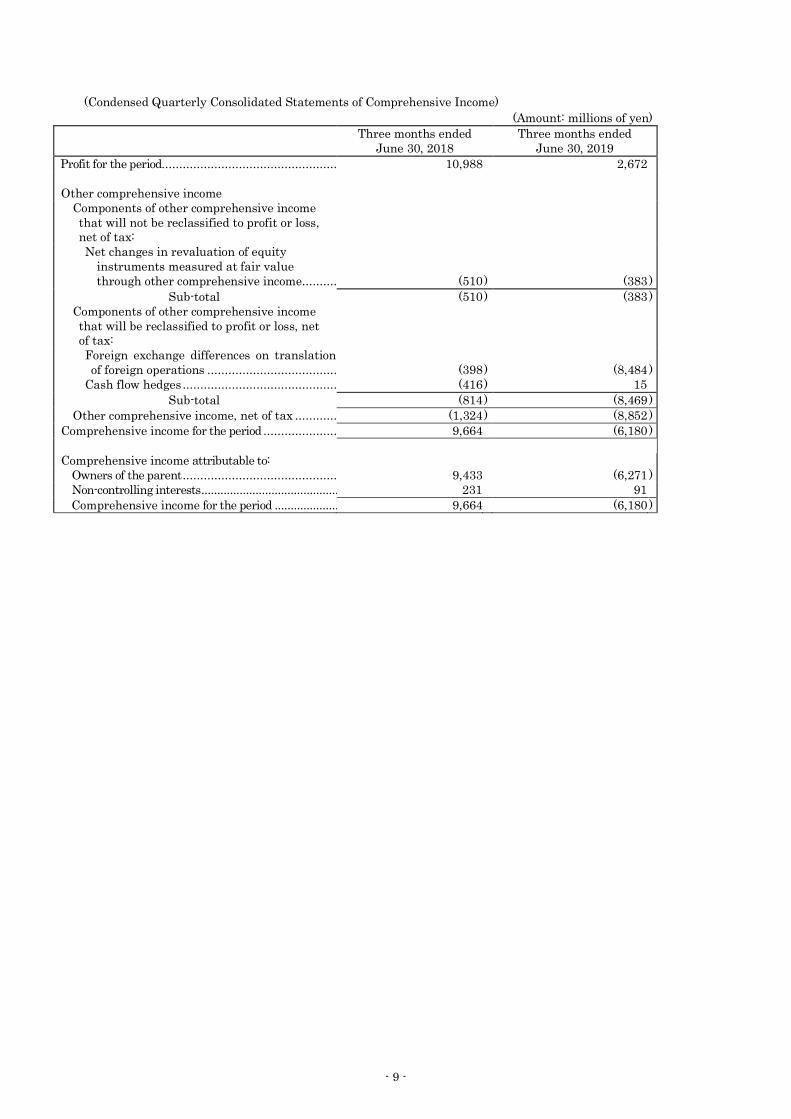
(Condensed Quarterly Consolidated Statements of Comprehensive Income) (Amount: millions of yen)
Three months ended June 30, 2018
Three months ended June 30, 2019
Profit for the period.................................................. 10,988 2,672 Other comprehensive income
Components of other comprehensive income that will not be reclassified to profit or loss, net of tax: Net changes in revaluation of equity
instruments measured at fair value through other comprehensive income .......... (510 ) (383 )
Sub-total (510 ) (383 ) Components of other comprehensive income that will be reclassified to profit or loss, net of tax: Foreign exchange differences on translation of foreign operations .....................................
(398 ) (8,484 )
Cash flow hedges ............................................ (416 ) 15 Sub-total (814 ) (8,469 )
Other comprehensive income, net of tax ............ (1,324 ) (8,852 ) Comprehensive income for the period ..................... 9,664 (6,180 )
Comprehensive income attributable to: Owners of the parent ............................................ 9,433 (6,271 ) Non-controlling interests ........................................... 231 91 Comprehensive income for the period .................... 9,664 (6,180 )
- 9 -
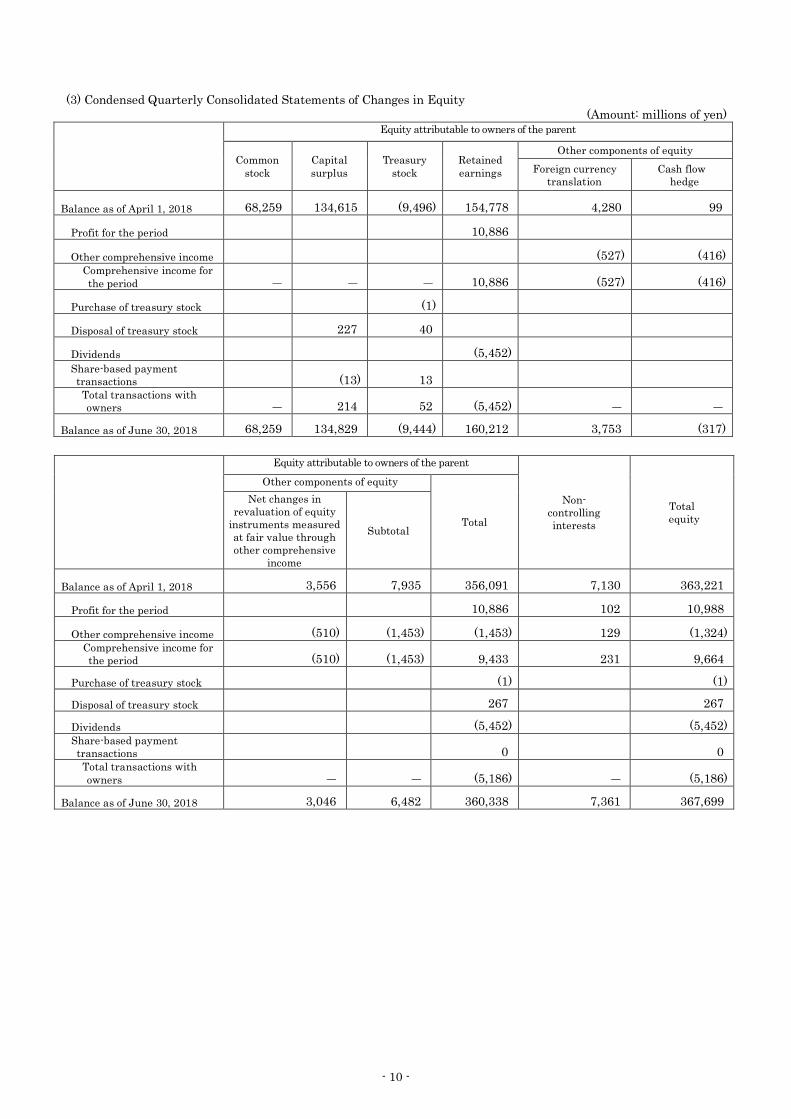
(3) Condensed Quarterly Consolidated Statements of Changes in Equity (Amount: millions of yen)
Equity attributable to owners of the parent
Common stock
Capital surplus
Treasury stock
Retained earnings
Other components of equity
Foreign currency
translation Cash flow
hedge
Balance as of April 1, 2018 68,259 134,615 (9,496) 154,778 4,280 99
Profit for the period 10,886
Other comprehensive income (527) (416)
Comprehensive income for the period ― ― ― 10,886 (527) (416)
Purchase of treasury stock (1)
Disposal of treasury stock 227 40
Dividends (5,452)
Share-based payment transactions
(13) 13
Total transactions with owners ― 214 52 (5,452) ― ―
Balance as of June 30, 2018 68,259 134,829 (9,444) 160,212 3,753 (317)
Equity attributable to owners of the parent
Non- controlling interests
Total equity
Other components of equity
Total
Net changes in revaluation of equity
instruments measured at fair value through other comprehensive
income
Subtotal
Balance as of April 1, 2018 3,556 7,935 356,091 7,130 363,221
Profit for the period 10,886 102 10,988
Other comprehensive income (510) (1,453) (1,453) 129 (1,324) Comprehensive income for the period (510) (1,453) 9,433 231 9,664
Purchase of treasury stock (1) (1)
Disposal of treasury stock 267 267
Dividends (5,452) (5,452) Share-based payment transactions 0 0 Total transactions with
owners ― ― (5,186) ― (5,186)
Balance as of June 30, 2018 3,046 6,482 360,338 7,361 367,699
- 10 -
(Amount: millions of yen) Equity attributable to owners of the parent
Common stock
Capital surplus
Treasury stock
Retained earnings
Other components of equity
Foreign currency
translation Cash flow
hedge
Balance as of April 1, 2019 68,259 137,464 (19,448) 202,172 8,387 (76)
Profit for the period 2,297
Other comprehensive income (8,140) 15
Comprehensive income for the period ― ― ― 2,297 (8,140) 15
Purchase of treasury stock (1)
Dividends (5,812)
Increase of consolidated subsidiaries
Transfer to retained earnings 29
Total transactions with owners ― ― (1) (5,783) ― ―
Balance as of June 30, 2019 68,259 137,464 (19,449) 198,686 247 (61) Equity attributable to owners of the parent
Non- controlling interests
Total equity
Other components of equity
Total
Net changes in revaluation of equity
instruments measured at fair value through other comprehensive
income
Subtotal
Balance as of April 1, 2019 2,945 11,256 399,703 7,557 407,260
Profit for the period 2,297 375 2,672
Other comprehensive income (443) (8,568) (8,568) (284) (8,852) Comprehensive income for the period (443) (8,568) (6,271) 91 (6,180)
Purchase of treasury stock (1) (1)
Dividends (5,812) (5,812) Increase of consolidated subsidiaries ― 5,906 5,906
Transfer to retained earnings (29) (29) ― ― Total transactions with
owners (29) (29) (5,813) 5,906 93
Balance as of June 30, 2019 2,473 2,659 387,619 13,554 401,173
- 11 -

(4) Condensed Quarterly Consolidated Statements of Cash Flows (Amount: millions of yen)
Three months ended June 30, 2018
Three months ended June 30, 2019
Cash flows from operating activities: Profit before income taxes ........................................................ 14,170 3,680 Depreciation and amortization ................................................. 7,754 11,126 Share-based payment expenses ................................................ (472 ) ― Interest income and dividends income ..................................... (346 ) (495 ) Interest expenses ..................................................................... 242 401 Loss (gain) on sale and disposal of property, plant and
equipment ................................................................................ (25 ) (641 ) Decrease (increase) in trade and other receivables................... 8,584 8,810 Decrease (increase) in inventories ............................................ (18,307 ) (18,754 ) Increase (decrease) in trade and other payables....................... 12,610 (2,119 ) Other ........................................................................................ (5,374 ) 4,021
Subtotal 18,836 6,029 Interest received....................................................................... 259 325 Dividends received ................................................................... 85 156 Interest paid ............................................................................. (312 ) (310 ) Income taxes paid..................................................................... (3,961 ) (3,266 )
Net cash flows provided by operating activities 14,907 2,934
Cash flows from investing activities: Decrease (increase) in time deposits......................................... 119 (150 ) Purchase of property, plant and equipment .................................. (14,888 ) (12,754 ) Proceeds from sales of property, plant and equipment ................... 290 1,035 Purchase of intangible assets ....................................................... (267 ) (256 ) Purchase of securities ................................................................. (389 ) (515 ) Proceeds from sale and redemption of securities......................... 319 556 Proceeds from purchase of investments in subsidiaries resulting in change in scope of consolidation.................................................. ― 47
Other ........................................................................................ 62 250 Net cash flows used in investing activities (14,754 ) (11,787 )
Cash flows from financing activities:
Increase (decrease) in short-term borrowings .......................... 1,235 6,163 Proceeds from long-term borrowings ........................................ 1,100 ― Repayments of long-term borrowings ....................................... (2,700 ) (9,819 ) Proceeds from disposal of treasury stock .................................. 267 ― Purchase of treasury stock.......................................................... (1 ) (1 ) Dividends paid ......................................................................... (5,452 ) (5,812 ) Repayments of lease obligations ............................................... (16 ) (643 ) Other ........................................................................................ 0 ―
Net cash flows used in financing activities (5,567 ) (10,112 )
Effect of exchange rate changes on cash and cash equivalents (116 ) (2,519 ) Increase (decrease) in cash and cash equivalents (5,530 ) (21,484 ) Cash and cash equivalents at beginning of period 88,777 122,432 Cash and cash equivalents at end of period 83,247 100,948
- 12 -
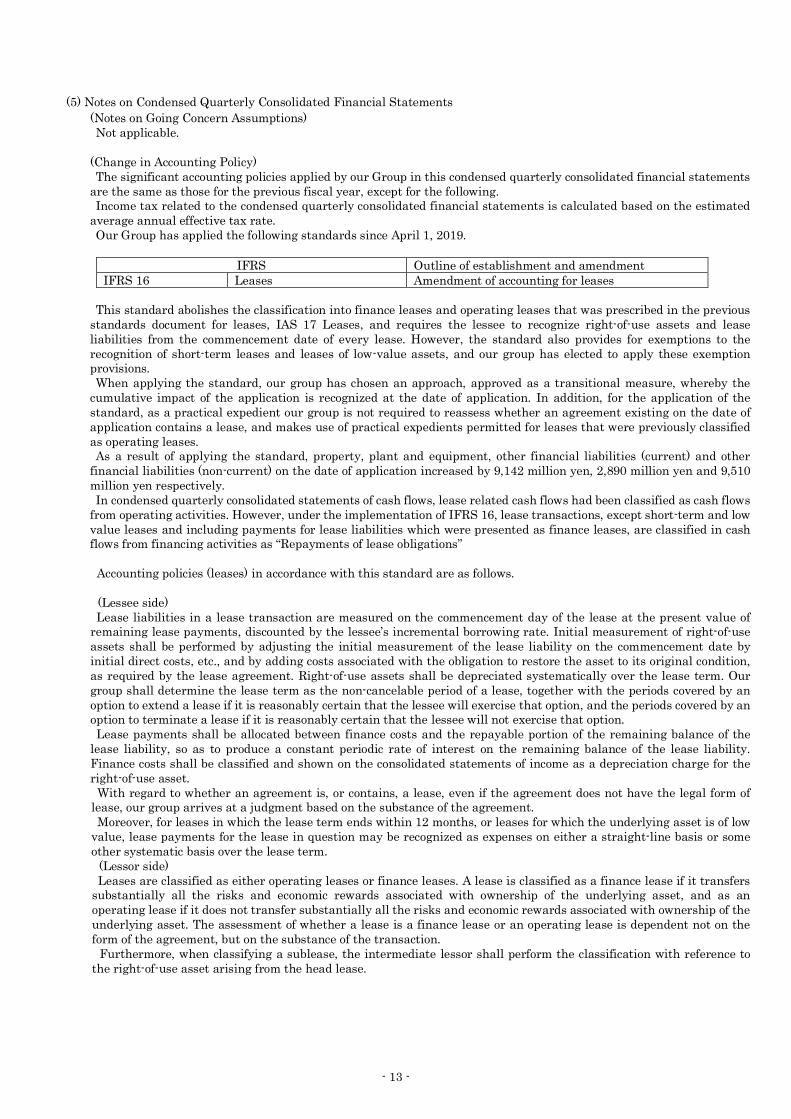
(5) Notes on Condensed Quarterly Consolidated Financial Statements (Notes on Going Concern Assumptions)
Not applicable.
(Change in Accounting Policy) The significant accounting policies applied by our Group in this condensed quarterly consolidated financial statements
are the same as those for the previous fiscal year, except for the following. Income tax related to the condensed quarterly consolidated financial statements is calculated based on the estimated
average annual effective tax rate. Our Group has applied the following standards since April 1, 2019.
IFRS Outline of establishment and amendment IFRS 16 Leases Amendment of accounting for leases
This standard abolishes the classification into finance leases and operating leases that was prescribed in the previous
standards document for leases, IAS 17 Leases, and requires the lessee to recognize right-of-use assets and lease liabilities from the commencement date of every lease. However, the standard also provides for exemptions to the recognition of short-term leases and leases of low-value assets, and our group has elected to apply these exemption provisions. When applying the standard, our group has chosen an approach, approved as a transitional measure, whereby the
cumulative impact of the application is recognized at the date of application. In addition, for the application of the standard, as a practical expedient our group is not required to reassess whether an agreement existing on the date of application contains a lease, and makes use of practical expedients permitted for leases that were previously classified as operating leases. As a result of applying the standard, property, plant and equipment, other financial liabilities (current) and other
financial liabilities (non-current) on the date of application increased by 9,142 million yen, 2,890 million yen and 9,510 million yen respectively. In condensed quarterly consolidated statements of cash flows, lease related cash flows had been classified as cash flows
from operating activities. However, under the implementation of IFRS 16, lease transactions, except short-term and low value leases and including payments for lease liabilities which were presented as finance leases, are classified in cash flows from financing activities as “Repayments of lease obligations” Accounting policies (leases) in accordance with this standard are as follows.
(Lessee side) Lease liabilities in a lease transaction are measured on the commencement day of the lease at the present value of remaining lease payments, discounted by the lessee’s incremental borrowing rate. Initial measurement of right-of-use assets shall be performed by adjusting the initial measurement of the lease liability on the commencement date by initial direct costs, etc., and by adding costs associated with the obligation to restore the asset to its original condition, as required by the lease agreement. Right-of-use assets shall be depreciated systematically over the lease term. Our group shall determine the lease term as the non-cancelable period of a lease, together with the periods covered by an option to extend a lease if it is reasonably certain that the lessee will exercise that option, and the periods covered by an option to terminate a lease if it is reasonably certain that the lessee will not exercise that option. Lease payments shall be allocated between finance costs and the repayable portion of the remaining balance of the lease liability, so as to produce a constant periodic rate of interest on the remaining balance of the lease liability. Finance costs shall be classified and shown on the consolidated statements of income as a depreciation charge for the right-of-use asset. With regard to whether an agreement is, or contains, a lease, even if the agreement does not have the legal form of lease, our group arrives at a judgment based on the substance of the agreement. Moreover, for leases in which the lease term ends within 12 months, or leases for which the underlying asset is of low value, lease payments for the lease in question may be recognized as expenses on either a straight-line basis or some other systematic basis over the lease term. (Lessor side) Leases are classified as either operating leases or finance leases. A lease is classified as a finance lease if it transfers substantially all the risks and economic rewards associated with ownership of the underlying asset, and as an operating lease if it does not transfer substantially all the risks and economic rewards associated with ownership of the underlying asset. The assessment of whether a lease is a finance lease or an operating lease is dependent not on the form of the agreement, but on the substance of the transaction.
Furthermore, when classifying a sublease, the intermediate lessor shall perform the classification with reference to the right-of-use asset arising from the head lease.
- 13 -

(Segment Information) Information related to sales and income (loss) by reportable segments
(Three months ended June 30, 2018) (Amount: millions of yen)
Reportable segment
Other *1
Adjustments
*2 Consolidated Machined
components
Electronic devices and components
MITSUMI business
U-Shin business
Net sales
Net sales to customers Net sales to other segment
47,255
1,378
94,649
1,559
70,956
350
―
―
178
524
―
(3,811)
213,038
―
Total 48,633 96,208 71,306 ― 702 (3,811) 213,038
Segment profit (loss) 11,701 2,205 2,686 ― (95) (2,206) 14,291
Finance income ― ― ― ― ― ― 390
Finance expenses ― ― ― ― ― ― 511 Profit before income taxes ― ― ― ― ― ― 14,170
(Three months ended June 30, 2019)
(Amount: millions of yen)
Reportable segment
Other *1
Adjustments
*2 Consolidated Machined
components
Electronic devices and components
MITSUMI business
U-Shin business
Net sales
Net sales to customers Net sales to other segment
46,053
1,339
77,639
1,549
49,654
689
30,734
―
345
837
―
(4,414)
204,425
―
Total 47,392 79,188 50,343 30,734 1,182 (4,414) 204,425
Segment profit (loss) 10,699 (577) 16 1,016 (367) (7,124) 3,663
Finance income ― ― ― ― ― ― 554
Finance expenses ― ― ― ― ― ― 537 Profit before income taxes ― ― ― ― ― ― 3,680
(Notes) *1. The classification of “Other” refers to business units not included in the reportable segments. Their products are mainly machines made in-house.
*2. The amount of the adjustment is as follows. Adjustments to segment income are corporate expenses such as general and administrative expenses in addition to research and development expenses that do not belong to the reportable segments
3. The changes of reportable segments are as follows. The U-Shin business is disclosed as a reporting segment as of the first quarter. Additionally, the battery module products that were included under the MITSUMI business were transferred to the Electronic devices and components business. Accordingly, segment information has been updated to reflect this change in company organization. The segment information disclosed for the first quarter of the previous year has been prepared based on the post-change reportable segments.
- 14 -