First quarter 2019 results - ING
27
First quarter 2019 results Ralph Hamers, CEO ING Group ING posts 1Q19 net result of €1,119 million Amsterdam • 2 May 2019
Transcript of First quarter 2019 results - ING

First quarter 2019 results
Ralph Hamers, CEO ING Group
ING posts 1Q19 net result of €1,119 million
Amsterdam • 2 May 2019

Key points
2
• ING posted 1Q19 net profit of €1,119 mln
• Primary customers increased by 150,000 to 12.6 mln, growth mainly in Australia and Germany
• We recorded net core lending growth of €8.7 bln in the quarter; net customer deposit inflow amounted to €4.8 bln
• Furthermore, results were supported by solid income despite challenging market conditions, good cost control, relatively low risk costs, and the release of a currency translation reserve
• On a four-quarter rolling average basis, underlying return on equity was 11.0%
• ING Group’s CET1 ratio improved to 14.7% supported by the sale of ING’s stake in Kotak Mahindra Bank
• We continue to improve the way we manage non-financial risk; global KYC enhancement programme is rolled out across more than 40 countries and 38 million customers with over 2,500 FTEs working on KYC across the bank

Grow primary customersin Retail and Wholesale
Increase cross-buyleveraging own, partners’and third parties’ products
Improve cross-border scalability
Faster time-to-volume Benefit from attractivefunding and lending mix
Enhance sustainability profile to increase opportunities
Key value accelerators
3

Our focus on primary customers and digital drives value
4
1.0 bln
+25.6% YoY
Value = Number of customers
Share of primary
Cross-buy Product value
€ +4.8 bln
#1 in 6 out of 13
retail countries
€ +8.7 bln
Core lending
1Q19 net growth
Customer deposits
1Q19 net growth
Net promoter scores (NPS)
1Q19
# of digital interactions**
1Q19
12.610.4 11.4 12.5
>16.5
2016 2017 2018 1Q19 Ambition
2022
New target to reach 16.5 mln primary customers* by 2022
29.2% 30.5% 32.8% 32.9%
Primary as a % of total retail customers
* Definition: active payment customers with recurring income and at least one extra active product category** Log-in to mobile app or Internet banking

24/7
instant
New innovative solutions in the Payments and DLT space
5
Within 5 secondsthe money is directly
available to the beneficiary
Every moment of the day,
all year round, no daily cut-off times.
Book date = value date
Initially payments with maximum of
€15,000 in Europe, yet no maximum in
NL and BE
Confirmation of payment(optional)
Main DLT* initiatives of ING in the trade space
• ING joined a consortium with MineHub to develop a blockchain-based platform that would help our clients in the metals and mining sector to lower costs, increase transparency and contribute to sustainable production and trading
• First client transaction completed on Komgo, a platform that digitalisesand streamlines trade and commodity finance
Instant payments launched in the Netherlands and Belgium
* DLT – Distributed Ledger Technology

Recognition
• Our sustainability expertise was also recognised by several governments:
We are recognised as an industry leader in sustainability
6
Ranked 9th and Industry Leader of 336 global banks by Sustainalytics in March 2019
PHP 15 bln green bond – 1st from the Philippines under ASEAN Green Bond Standards
€500 mln green bond to finance electric vehicles – 1st for LeasePlan
$800 mln RCF – 1st sustainability improvement loan in the US general industrial sector
ING took part in an Austrian government working group on green finance to shape a sustainable future for the country
We received a Polish government mandate to issue euro-denominated green bonds
We were awarded a recurrent mandate to help Spanish regional governments in their sustainability goals
In January 2019,ING was namedto CDP’s Climate A-list for the 4th
year running
Strong sustainability deal activity in 1Q19
• In 1Q19, ING has supported the issuance of 12 sustainable bond transactions, leading to a significant improvement in our Green Bond league table position, and 16 sustainable loan transactions of which 4 green loan transactions and 12 sustainability improvement loans, several of them structured by ING
• This included some sustainability ‘firsts’ as we empower clients in the transition to a low-carbon economy:

1Q19 results
7

1,692
2,1242,022
1,6861,582
1Q18 2Q18 3Q18 4Q18 1Q19
Pre-tax result reflects solid income and higher but still relatively low risk costs
8
• 1Q19 underlying result before tax was €1,582 mln, down 6.2% from a year ago, fully explained by higher but still relatively low risk costs as an increase in operating expenses was more than offset by higher income
• The increase in total underlying income mainly reflects a €119 mln gain on the release of a currency translation reserve following the sale of ING’s stake in Kotak Mahindra Bank in 1Q19. Excluding this gain, income was stable year-on-year as the impact of continued business growth was largely offset by lower Treasury-related revenues and negative valuation adjustments in Financial Markets
• Sequentially, the reduction in pre-tax result was almost fully caused by the seasonally higher regulatory costs recorded in the first quarter
Underlying pre-tax result (in € mln) Total underlying income (in € mln)
4,5014,6464,4844,457 4,576
1Q18 2Q18 3Q18 4Q18 1Q19

152 151152
156 155154 154 153
153 154
1Q18 2Q18 3Q18 4Q18 1Q19
NIM NIM (4-quarter rolling average)
3,300 3,3643,470 3,459
3,391
1Q18 2Q18 3Q18 4Q18 1Q19
Net interest margin remained resilient in 1Q19(in bps)
NII improved year-on-year; 4-quarter rolling NIM at 154 bps
9
Net interest income excl. Financial Markets (FM) (in € mln)
+2.8%
• Net interest income, excluding Financial Markets, increased 2.8% compared to 1Q18. The increase was driven by higher interestresults on customer lending due to volume growth and an improvement of the interest margin on residential mortgages. The interest margin on other customer lending and customer deposits declined
• Quarter-on-quarter, the decline in NII mirrors similar margin trends as described above despite higher average product volumes in 1Q19
• NIM at 155 bps, one basis point down on 4Q18, attributable to lower (volatile) interest results in Financial Markets, whereas the impact of lower interest margins on non-mortgage lending and customer deposits was offset by a lower average balance sheet

Well-diversified net core lending growth in 1Q19
10
Customer lending ING Group 1Q19 (in € bln)
Core lending businesses: €8.7 bln
• Our core lending franchises grew by €8.7 bln in 1Q19:
• Retail Banking increased by €4.8 bln of which €2.9 bln was mortgage growth in most countries and €2.0 bln was other lending growth, primarily in Retail Benelux
• WB reported an increase of €3.9 bln, including volume growth in oil-price related Trade & Commodity Finance (TCF)
* C&GM is Challengers & Growth Markets; WB Other includes Financial Markets ** Lease and WUB run-off was €-0.3 bln (predominantly WUB)*** FX impact was €2.4 bln and Other €0.6 bln
610.3
596.7
2.23.0
1.5
1.41.0 0.2
2.22.5
-0.1 -0.3
31/12/18 Retail
NL
Retail
Belgium
Retail
Germany
Retail
Other
C&GM*
WB Lending WB Daily
Banking &
Trade
Finance
WB Other* Lease run-
off / WUB
run-off**
Treasury FX /
Other***
31/03/19

Net fee and commission income (in € mln) Underlying income Financial Markets (in € mln)
252 274 259 249 256
149 157 156 159 159
280295 281 295 262
-19 -8
27
1Q18 2Q18 3Q18 4Q18 1Q19
Retail Benelux Retail C&GM
Wholesale Banking Intra-year FM adjustment*
Resilient fee income development; challenging quarter for FM
11
720
661717
* Increase in Wholesale Banking fees in 3Q18 included €27 mln of income related to Global Capital Markets activities that was recorded under ‘other income’ in 1H18
• Net fee and commission income rose to €675 mln from €661 mln one year ago, almost fully explained by higher Retail fees in the Netherlands and Germany, while fees in Turkey and Belgium declined. Fees in Wholesale Banking were down compared to 1Q18
• Sequentially, net fee and commission income fell by €29 mln, predominantly due to seasonally lower deal activity in WB Lending
• Financial Markets’ total income was down on 1Q18, mainly caused by negative valuation adjustments which were only partly compensated by higher Rates and Credit Trading. The better trading result was the main explanation for the quarter-on-quarter increase in total income despite the aforementioned negative valuation adjustments in 1Q19
104 7730
112 92
154164
18364 104
1Q18 2Q18 3Q18 4Q18 1Q19
Net interest income Non-interest income
213176
258241704
+2.1%
675196
Underlying cost/income ratio
493
98 91
266
515
1Q 2Q 3Q 4Q
2018 2019
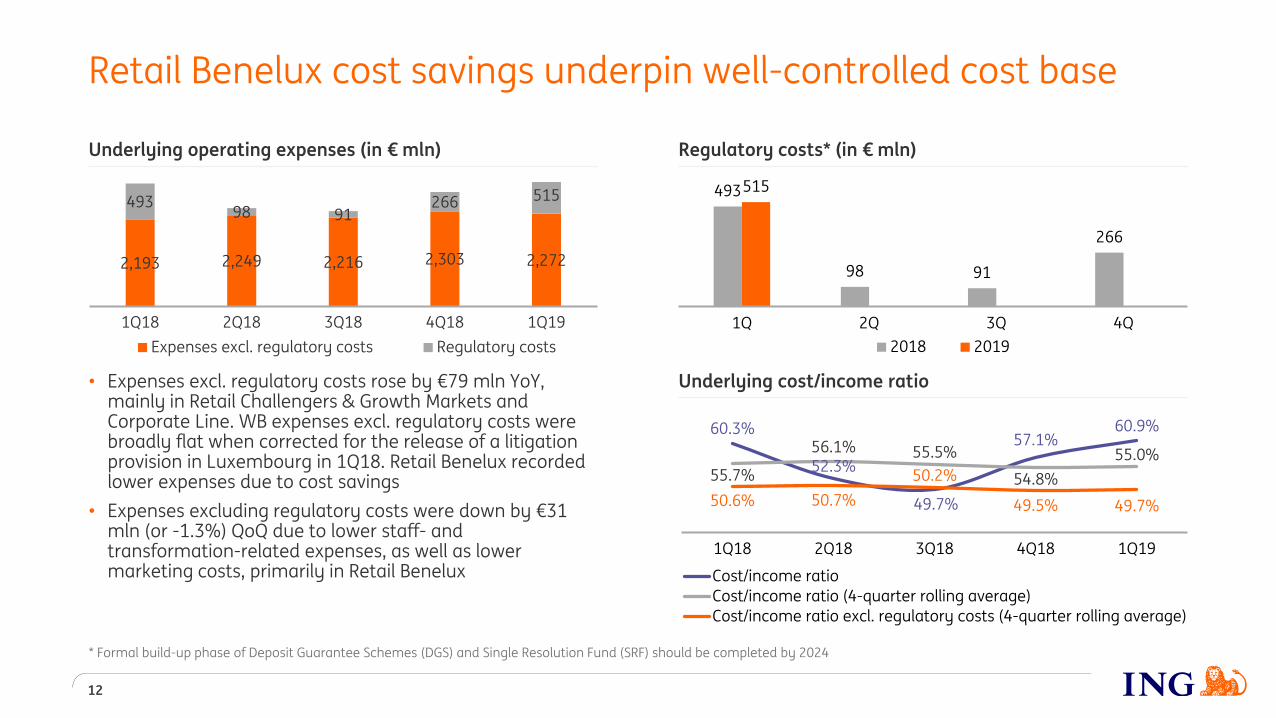
Retail Benelux cost savings underpin well-controlled cost base
12
2,193 2,249 2,216 2,303 2,272
49398 91
266 515
1Q18 2Q18 3Q18 4Q18 1Q19
Expenses excl. regulatory costs Regulatory costs
60.3%
52.3%
49.7%
57.1%60.9%
55.7%
56.1% 55.5%
54.8%
55.0%
50.6% 50.7%
50.2%
49.5% 49.7%
1Q18 2Q18 3Q18 4Q18 1Q19
Cost/income ratio
Cost/income ratio (4-quarter rolling average)
Cost/income ratio excl. regulatory costs (4-quarter rolling average)
* Formal build-up phase of Deposit Guarantee Schemes (DGS) and Single Resolution Fund (SRF) should be completed by 2024
Underlying operating expenses (in € mln) Regulatory costs* (in € mln)
• Expenses excl. regulatory costs rose by €79 mln YoY, mainly in Retail Challengers & Growth Markets and Corporate Line. WB expenses excl. regulatory costs were broadly flat when corrected for the release of a litigation provision in Luxembourg in 1Q18. Retail Benelux recorded lower expenses due to cost savings
• Expenses excluding regulatory costs were down by €31 mln (or -1.3%) QoQ due to lower staff- and transformation-related expenses, as well as lower marketing costs, primarily in Retail Benelux

Stage 3 ratio
1.7%
1.6% 1.6%
1.5% 1.5%
1.8%
1.7%1.6%
1.4% 1.4%
1.7%
1.6% 1.6%
1.6% 1.6%
1Q18 2Q18 3Q18 4Q18 1Q19
ING
Wholesale Banking
Retail Banking
Risk costs (in € mln)
Risk costs up YoY, but remain below through-the-cycle average
13
• 1Q19 risk costs were €207 mln, or 14 bps of average customer lending, below the through-the-cycle average of approx. 25 bps. The bank’s Stage 3 ratio remained unchanged at 1.5%
• Retail Netherlands recorded low risk costs of €11 mln in the quarter. Risk costs in Retail Belgium were broadly stable at €42 mln and were mainly related to business lending. Risk costs in the Retail Challengers & Growth Markets (€84 mln) were recorded mainly in Turkey, Spain and Poland, whereas risk costs in Germany were limited at €2 mln
• Wholesale Banking risk costs were €71 mln, mainly caused by a few individual Stage 3 provisions
-13-52
-2145
1147 32 46
4042
62 7282
107
84
-10
63
10750
71
1Q18 2Q18 3Q18 4Q18 1Q19
Wholesale Banking
Retail Challengers & Growth Markets
Retail Belgium
Retail Netherlands
242
115
85
215207

ING Group CET1 ratio development*
• 1Q19 CET1 ratio increased to 14.7% due to the addition of interim profits and lower RWAs. RWAs were down by €2.3 bln QoQ, mostly explained by the sale of our stake in Kotak Mahindra Bank and positive risk migration. These decreases were partly offset by currency impacts, model updates and volume growth
• Approx. 80% of Basel IV RWA impact is expected from revisions to internal models (effective as per Jan-2022). Other regulatory developments (e.g. TRIM) remain uncertain with respect to magnitude and timing
• With a long implementation phase, potential management actions and the pending transposition of Basel IV into EU law, we are well positioned to achieve our CET1 ratio ambition of around 13.5%
ING Group CET1 ratio up at 14.7% supported by Kotak sale
14
* Small differences in the graph due to rounding** €237 mln which consists of 1Q19 Group net profit of €1,119 mln minus €882 mln set aside for future dividend payments*** Current SREP requirement is 11.81% but is expected to rise to 11.83% by end-2019 and 11.84% in 2020 due to phasing-in of countercyclical buffers
+0.2%+0.1% 0.0%
11.81%***
14.5% 14.7%
4Q18 Group CET1 Profit added to CET1** Kotak Mahindra
Bank sale
RWA & Other
(excl. Kotak impact)
1Q19 Group CET1 Basel IV CET1 ambition
~13.5%
CET1 ratio Basel IV & TRIM impacts 2019 SREP requirement Management buffer (incl. P2G)

Retail BeneluxRetail
Challengers & Growth Markets Wholesale Banking Financial ambitions
IncomeFocus on profitable
lending and feeincome
CostsCost discipline focus;
some increases in markets that grow
Efficiency
Consistent focus on creating operating leverage
15
RWA optimisationand ROE focus
Scalability Efficiency Scalability Growth
Roadmap from current market positions

ING Group financial ambitions
16
Actual 2018 Actual 1Q19 Financial ambitions
Capital
• CET1 ratio (%) 14.5% 14.7%~13.5%*
(Basel IV)
• Leverage ratio (%) 4.4% 4.4% >4%
Profitability
• Underlying ROE (%)** (IFRS-EU Equity)
11.2% 11.0% 10-12%
• Underlying C/I ratio (%)** 54.8% 55.0% 50-52%
Dividend • Dividend (per share) €0.68 Progressive dividend
* Implies management buffer (incl. Pillar 2 Guidance) of ~170 bps over prevailing fully loaded CET1 requirements (currently 11.81% but is expected to rise to 11.83% by end-2019 and 11.84% in 2020 due to phasing-in of countercyclical buffers)** Based on 4-quarter rolling average, the ING Group ROE is calculated using IFRS-EU shareholders’ equity after excluding ‘interim profit not included in CET1 capital’. As at 31 March 2019, this comprised the 2018 final dividend of €1,712 mln and €882 mln of the 1Q19 interim profit set aside for future dividend payments

Wrap up
17

Wrap up
18
• ING posted 1Q19 net profit of €1,119 mln
• Primary customers increased by 150,000 to 12.6 mln, growth mainly in Australia and Germany
• We recorded net core lending growth of €8.7 bln in the quarter; net customer deposit inflow amounted to €4.8 bln
• Furthermore, results were supported by solid income despite challenging market conditions, good cost control, relatively low risk costs, and the release of a currency translation reserve
• On a four-quarter rolling average basis, underlying return on equity was 11.0%
• ING Group’s CET1 ratio improved to 14.7% supported by the sale of ING’s stake in Kotak Mahindra Bank
• We continue to improve the way we manage non-financial risk; global KYC enhancement programme is rolled out across more than 40 countries and 38 million customers with over 2,500 FTEs working on KYC across the bank

Appendix
19

WB reporting aligned with new structure following strategic review
20
WB reporting structure until 4Q18 WB reporting structure per 1Q19
* Real Estate Finance Dutch Domestic Midcorporates reported under Retail Netherlands per 1Q19
Industry Lending
Bank Treasury & Other
General Lending & Transaction
Services
Financial Markets
• Project & Asset-based Finance incl. Trade & Commodity Finance
• Real Estate Finance Corporate Clients & Dutch Domestic Midcorporates
• General Lending
• General Lease (non run-off)
• Transaction Services
• Financial Markets Clients & Products
• Corporate Finance
• WB-part Bank Treasury (ALM/Treasury)
• General Lease (run-off)
• Real Estate (run-off)
• Other
Lending
Treasury & Other
Daily Banking & Trade Finance
Financial Markets
• Project & Asset-based Finance excl. Trade & Commodity Finance
• Real Estate Finance Corporate Clients*
• General Lending
• Transaction Services
• Trade & Commodity Finance
• Financial Markets Clients & Products
• WB-part Treasury (ALM/Treasury)
• General Lease and Real Estate (run-off)
• General Lease (non run-off)
• Corporate Finance
• Other

Volatile items and regulatory costs(in € mln)
1Q18 2Q18 3Q18 4Q18 1Q19
WB/FM – valuation adjustments 13 3 -13 -4 -58
Capital gains/losses 63 29 -3 -10 28
Hedge ineffectiveness 6 -23 56 -10 7
Other items* 28 119
Total volatile items 82 9 40 4 96
Regulatory costs -493 -98 -91 -266 -515
Pre-tax result excl. volatile items and regulatory costs (in € mln)
2,097 2,111 2,1751,954 2,001
1Q18 2Q18 3Q18 4Q18 1Q19
Underlying pre-tax result (in € mln)
1Q19 pre-tax result positively impacted by volatile items
21
1,686
2,0222,124
1,6921,582
1Q18 2Q18 3Q18 4Q18 1Q19
• Excluding volatile items and regulatory costs, 1Q19 pre-tax result was down 4.6% from 1Q18, as higher income could not compensate for higher expenses and an increase in risk costs
• Quarter-on-quarter, the underlying result before tax excluding volatile items and regulatory costs was up 2.4%, mostly due to lower expenses and lower risk costs
* Other items in 4Q18 included a €101 mln gain on an equity-linked bond transaction in Belgium, a €50 mln higher contribution from TMB (driven by one-offs) and a €-123 mln loss on the intended sale of an Italian lease run-off portfolio; 1Q19 concerns a €119 mln one-off gain on the release of a currency translation reserve related to sale of ING’s stake in KotakMahindra Bank

Group CET1 ratio development during 1Q19 (amounts in € bln and %)
Capital RWA Ratio Change
Actuals 31 December 2018 45.4 314.1 14.5%
Net profit included in CET1* 0.2 0.08%
Kotak Mahindra Bank -3.6 0.17%
Other equity stakes 0.3 1.1 0.04%
FX** 1.3 -0.05%
RWA & Other*** -0.1 -1.1 0.03%
Actuals 31 March 2019 45.9 311.9 14.7% 0.26%
Group CET1 ratio at 14.7% and underlying ROE at 11.0%
22
Group underlying ROE calculation in 1Q19(in € mln)
As of 31 March 2019
IFRS-EU shareholders’ equity 52,788
deduct: Interim profit not included in CET1 capital**** 2,595
Adjusted shareholders’ equity 50,193
Adjusted shareholders’ equity (4Q-rolling average) 48,449
Underlying net result (last four quarters) 5,315
Underlying ROE (4Q-rolling average) 11.0%
* 1Q19 Group net profit (€1,119 mln) is partly reserved for dividends (€882 mln) and remainder is included in Group CET1 capital (€237 mln)** FX impact includes a €119 mln gain on the release of a currency translation reserve following the sale of ING’s stake in Kotak Mahindra Bank which is recycled through P&L. Adjusting for the €119 mln gain, FX impact is only -1 bp*** RWA and Other includes the positive impact from risk migration (+28 bps) and Market RWA excl. Kotak sale (+5 bps), which were mostly offset by the negative impact from volume growth (-18 bps), model updates (-4 bps) and other items (-9 bps)**** The profit not included in CET1 capital is €2,595 mln which comprised the 2018 final dividend (€1,712 mln) and €882 mln of the 1Q19 interim profit set aside for future dividend payments

26%
10%
9%13%
17%
3%
15%
7%
Mortgages Netherlands
Other lending Netherlands
Mortgages Belgium
Other lending Belgium
Mortgages Germany
Other lending Germany
Mortgages Other C&GM
Other lending Other C&GM
Retail Banking* ING Group* Wholesale Banking*
Note: percentages for Retail (Netherlands) and Wholesale Banking have changed versus 4Q18 as Real Estate Finance portfolio related to Dutch domestic midcorporates was transferred to Retail Netherlands from Wholesale Banking as per 1Q19* 31 March 2019 lending and money market credit outstandings, including guarantees and letters of credit, but excluding undrawn committed exposures (off-balance sheet positions)
• ING has a well-diversified and well-collateralised loan book with a strong focus on own-originated mortgages; 65% of the portfolio is retail-based
65%
35%
Retail Banking
Wholesale Banking
66%
29%
1%4%
Lending
Daily Banking & Trade Finance
Financial Markets
Treasury & Other
€681 bln
€442 bln
€239bln
Well-diversified lending credit outstandings by activity
23

8%
14%
17%
25%
9%
2%3%
22%Japan
China***
Hong Kong
Singapore
South Korea
Taiwan
India
Rest of Asia
Loan portfolio is well diversified across geographies…
Lending Credit O/S Wholesale Banking (1Q19)*
Lending Credit O/S Wholesale Banking Asia (1Q19)*
7%
9%
5%
14%
6%8%9%
3%
17%
3%
18%
1% NLBeluxGermanyOther ChallengersGrowth MarketsUKEuropean network (EEA**)European network (non-EEA)North AmericaAmericas (excl. North America)AsiaAfrica
14%
16%
7%
10%13%
19%
17%
4% Real Estate, Infra & ConstructionCommodities, Food & AgriTMT & HealthcareTransportation & LogisticsEnergyDiversified Corporates****Financial Institutions*****Other
Granular Wholesale Banking lending credit outstandings by geography and sector
24
Note: percentages for WB Netherlands are lower versus 4Q18 as Real Estate Finance portfolio related to Dutch domestic midcorporates was transferred to Retail Netherlands from Wholesale Banking as per 1Q19 * Data is based on country/region of residence; Lending and money market credit O/S, including guarantees and letters of credit but excluding undrawn committed exposures (off-balance sheet positions)** Member countries of the European Economic Area (EEA) *** Excluding our stake in Bank of Beijing (€2.3 bln at 31 March 2019)**** Large corporate clients active across multiple sectors***** Including Financial sponsors
€239bln
€43 bln
…and sectors
Lending Credit O/S Wholesale Banking (1Q19)*
€239bln

Detailed Stage 3 disclosure on selected portfolios
25
* Includes both WB Real Estate Finance portfolio and Dutch domestic midcorporates portfolio which was transferred from Wholesale Banking to Retail Netherlands in 1Q19** Of which €3.2 bln (or 8% of Oil & Gas related exposures) are reserve-based lending activities *** Shipping & Ports includes Coastal and Inland Water Freight which is booked within Retail Netherlands. Excluding this portfolio, Stage 3 ratio is 2.1%**** Turkey includes Retail Banking activities (€5.2 bln)
Selected portfolios (in € mln)
Lending credit O/S 1Q19
Stage 3 ratio 1Q19
Lending credit O/S 4Q18
Stage 3 ratio 4Q18
Lending credit O/S 1Q18
Stage 3 ratio 1Q18
Wholesale Banking 238,992 1.4% 236,248 1.4% 221,882 1.8%
Lending 157,262 1.4% 153,260 1.5% 135,273 2.2%
Daily Banking & Trade Finance 69,196 0.4% 68,708 0.3% 71,696 0.0%
Selected industries
Real Estate Finance* 33,400 0.9% 33,800 1.1% 31,700 1.6%
Oil & Gas related** 39,228 1.6% 38,000 1.6% 37,941 2.5%
Metals & Mining 17,299 2.3% 16,249 2.2% 14,962 3.8%
Shipping & Ports*** 15,292 3.3% 14,605 3.7% 13,175 5.7%
Selected countries
Turkey**** 12,073 3.1% 13,011 2.8% 15,627 2.4%
Russia 5,469 0.0% 5,700 0.2% 4,481 2.7%
Ukraine 924 21.0% 876 21.6% 798 41.6%

16%
45%
37%
2%
USD
EUR
TRY
Other
Lending Credit O/S by currency
Overview Turkey exposure
26
Total exposure ING to Turkey* (in € mln)
1Q19 4Q18 Change
Lending Credit O/S Retail Banking 5,189 5,709 -9.1%
Residential mortgages 573 595 -3.7%
Consumer lending 1,243 1,355 -8.3%
SME/Midcorp 3,373 3,760 -10.3%
Lending Credit O/S Wholesale Banking 6,884 7,301 -5.7%
Total Lending Credit O/S* 12,073 13,011 -7.2%
Stage 3 ratio and coverage ratio
1Q19 4Q18
Stage 3 ratio 3.1% 2.8%
Coverage ratio 55% 48%
Lending Credit O/S by remaining maturity
TRY** ~1 year
FX ~2 years
* Data based on country of residence. Lending credit outstandings, including guarantees and letters of credit, but excluding undrawn committed exposures (off-balance sheet positions) ** Excludes residential mortgages, which have an average remaining maturity of ~6 years
• Amortisation of loan book is being used to reduce intra-group funding (from €3.0 bln at end-4Q18 to €2.7 bln at end-1Q19)
• Total outstandings to Turkey reduced rapidly, mostly due to Turkish lira depreciation
• ING only provides FX lending to corporate customers with proven FX revenues; only limited rolling-over of FX lending facilities
• ECA-insured lending (Export Credit Agencies) is approx. €1.7 bln; approx. €0.9 bln of SME/Midcorp lending benefits from KGF cover (Turkish Credit Guarantee Fund)
• Quality of the portfolio remains strong with a Stage 3 ratio of 3.1%

Important legal information
27
ING Group’s annual accounts are prepared in accordance with International Financial Reporting Standards as adopted by the European Union (‘IFRS-EU’). In preparing the financial information in this document, except as described otherwise, the same accounting principles are applied as in the 2018 ING Group consolidated annual accounts. All figures in this document are unaudited. Small differences are possible in the tables due to rounding.
Certain of the statements contained herein are not historical facts, including, without limitation, certain statements made of future expectations and other forward-looking statements that are based on management’s current views and assumptions and involve known and unknown risks and uncertainties that could cause actual results, performance or events to differ materially from those expressed or implied in such statements. Actual results, performance or events may differ materially from those in such statements due to a number of factors, including, without limitation: (1) changes in general economic conditions, in particular economic conditions in ING’s core markets, (2) changes in performance of financial markets, including developing markets, (3) potential consequences of the United Kingdom leaving the European Union or a break-up of the euro, (4) changes in the fiscal position and the future economic performance of the US including potential consequences of a downgrade of the sovereign credit rating of the US government, (5) potential consequences of a European sovereign debt crisis, (6) changes in the availability of, and costs associated with, sources of liquidity such as interbank funding, (7) changes in conditions in the credit and capital markets generally, including changes in borrower and counterparty creditworthiness, (8) changes affecting interest rate levels, (9) inflation and deflation in our principal markets, (10) changes affecting currency exchange rates, (11) changes in investor and customer behaviour, (12) changes in general competitive factors, (13) changes in or discontinuation of ‘benchmark’ indices, (14) changes in laws and regulations and the interpretation and application thereof, (15) changes in compliance obligations including, but not limited to, those posed by the implementation of DAC6, (16) geopolitical risks, political instabilities and policies and actions of governmental and regulatory authorities, (17) changes in standards and interpretations under International Financial Reporting Standards (IFRS) and the application thereof, (18) conclusions with regard to purchase accounting assumptions and methodologies, and other changes in accounting assumptions and methodologies including changes in valuation of issued securities and credit market exposure, (19) changes in ownership that could affect the future availability to us of net operating loss, net capital and built-in loss carry forwards, (20) changes in credit ratings, (21) the outcome of current and future legal and regulatory proceedings, (22) operational risks, such as system disruptions or failures, breaches of security, cyber-attacks, human error, changes in operational practices or inadequate controls including in respect of third parties with which we do business, (23) risks and challenges related to cybercrime including the effects of cyber-attacks and changes in legislation and regulation related to cybersecurity and data privacy, (24) the inability to protect our intellectual property and infringement claims by third parties, (25) the inability to retain key personnel, (26) business, operational, regulatory, reputation and other risks in connection with climate change, (27) ING’s ability to achieve its strategy, including projected operational synergies and cost-saving programmes and (28) the other risks and uncertainties detailed in this annual report of ING Groep N.V. (including the Risk Factors contained therein) and ING’s more recent disclosures, including press releases, which are available on www.ING.com. (29) This document may contain inactive textual addresses to internet websites operated by us and third parties. Reference to such websites is made for information purposes only, and information found at such websites is not incorporated by reference into this document. ING does not make any representation or warranty with respect to the accuracy or completeness of, or take any responsibility for, any information found at any websites operated by third parties. ING specifically disclaims any liability with respect to any information found at websites operated by third parties. ING cannot guarantee that websites operated by third parties remain available following the publication of this document, or that any information found at such websites will not change following the filing of this document. Many of those factors are beyond ING’s control.
Any forward looking statements made by or on behalf of ING speak only as of the date they are made, and ING assumes no obligation to publicly update or revise any forward-looking statements, whether as a result of new information or for any other reason.
This document does not constitute an offer to sell, or a solicitation of an offer to purchase, any securities in the United States or any other jurisdiction.