First Quarter 2018 - ECN Capital · 2018-08-10 · • Expense reduction commitment and actions...
26
First Quarter 2018 Strategic Update & Financial Results MAY 10, 2018
Transcript of First Quarter 2018 - ECN Capital · 2018-08-10 · • Expense reduction commitment and actions...

First Quarter 2018
Strategic Update & Financial Results
MAY 10, 2018
2
Disclaimer
Certain information in this presentation is forward-looking and related to anticipated financial performance, events and strategies.
When used in this context, words such as “will”, “anticipate”, “believe”, “plan”, “intend”, “target” and “expect” or similar words
suggest future outcomes. Forward-looking statements relate to, among other things, ECN Capital Corp.’s (“ECN Capital”)
objectives and strategy; future cash flows, financial condition, operating performance, financial ratios, projected asset base and
capital expenditures; anticipated cash needs, capital requirements and need for and cost of additional financing; future assets;
demand for services; ECN Capital’s competitive position; expected growth in originations; and anticipated trends and challenges
in ECN Capital’s business and the markets in which it operates; and the plans, strategies and objectives of ECN Capital for the
future.
The forward-looking information and statements contained in this presentation reflect several material factors and expectations
and assumptions of ECN Capital including, without limitation: that ECN Capital will conduct its operations in a manner consistent
with its expectations and, where applicable, consistent with past practice; ECN Capital’s continued ability to successfully execute
on its strategic transition; the general continuance of current or, where applicable, assumed industry conditions; the continuance
of existing (and in certain circumstances, the implementation of proposed) tax and regulatory regimes; certain cost assumptions;
the continued availability of adequate debt and/or equity financing and cash flow to fund its capital and operating requirements
as needed; and the extent of its liabilities. ECN Capital believes the material factors, expectations and assumptions reflected in the
forward-looking information and statements are reasonable but no assurance can be given that these factors, expectations and
assumptions will prove to be correct.
By their nature, such forward-looking information and statements are subject to significant risks and uncertainties, which could
cause the actual results and experience to be materially different than the anticipated results. Such risks and uncertainties include,
but are not limited to, operating performance, regulatory and government decisions, competitive pressures and the ability to
retain major customers, rapid technological changes, availability and cost of financing, availability of labor and management
resources, the performance of partners, contractors and suppliers.
Readers are cautioned not to place undue reliance on forward-looking statements as actual results could differ materially from the
plans, expectations, estimates or intentions expressed in the forward-looking statements. Except as required by law, ECN Capital
disclaims any intention and assumes no obligation to update any forward-looking statement, whether as a result of new
information, future events or otherwise.
2
Q1-2018 FINANCIAL RESULTS

3
Disclaimer
ECN Capital’s audited consolidated financial statements have been prepared in accordance with International Financial
Reporting Standards (“IFRS”) as issued by the International Accounting Standards Board and the accounting policies we adopted
in accordance with IFRS. In this presentation, management has used certain terms, including adjusted operating income before
tax, adjusted operating income after tax, adjusted operating income after tax EPS and managed assets, which do not have a
standardized meaning under IFRS and are unlikely to be comparable to similar measures presented by other organizations. ECN
Capital believes that certain non-IFRS Measures can be useful to investors because they provide a means by which investors can
evaluate ECN Capital’s underlying key drivers and operating performance of the business, exclusive of certain adjustments and
activities that investors may consider to be unrelated to the underlying economic performance of the business of a given period.
Throughout this presentation, management used a number of terms and ratios which do not have a standardized meaning under
IFRS and are unlikely to be comparable to similar measures presented by other organizations. A full description of these measures
can be found in the Management Discussion & Analysis that accompanies the financial statements for the quarter ended March
31, 2018. ECN Capital’s management discussion and analysis for the three-month period ended March 31, 2018 has been filed on
SEDAR (www.sedar.com) and is available under the investor section of the ECN Capital’s website (www.ecncapitalcorp.com).
This presentation and, in particular the information in respect of ECN Capital’s prospective originations, revenues, operating
income, adjusted operating income, adjusted operating income EPS, and intrinsic value illustration may contain future oriented
financial information (“FOFI”) within the meaning of applicable securities laws. The FOFI has been prepared by management to
provide an outlook on ECN Capital’s proposed activities and potential results and may not be appropriate for other purposes. The
FOFI has been prepared based on a number of assumptions, including the assumptions discussed above, and assumptions with
respect to operating costs, foreign exchange rates, general and administrative expenses and expected originations growth. ECN
Capital and management believe that the FOFI has been prepared on a reasonable basis, reflecting management’s best
estimates and judgments, however, the actual results of operations of ECN Capital and the resulting financial results may vary from
the amounts set forth herein and such variations may be material. FOFI contained in this presentation was made as of the date of
this presentation and ECN Capital disclaims any intention or obligation to update or revise any FOFI contained in this presentation,
whether as a result of new information, future events or otherwise, unless required pursuant to applicable law.
3
Q1-2018 FINANCIAL RESULTS
4
Call Agenda
STRATEGIC UPDATE
OPERATING HIGHLIGHTS
Business Services
• Home Improvement
• Manufactured Housing
Legacy Business
• Rail & Aviation Finance
CONSOLIDATED FINANCIAL SUMMARY
QUESTIONS
4
Q1-2018 FINANCIAL RESULTS

5
STRATEGIC UPDATE
5
Q1-2018 FINANCIAL RESULTS

Strategic Timeline
6
Sold US C&V business for
US$1.6 billion, ~17% premium
to assets
Sold Commercial
Aviation business for
US$19 million
Acquired Service Finance
for US$309 million
2017 APR JUN JUL SEP OCT DEC JAN MAY 2018
Acquired Triad Financial
Services for US$100 million
Sold Canadian C&V business for ~US$670 million
Announced strategic partnership with the
Kessler Group for US$221.2 million
The Kessler partnership marks the completion of ECN’s two year strategic transition
• Harvested capital through five completed sales transactions, >2% premium on book assets and >10% premium on equity
• Two business services acquisitions closed & KG partnership announced
Asset-based Lender
Business ServicesProvider
Sold non-core Rail assets for
$US1.1 billion
Q1-2018 FINANCIAL RESULTS

Strategic Plan
7
Q1-2018 FINANCIAL RESULTS
Asset-based Lender to Business Services Firm - COMPLETE
• Transition from a direct lender to a leading business services
company providing lending and credit services to US financial
institutions is complete
• Three scalable business services platforms in Service Finance,
Triad and The Kessler Group
• 82% of 2019 revenue from fee based services to 90+ financial
institutions; 78% in Q3 2017, 79% in Q4 2018
• Manager, advisor and servicer on $29+ billion of consumer
credit assets
Legacy Business Capital Redeployment – ~65% COMPLETE
• Orderly redeployment of remaining legacy business capital
• In addition to $775 million harvested to date, legacy
businesses have remaining capital of $450 million
• Expect substantial completion of redeployment by the end
of 2019
• Organic growth opportunities within three core verticals
• Allocation of capital – opportunistic acquisitions, repurchase
+ dividends
• Maintain investment grade ratings
1.Management fees & Kessler annuities
82.0%
18.0%
ECN CAPITAL
2019 EST REVENUES
Business Services Legacy Business

Strategic Plan
8
Right sizing capital, operations and expenses - UNDERWAY
• Right sizing capital and operations to business services platform
• Returned significant capital through SIB & NCIB (C$217 million, ~15% of shares outstanding)
• NCIB remains a valuable capital allocation tool
• Expense reduction commitment and actions continue (see slide 25)
ECN committed to realizing synergies between platforms - UNDERWAY
• ECN resources and relationships driving additional bank relationships (see slide 9)
• ECN converting its bank relationships into SFC, Triad and Kessler customers
• Cross-selling bank relationships between platforms
• Back office best practices shared between businesses
Q1-2018 FINANCIAL RESULTS
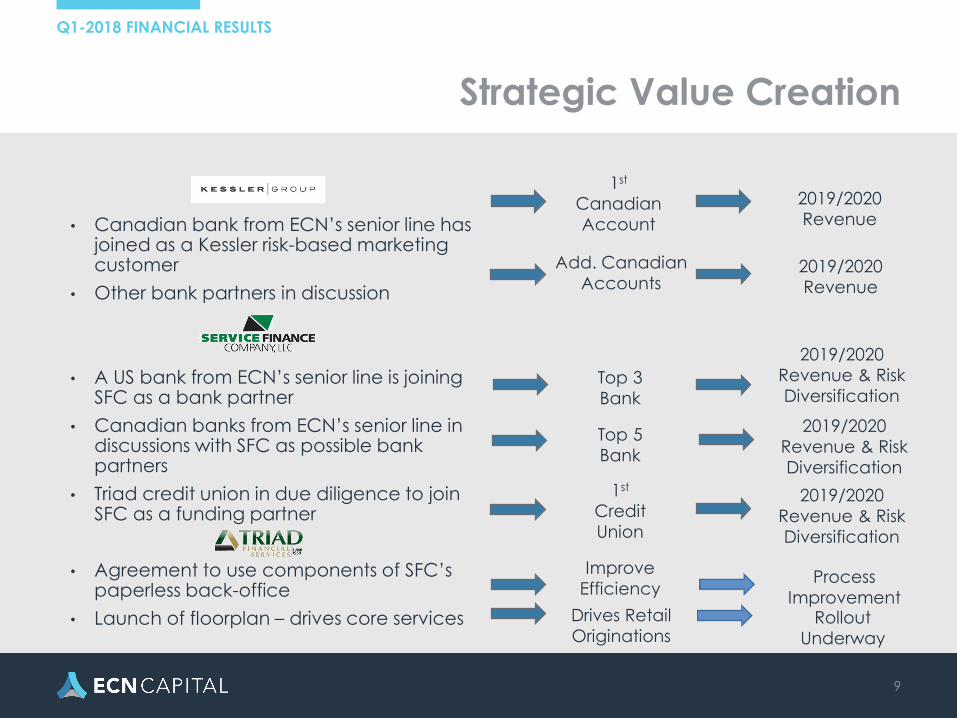
Strategic Value Creation
• Canadian bank from ECN’s senior line has joined as a Kessler risk-based marketing customer
• Other bank partners in discussion
• A US bank from ECN’s senior line is joining SFC as a bank partner
• Canadian banks from ECN’s senior line in discussions with SFC as possible bank partners
• Triad credit union in due diligence to join SFC as a funding partner
• Agreement to use components of SFC’s paperless back-office
• Launch of floorplan – drives core services
Top 3
Bank
2019/2020
Revenue & Risk
Diversification
Top 5
Bank
1st
Credit
Union
Improve
Efficiency
Drives Retail
Originations
1st
Canadian
Account
Add. Canadian
Accounts
Process
ImprovementRollout
Underway
2019/2020
Revenue
2019/2020
Revenue
2019/2020
Revenue & Risk
Diversification
2019/2020
Revenue & Risk
Diversification
9
Q1-2018 FINANCIAL RESULTS

Management Aligned
10
• At the end of Q1, employees and board members owned approximately 11% of the
company, including shares, options and PSUs
• Management and insiders have been consistent buyers of shares
• Corporate senior leader compensation and pension arrangements are tied to
performance metrics
• Newly acquired businesses have 5-year deferred purchase price earn-out plans with
prescribed ROAE targets
INSIDER COMMON SHARE PURCHASES
2.00
2.50
3.00
3.50
4.00
4.50
09/2016 11/2016 01/2017 03/2017 05/2017 07/2017 09/2017 11/2017 01/2018
Share Price Insider Purchase
Q1-2018 FINANCIAL RESULTS

11
OPERATING HIGHLIGHTS
• Business Services
• Home Improvement
• Manufactured Housing
• Legacy Business
• Rail & Aviation Finance
11
Q1-2018 FINANCIAL RESULTS

12
Business Services
• Home Improvement
• Manufactured Housing
12
Q1-2018 FINANCIAL RESULTS

13
Home Improvement
13
KEY HIGHLIGHTS
• Total originations for the quarter increased 79% over Q1-2017
• Total originations include new solar program launched in the first quarter
• EBITDA was $8.8 million in Q1 2018, +66% year over year
• As previously disclosed, revenue yields will vary by channel
• Originations under the solar program have a lower fee structure than our core business but add incremental profitability
• Operating margins impacted by increased expenses related to the development and roll-out of new origination partners
• Robust dealer growth continues
o Adding ~170 new dealers per month
Select Metrics (US$, MM)Q1
2017Q1
2018
Originations 135.1 241.7
Period end managed assets 748.1 1,217.8
EBITDA 5.3 8.8
Adjusted operating income before tax 5.3 8.4
Guidance Announced December 14, 2017 (US$, MM)
2018
Total originations 1,365
Core originations 1,135
New channel originations 230
Managed assets (year-end) 1,860
Revenue 81
EBITDA 59
Adjusted operating income before tax 55
Q1-2018 FINANCIAL RESULTS

-
10
20
30
40
50
60
70
80
90
100
Jan Feb Mar Apr May Jun Jul Aug Sep Oct Nov Dec
US$ M
illio
ns
ORIGINATIONS
2014 2015 2016 2017 2018
Home Improvement
14
ORIGINATIONS (US$ Million's) YOY ORIGINATION GROWTH
1Q 2Q 3Q 4Q 1Q 2Q 3Q 4Q
2015 58 91 106 105 104.1% 120.3% 126.5% 116.8%
2016 99 143 167 138 71.4% 56.9% 57.2% 31.7%
2017 135 221 249 213 36.8% 54.2% 49.1% 54.9%
2018 242 79.2%
Q1-2018 FINANCIAL RESULTS

15
Manufactured Housing
15
KEY HIGHLIGHTS Select Metrics (US$, MM)Q1
2017Q1
2018
Originations 91.9 94.0
Period end managed assets 1,749.3 2,003.8
EBITDA 1.4 2.5
Adjusted operating income before tax 1.4 2.4
Guidance Announced December 14, 2017 (US$, MM)
2018
Total originations 530
Managed assets (year-end) 2,310
Revenue 46
EBITDA 21
Adjusted operating income before tax 20
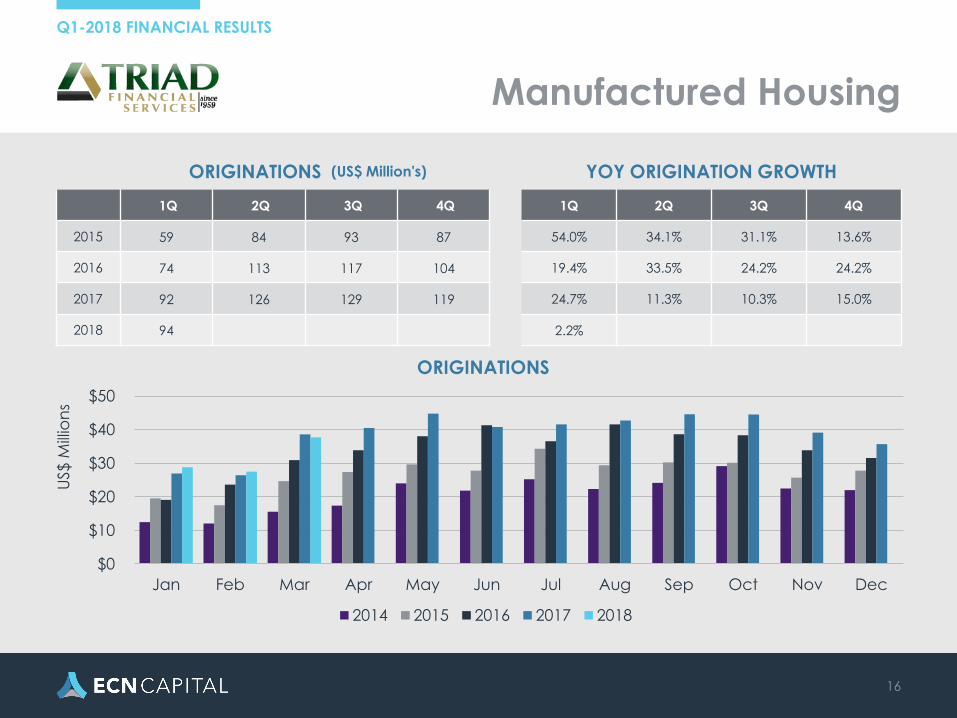
• Total Q1 originations of $94 million
• Q1 Originations were impacted by:
• Federal Emergency Management Agency (FEMA) absorbed significant short-term industry capacity to support disaster recovery
• The Defense Production Act allows FEMA priority for manufacturer shipments to assist with recovery1
• This resulted in a larger than normal backlog of fully documented contractual loan agreements with down payments
• Without delays noted above originations would have been ~$105 million
• Backlog to return to normal in 2Q
• April results increased significantly vs last year
• Successfully launched floorplan program
• Drives more core loan originations & managed assets
• 77 manufacturers/dealers signed
• Quarter-end balance of $12 million
1. https://www.manufacturedhomes.com/blog/manufactured-home-hurricane-response/
Q1-2018 FINANCIAL RESULTS
Manufactured Housing
16
ORIGINATIONS (US$ Million's) YOY ORIGINATION GROWTH
1Q 2Q 3Q 4Q 1Q 2Q 3Q 4Q
2015 59 84 93 87 54.0% 34.1% 31.1% 13.6%
2016 74 113 117 104 19.4% 33.5% 24.2% 24.2%
2017 92 126 129 119 24.7% 11.3% 10.3% 15.0%
2018 94 2.2%
$0
$10
$20
$30
$40
$50
Jan Feb Mar Apr May Jun Jul Aug Sep Oct Nov Dec
US$ M
illio
ns
ORIGINATIONS
2014 2015 2016 2017 2018
Q1-2018 FINANCIAL RESULTS

17
Legacy Businesses
• Rail & Aviation Finance
17
Q1-2018 FINANCIAL RESULTS

18
1. Percent of average earning assets
2. Financial revenue yield includes 1.8% from syndications in Q4 2017
Income Statement (US$,000)Q4
2017Q1
2018
Net rental revenue less interest expense & provision
4,521 5,146
Syndication and other income 2,853 26
Operating expenses 1,483 1,418
Adjusted operating income before tax
5,891 3,754
Key Ratios (1) Q42017
Q12018
Originations (US$MM) 36 13
Average earning assets (US$MM) 639 688
Financial revenue yield2 6.5% 4.7%
Interest expense 1.9% 1.7%
Net interest margin yield 4.6% 3.0%
Operating expense ratio 0.9% 0.8%
Pre-tax ROAA 3.7% 2.2%
Rail Highlights
KEY HIGHLIGHTS
• Originations continue to be disciplined, with US$13 million added during Q1. No syndication income realized, in-line with expectations
• Future origination and syndication activity will be opportunistic and focus on portfolio optimization
o Syndications expected to close in Q2 and no
planned origination volume
• Net Rental Revenue yield consistent with Q4 and reflects change in portfolio composition
• Improved leasing fundamentals
18
Q1-2018 FINANCIAL RESULTS

19
1. Percent of average earning assets
Income Statement (US$,000)Q4
2017Q1
2018
Interest income & rental revenue net less interest expense & provision
5,676 6,001
Syndication and other income (484) (285)
Operating expenses 1,422 952
Adjusted operating income before tax(1) 3,770 4,764
Key Ratios (1) Q42017
Q12018
Average earning assets (US$MM) 464 441
Financial revenue yield 4.7% 5.2%
Interest expense 0.1% —
Net interest margin yield 4.5% 5.2%
Operating expense ratio 1.2% 0.9%
Pre-tax ROAA 3.3% 4.3%
Aviation Highlights
KEY HIGHLIGHTS
• No originations as wind-down progresses
• Average earning assets were $441 million down from $464 million in Q4-2017 and $732 million in Q1-2017
• Adjusted operating income before taxes
was $4.8 million, up 26% over Q4-2017 due to a combination of higher income and lower operating expenses
• Subsequent to quarter end, we entered into a commercial arrangement to sell aircraft inventory ($35 million)
19
Q1-2018 FINANCIAL RESULTS

20
Consolidated Financial Summary
20
Q1-2018 FINANCIAL RESULTS
21
Q1 Consolidated Operating Highlights
SUMMARY
• Total Originations were $349 million for the quarter
• After tax adjusted EPS of US$0.02 (~C$0.03)
• After tax adjusted EPS of US$0.01 excluding discontinued operations
• Tangible leverage of 0.53:1
• Book value per share of $3.58 (C$4.61)
21
Q1-2018 FINANCIAL RESULTS

22
1. Total finance assets = Net investment in finance receivables + Equipment under operating leases for continuing operations.
2. Reflects off-balance sheet portfolios of Service Finance and Triad.
Balance Sheet ($,MM)Q3
2017Q4
2017Q1
2018
Total assets 2,735.7 2,793.1 2,095.5
Total finance assets (1) 2,400.9 1,293.6 1,259.5
Total managed assets (2) 1,023.1 3,081.6 3,221.5
Shareholders’ equity 1,537.2 1,498.4 1,441.6
Tangible book equity (excluding preferred shares)
1,032.1 938.4 878.0
Tangible leverage ratio 0.87:1 1.05:1 0.53:1
Balance Sheet
KEY HIGHLIGHTS
• Total finance assets decreased compared to Q4 primarily due to an aircraft coming off lease and moving into inventory.
• Total managed assets at the end of Q1 reflects $1.2 billion in our Home Improvement segment, and $2.0 billion in our Manufactured Housing segment
22
Q1-2018 FINANCIAL RESULTS

23
1. Excludes share-based compensation
2. Percent of average earning assets
Income Statement ($,000)Q4
2017Q1
2018
Origination revenue 6,874 13,432
Servicing revenue 6,844 8,580
Interest income and net rental revenue 13,379 14,126
Other revenue 5,366 3,120
Interest expense and provision for credit loss 8,031 8,358
Operating expenses 13,460 21,771
Adjusted operating income before tax 10,972 9,129
Consolidated Income Statement
23
KEY HIGHLIGHTS
• Origination and servicing revenue significantly increased in Q1 as a result of the first full quarter results of our Manufactured Housing segment.
• Interest and net rental revenue were relatively flat in Q1 while other revenue decreased due to lower syndications, particularly in our Rail Finance segment.
• Operating expenses increased due to a full quarter of Manufactured Housing results, higher costs in the Home Improvement segment as it builds out its revenue origination channels, and higher Corporate costs as M&A activity continues.
Q1-2018 FINANCIAL RESULTS

24
Operating Expenses
24
KEY HIGHLIGHTS
• Home Improvement segment expenses increased in Q1 as the business invests in growth of its origination channels.
• Manufactured Housing expenses reflect its first full quarter of operations in Q1
• Higher corporate expenses reflect continued M&A activity and the fact that no transactions closed during the quarter. G&A expenses associated with successful M&A activity is recorded as business acquisition costs.
• 2018 guidance reflects US$27 million in corporate operating expenses which are weighted towards Q1 to Q3 as we complete M&A execution
Operating Expenses ($, 000)Q3
2017
Q4
2017
Q1
2018
Home Improvement 1,052 5,250 6,008
Manufactured Housing - - 6,055
Rail Finance 2,432 1,483 1,418
Aviation Finance 949 1,422 952
Corporate 4,389 5,305 7,338
Total operating expenses 8,822 13,460 21,771
Operating Expenses ($, 000)Q3
2017
Q4
2017
Q1
2018
Base Corporate 4,389 4,911 5,250
M&A Transactions – Did not
close- 394 2,088
M&A Transactions – Closed 4,106 2,368 250
8,495 7,673 7,588
Q1-2018 FINANCIAL RESULTS

Corporate Operating Expenses
25
Q1 2018
US$M Annualized
~$30
Actions• Executive compensation reductions; led by 20% reduction by CEO• Eliminate M&A related costs• Other SG&A reductions
Q3 2018 ~$25
Actions• Further executive compensation reductions• Right-sizing corporate overhead
Q1 2019 ~$21
US$M Quarterly
~$7.5
~$6.25
~$5.25
In addition, ECN to reduce Senior line from $2.2B to $1.5B resulting in $2.4 savings in standby fees
Q1-2018 FINANCIAL RESULTS

26
Questions
26
MAKING CAPITAL WORKMAKING CAPITAL WORK