First quarter 2017 results - statoil.com quarter 2017 results ... North American gas prices,...
29
Transcript of First quarter 2017 results - statoil.com quarter 2017 results ... North American gas prices,...


Statoil 1st quarter 2017 2
1st quarter 2017 review
First quarter 2017 results
Statoil reports adjusted earnings of USD 3.3 billion and an IFRS net operating income of USD 4.3 billion in the first quarter of 2017. The IFRS net income was USD 1.1 billion.
The first quarter results were characterised by:
Solid earnings and strong cash flow from operations across all segments
Solid operational performance, continued high regularity and good progress on improvement work
Net debt ratio reduced from 35.6% to 30.0%
“Our solid financial result and strong cash flow across all segments was driven by higher prices, good operational performance and an organic production growth of 5%. Our production from the Norwegian Continental Shelf was at its highest level in five years, driven by high regularity and ramp-up of new fields. Our international portfolio delivered positive results and cash flow per barrel after tax on par with our Norwegian portfolio. We continue to capture efficiency gains and are on track to deliver an additional billion dollars in annual improvements in 2017”, says Eldar Sætre, President and CEO of Statoil ASA.
“We delivered seven discoveries from nine exploration wells drilled during first quarter. Many of these can be quickly put into profitable production. We are also about to start our exploration programme in the Barents Sea, testing several new opportunities over the next six months. In the quarter, we received approval for three plans for development and submitted additional two projects for approval by Norwegian authorities, showing commitment to industrial development on the NCS,” says Sætre.
Adjusted earnings were USD 3.313 billion in the first quarter, up from USD 0.857 billion in the same period in 2016. Adjusted earnings after tax were USD 1.114 billion in the first quarter, up from USD 0.122 billion in the same period last year. Higher prices for both oil and North American gas, solid operational performance with high production and continued progress on improvement initiatives contributed to the increase. The increased production resulted in higher royalty costs and production fees, contributing negatively to the results.
IFRS net operating income was USD 4.250 billion in the first quarter compared to USD 1.060 billion in the same period of 2016. IFRS net income was USD 1.064 billion, up from USD 0.611 billion in the same period last year.
Statoil delivered equity production of 2,146 mboe per day in the first quarter, an increase from 2,054 mboe per day in the same period in 2016. The increase was primarily due to ramp-up of new fields, increased gas offtake and solid operational performance. Excluding divestments, the underlying production growth was 5% compared to the first quarter last year.
Adjusted exploration expenses in the quarter were USD 202 million, down from USD 280 million in the first quarter of 2016.
Cash flows provided by operating activities amounted to USD 5.970 billion for the first quarter of 2017 compared to USD 2.205 billion for the same period last year. Organic capital expenditure was USD 2.2 billion in the first three months of 2017. End of quarter net debt to capital employed was reduced to 30.0%.
The board of directors has decided to maintain a dividend of USD 0.2201 per ordinary share for the first quarter, and, pending approval from the annual general meeting, continue the scrip programme this quarter giving shareholders the option to receive the dividend in cash or newly issued shares in Statoil at a 5% discount.
The twelve-month average Serious incident frequency (SIF) was 0.8 for the twelve months ended 31 March 2017, compared to 0.6 in the same period a year ago. Statoil continues its efforts to improve safety performance.
Quarters Change
Q1 2017 Q4 2016 Q1 2016 Q1 on Q1
Net operating income (USD million) 4,250 (1,897) 1,060 >100%
Adjusted earnings (USD million) [5] 3,313 1,664 857 >100%
Net income (USD million) 1,064 (2,785) 611 74%
Adjusted earnings after tax (USD million) [5] 1,114 (40) 122 >100%
Total equity liquids and gas production (mboe per day) [4] 2,146 2,095 2,054 4%
Group average liquids price (USD/bbl) [1] 49 44 29 70%

Statoil 1st quarter 2017 3
1st quarter 2017 review
FIRST QUARTER 2017 GROUP REVIEW
The significant increase in liquids prices was the main cause for the increased results in the first quarter compared to last year. Also, reduced operational costs, higher US gas prices and increased gas sales, gains on derivatives and higher refinery margins positively impacted the quarterly results.
Total equity liquids and gas production [4] was 2,146 mboe per day in the first quarter of 2017, up 4% compared to first quarter of 2016 mainly due to new production from start-up and ramp-up on various fields, effects from redetermination and stronger operational performance. The strong increase was partially offset by divestments and expected natural decline and cease of production on various fields.
Total entitlement liquids and gas production [3] was up by 5% to 2,007 mboe per day compared to 1,909 mboe per day in the first quarter of 2016 due to the increase in equity production as described above, and a slightly positive effect from production sharing agreements (PSA-effect). The PSA-effect was 97 mboe per day in the first quarter of 2017 compared to 100 mboe per day in the first quarter of 2016.
Condensed income statement under IFRS Quarters Change(unaudited, in USD million) Q1 2017 Q4 2016 Q1 2016 Q1 on Q1
Total revenues and other income 15,528 12,756 10,115 54%
Purchases [net of inventory variation] (6,466) (6,290) (4,170) 55%
Operating and administrative expenses (2,642) (2,667) (2,495) 6%
Depreciation, amortisation and net impairment losses (1,943) (4,261) (2,039) (5%)
Exploration expenses (227) (1,435) (351) (35%)
Net operating income 4,250 (1,897) 1,060 >100%
Net income 1,064 (2,785) 611 74%
Net operating income was USD 4,250 million in the first quarter of 2017, compared to net operating income of USD 1,060 million in the first quarter of 2016. The significant increase was primarily due to higher liquids prices. Reduced operational costs, increased gas sales, increased North American gas prices, unrealised gains on derivatives and higher refinery margins added to the increase.
In the first quarter of 2017, net operating income was positively affected by gains from changes in fair value of derivatives and inventory hedge contracts totalling USD 832 million, and reversal of impairments of USD 439 million. Loss on sale of assets of USD 384 million, primarily related to divestment of the oil sands activities in Canada, negatively impacted net operating income in the quarter.
In the first quarter of 2016, net operating income was positively affected by net impairment reversals of USD 308 million, mainly due to improved production profiles and lower operating and capital expenditures on both conventional and un-conventional assets.
Adjusted operating and administrative expenses decreased by 5% to USD 2,274 million in the first quarter of 2017. The reduction was primarily due to divestment of assets and reduced estimates for asset retirement obligations. The reduction was partially offset by increased transportation expenses and higher royalties due to the increase in prices and volumes.
Adjusted depreciation expenses decreased by 2% to USD 2,382 million in the first quarter of 2017, mainly because of increased proved reserves estimates and lower depreciation basis due to impairments of assets in 2016. The reduction in depreciation was partially offset by production start-up and ramp-up of new fields.
Adjusted exploration expenses decreased by USD 78 million to USD 202 million in the first quarter of 2017 mainly due to a lower portion of capitalised expenditures from earlier years being expensed this quarter. Lower exploration activity in the first quarter of 2017 added to the reduction in adjusted exploration costs.
After total adjustments of net USD 938 million to net operating income, Adjusted earnings [5] were USD 3,313 million in the first quarter of 2017, up from USD 857 million in the first quarter of 2016.

Statoil 1st quarter 2017 4
1st quarter 2017 review
Adjusted earnings Quarters Change(in USD million) Q1 2017 Q4 2016 Q1 2016 Q1 on Q1
Adjusted total revenues and other income 14,571 13,562 10,179 43%
Adjusted purchases [6] (6,400) (6,193) (4,223) 52%
Adjusted operating and administrative expenses (2,274) (2,317) (2,400) (5%)
Adjusted depreciation expenses (2,382) (2,781) (2,418) (2%)
Adjusted exploration expenses (202) (607) (280) (28%)
Adjusted earnings [5] 3,313 1,664 857 >100%
Adjusted earnings after tax [5] 1,114 (40) 122 >100%
Adjusted earnings after tax [5] were USD 1,114 million in the first quarter of 2017, which reflects an effective tax rate on adjusted earnings of 66.4%, compared to 85.8% in the first quarter of 2016. The effective tax rate decreased mainly due to relatively lower losses in entities with lower than average tax rates or entities without recognised deferred tax asset.
Total cash flows increased by USD 2,390 million compared to the first quarter of 2016.
Cash flows provided by operating activities were increased by USD 3,765 million compared to the first quarter of 2016. The increase was mainly due to increased liquids and gas prices and a reduction in working capital in the current period compared to an increase in the first quarter of last year.
Cash flows used in investing activities were increased by USD 1,582 million compared to the first quarter of 2016. The increase was mainly due to financial investments made in the first quarter, partially offset by lower capital expenditures and increased proceeds from sale of assets mainly related to the divestment of the Kai Kos Dehseh (KKD) oil sands projects.
Cash flows used in financing activities were decreased by USD 208 million compared to the first quarter of 2016. The decrease is mainly due to no dividend payment in the quarter (dividend for the third quarter of 2016 was paid in April 2017) and decreased cash flow from collateral received related to derivatives.
Free cash flow [5] in the first quarter of 2017 was USD 3,562 million, an increase of USD 4,944 million compared to the first quarter of 2016 mainly due to increased liquids and gas prices, decreased capital expenditures, increased proceeds from sale of assets and no dividend payments being made in the quarter.
OUTLOOK Organic capital expenditures [5] for 2017 (i.e. excluding acquisitions, capital leases and other investments with significant different cash flow
pattern) are estimated at around USD 11 billion Statoil intends to continue to mature its large portfolio of exploration assets and estimates a total exploration activity level of around USD 1.5
billion for 2017, excluding signature bonuses Statoil expects to achieve an additional USD 1 billion in efficiency improvements in 2017 with a total of USD 4.2 billion Statoil’s ambition is to keep the unit of production cost in the top quartile of its peer group For the period 2016 – 2020, organic production growth [7] is expected to come from new projects resulting in around 3% CAGR (Compound
Annual Growth Rate) The equity production for 2017 is estimated to be around 4-5% above the 2016 level Scheduled maintenance activity is estimated to reduce quarterly production by approximately 75 mboe per day in the second quarter of 2017.
In total, maintenance is estimated to reduce equity production by around 30 mboe per day for the full fiscal year 2017 Indicative effects from Production Sharing Agreement (PSA-effect) [4] and US royalties are estimated to be around 150 mboe per day in
2017 based on an oil price of USD 40 per barrel and 165 mboe per day based on an oil price of USD 70 per barrel Deferral of production to create future value, gas off-take, timing of new capacity coming on stream and operational regularity represent the
most significant risks related to the foregoing production guidance
These forward-looking statements reflect current views about future events and are, by their nature, subject to significant risks and uncertainties because they relate to events and depend on circumstances that will occur in the future. For further information, see section Forward-Looking Statements.

Statoil 1st quarter 2017 5
1st quarter 2017 review
DEVELOPMENT AND PRODUCTION NORWAY
First quarter 2017 review Average daily production of liquids and gas increased by 5% to 1,393 mboe per day in the first quarter of 2017 compared to the first quarter of 2016. The increase was mainly due to ramp up of partner operated fields, higher gas off-take at Oseberg and redetermination effect at Ormen Lange. Cease of production on two fields and natural decline on mature fields partly offset the increase. Net operating income for Development and Production Norway (DPN) was USD 3,241 million compared to USD 1,325 million in the first quarter of 2016. Impairment reversal of USD 439 million related to reduced cost estimates of a Norwegian continental shelf development asset positively impacted net operating income.
Adjusted earnings [5] were USD 2,621 million, up 101% compared to the first quarter of 2016. The increase was mainly due to increase in liquids prices. Adjusted operating and administrative expenses increased mainly due to a change in the internal allocation of gas transportation costs between DPN and MMP. This also increased the revenues due to a higher transfer price. Adjusted depreciation decreased mainly due to increased proved reserves. Adjusted exploration expenses were stable, increased drilling activity was offset by increased capitalisation rate.
Adjusted earnings Quarters Change(in USD million) Q1 2017 Q4 2016 Q1 2016 Q1 on Q1
Adjusted total revenues and other income 4,470 4,025 3,225 39%
Adjusted operating and administrative expenses (683) (590) (628) 9%
Adjusted depreciation (1,097) (1,348) (1,228) (11%)
Adjusted exploration expenses (70) (115) (69) 1%
Adjusted earnings [5] 2,621 1,972 1,301 >100%

Statoil 1st quarter 2017 6
1st quarter 2017 review
DEVELOPMENT AND PRODUCTION INTERNATIONAL
First quarter 2017 review
Average equity production of liquids and gas in the first quarter of 2017 increased by 3% to 753 mboe per day compared to the first quarter of 2016. The increase was primarily driven by start-up and ramp-up on several fields including In Salah Southern Fields and Corrib. This was partly offset by expected natural decline on various partner operated fields, as well as the divestments of the oil sands activities and West Virginia operated Marcellus properties.
Average daily entitlement production of liquids and gas in the first quarter of 2017 increased by 4% to 615 mboe per day compared to the first quarter of 2016. The increase was due to higher equity production and a slightly positive effect from production sharing agreements (PSA effect). The PSA effect was 97 mboe per day in the first quarter of 2017 compared to 100 mboe per day in the first quarter of 2016.
Net operating income for Development and Production International (DPI) was negative USD 161 million in the first quarter of 2017 compared to negative USD 473 million in the first quarter of 2016. In the first quarter of 2017, net operating income was negatively impacted by losses from sale of assets of USD 384 million, primarily related to divestment of the oil sands activities in Canada. In the first quarter of 2016, net operating income was positively impacted by net reversal of impairments of USD 314 million.
Adjusted earnings [5] were positive USD 272 million in the first quarter of 2017, compared with negative USD 800 million in the first quarter of 2016. The positive development was mainly caused by higher realised oil and gas prices, in addition to lower exploration expenses and lower operating and administrative expenses. Adjusted operating and administrative expenses decreased primarily due to reduced provisions for future asset retirement costs and portfolio changes. The decreases were partially offset by higher royalties and transportation expenses. Adjusted depreciation increased primarily due to production start-up and ramp-up of new fields. Higher reserves estimates partially offset the increase in depreciation. Adjusted exploration expenses decreased in the first quarter of 2017 mainly due to a lower portion of capitalised expenditures from earlier years being expensed this quarter. Lower exploration activity in the first quarter of 2017 further reduced the cost.
Adjusted earnings Quarters Change(in USD million) Q1 2017 Q4 2016 Q1 2016 Q1 on Q1
Adjusted total revenues and other income 2,222 1,859 1,198 85%
Adjusted operating and administrative expenses (630) (708) (697) (10%)
Adjusted depreciation (1,184) (1,338) (1,087) 9%
Adjusted exploration expenses (132) (492) (211) (37%)
Adjusted earnings [5] 272 (681) (800) N/A

Statoil 1st quarter 2017 7
1st quarter 2017 review
MARKETING, MIDSTREAM AND PROCESSING
First quarter 2017 review Natural gas sales volumes in the first quarter of 2017 amounted to 15.5 billion standard cubic meters (bcm), up 4% compared to the first quarter of 2016. The increase was due to higher Statoil entitlement production mainly on the Norwegian continental shelf. Of the total gas sales in the first quarter of 2017, entitlement gas was 13.1 bcm compared to 12.2 bcm in the first quarter of 2016.
Average invoiced European natural gas sales price [8] was strong in the quarter compared to the previous quarter and ended on the same level as first quarter last year. Average invoiced North American piped gas sales price [8] increased by 45%, mainly due to a general increase in Henry Hub prices.
Net operating income for Marketing, Midstream and Processing (MMP) was USD 1.279 million compared to USD 303 million in the first quarter of 2016. Net operating income was positively impacted by changes in fair value of derivatives and market value of storage and physical contracts, with the total of USD 788 million. In the first quarter of 2016, net operating income was negatively impacted by changes in the market value of storage and future physical contracts of USD 149 million.
Adjusted earnings [5] were USD 500 million, compared to USD 431 million in the first quarter of 2016. The increase was mainly due to higher margins for gas sales and trading activity, partly offset by decreased result from trading liquids. Good refinery margins and high regularity added to the increase. Adjusted operating and administrative expenses decreased mainly due to a change in the internal allocation of gas transportation costs between MMP and DPN, partially offset by an increase in other transportation costs.
Adjusted earnings Quarters Change(in USD million) Q1 2017 Q4 2016 Q1 2016 Q1 on Q1
Adjusted total revenues and other income 14,274 13,322 10,052 42%
Adjusted purchases [6] (12,712) (11,679) (8,525) 49%
Adjusted operating and administrative expenses (989) (1,064) (1,023) (3%)
Adjusted depreciation (73) (65) (73) 1%
Adjusted earnings [5] 500 514 431 16%

Statoil 1st quarter 2017 8
Condensed interim financial statement and notes
CONDENSED INTERIM FINANCIAL STATEMENTS
First quarter 2017
CONSOLIDATED STATEMENT OF INCOME
Quarters Full year(unaudited, in USD million) Q1 2017 Q4 2016 Q1 2016 2016
Revenues 15,468 12,696 10,087 45,688
Net income from equity accounted investments 57 (58) 20 (119)
Other income 3 118 8 304
Total revenues and other income 15,528 12,756 10,115 45,873
Purchases [net of inventory variation] (6,466) (6,290) (4,170) (21,505)
Operating expenses (2,418) (2,439) (2,247) (9,025)
Selling, general and administrative expenses (224) (228) (247) (762)
Depreciation, amortisation and net impairment losses (1,943) (4,261) (2,039) (11,550)
Exploration expenses (227) (1,435) (351) (2,952)
Net operating income 4,250 (1,897) 1,060 80
Net financial items (206) (838) 625 (258)
Income before tax 4,044 (2,735) 1,685 (178)
Income tax (2,980) (50) (1,074) (2,724)
Net income 1,064 (2,785) 611 (2,902)
Attributable to equity holders of the company 1,062 (2,791) 607 (2,922)
Attributable to non-controlling interests 2 6 4 20
Basic earnings per share (in USD) 0.33 (0.87) 0.19 (0.91)
Diluted earnings per share (in USD) 0.33 (0.87) 0.19 (0.91)
Weighted average number of ordinary shares outstanding (in millions) 3,236 3,219 3,180 3,195

Statoil 1st quarter 2017 9
Condensed interim financial statement and notes
CONSOLIDATED STATEMENT OF COMPREHENSIVE INCOME
Quarters Full year(unaudited, in USD million) Q1 2017 Q4 2016 Q1 2016 2016
Net income 1,064 (2,785) 611 (2,902)
Actuarial gains (losses) on defined benefit pension plans 78 (294) (221) (503)
Income tax effect on income and expenses recognised in OCI (20) 71 60 129
Items that will not be reclassified to the Consolidated statement of income 58 (223) (161) (374)
Currency translation adjustments 437 (1,552) 1,357 17
Net gains (losses) from available for sale financial assets (10) 0 89 (0)
Items that may be subsequently reclassified to the Consolidated statement of income 428 (1,552) 1,446 17
Other comprehensive income 486 (1,775) 1,285 (357)
Total comprehensive income 1,550 (4,560) 1,896 (3,259)
Attributable to the equity holders of the company 1,548 (4,566) 1,892 (3,279)
Attributable to non-controlling interests 2 6 4 20

Statoil 1st quarter 2017 10
Condensed interim financial statement and notes
CONSOLIDATED BALANCE SHEET
At 31 March At 31 December At 31 March (unaudited, in USD million) 2017 2016 2016
ASSETS
Property, plant and equipment 60,109 59,556 64,576
Intangible assets 9,235 9,243 9,494
Equity accounted investments 2,344 2,245 835
Deferred tax assets 2,248 2,195 1,775
Pension assets 933 839 1,242
Derivative financial instruments 1,746 1,819 3,294
Financial investments 2,565 2,344 3,037
Prepayments and financial receivables 907 893 849
Total non-current assets 80,087 79,133 85,102
Inventories 3,150 3,227 2,594
Trade and other receivables 7,013 7,839 6,868
Derivative financial instruments 254 492 407
Financial investments 10,118 8,211 9,292
Cash and cash equivalents 7,135 5,090 8,540
Total current assets 27,670 24,859 27,700
Assets classified as held for sale 0 537 0
Total assets 107,757 104,530 112,802
EQUITY AND LIABILITIES
Shareholders' equity 36,618 35,072 42,162
Non-controlling interests 28 27 36
Total equity 36,647 35,099 42,198
Finance debt 27,289 27,999 30,210
Deferred tax liabilities 7,243 6,427 7,553
Pension liabilities 3,425 3,380 3,213
Provisions 13,528 13,406 13,192
Derivative financial instruments 1,437 1,420 935
Total non-current liabilities 52,922 52,633 55,105
Trade, other payables and provisions 9,049 9,666 9,003
Current tax payable 3,746 2,184 3,151
Finance debt 4,500 3,674 2,796
Dividends payable 712 712 0
Derivative financial instruments 180 508 550
Total current liabilities 18,188 16,744 15,499
Liabilities directly associated with the assets classified as held for sale 0 54 0
Total liabilities 71,110 69,431 70,604
Total equity and liabilities 107,757 104,530 112,802

Statoil 1st quarter 2017 11
Condensed interim financial statement and notes
CONSOLIDATED STATEMENT OF CHANGES IN EQUITY
(unaudited, in USD million) Share capital Additional paid-
in capitalRetained earnings
Currency translation
adjustmentsAvailable for sale
financial assetsShareholders'
equity Non-controlling
interests Total equity
At 31 December 2015 1,139 5,720 38,693 (5,281) (0) 40,271 36 40,307
Net income for the period 607 607 4 611
Other comprehensive income (161) 1,357 89 1,285 1,285
Total comprehensive income 1,896
Other equity transactions 1 (1) (0) (5) (5)
At 31 March 2016 1,139 5,720 39,138 (3,924) 89 42,162 36 42,198
At 31 December 2016 1,156 6,607 32,573 (5,264) (0) 35,072 27 35,099
Net income for the period 1,062 1,062 2 1,064
Other comprehensive income 58 437 1) (10) 486 486
Total comprehensive income 1,550
Other equity transactions (2) (0) (2) 0 (2)
At 31 March 2017 1,156 6,606 33,693 (4,827) (10) 36,618 28 36,647
1) Currency translation adjustments year to date includes USD 294 million directly associated with the sale of interest in Kai Kos Dehseh (KKD) oil sands
projects.

Statoil 1st quarter 2017 12
Condensed interim financial statement and notes
CONSOLIDATED STATEMENT OF CASH FLOWS
Quarters Full year(unaudited, in USD million) Q1 2017 Q4 2016 Q1 2016 2016
Income before tax 4,044 (2,735) 1,685 (178)
Depreciation, amortisation and net impairment losses 1,943 4,261 2,039 11,550
Exploration expenditures written off 38 1,067 142 1,800
(Gains) losses on foreign currency transactions and balances (78) 529 (614) (137)
(Gains) losses on sales of assets and businesses 383 (29) (5) (110)
(Increase) decrease in other items related to operating activities (21) (203) 712 1,076
(Increase) decrease in net derivative financial instruments (1) 2,350 (526) 1,307
Interest received 70 60 68 280
Interest paid (134) (151) (115) (548)
Cash flows provided by operating activities before taxes paid and working capital items 6,243 5,149 3,386 15,040
Taxes paid (608) (1,349) (743) (4,386)
(Increase) decrease in working capital 334 (1,774) (438) (1,620)
Cash flows provided by operating activities 5,970 2,027 2,205 9,034
Capital expenditures and investments1) (2,377) (3,819) (2,821) (12,191)
(Increase) decrease in financial investments (1,846) 557 451 877
(Increase) decrease in other items interest bearing 1 83 23 107
Proceeds from sale of assets and businesses 303 244 10 761
Cash flows used in investing activities (3,919) (2,935) (2,337) (10,446)
New finance debt 0 1,323 0 1,322
Repayment of finance debt (5) (893) (3) (1,072)
Dividend paid (0) (371) (697) (1,876)
Net current finance debt and other (34) (1,723) 452 (333)
Cash flows provided by (used in) financing activities (40) (1,664) (248) (1,959)
Net increase (decrease) in cash and cash equivalents 2,011 (2,572) (379) (3,371)
Effect of exchange rate changes on cash and cash equivalents 28 (352) 296 (152)
Cash and cash equivalents at the beginning of the period (net of overdraft) 5,090 8,014 8,613 8,613
Cash and cash equivalents at the end of the period (net of overdraft)2) 7,128 5,090 8,530 5,090
1) (Increase) decrease in items under operating activities include currency effects. 2) At 31 March 2017, net overdrafts were USD 7 million. At 31 December 2016, net overdrafts were zero and at 31 March 2016 cash and
cash equivalents included a net overdraft of USD 10 million.

Statoil 1st quarter 2017 13
Condensed interim financial statement and notes
Notes to the Condensed interim financial statements
1 Organisation and basis of preparation General information and organisation Statoil ASA, originally Den Norske Stats Oljeselskap AS, was founded in 1972 and is incorporated and domiciled in Norway. The address of its registered office is Forusbeen 50, N-4035 Stavanger, Norway.
The Statoil group’s (Statoil) business consists principally of the exploration, production, transportation, refining and marketing of petroleum and petroleum-derived products. Statoil ASA is listed on the Oslo Børs (Norway) and the New York Stock Exchange (USA).
All Statoil's oil and gas activities and net assets on the Norwegian continental shelf are owned by Statoil Petroleum AS, a 100% owned operating subsidiary of Statoil ASA. Statoil Petroleum AS is co-obligor or guarantor of certain debt obligations of Statoil ASA.
Statoil's Condensed interim financial statements for the first quarter of 2017 were authorised for issue by the board of directors on 3 May 2017.
Basis of preparation These Condensed interim financial statements are prepared in accordance with International Accounting Standard 34 Interim Financial Reporting as issued by the International Accounting Standards Board (IASB) and as adopted by the European Union (EU). The Condensed interim financial statements do not include all of the information and disclosures required by International Financial Reporting Standards (IFRS) for a complete set of financial statements, and these Condensed interim financial statements should be read in conjunction with the Consolidated annual financial statements. IFRS as adopted by the EU differ in certain respects from IFRS as issued by the IASB, but the differences do not impact Statoil's financial statements for the periods presented. A description of the significant accounting policies applied in preparing these Condensed interim financial statements is included in Statoil`s Consolidated annual financial statements for 2016.
With effect from 1 January 2017, Statoil presents net interest costs related to its defined benefit pension plans within Net financial items. These expenses were previously included in the Consolidated statement of income as part of pension cost within net operating income. The policy change better aligns the classification of the interest costs with their nature, as the benefit plan is closed to new members and now increasingly represents a financial exposure to Statoil. The change in presentation also impacts the gain or loss from changes in the fair value of Statoil’s notional contribution pension plans. The impact on the net operating income at implementation and for comparative periods presented in these Condensed interim financial statements is immaterial, and prior periods’ figures have consequently not been restated.
There have been no other changes to significant accounting policies in the first quarter of 2017 compared to the Consolidated annual financial statements for 2016.
The Condensed interim financial statements reflect all adjustments which are, in the opinion of management, necessary for a fair statement of the financial position, results of operations and cash flows for the dates and interim periods presented. Interim period results are not necessarily indicative of results of operations or cash flows for an annual period. The subtotals and totals in some of the tables may not equal the sum of the amounts shown due to rounding.
The Condensed interim financial statements are unaudited.
Use of estimates The preparation of financial statements in conformity with IFRS requires management to make judgments, estimates and assumptions that affect the application of policies and reported amounts of assets and liabilities, income and expenses. The estimates and associated assumptions are based on historical experience and various other factors that are believed to be reasonable under the circumstances, the results of which form the basis for making the judgments about carrying values of assets and liabilities that are not readily apparent from other sources. Actual results may differ from these estimates. The estimates and underlying assumptions are reviewed on an on-going basis, considering current and expected future market conditions. A change in an accounting estimate is recognised in the period in which the estimate is revised if the revision affects only that period, or in the period of the revision and future periods if the revision affects both current and future periods.

Statoil 1st quarter 2017 14
Condensed interim financial statement and notes
2 Segments Statoil’s operations are managed through the following operating segments: Development and Production Norway (DPN), Development and Production USA (DPUSA), Development and Production International (DPI), Marketing, Midstream and Processing (MMP), New Energy Solutions (NES) and Other.
Statoil reports its business through reporting segments which correspond to the operating segments, except for the operating segments DPUSA and DPI which have been aggregated into one reporting segment, Development and Production International. This aggregation has its basis in similar economic characteristics, the nature of products, services and production processes, the type and class of customers, the methods of distribution and regulatory environment. The operating segment NES is reported in the reporting segment Other due to its immateriality.
The eliminations section includes the elimination of inter-segment sales and related unrealised profits, mainly from the sale of crude oil and products. Inter-segment revenues are based upon estimated market prices.
Segment data for the first quarter of 2017 and 2016 is presented below. The reported measure of segment profit is net operating income. Deferred tax assets, pension assets and non-current financial assets are not allocated to the segments. The line item additions to PP&E, intangibles and equity accounted investments exclude movements related to changes in asset retirement obligations.
First quarter 2017 Development and Production
Norway
Development and Production
International
Marketing, Midstream and
Processing Other Eliminations Total (in USD million)
Revenues third party and other income 65 344 15,047 15 0 15,471
Revenues inter-segment 4,592 1,814 3 0 (6,410) 0
Net income from equity accounted investments 38 9 11 (1) 0 57
Total revenues and other income 4,694 2,167 15,062 15 (6,410) 15,528
Purchases [net of inventory variation] 1 (4) (12,747) (0) 6,284 (6,466)
Operating and SG&A expenses (726) (982) (963) (67) 96 (2,642)
Depreciation, amortisation and net impairment losses (658) (1,184) (73) (27) 0 (1,943)
Exploration expenses (70) (157) 0 0 0 (227)
Net operating income 3,241 (161) 1,279 (79) (30) 4,250
Additions to PP&E, intangibles and equity accounted investments 1,306 900 68 125 0 2,399
Balance sheet information
Equity accounted investments 1,171 367 128 678 0 2,344
Non-current segment assets 28,597 35,910 4,460 377 0 69,345
Non-current assets, not allocated to segments 8,398
Total non-current assets 80,087

Statoil 1st quarter 2017 15
Condensed interim financial statement and notes
First quarter 2016 Development and Production
Norway
Development and Production
International
Marketing, Midstream and
Processing Other Eliminations Total (in USD million)
Revenues third party and other income 22 137 9,909 27 0 10,095
Revenues inter-segment 3,317 1,000 12 (2) (4,327) 0
Net income from equity accounted investments 0 2 13 5 0 20
Total revenues and other income 3,338 1,139 9,934 31 (4,327) 10,115
Purchases [net of inventory variation] 0 (3) (8,485) (0) 4,318 (4,170)
Operating and SG&A expenses (717) (626) (1,073) (103) 24 (2,495)
Depreciation, amortisation and net impairment losses (1,228) (702) (73) (37) 0 (2,039)
Exploration expenses (69) (282) 0 0 0 (351)
Net operating income 1,325 (473) 303 (108) 14 1,060
Additions to PP&E, intangibles and equity accounted investments 1,234 1,016 118 115 0 2,482
Balance sheet information
Equity accounted investments 6 437 123 269 0 835
Non-current segment assets 29,631 39,264 4,414 761 0 74,070
Non-current assets, not allocated to segments 10,197
Total non-current assets 85,102
In the first quarter of 2017, Statoil recognised an impairment reversal of USD 439 million in the DPN segment related to reduced cost estimates of a Norwegian continental shelf development asset. In addition a loss of USD 351 million was recognised on the divestment of the Kai Kos Dehseh (KKD) oil sands project in the DPI segment. In the first quarter of 2016, Statoil recognised net impairment reversals of USD 308 million, consisting of impairment reversals of USD 633 million related to unconventional onshore assets in North America and two conventional assets in the DPI segments, partially offset by impairment charges of USD 325 million, related to an unconventional onshore asset in North America. See note 6 Property, plant and equipment and intangible assets for further information on impairments. See note 3 Acquisitions and disposals for information on transactions impacting the DPI segment.

Statoil 1st quarter 2017 16
Condensed interim financial statement and notes
Revenues by geographic areas When attributing the line item revenues third party and other income to the country of the legal entity executing the sale for the first quarter of 2017, Norway constitutes 76% and the US constitutes 15%. Non-current assets by country
At 31 March At 31 December At 31 March (in USD million) 2017 2016 2016
Norway 32,285 31,484 33,396
US 18,293 18,223 20,594
Brazil 5,251 5,308 3,483
Angola 3,553 3,884 5,203
UK 3,352 3,108 3,227
Canada 1,524 1,494 2,495
Algeria 1,271 1,344 1,454
Azerbaijan 1,312 1,326 1,398
Other countries 4,847 4,873 3,655
Total non-current assets1) 71,689 71,043 74,905 1) Excluding deferred tax assets, pension assets, non-current financial assets and assets classified as held for sale. 3 Acquisitions and disposals Sale of interest in Kai Kos Dehseh In the first quarter of 2017 Statoil closed an agreement, entered in December 2016, with Athabasca Oil Corporation to divest its 100% interest in Kai Kos Dehseh (KKD) oil sands. The total consideration consisted of cash consideration of CAD 431 million (USD 328 million), 100 million common shares in Athabasca Oil Corporation (which represent 19,7% of the outstanding shares as at 31 March 2017, and will be accounted for as an available for sale financial investment) and a series of contingent payments. The shares and the contingent consideration were measured at a combined fair value of CAD 185 million (USD 142 million) on the closing date. A loss on the transaction of USD 351 million has been recognised as operating expense. This loss relates to a reduced value of the shares in Athabasca compared to 31 December 2016 and a reclassification of accumulated foreign exchange losses, previously recognised in other comprehensive income. The transaction was closed on 31 January 2017, and is reflected in the Development and Production International (DPI) segment.
4 Financial items
Quarters Full year(in USD million) Q1 2017 Q4 2016 Q1 2016 2016
Net foreign exchange gains (losses) 86 10 8 (120)
Interest income and other financial items 182 107 48 436
Derivative financial instruments gains (losses) (117) (672) 824 470
Interest and other finance expenses (357) (283) (255) (1,043)
Net financial items (206) (838) 625 (258)
Statoil has a US Commercial paper program available with a limit of USD 5 billion of which USD 929 million has been utilised as of 31 March 2017.

Statoil 1st quarter 2017 17
Condensed interim financial statement and notes
5 Income tax
Quarters Full year
(in USD million) Q1 2017 Q4 2016 Q1 2016 2016
Income before tax 4,044 (2,735) 1,685 (178)
Income tax (2,980) (50) (1,074) (2,724)
Equivalent to a tax rate of 73.7% (1.8%) 63.7% >(100%)
The tax rate for the first quarter of 2017 was primarily influenced by high tax rate on income from the Norwegian continental shelf caused by proportionally lower impact of uplift deduction and loss related to the sale of interest in the Kai Kos Dehseh (KKD) oil sand project as described in note 3 Acquisitions and disposals without reported tax benefit.
The tax rate for the first quarter of 2016 was primarily influenced by low tax rate on income from the Norwegian continental shelf caused by proportionally greater impact of uplift deduction and currency effects in entities that are taxable in other currencies than the functional currency. This was partially offset by write-off of deferred tax assets within Development and Production International segment, due to uncertainty related to future taxable income.
6 Property, plant and equipment and intangible assets
(in USD million) Property, plant and
equipmentIntangible
assets
Balance at 31 December 2016 59,556 9,243
Additions 2,192 153
Transfers 125 (125)
Disposals (37) (2)
Expensed exploration expenditures and impairment losses - (38)
Depreciation, amortisation and net impairment losses (1,940) (3)
Effect of foreign currency translation adjustments 213 8
Balance at 31 March 2017 60,109 9,235
Impairments/reversal of impairments For information on impairment losses and reversals for the first quarter of 2017 per reporting segment see note 2 Segments. First quarter 2017 Property, plant
and equipment Intangible
assets Total(in USD million)
Producing and development assets (439) 0 (439)
Acquisition costs related to oil and gas prospects - 26 26
Total net impairment losses (reversals) recognised (439) 26 (413)
The impairment charges have been recognised in the Consolidated statement of income as depreciation, amortisation and net impairment losses and exploration expenses based on the impaired assets’ nature of property, plant and equipment and intangible assets, respectively. The recoverable amount of assets tested for impairment was based on Value in Use (VIU) estimates on the basis of internal forecasts on costs, production profiles and commodity prices.

Statoil 1st quarter 2017 18
Condensed interim financial statement and notes
7 Dividends As part of Statoil's scrip dividend programme, eligible shareholders and holders of American Depositary Receipts (ADR) can elect to receive their dividend in the form of new ordinary Statoil shares and ADR holders in the form of American Depositary Shares (ADS). The subscription price for the dividend shares will have a discount compared to the volume-weighted average price on Oslo Børs (OSE) of the last two trading days of the subscription period for each quarter. For the fourth quarter of 2015 and for the first, second and third quarter of 2016 the discount has been set at 5%. The two-year scrip dividend programme was approved by Statoil's general assembly in May 2016. For the third quarter of 2016, a dividend of USD 0.2201 has been approved, paid on 7 April 2017, and the shares were traded ex-dividend on 22 February 2017 on Oslo Børs and 21 February for ADR shareholders on New York Stock Exchange. Dividend approved, but not settled at quarter end, is presented as dividends payable in the Consolidated balance sheet, regardless of whether the dividend is expected to be paid in cash or by issuance of new shares. The line item dividend paid in the Consolidated statement of cash flows includes only dividend paid in cash during the period. On 3 May the board of directors resolved to declare a dividend for the first quarter of 2017 of USD 0.2201 per share. The Statoil share will trade ex-dividend on Oslo Børs 9 August and 8 August for ADR shareholders on New York Stock Exchange. Record date will be 10 August and payment date will be around 22 September 2017. With reference to the scrip dividend programme approved by the annual general meeting (AGM) 11 May 2016, shareholders will, subject to AGM approval on 11 May 2017, get the option to receive the dividend in newly issued shares at a discount. For the dividend issue for first quarter 2017, the board has set the discount to 5%.
Dividends
Full year Q1 2017 Q1 2016 2016
Dividends paid in cash (in USD million) 0 697 1,876
USD per share or ADS 0 0.2201 0.8804
NOK per share 0 1.8932 7.3464
Scrip dividends (in USD million) 0 0 904
Number of shares issued (in million) 0 0.0 56.4
Total dividends 0 697 2,780
8 Provisions, commitments, contingent liabilities and contingent assets In April 2017, a federal judge granted an injunction request to suspend the assignment to Statoil of Petróleo Brasileiro S.A.’s (“Petrobras”) 66% operated interest in the Brazilian offshore license BM-S-8, in a class action suit filed by the Union of Workers of Oil Tankers of Sergipe (Sindipetro) against Petrobras, Statoil, and ANP - the Brazilian Regulatory Agency (“the defendants”). The suit seeks the annulment of Petrobras’ sale of the interest in BM-S-8 to Statoil, which was closed in November 2016. On 2 May 2017, the injunction was suspended by the President of the Federal Regional Court. The suspension of the injunction is appealable. The main issue will be examined in the Brazilian federal court system in due course. Statoil believes the defendants’ position to be strong in upholding the validity of Statoil’s ownership. At the end of first quarter 2017 the acquired interest remains in Statoil’s balance sheet as intangible assets of the DPI segment. For further information about Statoil’s acquisition, reference is made to the 2016 Consolidated annual financial statements note 4 Acquisitions and disposals.
During discussions in March 2017, Statoil and the Angolan Ministry of Finance made progress towards a potential resolution of the dispute regarding additional profit oil and taxes assessed related to Statoil's participation in Block 4, Block 15, Block 17 and Block 31 offshore Angola. Statoil continues to use the same basis for the provision as at year end 2016. As the discussions are ongoing further details cannot be provided.
During the normal course of its business Statoil is involved in legal and other proceedings, and several claims are unresolved and currently outstanding. The ultimate liability or asset, respectively, in respect of such litigation and claims cannot be determined now. Statoil has provided in its condensed interim financial statements for probable liabilities related to litigation and claims based on the company's best judgement. Statoil does not expect that its financial position, results of operations or cash flows will be materially affected by the resolution of these legal proceedings.

Statoil 1st quarter 2017 19
Supplementary
Supplementary disclosures
OPERATIONAL DATA
Quarters ChangeOperational data Q1 2017 Q4 2016 Q1 2016 Q1 on Q1
Prices
Average Brent oil price (USD/bbl) 53.7 49.3 33.9 58%
DPN average liquids price (USD/bbl) 50.2 45.1 30.7 64%
DPI average liquids price (USD/bbl) 46.9 42.1 25.6 83%
Group average liquids price (USD/bbl) 48.9 43.8 28.7 70%
Group average liquids price (NOK/bbl) [1] 412.6 366.7 248.0 66%
Transfer price natural gas (USD/mmbtu) [9] 4.22 3.83 4.00 5%
Average invoiced gas prices - Europe (USD/mmbtu) [8] 5.46 5.30 5.45 0%
Average invoiced gas prices - North America (USD/mmbtu) [8] 3.31 2.53 2.29 45%
Refining reference margin (USD/bbl) [2] 5.4 5.0 4.3 25%
Entitlement production (mboe per day)
DPN entitlement liquids production 616 632 602 2%
DPI entitlement liquids production 439 416 434 1%
Group entitlement liquids production 1,054 1,048 1,036 2%
DPN entitlement gas production 777 742 719 8%
DPI entitlement gas production 176 143 155 14%
Group entitlement gas production 953 886 873 9%
Total entitlement liquids and gas production [3] 2,007 1,934 1,909 5%
Equity production (mboe per day)
DPN equity liquids production 616 632 602 2%
DPI equity liquids production 556 530 552 1%
Group equity liquids production 1,172 1,162 1,154 2%
DPN equity gas production 777 742 719 8%
DPI equity gas production 197 190 182 8%
Group equity gas production 974 933 901 8%
Total equity liquids and gas production [4] 2,146 2,095 2,054 4%
MMP sales volumes
Crude oil sales volumes (mmbl) 196.0 198.0 205.0 (4%)
Natural gas sales Statoil entitlement (bcm) 13.1 12.5 12.2 8%
Natural gas sales third-party volumes (bcm) 2.4 2.4 2.7 (11%)
EXCHANGE RATES
Quarters ChangeExchange rates Q1 2017 Q4 2016 Q1 2016 Q1 on Q1
NOK/USD average daily exchange rate 0.1184 0.1193 0.1156 2%
NOK/USD period-end exchange rate 0.1166 0.1160 0.1209 (4%)
USD/NOK average daily exchange rate 8.4426 8.3798 8.6482 (2%)
USD/NOK period-end exchange rate 8.5757 8.6200 8.2692 4%
EUR/USD average daily exchange rate 1.0647 1.0783 1.1015 (3%)
EUR/USD period-end exchange rate 1.0691 1.0541 1.1385 (6%)

Statoil 1st quarter 2017 20
Supplementary
EXPLORATION EXPENSES
Adjusted exploration expenses Quarters Change(in USD million) Q1 2017 Q4 2016 Q1 2016 Q1 on Q1
DPN exploration expenditures (activity) 121 158 105 16%
DPI exploration expenditures (activity) 148 265 239 (38%)
Group exploration expenditures (activity) 269 423 344 (22%)
Expensed, previously capitalised exploration expenditures 13 274 71 (82%)
Capitalised share of current period's exploration activity (81) (55) (135) (40%)
Impairment (reversal of impairment) 26 794 71 (63%)
Exploration expenses IFRS 227 1,435 351 (35%)
Adjustments (25) (828) (71) -
Adjusted exploration expenses 202 607 280 (28%)
NET ADJUSTED FINANCIAL ITEMS 2017
Interest
income and other
financial items
Net foreign exchange
gains (losses)
Gains (losses) derivative
financial instruments
Interest and other finance
expenses Net before
tax Estimated tax
effect Net after tax
Net adjusted financial items in the first quarter of 2017
(in USD million)
Financial items according to IFRS 182 86 (117) (357) (206) 71 (135)
Foreign exchange (FX) impacts (incl. derivatives) 9 (86) - - (78) - -
Interest rate (IR) derivatives - - 117 - 117 - -
Adjusted financial items excluding FX and IR derivatives 190 0 0 (357) (167) 80 (87)
NET ADJUSTED FINANCIAL ITEMS 2016
Interest
income and other
financial items
Net foreign exchange
gains (losses)
Gains (losses) derivative
financial instruments
Interest and other finance
expenses Net before
tax Estimated tax
effect Net after tax
Net adjusted financial items in the first quarter of 2016
(in USD million)
Adjusted financial items excluding FX and IR derivatives 20 0 0 (255) (235) (19) (254)

Statoil 1st quarter 2017 21
Supplementary
ADJUSTED EARNINGS AFTER TAX BY SEGMENT [5]
First quarter
2017 2016
(in USD million) Adjusted earnings
Tax on adjusted earnings
Adjusted earnings after
taxAdjusted earnings
Tax on adjusted earnings
Adjusted earnings after
tax
DPN 2,621 (1,911) 679 1,301 (838) 463
DPI 272 (139) 155 (800) 152 (648)
MMP 500 (185) 321 431 (76) 355
Other (80) 36 (41) (76) 27 (49)
Group 3,313 (2,199) 1,114 857 (735) 122
Effective tax rates on adjusted earnings 66.4% 85.8%
HEALTH, SAFETY AND THE ENVIRONMENT
Twelve months average per First quarter First quarterQ1 2017 Q1 2016 2017 2016
Injury/incident frequency
2.7 2.6 Total recordable injury frequency (TRIF) 2.4 2.7
0.8 0.6 Serious incident frequency (SIF) 0.6 0.7
Oil spills
144 144 Accidental oil spills (number of) 25 27
61 32 Accidental oil spills (cubic metres) 4 4
First quarter Full year 2017 2016
Climate Upstream CO2 intensity (kg CO2/boe) 1) 8 10 1) For Statoil operated assets in DPN and DPI, the total amount of direct CO2 released to the atmosphere (kg), divided by total hydrocarbon
production (boe).

Statoil 1st quarter 2017 22
Supplementary
USE AND RECONCILIATION OF NON-GAAP FINANCIAL MEASURES Non-GAAP financial measures are defined as numerical measures that either exclude or include amounts that are not excluded or included in the comparable measures calculated and presented in accordance with GAAP (i.e. IFRS).
For more information on our use of non-GAAP financial measures, see report section - Financial analysis and review - Non-GAAP measures in Statoil's 2016 Annual Report and Form 20-F.
The following financial measures may be considered non-GAAP financial measures: Adjusted earnings (including adjusted revenues and other income, adjusted purchases, adjusted operating expenses and selling, general and
administrative expenses, adjusted depreciation, amortisation and net impairment losses and adjusted exploration expenses) – for more information see below
Adjusted earnings after tax – for more information see below Return on average capital employed after tax (ROACE) – for more information see section 5.2 Return on average capital employed (ROACE) in
Statoil`s 2016 Annual Report and Form 20-F Net interest-bearing debt adjusted – for more information see section 5.2 Net debt to capital employed ratio and note 18 Finance debt in
Statoil`s 2016 Annual Report and Form 20-F Net debt to capital employed ratio – for more information see section 5.2 Net debt to capital employed ratio in Statoil`s 2016 Annual Report
and Form 20-F Net debt to capital employed ratio adjusted – for more information see section 5.2 Net debt to capital employed ratio in Statoil`s 2016 Annual
Report and Form 20-F Organic capital expenditures – for more information see section 2.9 Liquidity and capital resources and section 5.6 Terms and definitions in
Statoil`s 2016 Annual Report and Form 20-F Free cash flow includes the following line items in the Consolidated statement of cash flows: Cash flows provided by operating activities before
taxes paid and working capital items, taxes paid, capital expenditures and investments, (increase) decrease in other non-current items, proceeds from sale of assets and businesses and dividend paid
Adjusted earnings are based on net operating income and adjusts for certain items affecting the income for the period in order to separate out effects that management considers may not be well correlated to Statoil's underlying operational performance in the individual reporting period. Management considers adjusted earnings to be a supplemental measure to Statoil's IFRS measures that provides an indication of Statoil's underlying operational performance in the period and facilitates a better understanding of operational trends between the periods. Adjusted earnings adjusts for the following items: Certain gas contracts are, due to pricing or delivery conditions, deemed to contain embedded derivatives, required to be carried at fair value.
Certain transactions related to historical divestments include contingent consideration, are carried at fair value. The accounting impacts of changes in fair value of the aforementioned are excluded from adjusted earnings. In addition, adjustments are also made for changes in the unrealised fair value of derivatives related to some natural gas trading contracts. Due to the nature of these gas sales contracts, these are classified as financial derivatives to be measured at fair value at the balance sheet date. Unrealised gains and losses on these contracts reflect the value of the difference between current market gas prices and the actual prices to be realised under the gas sales contracts. Only realised gains and losses on these contracts are reflected in adjusted earnings. This presentation best reflects the underlying performance of the business as it replaces the effect of temporary timing differences associated with the re-measurements of the derivatives to fair value at the balance sheet date with actual realised gains and losses for the period
Periodisation of inventory hedging effect: Commercial storage is hedged in the paper market. Commercial storage is accounted for by using the lower of cost and market price. If market prices increase above cost price, there will be a loss in the IFRS income statement since the derivatives always reflect changes in the market price. An adjustment is made to reflect the unrealised market value of the commercial storage. As a result, loss on derivatives is matched by a similar adjustment for the exposure being managed. If market prices decrease below cost price, the write-down and the derivative effect in the IFRS income statement will offset each other and no adjustment is made
Over/underlift is accounted for using the sales method and therefore revenues are reflected in the period the product is sold rather than in the period it is produced. The over/underlift position depends on a number of factors related to our lifting programme and the way it corresponds to our entitlement share of production. The effect on income for the period is therefore adjusted, to show estimated revenues and associated costs based upon the production for the period which management believes reflects operational performance and increase comparability with peers
Statoil holds operational storage which is not hedged in the paper market due to inventory strategies. Cost of goods sold is measured based on the FIFO (first-in, first-out) method, and includes realised gains or losses that arise due to changes in market prices. These gains or losses will fluctuate from one period to another and are not considered part of the underlying operations for the period
Impairment and reversal of impairment are excluded from adjusted earnings since they affect the economics of an asset for the lifetime of that asset; not only the period in which it is impaired or the impairment is reversed. Impairment and reversal of impairment can impact both the exploration expenses and the depreciation, amortisation and impairment line items
Gain or loss from sales is eliminated from the measure since the gain or loss does not give an indication of future performance or periodic performance; such a gain or loss is related to the cumulative value creation from the time the asset is acquired until it is sold

Statoil 1st quarter 2017 23
Supplementary
Internal unrealised profit on inventories: Volumes derived from equity oil inventory will vary depending on several factors and inventory strategies, i.e. level of crude oil in inventory, equity oil used in the refining process and level of in-transit cargoes. Internal profit related to volumes sold between entities in the group, and still in inventory at period end, is eliminated according to IFRS (write down to production cost). The proportion of realised versus unrealised gain will fluctuate from one period to another due to inventory strategies and accordingly impact net operating income. This impact is not assessed to be a part of the underlying operational performance, and elimination of internal profit related to equity volumes is excluded in adjusted earnings
Other items of income and expense are adjusted when the impacts on income in the period are not reflective of Statoil's underlying operational performance in the reporting period. Such items may be unusual or infrequent transactions but they may also include transactions that are significant which would not necessarily qualify as either unusual or infrequent. Other items can include transactions such as provisions related to reorganisation, early retirement, etc
The measure adjusted earnings after tax excludes net financial items and the associated tax effects on net financial items. It is based on adjusted earnings less the tax effects on all elements included in adjusted earnings (or calculated tax on operating income and on each of the adjusting items using an estimated marginal tax rate). In addition, tax effect related to tax exposure items not related to the individual reporting period is excluded from adjusted earnings after tax. Management considers adjusted earnings after tax, which reflects a normalised tax charge associated with its operational performance excluding the impact of financing, to be a supplemental measure to Statoil's net income. Certain net USD denominated financial positions are held by group companies that have a USD functional currency that is different from the currency in which the taxable income is measured. As currency exchange rates change between periods, the basis for measuring net financial items for IFRS will change disproportionally with taxable income which includes exchange gains and losses from translating the net USD denominated financial positions into the currency of the applicable tax return. Therefore, the effective tax rate may be significantly higher or lower than the statutory tax rate for any given period.
Management considers that adjusted earnings after tax provides a better indication of the taxes associated with underlying operational performance in the period (excluding financing), and therefore better facilitates a comparison between periods. However, the adjusted taxes included in adjusted earnings after tax should not be considered indicative of the amount of current or total tax expense (or taxes payable) for the period.
Adjusted earnings and adjusted earnings after tax should be considered additional measures rather than substitutes for net operating income and net income, which are the most directly comparable IFRS measures. There are material limitations associated with the use of adjusted earnings and adjusted earnings after tax compared with the IFRS measures since they do not include all the items of revenues/gains or expenses/losses of Statoil which are needed to evaluate its profitability on an overall basis. Adjusted earnings and adjusted earnings after tax are only intended to be indicative of the underlying developments in trends of our on-going operations for the production, manufacturing and marketing of our products and exclude pre-and post-tax impacts of net financial items. We reflect such underlying development in our operations by eliminating the effects of certain items that may not be directly associated with the period's operations or financing. However, for that reason, adjusted earnings and adjusted earnings after tax are not complete measures of profitability. The measures should therefore not be used in isolation.
Adjusted earnings equal the sum of net operating income less all applicable adjustments. Adjusted earnings after tax equals the sum of net operating income less income tax in business areas and adjustments to operating income taking the applicable marginal tax into consideration. See the tables in the following section for details.

Statoil 1st quarter 2017 24
Supplementary
Calculation of capital employed and net debt to capital employed ratio At 31 March At 31 December At 31 March (in USD million) 2017 2016 2016
Shareholders' equity 36,618 35,072 42,162
Non-controlling interests 28 27 36
Total equity A 36,647 35,099 42,198
Current finance debt 4,500 3,674 2,796
Non-current finance debt 27,289 27,999 30,210
Gross interest-bearing debt B 31,789 31,673 33,006
Cash and cash equivalents 7,135 5,090 8,540
Current financial investments 10,118 8,211 9,292
Cash and cash equivalents and financial investment C 17,253 13,301 17,831
Net interest-bearing debt before adjustments [10] B1 = B-C 14,536 18,372 15,175
Other interest-bearing elements 1) 1,141 1,216 1,191
Marketing instruction adjustment 2) (176) (199) (211)
Net interest-bearing debt adjusted [5] B2 15,501 19,389 16,155
Normalisation for cash-build up before tax payment (50% of Tax Payment) 3) 232 - 345
Net interest-bearing debt adjusted [5] B3 15,733 19,389 16,500
Calculation of capital employed [5]:
Capital employed before adjustments to net interest-bearing debt A+B1 51,183 53,471 57,373
Capital employed before normalisation for cash build up for tax payment A+B2 52,148 54,488 58,353
Capital employed adjusted A+B3 52,380 54,488 58,698
Calculated net debt to capital employed [5]:
Net debt to capital employed before adjustments (B1)/(A+B1) 28.4% 34.4% 26.5%
Net debt to capital employed before normalisation for tax payment (B2)/(A+B2) 29.7% 35.6% 27.7%
Net debt to capital employed adjusted (B3)/(A+B3) 30.0% 35.6% 28.1%
1) Cash and cash equivalents adjustments regarding collateral deposits classified as cash and cash equivalents in the Consolidated balance sheet but considered as non-cash in the non-GAAP calculations as well as financial investments in Statoil Forsikring AS classified as current financial investments.
2) Adjustment to gross interest-bearing debt due to the Norwegian state`s financial interest (SDFI) part of the financial lease in the Snøhvit vessels which are included in Statoil’s Consolidated balance sheet.
3) Normalisation for cash-build-up before tax payment adjusts to exclude 50% of the cash-build-up related to tax payments due in the beginning of February, April, August, October and December, which were USD 464 million and USD 690 million as of March 2017 and 2016, respectively.

Statoil 1st quarter 2017 25
Supplementary
Reconciliation of net operating income to adjusted earnings The table specifies the adjustments made to each of the profit and loss line item included in the net operating income subtotal.
Items impacting net operating income in the first quarter of 2017 Statoil group
Development
and Production Norway
Development
and Production International
Marketing,
Midstream and Processing
Other (in USD million)
Net operating income 4,250 3,241 (161) 1,279 (109)
Total revenues and other income (957) (224) 55 (788) (1)
Changes in fair value of derivatives (562) (44) - (518) -Periodisation of inventory hedging effect (270) - - (270) -Over-/underlift (125) (180) 55 - -Gain/loss on sale of assets (1) - - - (1)
Purchases [net of inventory variation] 65 - - 35 30
Operational storage effects 35 - - 35 -Eliminations 30 - - - 30
Operating and administrative expenses 369 43 352 (27) -Over-/underlift 3 43 (40) - -Other adjustments 9 - 9 - -
Gain/loss on sale of assets 384 - 384 - -Provisions (27) - - (27) -
Depreciation, amortisation and impairment (439) (439) - - -Reversal of Impairment (439) (439) - - -
Exploration expenses 25 - 25 - -Impairment 25 - 25 - -
Sum of adjustments to net operating income (938) (620) 433 (779) 29
Adjusted earnings [5] 3,313 2,621 272 500 (80)
Tax on adjusted earnings (2,199) (1,911) (139) (185) 36
Adjusted earnings after tax [5] 1,114 679 155 321 (41)

Statoil 1st quarter 2017 26
Supplementary
Items impacting net operating income in the first quarter of 2016 Statoil group
Development and Production
Norway
Development and Production
International
Marketing, Midstream and
Processing Other(in USD million)
Net operating income 1,060 1,325 (473) 303 (95)
Total revenues and other income 64 (113) 59 118 -
Changes in fair value of derivatives (36) (6) - (30) -
Periodisation of inventory hedging effect 149 - - 149 -
Over-/underlift (48) (107) 59 - -
Purchases [net of inventory variation] (53) - - (39) (14)
Operational storage effects (39) - - (39) -
Eliminations (14) - - - (14)
Operating and administrative expenses 94 89 (72) 50 27
Over-/underlift 16 88 (72) - -
Other adjustments 19 1 - - 18
Provisions 59 - - 50 9
Depreciation, amortisation and impairment (379) - (385) - 6
Impairment 152 - 147 - 6
Reversal of Impairment (531) - (531) - -
Exploration expenses 71 - 71 - -
Impairment 173 - 173 - -
Reversal of Impairment (102) - (102) - -
Sum of adjustments to net operating income (203) (24) (327) 129 19
Adjusted earnings [5] 857 1,301 (800) 431 (76)
Tax on adjusted earnings (735) (838) 152 (76) 27
Adjusted earnings after tax [5] 122 463 (648) 355 (49)
Adjusted earnings Marketing, Midstream and Processing (MMP) break down
Adjusted earnings break down Quarters Change(in USD million) Q1 2017 Q4 2016 Q1 2016 Q1 on Q1
Natural Gas Europe 197 266 24 >100%
Natural Gas US 49 25 82 (40%)
Liquids 122 136 196 (38%)
Other 132 87 129 2%
Adjusted earnings MMP 500 514 431 16%
Statoil 1st quarter 2017 27
Supplementary
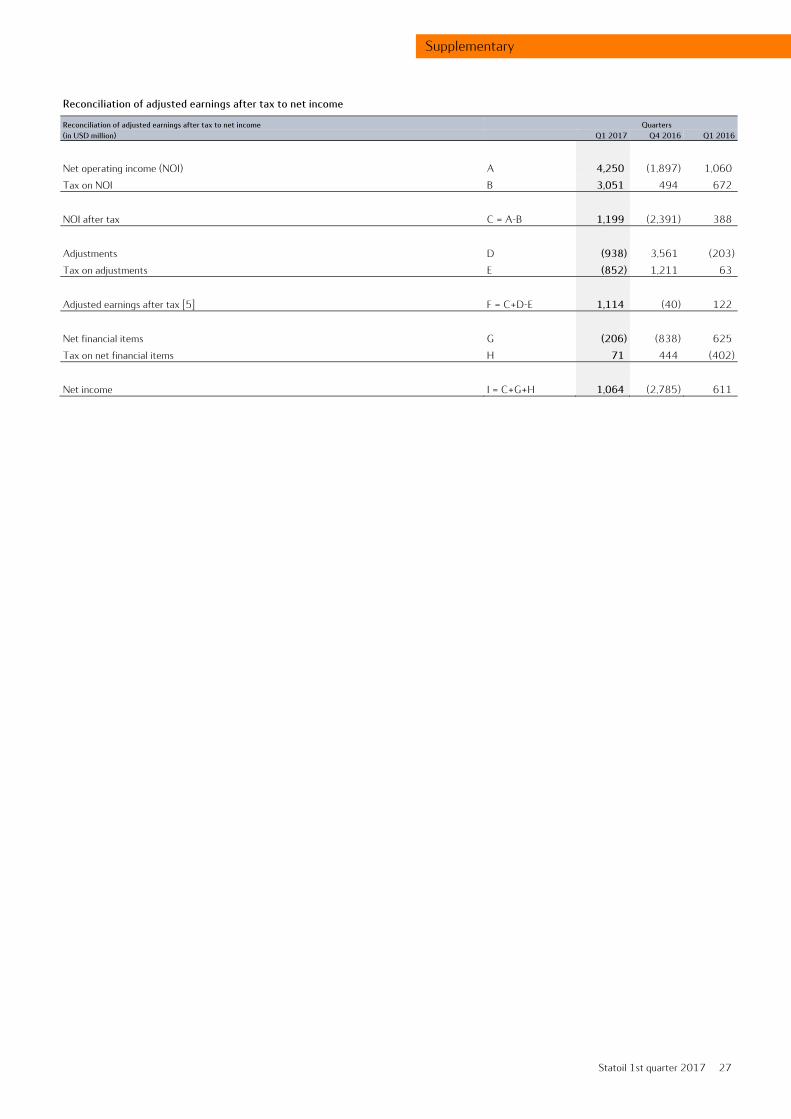
Reconciliation of adjusted earnings after tax to net income
Reconciliation of adjusted earnings after tax to net income Quarters (in USD million) Q1 2017 Q4 2016 Q1 2016
Net operating income (NOI) A 4,250 (1,897) 1,060
Tax on NOI B 3,051 494 672
NOI after tax C = A-B 1,199 (2,391) 388
Adjustments D (938) 3,561 (203)
Tax on adjustments E (852) 1,211 63
Adjusted earnings after tax [5] F = C+D-E 1,114 (40) 122
Net financial items G (206) (838) 625
Tax on net financial items H 71 444 (402)
Net income I = C+G+H 1,064 (2,785) 611

Statoil 1st quarter 2017 28
Supplementary
FORWARD-LOOKING STATEMENTS This report contains certain forward-looking statements that involve risks and uncertainties. In some cases, we use words such as "ambition", "continue", "could", "estimate", "expect", “believe”, "focus", "likely", "may", "outlook", "plan", "strategy", "will", "guidance" and similar expressions to identify forward-looking statements. All statements other than statements of historical fact, including, among others, statements regarding plans and expectations with respect to market outlook and future economic projections and assumptions; Statoil’s focus on capital discipline; expected annual organic production through 2017; projections and future impact of efficiency programmes including expected efficiency improvements, including expectations regarding costs savings from the improvement programme; capital expenditure and exploration guidance for 2017; production guidance; Statoil’s value over volume strategy; organic capital expenditure for 2017; Statoil’s intention to mature its portfolio; exploration and development activities, plans and expectations, including estimates regarding exploration activity levels; projected unit of production cost; equity production; planned maintenance and the effects thereof; impact of PSA effects; risks related to Statoil’s production guidance; accounting decisions and policy judgments and the impact thereof; expected dividend payments, the scrip dividend programme and the timing thereof; estimated provisions and liabilities; the projected impact or timing of administrative or governmental rules, standards, decisions, standards or laws, including with respect to and future impact of legal proceedings are forward-looking statements. You should not place undue reliance on these forward- looking statements. Our actual results could differ materially from those anticipated in the forward-looking statements for many reasons.
These forward-looking statements reflect current views about future events and are, by their nature, subject to significant risks and uncertainties because they relate to events and depend on circumstances that will occur in the future. There are a number of factors that could cause actual results and developments to differ materially from those expressed or implied by these forward-looking statements, including levels of industry product supply, demand and pricing; price and availability of alternative fuels; currency exchange rate and interest rate fluctuations; the political and economic policies of Norway and other oil-producing countries; EU developments; general economic conditions; political and social stability and economic growth in relevant areas of the world; global political events and actions, including war, political hostilities and terrorism; economic sanctions, security breaches; changes or uncertainty in or non-compliance with laws and governmental regulations; the timing of bringing new fields on stream; an inability to exploit growth or investment opportunities; material differences from reserves estimates; unsuccessful drilling; an inability to find and develop reserves; ineffectiveness of crisis management systems; adverse changes in tax regimes; the development and use of new technology; geological or technical difficulties; operational problems; operator error; inadequate insurance coverage; the lack of necessary transportation infrastructure when a field is in a remote location and other transportation problems; the actions of competitors; the actions of field partners; the actions of governments (including the Norwegian state as majority shareholder); counterparty defaults; natural disasters and adverse weather conditions, climate change, and other changes to business conditions; an inability to attract and retain personnel; relevant governmental approvals; industrial actions by workers and other factors discussed elsewhere in this report. Additional information, including information on factors that may affect Statoil's business, is contained in Statoil's Annual Report on Form 20-F for the year ended December 31, 2016, filed with the U.S. Securities and Exchange Commission (and in particular, section 2.10 Risk review – Risk factors thereof). Statoil’s Annual Report and Form 20-F is available at Statoil's website www.statoil.com.
Although we believe that the expectations reflected in the forward-looking statements are reasonable, we cannot assure you that our future results, level of activity, performance or achievements will meet these expectations. Moreover, neither we nor any other person assumes responsibility for the accuracy and completeness of the forward-looking statements. Unless we are required by law to update these statements, we will not necessarily update any of these statements after the date of this report, either to make them conform to actual results or changes in our expectations.

Statoil 1st quarter 2017 29
Supplementary
END NOTES
1. The Group's average liquids price is a volume-weighted average of the segment prices of crude oil, condensate and natural gas liquids (NGL).
2. The refining reference margin is a typical average gross margin of our two refineries, Mongstad and Kalundborg. The reference margin will
differ from the actual margin, due to variations in type of crude and other feedstock, throughput, product yields, freight cost, inventory, etc.
3. Liquids volumes include oil, condensate and NGL, exclusive of royalty oil.
4. Equity volumes represent produced volumes under a Production Sharing Agreement (PSA) that correspond to Statoil's ownership share in a
field. Entitlement volumes, on the other hand, represent Statoil's share of the volumes distributed to the partners in the field, which are subject
to deductions for, among other things, royalty and the host government's share of profit oil. Under the terms of a PSA, the amount of profit oil
deducted from equity volumes will normally increase with the cumulative return on investment to the partners and/or production from the
license. Consequently, the gap between entitlement and equity volumes will likely increase in times of high liquids prices. The distinction
between equity and entitlement is relevant to most PSA regimes, whereas it is not applicable in most concessionary regimes such as those in
Norway, the UK, the US, Canada and Brazil.
5. These are non-GAAP figures. See section Use and reconciliation of non-GAAP financial measures in the report for more details.
6. Transactions with the Norwegian State. The Norwegian State, represented by the Ministry of Petroleum and Energy (MPE), is the majority
shareholder of Statoil and it also holds major investments in other entities. This ownership structure means that Statoil participates in
transactions with many parties that are under a common ownership structure and therefore meet the definition of a related party. Statoil
purchases liquids and natural gas from the Norwegian State, represented by SDFI (the State's Direct Financial Interest). In addition, Statoil sell
the State's natural gas production in its own name, but for the Norwegian State's account and risk as well as related expenditures refunded by
the State. All transactions are considered priced on an arms-length basis.
7. The production guidance reflects our estimates of proved reserves calculated in accordance with US Securities and Exchange Commission
(SEC) guidelines and additional production from other reserves not included in proved reserves estimates.
8. The Group's average invoiced gas prices include volumes sold by the MMP segment.
9. The internal transfer price paid from MMP to DPN.
10. Since different legal entities in the group lend to projects and others borrow from banks, project financing through external bank or similar
institutions will not be netted in the balance sheet and will over-report the debt stated in the balance sheet compared to the underlying
exposure in the Group. Similarly, certain net interest-bearing debt incurred from activities pursuant to the Marketing Instruction of the
Norwegian government are off-set against receivables on the SDFI. Some interest-bearing elements are classified together with non-interest
bearing elements, and are therefore included when calculating the net interest-bearing debt.