First quarter 2017 results Analyst...
15
Brussels – May 3, 2017 First quarter 2017 results Analyst call Koen Van Gerven, CEO Koen Beeckmans, CFO
Transcript of First quarter 2017 results Analyst...

Brussels – May 3, 2017
First quarter 2017 results
Analyst callKoen Van Gerven, CEO Koen Beeckmans, CFO

2
Investor presentation - Interim financial report 1Q17
DisclaimerThis presentation is based on information published by bpost in its First Quarter 2017 Interim Financial Report, made available on May, 3rd 2017 at 5.45pm CET oncorporate.bpost.be/investors. This information forms regulated information as defined in the Royal Decree of 14 November 2007. The information in this document may include forward-looking statements1, which are based on current expectations and projections of management about future events. By their nature, forward-looking statements are not guarantees offuture performance and involve known and unknown risks, uncertainties, assumptions and other factors because they relate to events and depend on circumstances that will occur in thefuture whether or not outside the control of the Company. Such factors may cause actual results, performance or developments to differ materially from those expressed or implied bysuch forward-looking statements. Accordingly, no assurance is given that such forward-looking statements will prove to have been correct. They speak only as at the date of thePresentation and the Company undertakes no obligation to update these forward-looking statements contained herein to reflect actual results, changes in assumptions or changes infactors affecting these statements. This material is not intended as and does not constitute an offer to sell any securities or a solicitation of any offer to purchase any securities.
More on corporate.bpost.be/investors
Financial Calendar
1 as defined among others under the U.S. Private Securities Litigation Reform Act of 1995
10.05.2017Ordinary General Meeting of Shareholders
15.05.2017Ex-dividend date
17.05.2017Payment date of the dividend
07.08.2017(17:45 CET)Quarterly results 2Q17
08.11.2017(17:45 CET)Quarterly results 3Q17
04.12.2017(17:45 CET)Interim dividend 2017 announcement
07.12.2017Ex-dividend date (interim dividend)
11.12.2017Payment date of the interim dividend

3
Highlights of 1Q17
1Q17
Resilient underlying Domestic Mail evolution• Driven by strong and positive advertising mail volume trend
Organic cost evolution on track• Opex influenced by acquisitions (€ +153.0m)
• Increase in transport cost in line with positive international business evolution
Excellent parcels performance• Domestic: double-digit volume growth driven by e-commerce and C2C;
price/mix effect of -3.4% fully mix related• International: positive contribution from acquisitions, increase in flows
from China and the US, continued volume loss to China
-4.7%
+24.5%
+ € 11.4m
+ € 158.4m
Revenues up 26.4%• Driven by excellent parcels growth and acquisitions;
supported by resilient Domestic Mail
€ 764.0m
EBITDA up € 1.1m, fully in line with our guidance
BGAAP net profit of bpost SA/NV up € 4.3m
2017 outlook maintained
€ 176.9m
€ 94.3m
4
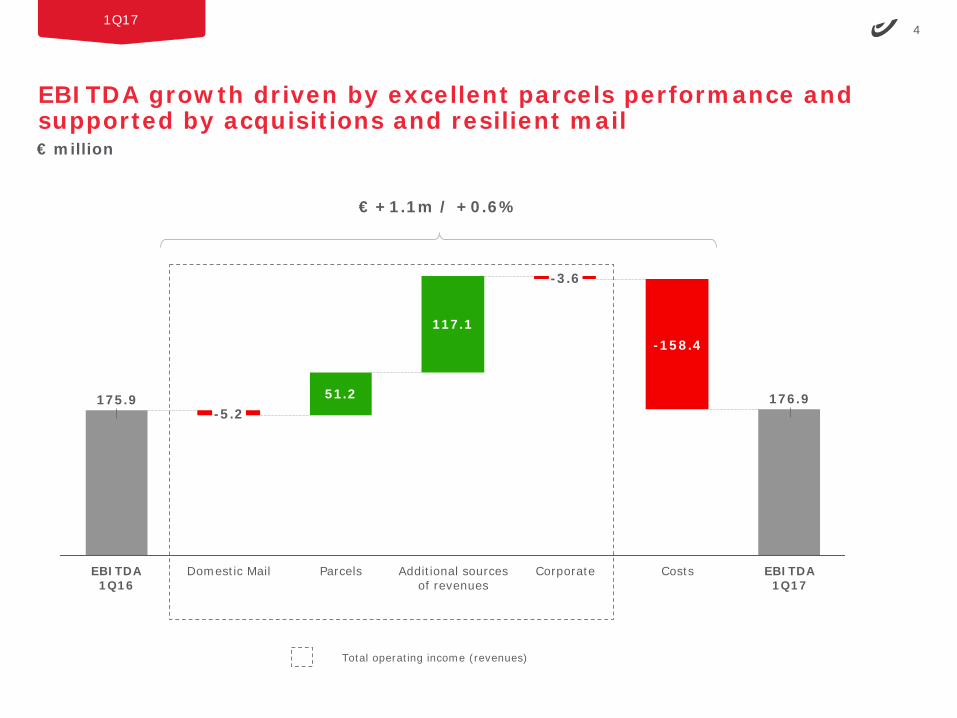
51.2 176.9
117.1
175.9
EBITDA 1Q17
-158.4
Corporate Costs
-3.6
Additional sources of revenues
ParcelsDomestic Mail
-5.2
EBITDA 1Q16
EBITDA growth driven by excellent parcels performance and supported by acquisitions and resilient mail
1Q17
Total operating income (revenues)
€ +1.1m / +0.6%
€ million

5
Summary of key financials 1Q17
1Q17
€ million
1Q16 1Q17 % ΔTotal operating income (revenues) 604.5 764.0 26.4%Operating expenses 428.7 587.1 37.0%EBITDA 175.9 176.9 0.6%Margin (%) 29.1% 23.2%EBIT 153.9 154.2 0.2%Margin (%) 25.5% 20.2%Profit before tax 149.3 150.3 0.7%Income tax expense 53.4 54.2 Net profit 95.9 96.1 0.2%FCF 245.9 166.2 -32.4%bpost S.A./N.V. net profit (BGAAP) 90.0 94.3 4.8%Net Debt/ (Net cash), at 31 March (792.2) (659.1) -16.8%

6
Total operating income (revenues)
1Q17
€ million
1 Defined as domestic and Belgian in- and outbound
1Q16 comparable
∆ 1Q17 % ∆
Transactional mail 223.7 -9.6 214.2 -4.3%Advertising mail 65.1 2.2 67.4 3.4%Press 72.9 2.2 75.0 3.0%
Domestic parcels1 43.9 8.5 52.4 19.4%International parcels 41.9 11.4 53.3 27.3%Logistic solutions 2.6 31.3 34.0 -
International mail 39.2 2.9 42.1 7.5%Value added services 25.5 0.5 26.0 2.0%Banking and financial 48.5 -2.0 46.6 -4.1%Distribution - 68.7 68.7 -Retail & Other 23.8 46.9 70.7 197.1%
Corporate 17.4 -3.6 13.7 -21.0%
604.5 159.5 764.0 26.4%
Domestic mail
Parcels
Additional sourcesof revenues
TOTAL

7
Domestic mail underlying volume trend at -4.7% driven by positive advertising mail trend
1Q17
Total operating income (revenues), € million
3.6
2.6
356.5
Volume
Price/Mix
361.7
-5.2
1Q16
1Q17
-11.3
Working dayimpact
• Very good performance against a tough comparable base at -4.0% for 1Q16.
• Transactional Mail: shift towards cheaper products and continued e-substitution.
• Advertising Mail: strong performance across all focus segments and specific campaigns, positive impact from timing of Christmas holiday and Easter (2Q17 vs. 1Q16).
• Press: Slightly lower volume trend mainly due to periodicals.
1 1Q17 had 2 working days more than 1Q16 for stamps and franking machines.
• Impacted by regulatory decision on small user basket pricing.
FY16 1Q17 1Q16 2Q16 3Q16 4Q16 FY16 1Q17Transactional mail -5.9% -6.0% -5.3% -4.8% -7.4% -6.4% -5.9% -7.0%Advertising mail -3.0% 2.7% 0.1% -2.2% -1.2% -7.8% -3.0% 2.3%Press -2.8% -3.1% -2.6% -0.3% -4.2% -4.1% -2.8% -3.1%Domestic Mail -5.0% -3.9% -4.0% -3.8% -5.9% -6.4% -5.0% -4.7%
Underlying1Reported

8
Excellent parcels performance, growth in Logistic Solutions driven by DynaGroup
1Q17
Total operating income (revenues), € million
Domestic Parcels1 8.5
Logistic Solutions2
11.4
1Q17 139.6
1Q16comparable 88.4
International Parcels
+51.2
31.3
1 Defined as domestic and Belgian in- and outbound2 New category, previously called Special Logistics
• Reported volume growth of +24.5% driven by e-commerce and the online C2C product offering.
• Price/mix of -3.4%: price increase fully offset by product & client mix effect.
• Growth driven by positive contribution from acquisitions and increase in flows from China and the US, continued volume loss to China.
• Consolidation of DynaGroup as of 1 January 2017.

9
Additional sources of revenues driven by the acquisition of Ubiway
1Q17
Total operating income (revenues), € million
+117.1
254.11Q17
Retail & Other1 46.9
Distribution1
0.5
2.9
-2.0
International Mail
137.01Q16comparable
Banking & Financial
VAS
68.7
• Positive evolution driven by increased business mail volumes.
• Consists of Ubiway press distribution as well as convenience distribution through Alvadis (pre-paid services) and Burnonville (impulse products).
• Mainly lower revenues from bpost bank a.o. on savings accounts due to the low interest rate environment; partly compensated by Western Union revenues.
• Consists of Ubiway proximity and convenience retail as well as other revenues.
• Mainly Speos (document management services).
1 New category

10
Organic cost evolution on track. Opex influenced by acquisitions (€ +153.0m). Increase in transport cost in line with positive international business evolution.
1Q17
Operating expenses excl. depreciation and amortization, € million
• Increase driven by acquisitions. Excluding scope change, increase driven by growth in the international business and lower favorable settlements in previous year’s terminal dues.
• Increase driven by acquisitions.
• Average reported FTE & interim increase of 1,586 leading to € +20.9m additional costs and explained by the integration of new subsidiaries.
• Favourable FTE mix of € -3.9m thanks to the recruitment of auxiliary postmen (€ -2.8m) and the reduction of management level FTE (€ -1.0m).
• Negative price effect of € +3.7m explained by salary indexation, CLA and merit increases partly compensated by tax shift.
• Increase driven by acquisitions. Excluding scope change, increase of rent and rental, maintenance and energy costs (linked to increased fuel price), almost compensated by the decrease of consultancy costs and third party remuneration.
FDM, Apple Express, Ubiway, DynaGroup, Parcify and de Buren
0.7
5.4
153.0434.0
+1.4
1Q17
97.4Other costs -1.8
587.1
Other SG&A
22.7
16.1
4.0
Transport
1Q16
1Q16 excl.one-off 432.7
One-off
Payroll & Interim
16.9
-3.0
428.7
• 2016 benefited from a positive impact from the increase of the recoverable VAT from 2016 vs. 2015 (EUR +4.0m) in other costs.

11
Decrease in operating FCF1 mainly driven by acquisitions and phasing in working capital evolution
1Q17
Mainly due to:• Lower proceeds from sale of buildings: € -1.2m• Purchase of 24.5% remaining shares in LGI: € -11.0m• DynaGroup acquisition: € -50.2m• FDM (Australia) acquisition cash outflow in 1Q16 vs. earn-out in 1Q17: € +8.6m
• Lower income tax paid relating to previous years: € +5.9m• Alpha pay-outs: € +10.9m• Excluding the above:
• Results of operating activities: € +0.6m• Working capital evolution: € -42.8m, mainly explained by a negative phasing
in suppliers and Social Security payments
1 Operating free cash flow = cash flow fro operating activities + cash flow from investing activities
• Payment of a dividend to minority interest in 1Q16: € +2.0m
1Q16 1Q17 Delta
Cash flow from operating activities +281.1 +255.6 -25.5Cash flow from investing activities -35.1 -89.3 -54.2Operating free cash flow +245.9 +166.2 -79.7
Financing activities -2.1 -0.3 +1.8Net cash movement +243.9 +165.9 -77.9
-12.4 -13.0 -0.6Capex
€ million

12
Strong balance sheet structure
1Q17
€ million
PPE & intangibleassets
Inventories
Trade & otherreceivables
Investments inassociates
Other assets
Cash, cashequivalents
& investmentsecurities
Mar 31, 2017
2,448.4
889.4
39.5
399.7
347.7
55.1
717.0
Dec 31, 2016
2,290.3
786.0
36.7
484.6
373.7
58.4
550.9
Total equity
Employee benefits
Trade & otherpayables
Provisions
Interest-bearingloans & borrowings
Mar 31, 2017
2,448.4
849.9
355.7
1,129.1
56.0 57.7
Dec 31, 2016
2,290.3
779.3
356.7
1,037.5
58.7 58.0
Assets Equity and liabilities

131Q17
Outlook for 2017 – maintained
1 2Q17 will count 2 working days less, 3Q17 1 less on franking machines and 2 less on stamps and 4Q17 1 less on franking machines and 1 more on stamps vs. thesame quarters of 2016.
Recurring EBITDA and dividend payment at the same level as 2016
RevenuesIncrease driven by:• Growth in domestic parcels: volume double
digit, around -3% price/mix effect• Continued growth in international parcels
supported by newly acquired businesses• Growing Ubiway Retail revenues• Partly offset by decrease in domestic mail1:
volume between -5% and -6%, average domestic mail price increase of 1.5%
Operating expensesIncrease driven by:• Increase in transport cost (reflecting growth in
International Parcels) • Integration of acquired businesses • Salary indexation expected as of July 2017• Partly compensated by continued productivity
improvements and optimized FTE mix, and• Continued cost optimization
Capex• Recurring and Vision 2020 investments ~€ 90m• Business development investments: Ubiway < € 10m

141Q17
M&A on top of overall 2020 EBITDA guidanceAccretive contribution supported by strong balance sheet. Any decision must be evaluated on 5 criteria
We confirm our long term ambition of at least € 620m1 EBITDA by 2020
Overall guidance 2016-2020 as issued at CMD on 15 November 2016
RevenueIncrease driven by:• Growth in domestic parcels: volume +75%
at least (vs. 2015), -2 to -3% price/mix effect• Growth in international parcels: revenue x2
at least (vs. 2015)• Decrease in domestic mail: volume up to
-6%
Operating expensesIncrease driven by:• Increase in transport cost (reflecting growth in
International) • Integration of acquired businesses • Inflation• Partly compensated by up to 4% FTE & interim
productivity increase p.a. at current scope and• Optimized FTE mix
Capex• Further Vision 2020 investments in 2017-18: ~€ 90m p.a. excluding Ubiway capex • Maintenance capex level in 2019-20: ~€ 60m p.a. excluding Ubiway capex
Maintenance of dividend policyAt least 85% pay-out of BGAAP net profit
1 including acquisitions of FDM, Apple Express, Ubiway, Parcify and de Buren

15
Key contacts
Baudouin de Hepcée
Director External Communication, Investor Relations & Public Affairs
• Email: [email protected]• Direct: +32 (0) 2 276 22 28• Mobile: +32 (0) 476 49 69 58• Address: bpost, Centre Monnaie, 1000 Brussels, Belgium
Saskia Dheedene
Manager Investor Relations
• Email: [email protected]• Direct: +32 (0) 2 276 76 43• Mobile: +32 (0) 477 92 23 43• Address: bpost, Centre Monnaie, 1000 Brussels, Belgium