FIRST QUARTER 2014 RESULTS Medellín, Colombia … · FIRST QUARTER 2014 RESULTS Medellín,...
24
FIRST QUARTER 2014 RESULTS Medellín, Colombia May 8, 2014 Luis Fernando Alarcón, CEO Carlos Alberto Rodríguez, CFO
Transcript of FIRST QUARTER 2014 RESULTS Medellín, Colombia … · FIRST QUARTER 2014 RESULTS Medellín,...

FIRST QUARTER 2014 RESULTS
Medellín, Colombia
May 8, 2014
Luis Fernando Alarcón, CEO
Carlos Alberto Rodríguez, CFO

DISCLAIMER
FIRST QUARTER 2014 RESULTS
Certain statements contained in this report constitute "forward-looking statements"
within the meaning of the Private Securities Litigation Reform Act of 1995.
These forward-looking statements reflect our current views with respect to future events
and are based on assumptions and subject to risks and uncertainties. Also, these
forward-looking statements present our estimates and assumptions only as of the date
of this report. Except for our ongoing obligation to disclose material information as
required by federal securities laws, we do not intend to update you concerning any
future revisions to any forward-looking statements to reflect events or circumstances
occurring after the date of this report.
Amounts expressed in US dollars are for information purposes only, and do not
reflect accounting conversion techniques usually applied. As of March 31, 2014,
the exchange rate was of USD 1.00 = COP 1,965.32 (Source: Banco de la
República de Colombia).
2

Operating Highlights
Investments
First Quarter 2014 Results
Q&A
AGENDA
3

General Shareholders’ Meeting:
External Auditor for April 2014-April 2015: Ernst
& Young.
Ordinary dividend COP 196 per share and
extraordinary dividend COP 19 per share. In
total, a 13.8% increase compared with the
amount paid in 2013.
Amendment of Articles 5 – Corporate Purpose
and General Provisions- and 27 – Board of
Directors- of ISA’s by-laws.
Election of the Board of Directors for the April
2014-March 2015 period.
The International Finance Corporation -IFC- and IFC
GIF BRASIL acquired a 32.76% interest on Internexa
Participações S.A.
Road Concessions in Colombia (4G): ISA did not
submit bid for the Ibagué-Puerto Salgar-Girardot
project for which it was prequalified.
RELEVANT EVENTS 4 A
ffil
iate
s
Ho
ldin
g C
om
pan
y
ISA
INTERCOLOMBIA
Domestic
Affiliates Foreign
Affiliates
100%
Effective January 1, 2014, the corporate separation
between ISA and INTERCOLOMBIA.

2014 GUIDE
In 2014, ISA will mainly focus on:
Consolidating processes and functions of ISA as the group’s corporate company.
Defining quantifiable goals that enable the measurement of ISA’s progress in terms
of sustainability.
Reaching an agreement with ANEEL on the amount of indemnity for SE (CTEEP)
and form of payment.
Investments for COP 1,558 billion.
Maintaining the same operating margin and EBITDA levels as 2013.
Increasing the net margin above inflation.
See disclaimer on forward-looking statements.
5
AGENDA
Operating Highlights
Investments
First Quarter 2014 Results
Q&A

1Q14 Investments: USD 145 million
Colombia: El Bosque Project, Termocol, Betania, Chivor,
Sogamoso, Jamondino, Chinú Substations. Sogamoso, Purnio
and San Fernando Connections at Reforma conexions.
Contributions to companies
Peru: Trujillo Chiclayo, Machupicchu-Abancay-Cotaruse and
Mantaro Montalvo, Ventanilla- Zapallal and Ventanilla – Chavarría
Projects. Expansions 14, 15, 16 and Paraqsha II- Huanuco line.
Trujillo, Reque and Amarilis Reque Substation.
Brazil: Capital contributions, investment in assets.
Investment opportunities 2014: USD 2,218 million
Colombia: UPME Projects, expansion plan for transmission lines
and substations. Estimated value USD 1,269 million.
Peru: Energy transmission projects. Estimated value USD 534
million.
Chile: CDEC-SIC energy transmission projects. Estimated value
USD 515 million.
ENERGY INFRASTRUCTURE
LINES UNDER
STUDY LINES IN
OPERATION
LINES UNDER
EXECUTION
7
40,630 OPERATIONAL
CIRCUIT Km
75,960 TRANSFORMATION
MVA

TOLL ROAD INFRASTRUCTURE
Investments 1Q14: USD 3 million
Chile: Investments on third lanes and electronic toll system in
MAIPO Route and security investments (CCTV) in ARAUCANÍA
Route.
2014 investment opportunities: USD 5,120 million
Colombia: 4G – ANI Projects (figures in millions)
Neiva-Girardot, USD 990
Cruz del Viso-Carreto-Palmar de Varela, USD 630
Santana-Mocoa-Neiva, USD 1,290
Popayán-Santander de Quilichao, USD 850
Bogotá-Villavicencio (Sector 1), USD 1,160
Chile, third lanes in Maipo, pedestrian connections in Rios and
CCTV in Araucanía and Bosque. Estimated value: USD 200
million
8
TOLL ROAD INFRASTRUCTURE IN OPERATION
907 Km ROAD IN OPERATION
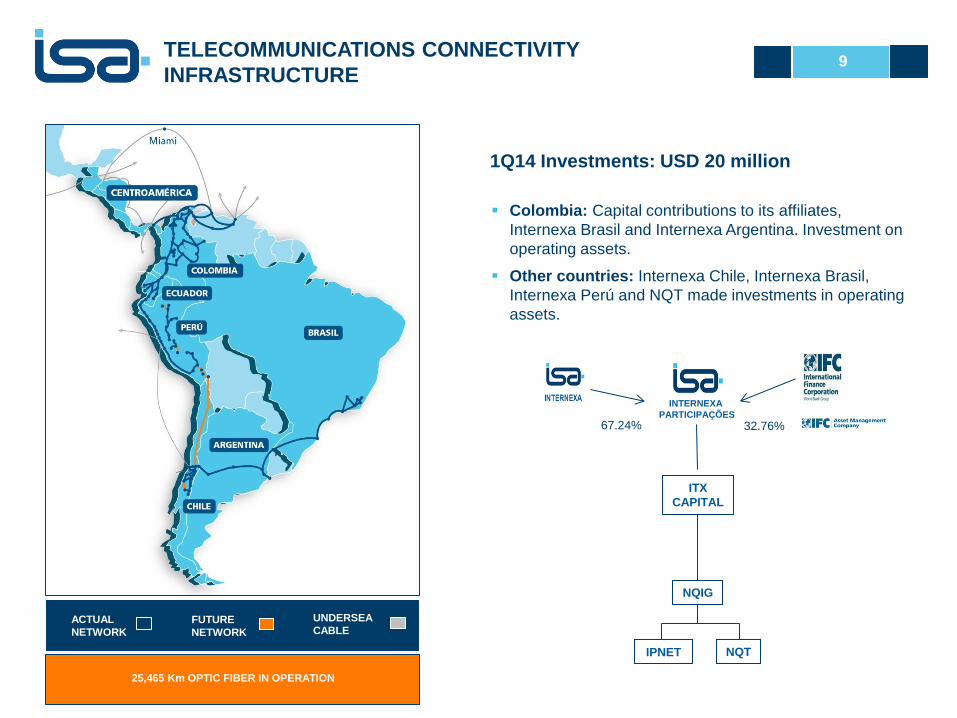
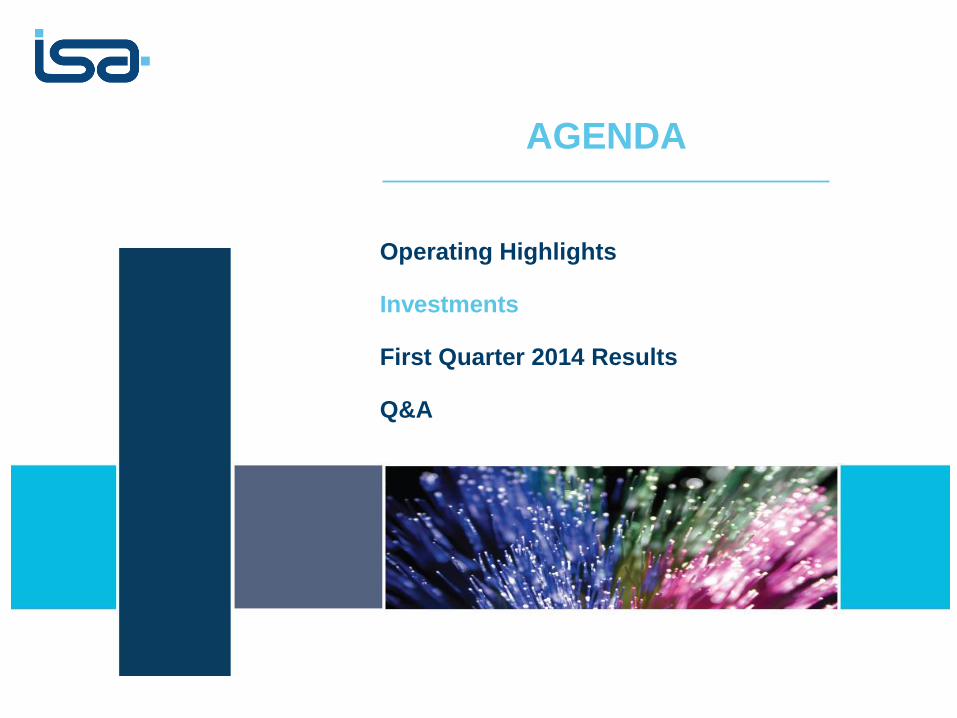
1Q14 Investments: USD 20 million
Colombia: Capital contributions to its affiliates,
Internexa Brasil and Internexa Argentina. Investment on
operating assets.
Other countries: Internexa Chile, Internexa Brasil,
Internexa Perú and NQT made investments in operating
assets.
TELECOMMUNICATIONS CONNECTIVITY
INFRASTRUCTURE 9
UNDERSEA
CABLE ACTUAL
NETWORK
FUTURE
NETWORK
25,465 Km OPTIC FIBER IN OPERATION
INTERNEXA
PARTICIPAÇÕES
ITX
CAPITAL
NQIG
IPNET NQT
32.76% 67.24%

1Q14 investments: USD 1 million in regulated assets (affiliate XM), to be remunerated by the CREG
(Energy and Gas Regulatory Commission).
SMART MANAGEMENT OF REAL-TIME SYSTEMS (SMRTS) 10
2014 investment opportunities:
Project promoted by CREG. Natural Gas Market Agent in Colombia for a 5-year period.
Duties: Design, implement and adopt the operation system of the Central Electronic Bulletin (Boletín Electrónico
Central -BEC), Centralize the gas market information, manage the primary market auctions, manage the secondary
market transactions and prepare reports for market monitoring.
Prequalified firms: 3, including Consortium XM 51% (ISA Affiliate) - Omie 30% - BVC 10% - Concentra 9%
Estimated date: June 6, 2014.

Investment by country COP %
Colombia 1,299 20
Peru 1,411 22
Brazil 1,920 29
Chile 1,935 29
Investment by business COP %
Energy 6,113 93
Toll Roads 3 0
Telecommunications 321 5
SMRTS 149 2
1,558
1,341
514 350 313 414
LONG-TERM INVESTMENT PLAN 11
2,098
COP billion
Investment in existing assets and awarded projects for the next 7 years is estimated at COP 6,586
billion, or approximately USD 3,231 million.
Projections February 2014
2014 2015 2016 2017 2018 2019 2020
Colombia Peru Brazil Chile Others

AGENDA
Operating Highlights
Investments
First Quarter 2014 Results
Q&A

CONSIDERATIONS
1Q financial results included the following relevant events:
1. Recognition of Chilean and Brazilian concessions as financial assets effective as of 2Q13.
2. Completion of amortization of ISA Capital do Brasil’s goodwill.
3. Recognition of annuities in INTERCOLOMBIA as operating income, related to UPME
(Unidad de Planeación Minero Energética) projects, in virtue of the corporate separation
of ISA-INTERCOLOMBIA
4. Effects of the conversion of financial information of foreign affiliates, which was
neutralized in the net result.
13
EXCHANGE
RATES
1Q13
average
1Q14
average
Change
%
2013
last
1Q14
last
Change
%
COP / DOLAR USD 1,790.46 2,007.70 12.1% 1,926.83 1,965.32 2.0%
REAL / DOLAR USD 2.00 2.36 18.4% 2.34 2.26 -3.4%
CLP / DOLAR USD 472.50 551.76 16.8% 524.61 551.18 5.1%
COP / REAL 897.02 849.28 -5.3% 822.52 868.46 5.6%
COP/ CLP 3.79 3.64 -4.0% 3.67 3.57 -2.9%

Energy 69.1%
Roads 22.4%
Telecommunications
6.1%
SMRTS 2.4%
816
903
600
800
1,000
1Q13 1Q14
Breakdown by Business – 1Q14 Breakdown by Country – 1Q14
10.6% Total operating
revenues reached
COP 902,681 million /
USD 459 millions in
1Q14.
SMRTS: Smart Management of Real Time Systems
CONSOLIDATED FINANCIAL RESULTS
REVENUES 14
CO
P b
illio
n
COLOMBIA 40.3%
CHILE 22.6%
BRAZIL 23.1%
PERU 12.5%
OTHERS 1.5%

Million 1Q13 1Q14 Change
%
AOM Costs and Expenses
(ex. Pensions) 345,364 358,544 3.8%
Provisions, Depreciation, Amortization
and Pensions 186,569 99,184 -46.8%
Total 531,933 457,728 -14.0%
CONSOLIDATED FINANCIAL RESULTS
COSTS AND OPERATING EXPENSES
Breakdown by Business – 1Q14
Breakdown by Country – 1Q14
532
458
400
450
500
550
600
1Q13 1Q14
-14.0%
15 C
OP
bill
ion
Energy 73.4%
Roads 11.5%
Telecommunications
10.8%
SMRTS 4.3%
COLOMBIA 39.9%
CHILE 12.2%
BRAZIL 33.0%
PERU 13.3%
OTHERS 1.6%

471
544
400
450
500
550
1Q13 1Q14
Breakdown by Country – 1Q14
CONSOLIDATED FINANCIAL RESULTS
EBITDA
15.6%
Breakdown by Business – 1Q14
16 C
OP
bill
ion
EBITDA reached COP 544,137 million / USD 277 million in 1Q14.
63.9 57.7
51.9 59.7
54.4 60.3
4Q12 1Q13 2Q13 3Q13 4Q13 1Q14
EBITDA Margin
Energy 67.9%
Roads 28.6%
Telecommunications
3.1%
SMRTS 0.4%
COLOMBIA 41.3%
CHILE 28.4%
BRAZIL 12.7%
PERU 15.9%
OTHERS 1.7%

-77
-136
-200
-150
-100
-50
0
1Q13 1Q14
Non-operating results
was –COP 136,479
million /
–USD 69 million in
1Q14.
CONSOLIDATED FINANCIAL RESULTS
NON-OPERATING RESULTS
77.2%
Million 1Q14
Colombia -15,773
Chile -130,095
Brazil 22,115
Peru -11,003
Other -1,723
Million 1Q14
Energy Transmission -4,508
Road Concessions -128,466
Telecommunications Transport -4,035
SMRTS 530
Breakdown by Business Breakdown by Country
17
CO
P b
illio
n

70
156
0
50
100
150
200
1Q13 1Q14
Net Income for 1Q14 reached COP 155,778 million / USD 79 million.
CONSOLIDATED FINANCIAL RESULTS
NET INCOME
121.6%
Breakdown by Business Breakdown by Country
Million 1Q14
Colombia 113,621
Chile 21,463
Brazil -2,790
Peru 20,328
Other 3,157
Million 1Q14
Energy Transmission 129,826
Road Concessions 24,230
Telecommunications Transport 1,262
SMRTS 459
18
CO
P b
illio
n
4.9 8.6 16.4
11.9 11.0
17.3
28.4
16.2
22.6
0.6
23.8 25.7
4Q12 1Q13 2Q13 3Q13 4Q13 1Q14
Net Margin Net Margin BMI

7,451 7,385
3,705 3,891
14,411 14,528
0
5,000
10,000
15,000
20,000
25,000
30,000
2013 1Q14
Pasivos Interés minoritario Patrimonio
Assets in 1Q14 totaled $25,804,177 million or
USD13,130 million.
Assets by Country - 1Q14
0.8%
-0.9%
5.0%
Assets 25,567 25,804 Assets by Business - 1Q14
0.9%
CONSOLIDATED BALANCE SHEET
COLOMBIA 29.3%
CHILE 33.0%
BRAZIL 25.7%
PERU 11.6%
OTHERS 0.5%
Energy 63.7%
Roads 32.8%
Telecommunications
2.6%
SMRTS 0.9%
19
CO
P b
illio
n

Million 2013 1Q14 Change
%
1Q14
USD
CHILE 4,217,278 4,096,420 -2.9 2,084
COLOMBIA 1,788,574 1,817,624 1.6 925
BRAZIL 1,169,464 1,230,309 5.2 626
PERU 1,464,947 1,513,947 3.3 770
BOLIVIA 51,134 47,414 -7.3 24
ARGENTINA 7,071 6,146 -13.1 3
TOTAL 8,698,468 8,711,860 0.2 4,433
CONSOLIDATED FINANCIAL DEBT
Breakdown by Rate Breakdown by Source Breakdown by Currency
20
2.66 2.53
2.90 3.12
3.42 3.29
4.25
3.62 3.88 3.86
3.61
4.20
1.50
2.00
2.50
3.00
3.50
4.00
4.50
5.00
dic-12 mar-13 jun-13 sep-13 dic-13 mar-14
DEUDA NETA / EBITDA EBITDA / INTERESES OPERACIÓN
BRL 13.2%
COP 19.7%
USD 20.2%
UF + CLP 46.9%
Others 0.1%
Capital Market 74.2%
Banks 24.9%
Other 0.9%
Fixed 16.9%
CDI 8.1%
ICP 15.3%
TJLP 3.6%
TAB 6.4%
Libor 4.2%
DTF 4.4%
UF 40.5%
Other 0.7%

DEBT PROFILE 21
USD million
4,439
4,175
3,813
3,377
2,993
2,547
2,349
2,059
1,852 1,671
957 869
782
498 415
279 192
101 61
-
1,000
2,000
3,000
4,000
-
100
200
300
400
500
600
700
2014 2015 2016 2017 2018 2019 2020 2021 2022 2023 2024 2025 2026 2027 2028 2029 2030 … 2041
COLOMBIA
PERU
CHILE
BRASIL
BOLIVIA
ARGENTINA
Saldo Inicial
COLOMBIA
PERU
CHILE
BRAZIL
BOLIVIA
ARGENTINA
Balance

AGENDA
Operating Highlights
Investments
First Quarter 2014 Results
Q&A