
First Presented for: Florida Institute of Technology ... · PDF file Effective Performance...
32
Effective Performance Test Reports Page 1 www.PerfTestPlus.com © 2006 PerfTestPlus, Inc. All rights reserved. Understanding and Creating Effective Performance Test Reports First Presented for: Florida Institute of Technology Computer Science Seminar Scott Barber Chief Technology Officer PerfTestPlus, Inc.
Transcript of First Presented for: Florida Institute of Technology ... · PDF file Effective Performance...
Effective Performance Test Reports Page 1www.PerfTestPlus.com
© 2006 PerfTestPlus, Inc. All rights reserved.
Understanding and Creating Effective Performance Test Reports
First Presented for:Florida Institute of TechnologyComputer Science Seminar
Scott BarberChief Technology Officer
PerfTestPlus, Inc.

Effective Performance Test Reports Page 2www.PerfTestPlus.com
© 2006 PerfTestPlus, Inc. All rights reserved.
Agenda
Introduction
What Stakeholders Want
What Stakeholders (Usually) Get
How to “give ‘em what they want” (or at least get close)
Valuable Charts, Tables, Verbiage and Their Uses
Stakeholder Reaction to Charts, Tables and Verbiage
Comprehensive Final Report Template
Want More Information?
Summary/Questions
Effective Performance Test Reports Page 3www.PerfTestPlus.com
© 2006 PerfTestPlus, Inc. All rights reserved.
Introduction
Most people will never read performance test results docs.
Most people don’t really understand the underlying components to performance.
It is our job to make it easy for them to understand, and understand quickly.
Being skilled at graphical presentation of technical information is critical for us to help others understand the message we are delivering.
Improper or confusing charts and tables can lead to wrong decisions that cause lost $ and ruined reputations.

Effective Performance Test Reports Page 4www.PerfTestPlus.com
© 2006 PerfTestPlus, Inc. All rights reserved.
What Stakeholders Want
Answers… NOW! (They might not even know the question)
To understand information intuitively.
Simple explanations of highly technical information.
To be able to make decisions quickly and have the information to support those decisions.
“Trigger phrases” to use with other stakeholders.
Concise summaries and conclusions.
Recommendations and options.
Effective Performance Test Reports Page 5www.PerfTestPlus.com
© 2006 PerfTestPlus, Inc. All rights reserved.
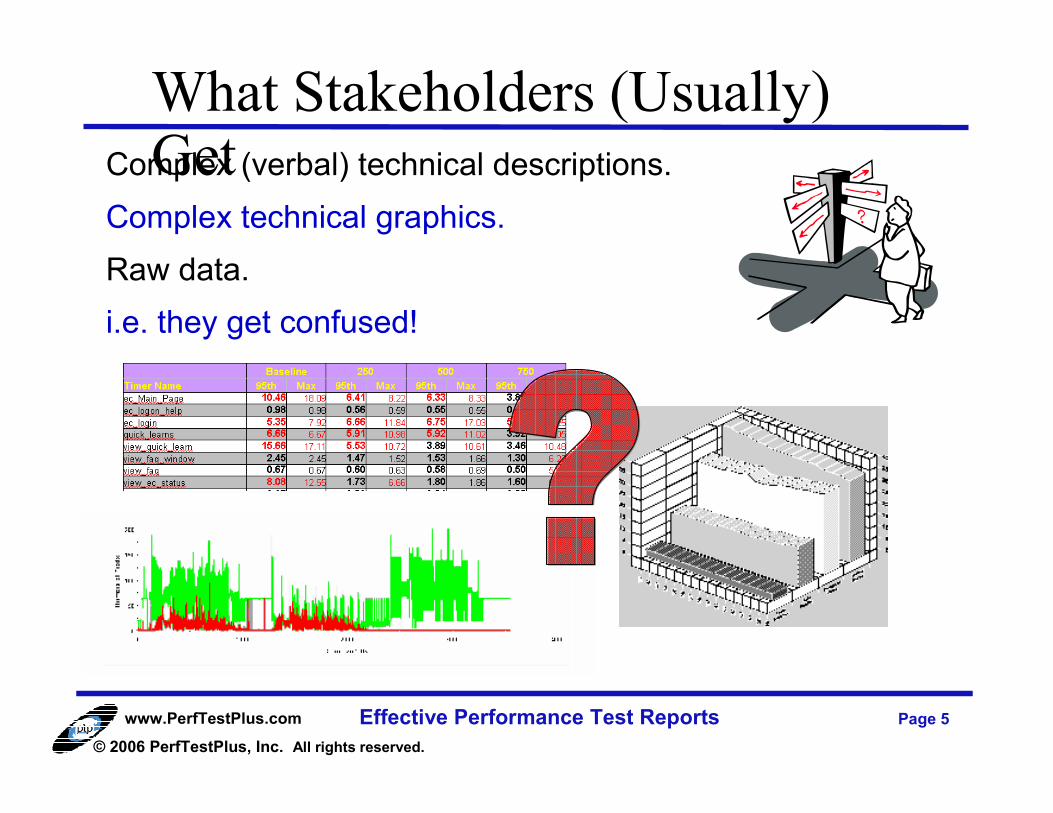
What Stakeholders (Usually) GetComplex (verbal) technical descriptions.
Complex technical graphics.
Raw data.
i.e. they get confused!
Effective Performance Test Reports Page 6www.PerfTestPlus.com
© 2006 PerfTestPlus, Inc. All rights reserved.
“Give ‘em what they want” (or at least get
close)
Concise verbal descriptions.
Well formed, informative charts (pretty pictures).
Focus on requirements and business issues.
Don’t be afraid to make recommendations or draw conclusions!
Have supporting data available.
Effective Performance Test Reports Page 7www.PerfTestPlus.com
© 2006 PerfTestPlus, Inc. All rights reserved.
Charts, Tables and Verbiage
Performance Report Output Chart
Response vs. Time Scatter Chart
Component (Resource Usage) Performance Chart(s)
Consolidated Scatter Chart
Response Time Summary Comparison Chart
Response Time by Test Execution Chart
Response Time Degradation Curve
Effective Performance Test Reports Page 8www.PerfTestPlus.com
© 2006 PerfTestPlus, Inc. All rights reserved.
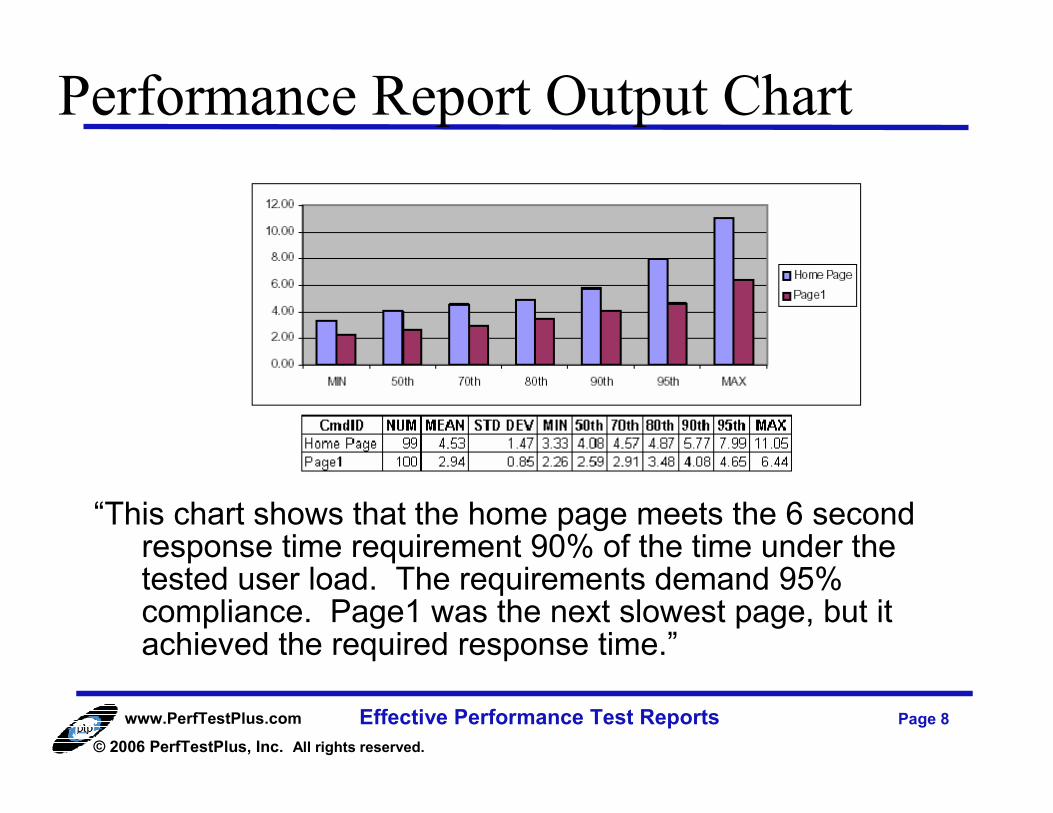
Performance Report Output Chart
“This chart shows that the home page meets the 6 second response time requirement 90% of the time under the tested user load. The requirements demand 95% compliance. Page1 was the next slowest page, but it achieved the required response time.”
Effective Performance Test Reports Page 9www.PerfTestPlus.com
© 2006 PerfTestPlus, Inc. All rights reserved.
Performance Report Output Chart
Good for:• Showing response times for high interest pages during a single
test.
• Highlighting select instances of poor (or good) performance.
Not good for:• Results from multiple tests.
• Component/resource based info.
• Results about many pages at once.
Notes:• This chart and table can be viewed directly in TestManager or
recreated in Excel.

Effective Performance Test Reports Page 10www.PerfTestPlus.com
© 2006 PerfTestPlus, Inc. All rights reserved.
Response vs. Time Scatter Chart“This chart shows that the home page (blue squares) is the
slowest page with most response times hovering around the the 6 sec requirement. Page1 (purple X) was the next slowest page, but it achieved the required response time.”

Effective Performance Test Reports Page 11www.PerfTestPlus.com
© 2006 PerfTestPlus, Inc. All rights reserved.
Response vs. Time Scatter Chart
Good for:• Identifying patterns in response times over a whole run.
• Graphically displaying response times vs. goals.
• Highlighting select instances of poor performance.
• Can be overlayed with component/resource data.
Not good for:• Results from multiple tests.
Notes:• This chart and table can be viewed directly in TestManager or
recreated in Excel.
• Many component/resource metrics can be collected and overlayed directly in TestManager.
Effective Performance Test Reports Page 12www.PerfTestPlus.com
© 2006 PerfTestPlus, Inc. All rights reserved.
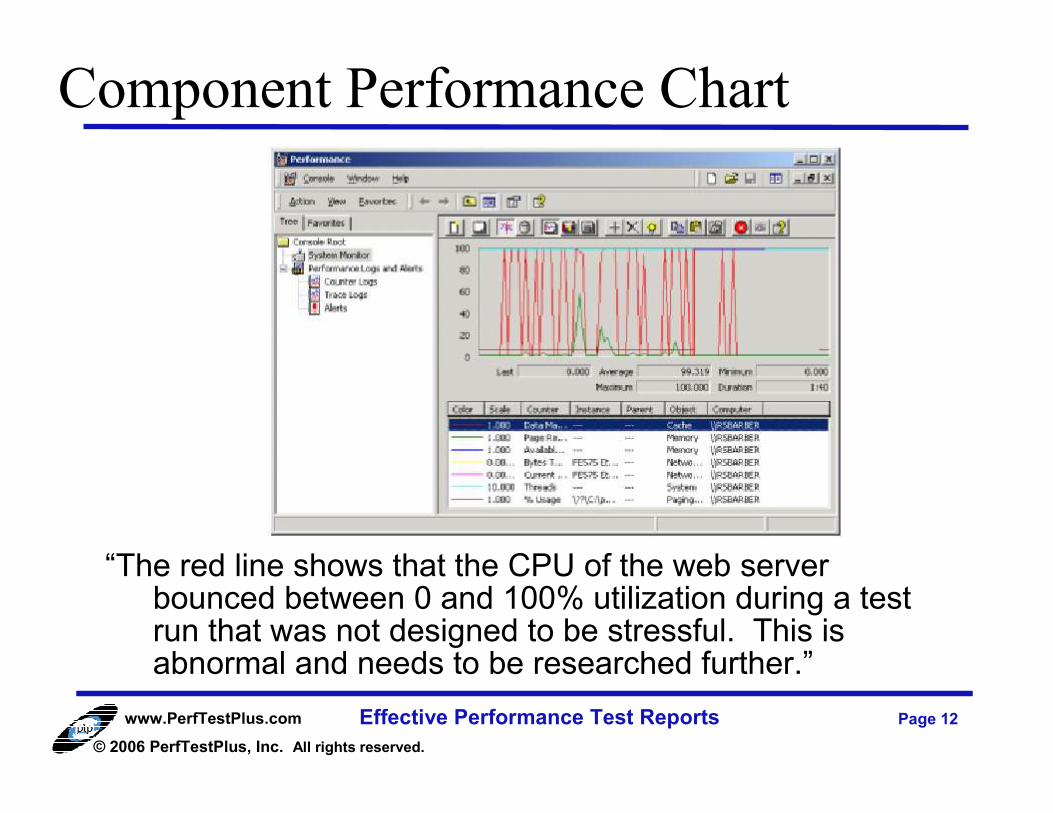
Component Performance Chart
“The red line shows that the CPU of the web server bounced between 0 and 100% utilization during a test run that was not designed to be stressful. This is abnormal and needs to be researched further.”
Effective Performance Test Reports Page 13www.PerfTestPlus.com
© 2006 PerfTestPlus, Inc. All rights reserved.
Good for:• Identifying various resource usage.
• Determining issues such as memory leaks.
Not good for:• Response time reporting.
• Results from multiple tests.
Notes:• Charts like this one can be created during your script by putting
agents on the servers to be monitored.
• Charts like this one can also be created using tools like Perfmon, Perfmeter and Top.
Component Performance Chart

Effective Performance Test Reports Page 14www.PerfTestPlus.com
© 2006 PerfTestPlus, Inc. All rights reserved.
Consolidated Scatter Chart
“This chart shows both response times and resource utilization together. Close examination shows that Application Server CPU Usage and Queue length coincide with degraded Response Time.”
Effective Performance Test Reports Page 15www.PerfTestPlus.com
© 2006 PerfTestPlus, Inc. All rights reserved.
Response vs. Time Scatter Chart
Good for:• Identifying correlations between response times and resource
usage during over time.
• Graphically displaying response times vs. resources.
• Highlighting potential causes of poor performance.
• Technical stakeholders.
Not good for:• Results from multiple tests.
• “Low tech” stakeholders.
Notes:• This chart and was created in Excel, but in many cases can be
done directly in TestManager.
Effective Performance Test Reports Page 16www.PerfTestPlus.com
© 2006 PerfTestPlus, Inc. All rights reserved.
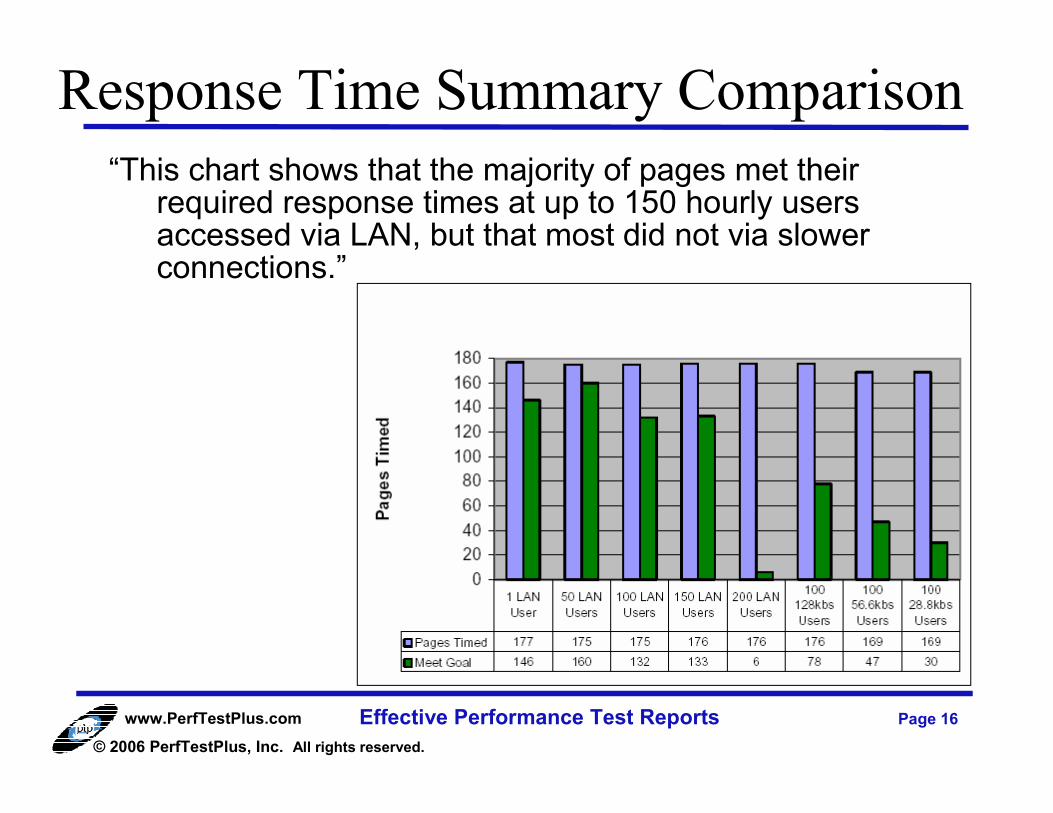
Response Time Summary Comparison
“This chart shows that the majority of pages met their required response times at up to 150 hourly users accessed via LAN, but that most did not via slower connections.”

Effective Performance Test Reports Page 17www.PerfTestPlus.com
© 2006 PerfTestPlus, Inc. All rights reserved.
Response Time Summary Comparison
Good for:• Summarizing requirements met across various and diverse tests.
• Comparing results across multiple tests.
• Highlighting tests with particularly bad (or good) performance.
Not good for:• Depicting individual response times or component/resource data.
Notes:• This chart and table must be created by hand in Excel using test
execution data and stated requirements.

Effective Performance Test Reports Page 18www.PerfTestPlus.com
© 2006 PerfTestPlus, Inc. All rights reserved.
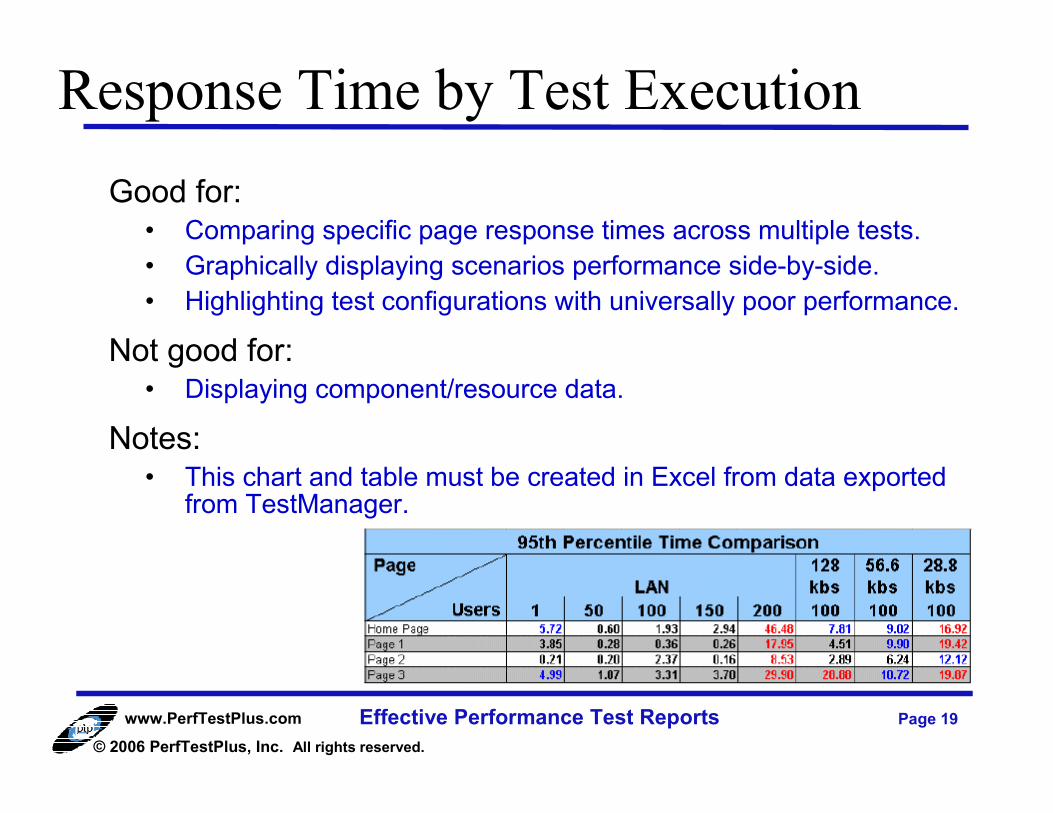
Response Time by Test Execution
“This chart shows that response times for both Home Page and Page1 degrades dramatically and unacceptably at 200 hourly users and via modem connection speeds.”
Effective Performance Test Reports Page 19www.PerfTestPlus.com
© 2006 PerfTestPlus, Inc. All rights reserved.
Response Time by Test Execution
Good for:• Comparing specific page response times across multiple tests.
• Graphically displaying scenarios performance side-by-side.
• Highlighting test configurations with universally poor performance.
Not good for:• Displaying component/resource data.
Notes:• This chart and table must be created in Excel from data exported
from TestManager.

Effective Performance Test Reports Page 20www.PerfTestPlus.com
© 2006 PerfTestPlus, Inc. All rights reserved.
Response Time Degradation Curve
“This chart shows that performance starts to degrade at 150 hourly users and becomes unacceptable between 175 and 200 hourly users.”
Effective Performance Test Reports Page 21www.PerfTestPlus.com
© 2006 PerfTestPlus, Inc. All rights reserved.
Response Time Degradation Curve
Good for:• Comparing specific page response times across multiple tests.
• Graphically displaying where performance gets bad.
• Highlighting load where performance becomes unacceptable.
Not good for:• Displaying component/resource data.
Notes:• Generally considered the most powerful graph at a performance
tester/engineer’s disposal.
• This chart and table must be created in Excel from data exportedfrom TestManager.

Effective Performance Test Reports Page 22www.PerfTestPlus.com
© 2006 PerfTestPlus, Inc. All rights reserved.
Response Time Degradation Curve
Single User Region:• Typically slightly slower than best case.
• Think of it like “warming up your car on a cold day.”
Effective Performance Test Reports Page 23www.PerfTestPlus.com
© 2006 PerfTestPlus, Inc. All rights reserved.
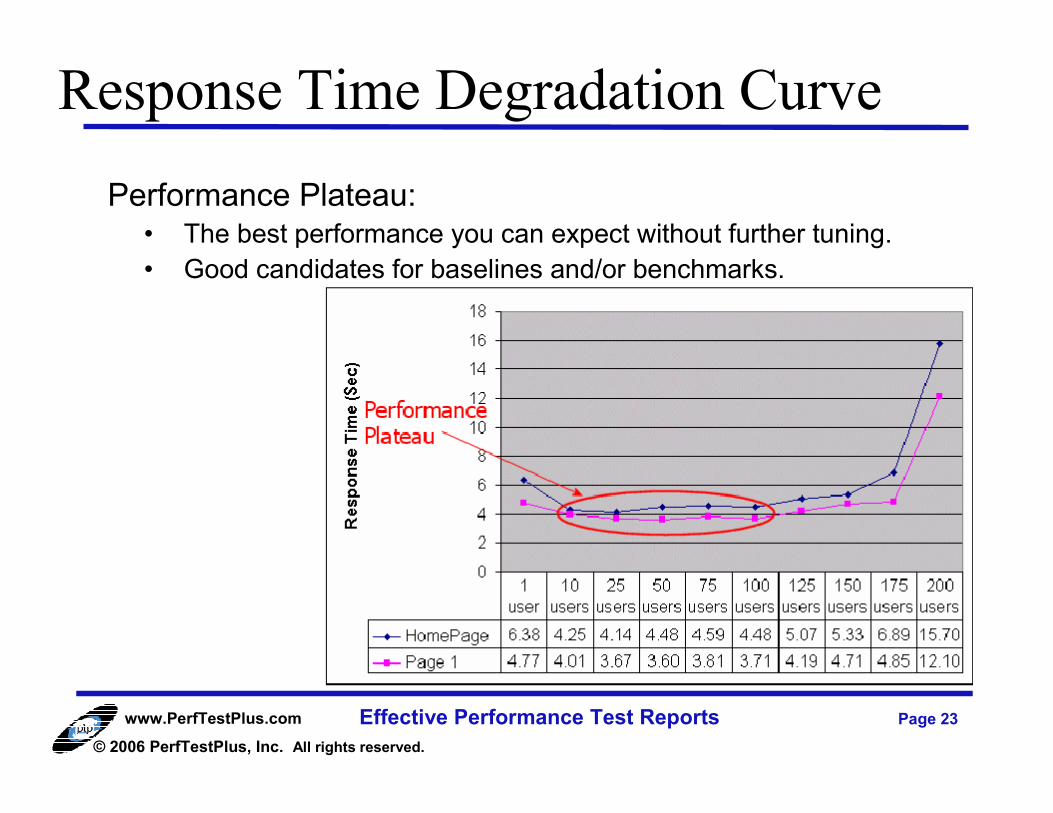
Response Time Degradation Curve
Performance Plateau:• The best performance you can expect without further tuning.
• Good candidates for baselines and/or benchmarks.

Effective Performance Test Reports Page 24www.PerfTestPlus.com
© 2006 PerfTestPlus, Inc. All rights reserved.
Response Time Degradation Curve
Stress Region:• Area where the application “degrades gracefully”.
• Max recommended user load is the beginning of the stress region.
Effective Performance Test Reports Page 25www.PerfTestPlus.com
© 2006 PerfTestPlus, Inc. All rights reserved.
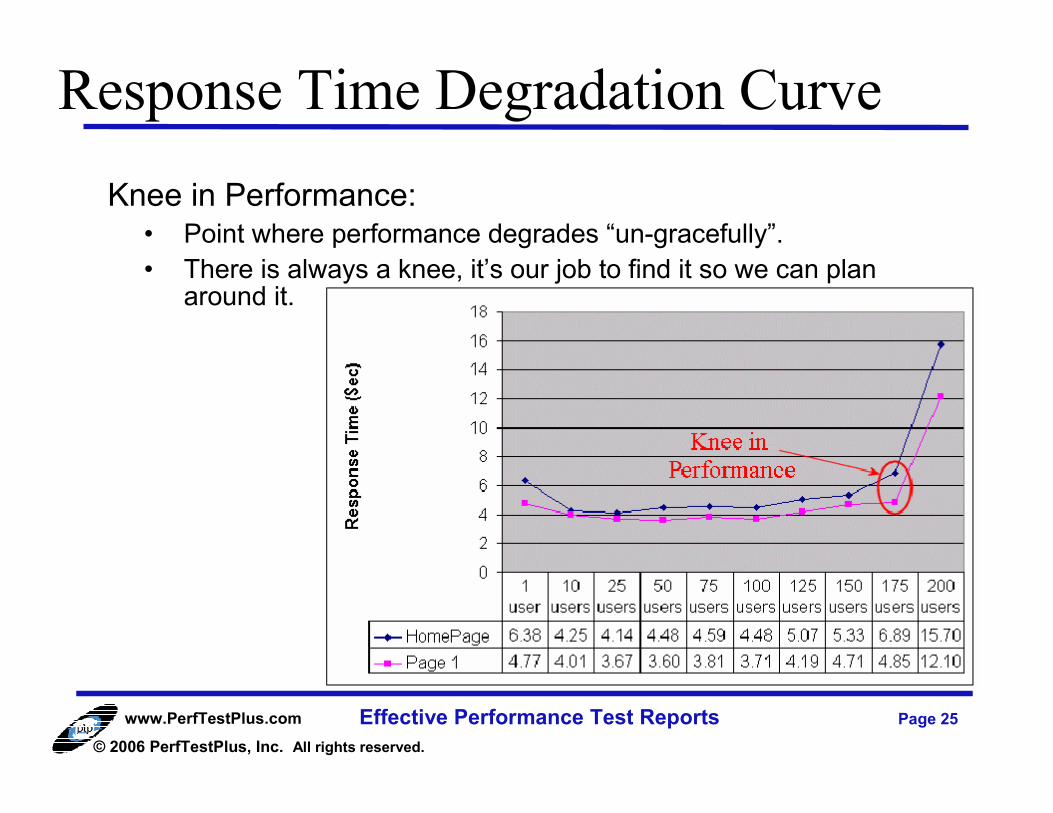
Response Time Degradation Curve
Knee in Performance:• Point where performance degrades “un-gracefully”.
• There is always a knee, it’s our job to find it so we can plan around it.

Effective Performance Test Reports Page 26www.PerfTestPlus.com
© 2006 PerfTestPlus, Inc. All rights reserved.
Response Time Degradation Curve
Min/Max/Expected Version:• Comparing performance based on various workload distributions.
• Yields a “confidence interval for predicted performance.”

Effective Performance Test Reports Page 27www.PerfTestPlus.com
© 2006 PerfTestPlus, Inc. All rights reserved.
Effective Performance Test Reports Page 28www.PerfTestPlus.com
© 2006 PerfTestPlus, Inc. All rights reserved.
Stakeholder Reactions
“These are great, but where’s the supporting data?”• All the data lives in TestManager and/or Excel.
• Include the spreadsheets as appendices with final report.
“Very pretty, but what do they mean?”• That’s why we always have a paragraph that tells what the
chart/table means, not what it says.
“Terrific! This is exactly what I wanted! Don’t worry about the final report — these will do nicely.”• As tempting as it may be – don’t do it. Write the report anyway…
trust me.

Effective Performance Test Reports Page 29www.PerfTestPlus.com
© 2006 PerfTestPlus, Inc. All rights reserved.
Comprehensive Final Report Template
Executive Summary!!!
Re-cap Acceptance Criteria (Requirements)
Re-Cap Workloads Actually Used
Summarize Tests Individually
Summarize Tuning Activity (System Modifications)
Summarize Results Collectively
Document Conclusions
Document Recommendations
Effective Performance Test Reports Page 30www.PerfTestPlus.com
© 2006 PerfTestPlus, Inc. All rights reserved.
Want More Information?
Information adapted from User Experience, not Metrics: Parts 6, 8, 9 and10 and Beyond Performance Testing: Part 2 located at http://www.rational.net (RDN) and http://www.PerfTestPlus.com (My site)
Good sources for additional information about Performance Testing:• http://www.PerfTestPlus.com (Methodology, Templates, Articles,
Presentations)
• http://www.loadtester.com (Good articles and links)
• http://www.keynote.com/resources/resource_library.html (Good articles and statistics)
Graphical Presentation of Information – Edward Tufte, PhD. http://www.edwardtufte.com (Books and seminars)

Effective Performance Test Reports Page 31www.PerfTestPlus.com
© 2006 PerfTestPlus, Inc. All rights reserved.

Effective Performance Test Reports Page 32www.PerfTestPlus.com
© 2006 PerfTestPlus, Inc. All rights reserved.
Scott Barber
Chief Technology Officer
PerfTestPlus, Inc
E-mail:
Web Site:
www.PerfTestPlus.com
Contact Info