Report: Final Screening Level Ecological Risk Assessment ...
US 93 Polson Corridor Study
Prepared For: City of Polson
Lake County
Confederated Salish & Kootenai Tribes
Montana Department of Transportation
Prepared By: Camp Dresser & McKee Inc.
Helena, Montana
First Level Screening Criteria

US 93 POLSON CORRIDOR PLANNING STUDY FIRST LEVEL SCREENING CRITERIA
MAY 10, 2011
Page i
Table of Contents Section 6.3 Improvement Option Screening Process ................................................................................... 1
6.1 Rating Factors ............................................................................................................................... 2
6.2 First Level Screening Criteria ......................................................................................................... 2
6.2.1 System Linkage and Function ................................................................................................ 2
6.2.2 Transportation Demand and Operation ............................................................................... 4
6.2.3 Roadway Geometrics ............................................................................................................ 6
6.2.4 Safety .................................................................................................................................... 8
6.2.5 Livability and Connectivity .................................................................................................... 9
6.2.6 Truck Traffic ........................................................................................................................ 13
6.2.7 Other ................................................................................................................................... 13
6.2.8 Weighted Average Scoring .................................................................................................. 16
6.2.9 First Level Screening Results ............................................................................................... 19
6.2.10 Refined Hybrid Alignments ................................................................................................. 24
6.3 References .................................................................................................................................. 25
List of Tables Table 6.1 Initial Screening Criteria Rating Factors ........................................................................................ 2
Table 6.2 Access Control Rating Factor ........................................................................................................ 3
Table 6.3 Rating for Principal Arterial Speed ............................................................................................... 4
Table 6.4 Future (2030) Rural Arterials’ Rating ............................................................................................ 5
Table 6.5 Future (2030) Urban Arterials’ Rating .......................................................................................... 6
Table 6.6 Right‐of‐Way Available for Non‐motorized Users Rating ............................................................ 6
Table 6.7 Horizontal Curve Design Criteria Rating ....................................................................................... 7
Table 6.8 Road and Bridge Design Criteria Rating ........................................................................................ 8
Table 6.9 Access Density per Mile Rating .................................................................................................... 8
Table 6.10 4(f) / 6(f) Resources Rating ....................................................................................................... 10
Table 6.11 Wetlands Rating ....................................................................................................................... 11
Table 6.12 Residential Parcels Impacted ................................................................................................... 11
Table 6.13 Sensitive Areas Rating .............................................................................................................. 12
Table 6.14 Parks and Recreation Connectivity Rating ............................................................................... 12
Table 6.15 Rating by Length of Grade Greater than Four Percent ............................................................ 13

US 93 POLSON CORRIDOR PLANNING STUDY FIRST LEVEL SCREENING CRITERIA
MAY 10, 2011
Page ii
Table 6.16 Planning Level Cost Rating ....................................................................................................... 14
Table 6.17 Utilities Incorporation Rating ................................................................................................... 15
Table 6.18 Rating for Community Preference............................................................................................ 15
Table 6.19 Maintenance Cost Rating ......................................................................................................... 16
Table 6.20 Importance of Objectives – Weighted Average Exercise for TOC Entities ............................... 17
Table 6.21 Weight Point System Assigned to Screening Criteria ............................................................... 19
Table 6.22 Summary of Corridor Need & Objectives Screening Criteria (First Level) ................................ 20
List of Figures Figure 6‐1 US 93 Polson Original Alignment Options ................................................................................... 1
Figure 6‐2 Hybrid Alignments Forwarded to Second Level of Screening ................................................... 25

US 93 POLSON CORRIDOR PLANNING STUDY FIRST LEVEL SCREENING CRITERIA
MAY 10, 2011
6‐1 | P a g e
Section 6.3 Improvement Option Screening Process Screening criteria were developed to assist in the evaluation of the eleven (11) potential alignments of
US 93 between RP 56.5 and RP 63.0. Screening criteria provide a means of reducing the range of
potential alignments for consideration by comparing them both quantitatively and qualitatively with a
set of specific measures. The screening process consisted of two screening steps. The “first level”
screening was a high level screen that was utilized to identify alignment options that satisfied the needs
and objectives laid forth previously, and subsequently could be carried forward for consideration in the
second level of screening. The second level of screening will be more detailed and will evaluate shifts in
traffic volumes, intersection operations, and potential impacts to safety.
The screening process described in this section illustrates each alignment’s ability to meet the screening
criteria and each alignment’s respective scoring. Figure 6‐1 depicts the eleven (11) alignments.
Figure 6‐1 US 93 Polson Original Alignment Options

US 93 POLSON CORRIDOR PLANNING STUDY FIRST LEVEL SCREENING CRITERIA
MAY 10, 2011
6‐2 | P a g e
6.1 Rating Factors In order to rate each screening criterion, rating factors were developed. Low, medium and high rating
factors were assigned to each screening criterion for each alignment. The factors represented the
likelihood of a screening criterion to meet the needs and objectives established for the corridor. Table
6.1 describes the impact rating factors.
Table 6.1 Initial Screening Criteria Rating Factors
Low Impact
Best Able to Meet Need & Objectives
Medium Impact
Moderately Able to Meet Need & Objectives
High Impact
Least Able to Meet Need & Objectives
A qualitative and quantitative comparison of each alignment against the needs identified for the US 93
corridor is described below. A matrix summary of the results of the first screening is shown in Table
6.22.
6.2 First Level Screening Criteria The needs and objectives previously defined for the US 93 corridor through Polson informed the
development of 18 screening criteria. The screening criteria were developed based on input by the
Technical Oversight Committee (TOC) and general public. The first level of screening evaluates 11
alignment options against the six (6) needs and objectives.
The primary concerns for the US 93 corridor are as follows:
system linkage and function,
transportation demand and operation,
roadway geometrics,
safety,
livability and connectivity, and
truck traffic.
6.2.1 System Linkage and Function System linkage and function of an alignment relates to the ability to implement access control, and to
maintain principal arterial speed. Two screening criteria were developed based on this need.

US 93 POLSON CORRIDOR PLANNING STUDY FIRST LEVEL SCREENING CRITERIA
MAY 10, 2011
6‐3 | P a g e
Access Control Access control is the condition in which the right of owners or occupants of land abutting a highway is
fully or partially controlled by public authority. Access control limits the conflicts with through traffic by
limiting the location and number of private and public approaches. (Pizzini 2007) Access control is more
difficult to implement in a developed corridor because of the multiple existing private and public
approaches that exist. From an access control perspective, the rating factors take into consideration the
general distance which an alignment travels through types of land as follows:
Range of Access Control Rating Factor
Less Developed Land
Some Developed Land
Mostly Developed Land
Table 6.2 Access Control Rating Factor
EIS Alignments QUANTM Alignments
1 2 3 4 5 6 7 8 South
Bridge
Central
Bridge
North
Bridge
Rating
Factor
Principal Arterial Speeds The second criterion under System Linkage and Function is the principal arterial speed of the
alignments. The concept of traffic channelization provides for a hierarchy of highway systems that
allows for functional specialization in meeting both access and mobility requirements. Principal arterials
are designed to provide a high level of mobility for through movement. Alignments that cross through
developed areas, such as the city, are considered urban and would therefore be subject to speed
reduction. Conversely, alignments that stay within rural land would be able to maintain the higher
speeds assigned to rural principal arterials. From a principal arterial speed perspective, the rating
factors are measured against the distance which an alignment travels within city limits as follows:
Range for Principal Arterial Speeds Rating Factor
Does not enter City Limits
Some Distance within City Limits
Mostly within City Limits

US 93 POLSON CORRIDOR PLANNING STUDY FIRST LEVEL SCREENING CRITERIA
MAY 10, 2011
6‐4 | P a g e
Table 6.3 Rating for Principal Arterial Speed
EIS Alignments QUANTM Alignments
1 2 3 4 5 6 7 8 South
Bridge
Central
Bridge
North
Bridge
Rating
Factor
6.2.2 Transportation Demand and Operation To accommodate existing and future transportation demand on US 93 through the planning horizon of
the year 2030 and fulfill the needs and objectives, an alignment must maintain roadway traffic flow at a
Level B or better for rural principal arterials and Level C or better for urban principal arterials.
Additionally, an alignment would need to have ROW available to provide for non‐motorized users.
There are three screening criteria under this need.
Rural Arterials Arterials provide the highest level of mobility, at the highest speed, for long uninterrupted travel. The
roadway operational performance standard for a rural principal arterial is a level of service of B or
better. To quantify the operational performance of those segments of the various alignments that are
likely to perform as a rural principal arterial, the TransCad travel demand model was utilized. The
TransCad model was used to evaluate each of the 11 alignments, and the volume‐to‐capacity (v/c) ratios
were examined along both the existing US 93 corridor and the proposed alignment. For the screening,
v/c ratios that were less than 0.59 were identified for all of the alignments under existing year
conditions (2010) as well as future year conditions (year 2030). V/c ratios less than 0.59 correspond to a
level of service of B or better. Accordingly, all proposed alignments were found to operate at a level of
service B or better under 2010 and 2030 traffic conditions, and are therefore not explicitly included in
Table 6.4. However, the ability of each alignment to pull traffic off US 93 caused a variance in the v/c
ratios on the existing US 93. Table 6.4 describes the percentage of the existing US 93, outside of city
limits, that operates at a level of service C or worse once traffic is diverted to the respective proposed
alignments. The range developed for the rating factors were initially based on third points between 0
and 100 percent, however in reviewing the actual data it was determined to use a range of less than 20
percent, and greater than 60 percent, to realize rating factors that correlated better to the data
observed.
Range for Rural LOS B Rating Factor
Less than 20 percent
20 to 60 percent
Greater than 60 percent

US 93 POLSON CORRIDOR PLANNING STUDY FIRST LEVEL SCREENING CRITERIA
MAY 10, 2011
6‐5 | P a g e
Table 6.4 Future (2030) Rural Arterials’ Rating
Existing US 93
Rating Factor
EIS Alignments QUANTM Alignments
1 2 3 4 5 6 7 8 South
Bridge
Central
Bridge
North
Bridge
Percent of US 93
(Rural) >0.59 100% 23% 23% 11% 23% 23% 11% 11% 23% 11‐16% 23%
2030 Rating
Factor
Urban Arterials The urban principal arterial system serves major metropolitan centers, corridors with the highest traffic
volumes, and those with the longest trip lengths. It carries most trips entering and leaving urban areas,
and it provides continuity for all rural arterials that intercept urban boundaries. (State of Montana
Department of Transportation 2008)
The roadway operational performance standard for an urban principal arterial is a level of service of C or
better. To quantify the operational performance of those segments of the various alignments that are
likely to perform as an urban principal arterial, the TransCad travel demand model was utilized. The
TransCad model was used to evaluate each of the 11 alignments, and the v/c ratios were examined
along the existing US 93 corridor and the proposed alignment. For the screening, v/c ratios that were
less than 0.79 were identified for all of the alignments under existing year conditions (2010), as well as
future year conditions (year 2030). Accordingly, all proposed alignments were found to operate at a
level of service C or better under 2010 and 2030 traffic conditions, and are therefore not explicitly
included in Table 6.5. However, Table 6.5 does include ratings for the existing US 93 performance under
future conditions (year 2030), as noted. The range developed for the rating factors were based on third
points between 0 and 100 percent.
Range for Urban LOS C Rating Factor
Less than 33 percent
33 to 67 percent
Greater than 67 percent

US 93 POLSON CORRIDOR PLANNING STUDY FIRST LEVEL SCREENING CRITERIA
MAY 10, 2011
6‐6 | P a g e
Table 6.5 Future (2030) Urban Arterials’ Rating
Existing US 93
Rating Factor
EIS Alignments QUANTM Alignments
1 2 3 4 5 6 7 8 South
Bridge
Central
Bridge
North
Bridge
Percent of US 93
(Urban) >0.79 28% 29% 41% 29% 29% 27% 25% 29% 42% 29‐41% 29%
2030 Rating
Factor
Right-of-Way for Non-motorized Users The availability of right‐of‐way needed to provide for non‐motorized users depends on the current land
use of the area through which an alignment crosses. In an urban/developed area, there are multiple
buildings and other constraints that could impede the acquisition of land needed for a smaller facility
such as a sidewalk or shared bicycle/pedestrian path to accommodate non‐motorized users. In areas
where there are numerous existing buildings and/or other constraints, the area was considered to be
“highly constrained”. If the area an alignment crosses is primarily vacant pasture or agricultural land
with few existing buildings and/or other constraints, the area was considered to be “minimally
constrained”. Rating factors were assigned based on field observations regarding the built‐up nature
along the alignment paths, as well as a review of aerial photographs. Rating factors for this screening
criterion are as follows:
Range for ROW Available Rating Factor
Minimally Constrained Area
Moderately Constrained Area
Highly Constrained Area
Table 6.6 Right‐of‐Way Available for Non‐motorized Users Rating
EIS Alignments QUANTM Alignments
1 2 3 4 5 6 7 8 South
Bridge
Central
Bridge
North
Bridge
Rating
Factor
6.2.3 Roadway Geometrics To provide a facility that accommodates the diversity of vehicle types and fulfills the objectives for the
US 93 corridor, potential screening criteria were developed that would meet the roadway geometric
need and objectives. In order to meet these objectives and needs, an alignment would need to meet
US 93 POLSON CORRIDOR PLANNING STUDY FIRST LEVEL SCREENING CRITERIA
MAY 10, 2011
6‐7 | P a g e
horizontal curve, and road and bridge width, design standards. There are two screening criteria under
this need.
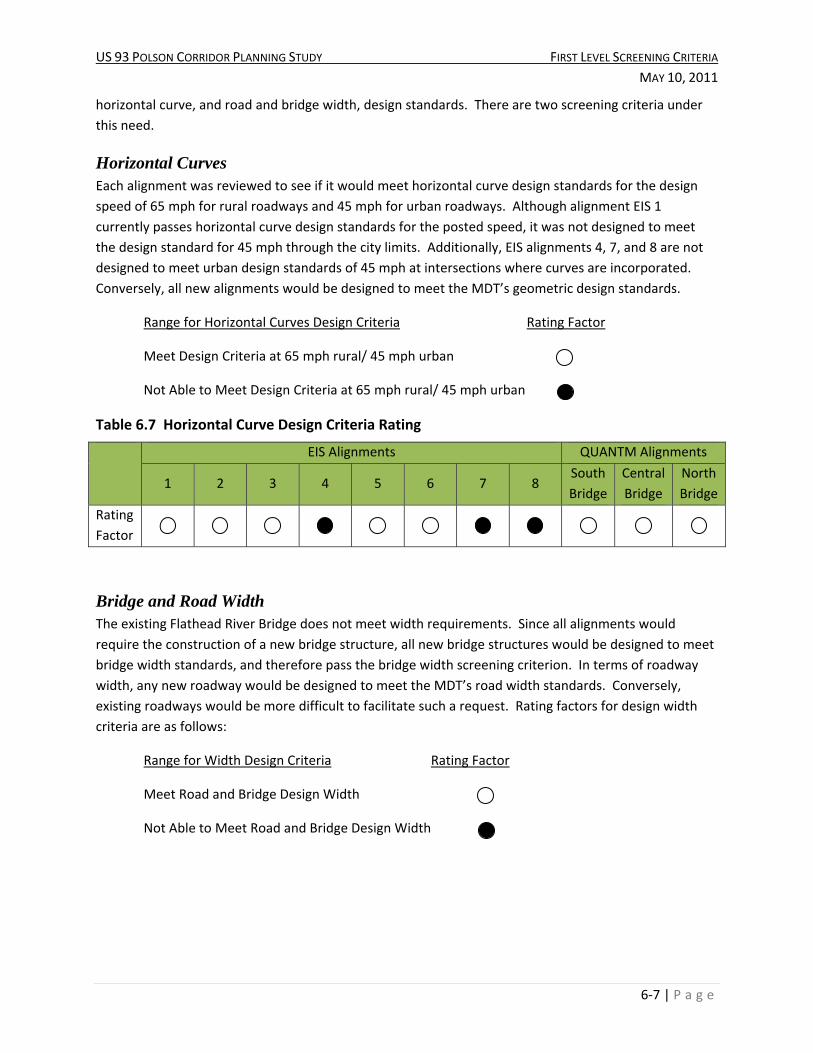
Horizontal Curves Each alignment was reviewed to see if it would meet horizontal curve design standards for the design
speed of 65 mph for rural roadways and 45 mph for urban roadways. Although alignment EIS 1
currently passes horizontal curve design standards for the posted speed, it was not designed to meet
the design standard for 45 mph through the city limits. Additionally, EIS alignments 4, 7, and 8 are not
designed to meet urban design standards of 45 mph at intersections where curves are incorporated.
Conversely, all new alignments would be designed to meet the MDT’s geometric design standards.
Range for Horizontal Curves Design Criteria Rating Factor
Meet Design Criteria at 65 mph rural/ 45 mph urban
Not Able to Meet Design Criteria at 65 mph rural/ 45 mph urban
Table 6.7 Horizontal Curve Design Criteria Rating
EIS Alignments QUANTM Alignments
1 2 3 4 5 6 7 8 South
Bridge
Central
Bridge
North
Bridge
Rating
Factor
Bridge and Road Width The existing Flathead River Bridge does not meet width requirements. Since all alignments would
require the construction of a new bridge structure, all new bridge structures would be designed to meet
bridge width standards, and therefore pass the bridge width screening criterion. In terms of roadway
width, any new roadway would be designed to meet the MDT’s road width standards. Conversely,
existing roadways would be more difficult to facilitate such a request. Rating factors for design width
criteria are as follows:
Range for Width Design Criteria Rating Factor
Meet Road and Bridge Design Width
Not Able to Meet Road and Bridge Design Width

US 93 POLSON CORRIDOR PLANNING STUDY FIRST LEVEL SCREENING CRITERIA
MAY 10, 2011
6‐8 | P a g e
Table 6.8 Road and Bridge Design Criteria Rating
EIS Alignments QUANTM Alignments
1 2 3 4 5 6 7 8 South
Bridge
Central
Bridge
North
Bridge
Rating
Factor
6.2.4 Safety As stated previously, there is a need to select an alignment that can maintain travel speeds for a
principal arterial. In order to maintain the safest roadway environment possible with the desired travel
speeds, the selected alignment must manage public access points and private approaches. One way to
measure the ability to meet this need is by investigating access density per mile. This is the only
screening criterion under this need.
Access Density In this analysis the total number of access points along each alignment was counted. Access points
included each business entrance, private driveway, and street connection. To make this comparison
relative to a common unit, the final number of accesses was divided by the total alignment length, in
miles, to obtain a density of accesses per mile. Table 6.9 shows the results of this analysis, along with
the assigned rating factor.
Range for Access Densities per Mile Rating Factor
Less than or equal to 5
6 less than or equal to 14
Greater than or equal to 15
Table 6.9 Access Density per Mile Rating
EIS Alignments QUANTM Alignments
1 2 3 4 5 6 7 8 South
Bridge
Central
Bridge
North
Bridge
Access
Density
per Mile
20 4 4 15 3 3 20 18 4 4 5
Rating
Factor

US 93 POLSON CORRIDOR PLANNING STUDY FIRST LEVEL SCREENING CRITERIA
MAY 10, 2011
6‐9 | P a g e
6.2.5 Livability and Connectivity To minimize impacts to neighborhoods and to environmental, sensitive, and recreational resources,
each alignment was compared with regard to the number of 4(f) / 6(f) resources, residential parcels,
sensitive areas, and wetlands impacted, as well as the connectivity to public parks and recreation. There
are five screening criteria under this need.
4(f) / 6(f) Resources The number of 4(f) / 6(f) resources potentially impacted by an alignment ranges from 0 to 4. Potential
4(f) / 6(f) resources impacts, along with their respective rating factors for each alignment, are described
in Table 6.10. A potential impact to a 4(f) / 6(f) resource was noted if any portion of an alignment
“swath”, as shown on Figure 6‐1, appeared to touch or cross a defined resource. This was assessed in
this manner as a “worst case” scenario. The accounting of potential 4(f) / 6(f) resource impacts does not
include potential impacts to eligible historic homes and/or other structures.
Range for 4(f) / 6(f) Resources Rating Factor
No resource impacted
1 or 2 resources impacted
3 or 4 resources impacted

US 93 POLSON CORRIDOR PLANNING STUDY FIRST LEVEL SCREENING CRITERIA
MAY 10, 2011
6‐10 | P a g e
Table 6.10 4(f) / 6(f) Resources Rating
Alignment ID 4(f) / 6(f) Resource(s) Potentially Impacted * Number of 4(f) / 6(f)
Resources
Rating
Factor
EIS Alignmen
ts
1 Ducharme Park, Waterfront Facilities,
Riverside Park, Polson 5‐64
2 Sports Complex 1
3 ‐‐ 0
4 Cherry Valley School, Sports Complex 2
5 ‐‐ 0
6 Sports Complex 1
7 Linderman Elementary School, Riverside Park 2
8 Polson 5‐6 1
QUANTM
Alignments
Southern
Bridge ‐‐ 0
Central
Bridge ‐‐ 0
North
Bridge Sports Complex 1
Does not include potential impacts to eligible historic homes and/or other structures.
Wetlands Wetlands were identified throughout the study area and are documented in the Environmental Scan.
The number of wetlands potentially impacted by an alignment ranges from zero to four. Comparative
results of this analysis are shown in Table 6.11.
Range for Wetlands Rating Factor
No wetlands impacted
1 or 2 wetlands impacted
3 or 4 impacted wetlands

US 93 POLSON CORRIDOR PLANNING STUDY FIRST LEVEL SCREENING CRITERIA
MAY 10, 2011
6‐11 | P a g e
Table 6.11 Wetlands Rating
EIS Alignments QUANTM Alignments
1 2 3 4 5 6 7 8 South
Bridge
Central
Bridge
North
Bridge
Wetlands
Impacted 1 0 1 1 1 2 1 2 0 2 4
Rating
Factor
Residential Parcels The number of residential parcels impacted by an alignment ranges from 4 to 132. To determine the
rating factor for this category, the range of residential parcels potentially impacted was divided evenly
into three groups: low, medium and high impact. Table 6.12 shows the number of potentially impacted
parcels, and rating factor, for each of the alignments.
Range for Residential Parcels Rating Factor
low impact: 0 to 46 parcels impacted
medium impact: 47 to 89 parcels impacted
high impact: > 90 parcels impacted
Table 6.12 Residential Parcels Impacted
EIS Alignments QUANTM Alignments
1 2 3 4 5 6 7 8 South
Bridge
Central
Bridge
North
Bridge
Impacted
Parcels 71 29 19 68 61 68 <46* 132 26‐27 17 4‐18
Rating
Factor
*Note: This assumes the existing roadway for EIS Alignment 7 (one‐way couplet) would be reconfigured within the existing
right‐of‐way prism which would therefore only result in impacts where right‐of‐way for construction would be needed.
Sensitive Areas Many sensitive areas were identified throughout the study area as documented in the Environmental
Scan. The number of sensitive areas potentially impacted by an alignment ranges from 0 to two.
Comparative results of this analysis are shown in Table 6.13.

US 93 POLSON CORRIDOR PLANNING STUDY FIRST LEVEL SCREENING CRITERIA
MAY 10, 2011
6‐12 | P a g e
Range for Sensitive Areas Rating Factor
No sensitive area impacted
1 sensitive area impacted
2 sensitive areas impacted
Table 6.13 Sensitive Areas Rating
EIS Alignments QUANTM Alignments
1 2 3 4 5 6 7 8 South
Bridge
Central
Bridge
North
Bridge
Areas
Impacted 1 1 0 0 1 0 0 0 2 1 2
Rating
Factor
Connectivity to public parks and recreation Based on local input, an element of the screening process needed to be responsive to land use plans
such as connectivity to public parks and recreation wherever practicable. Rating factors were assigned
based on the relative distance through which the alignments traversed the grid system within the city
limits. Alignments that were far away from the grid system, or only entered the system for a few blocks,
would not provide this desired connectivity. Conversely, alignments that were within the grid of the city
had more potential to connect public parks and recreational areas, and were therefore given a more
desirable rating. This analysis is shown below.
Range for Connectivity Rating Factor
Mostly Within City Grid System
Within Grid and Remote Locations
Mostly Remote Location
Table 6.14 Parks and Recreation Connectivity Rating
EIS Alignments QUANTM Alignments
1 2 3 4 5 6 7 8 South
Bridge
Central
Bridge
North
Bridge
Rating
Factor

US 93 POLSON CORRIDOR PLANNING STUDY FIRST LEVEL SCREENING CRITERIA
MAY 10, 2011
6‐13 | P a g e
6.2.6 Truck Traffic In the corridor study area, US 93 realizes a diverse mix of traffic, including trucks, recreational vehicles,
and tourism related traffic and passenger vehicles. To minimize the impacts of truck traffic to the
existing US 93, and fulfill the needs and objectives previously discussed, the TOC found it important to
screen alignments based on the length of grades greater than 4 percent. This is the only screening
criterion under this need.
Length of Grades Vertical grades greater than four percent require a design exception. Not only do these steeper grades
require a design exception, but they are undesirable for truck drivers. Alignments with steep grades
may not draw the desired truck traffic away from the existing US 93 facility, especially in the downtown
area. Therefore, the longer lengths of grade, greater than the current MDT design standard of four
percent, receive a less desirable rating. To determine the rating factor for this category, the range of
lengths was divided into three groups as listed below. Table 6.15 shows the rating factor for each of the
alignments.
Range for Length of Grades Rating Factor
Less than 5000 feet
5000 to 7500 feet
Greater than 7500 feet
Table 6.15 Rating by Length of Grade Greater than Four Percent
EIS Alignments QUANTM Alignments
1 2 3 4 5 6 7 8 South
Bridge
Central
Bridge
North
Bridge
Length
(ft) 8600 6790 6740 >7500 7770 7040 >7500 >7500 4050
6300‐
8840 8540
Rating
Factor
6.2.7 Other The TOC identified four other criteria in which to screen the alignments. These include the overall
planning level cost, the ability of utilities to be incorporated into bridge location and design, community
preference, and maintenance cost. Each of these final screening criteria is described herein.
Planning Level Cost High level planning cost estimates were prepared for each of the eleven potential alignments that were
considered. The planning level cost estimates were primarily for construction costs (i.e. did not include

US 93 POLSON CORRIDOR PLANNING STUDY FIRST LEVEL SCREENING CRITERIA
MAY 10, 2011
6‐14 | P a g e
detailed right‐of‐way costs, project development costs, utility relocation costs, inflation, etc.). To
develop the planning level cost estimates, line item costs for cut, fill, borrow, demolition, paving, mass
haul, retaining walls, culverts, bridges, footprint areas, and road costs were generated for the
alignments. The results of the planning level cost estimates are shown in Table 6.16. The rating factors
were measured against the highest range of costs for each alignment, with ranges calculated for the
three possible ratings:
Range of Planning Level Costs Rating Factor
Less than $30,000,000
Between $30,000,000 and $40,000,000
Greater than $40,000,000
Table 6.16 Planning Level Cost Rating
EIS Alignments QUANTM Alignments
1 2 3 4 5 6 7 8 South
Bridge
Central
Bridge
North
Bridge
Planning
Level
Cost
$23.7
to
28.4M
$34.7
to
41.6M
$30.4
to
36.4M
$27.8
to
33.4M
$41.0
to
44.1M
$45.0
to
48.8M
$22.1
to
26.5M
$26.9
to
32.3M
$37.0
to
47.2M
$36.0
to
43.5M
$33.0
to
39.1M
Rating
Factor
Incorporation of Utilities into Bridge Location and Design Based on TOC input, it was agreed that any alignment should attempt to be responsive to local sewer
and water planning documents. To uphold the goals set forth in these planning documents, rating
factors were assigned based on the ability of utility lines (i.e. water and sewer) to be incorporated into
the alignment, coupled with the alignment’s ability to perpetuate long‐term utility needs in accordance
with overall infrastructure requirements. As such, alignments closest to the current bridge were rated
higher than alignments with bridge locations that would be constructed further away.
Range of Utilities Rating Factor
North Bridge Location
Central Bridge Location
South Bridge Location

US 93 POLSON CORRIDOR PLANNING STUDY FIRST LEVEL SCREENING CRITERIA
MAY 10, 2011
6‐15 | P a g e
Table 6.17 Utilities Incorporation Rating
EIS Alignments QUANTM Alignments
1 2 3 4 5 6 7 8 South
Bridge
Central
Bridge
North
Bridge
Rating
Factor
Community Preference An additional criterion considered in the first level screening process was whether the alignment had the
support of the community. Community preference is an important screening criterion because if the
community does not support an alignment early in the planning process there is likelihood that the
alignment will not be supported as a project moves forward. Community preference was solicited on
general corridor areas via written and verbal feedback at the informational meetings, solicitation of
comments via the study website, and personal conversations with members of the community. Input
from the TOC was offered throughout the process to help refine the community’s preferences. EIS
Alignments 3, 4, 5, 6 and the Central Bridge Crossing received low support due to various factors,
including potential impacts to residential housing areas. EIS Alignments 1, 2, and 7 received a relatively
equal amount of support and opposition. EIS Alignment 8, and the South and North Bridge Crossing
alignments, received the highest support from the community. Table 6.18 shows the results of the
community preference assessment.
Range of Community Preference Rating Factor
High Community Preference
Medium Community Preference
Low Community Preference
Table 6.18 Rating for Community Preference
EIS Alignments QUANTM Alignments
1 2 3 4 5 6 7 8 South
Bridge
Central
Bridge
North
Bridge
Rating
Factor
Maintenance Cost A query of the statewide average maintenance cost resulted in an average maintenance cost of $4300
per lane mile. All new alignments include the maintenance cost of not only the new alignment, but also
of the current US 93 alignment. Since all alignments are two‐lane facilities, this factor is primarily
dependent upon the length of the alignment.

US 93 POLSON CORRIDOR PLANNING STUDY FIRST LEVEL SCREENING CRITERIA
MAY 10, 2011
6‐16 | P a g e
Range of Maintenance Costs Rating Factor
Less than $100,000
Between $100,000 and $125,000
Greater than $125,000
Table 6.19 Maintenance Cost Rating
EIS Alignments QUANTM Alignments
1 2 3 4 5 6 7 8 South
Bridge
Central
Bridge
North
Bridge
Length (mi) 6.5 5.74 6.48 3.25 5.17 6.64 2.6 2.49 6.65 6.06 5.53
Maintenance.
Cost ($1000) 95 127* 133* 105* 122* 135* 100* 99* 135* 130* 125*
Rating Factor
*Note: The cost of maintenance to this alignment includes both the current US 93 facility (approximately $77,000)
and the new alignment.
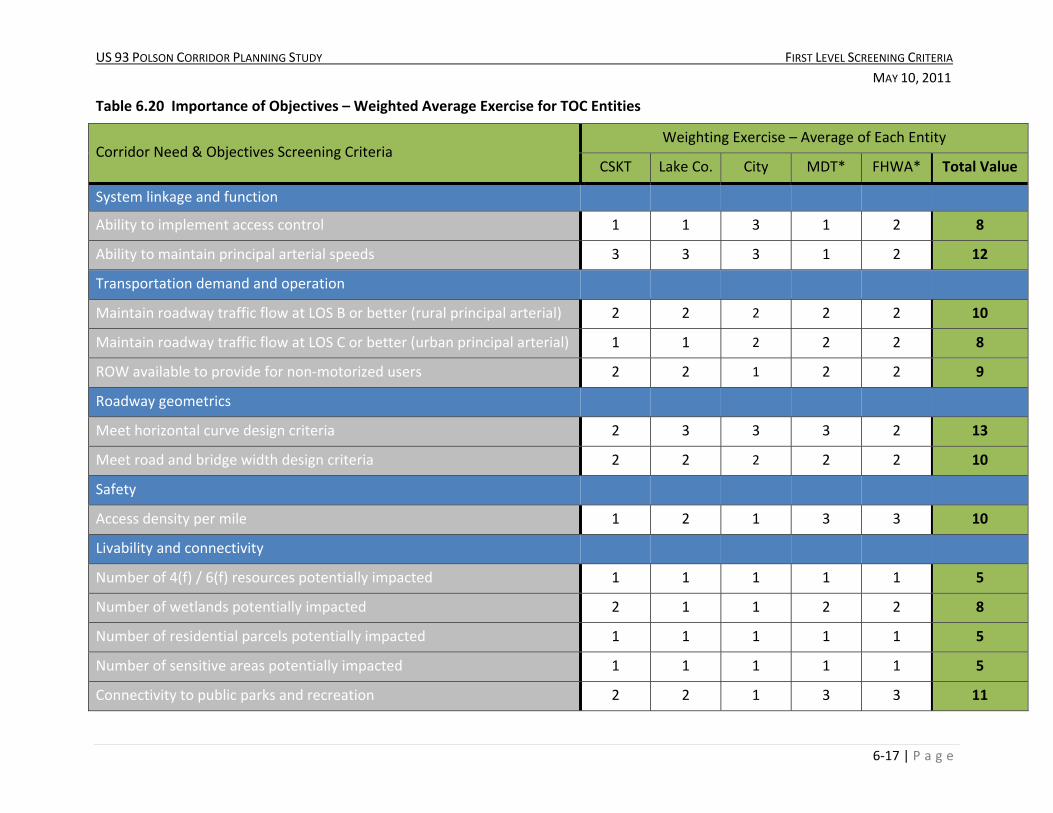
6.2.8 Weighted Average Scoring Part of the screening process included querying the TOC to identify which criteria was of most
importance and least importance to the constituents they represent. Accordingly, each TOC member
was asked to rate the screening criteria into thirds by assigning the top third of the eighteen screening
criteria a numerical value of 1, the middle third of the eighteen screening criteria a numerical value of 2,
and the bottom third of the screening criteria a numerical value of 3. TOC member scores for each of
the criteria were totaled. The results of this exercise are shown in Table 6.20. These totals were divided
into four categories of importance. Weighting for the highest importance was given a “1”, high
importance a “5”, medium importance an “8” and lowest importance a “10”. Each empty circle was
given zero points, each half circle was given half of the category points, and circles that were filled in
received the full number of possible points for that screening criterion. Scoring of the objectives is
described in Table 6.21.
US 93 POLSON CORRIDOR PLANNING STUDY FIRST LEVEL SCREENING CRITERIA
MAY 10, 2011
6‐17 | P a g e
Table 6.20 Importance of Objectives – Weighted Average Exercise for TOC Entities
Corridor Need & Objectives Screening Criteria Weighting Exercise – Average of Each Entity
CSKT Lake Co. City MDT* FHWA* Total Value
System linkage and function
Ability to implement access control 1 1 3 1 2 8
Ability to maintain principal arterial speeds 3 3 3 1 2 12
Transportation demand and operation
Maintain roadway traffic flow at LOS B or better (rural principal arterial) 2 2 2 2 2 10
Maintain roadway traffic flow at LOS C or better (urban principal arterial) 1 1 2 2 2 8
ROW available to provide for non‐motorized users 2 2 1 2 2 9
Roadway geometrics
Meet horizontal curve design criteria 2 3 3 3 2 13
Meet road and bridge width design criteria 2 2 2 2 2 10
Safety
Access density per mile 1 2 1 3 3 10
Livability and connectivity
Number of 4(f) / 6(f) resources potentially impacted 1 1 1 1 1 5
Number of wetlands potentially impacted 2 1 1 2 2 8
Number of residential parcels potentially impacted 1 1 1 1 1 5
Number of sensitive areas potentially impacted 1 1 1 1 1 5
Connectivity to public parks and recreation 2 2 1 3 3 11

US 93 POLSON CORRIDOR PLANNING STUDY FIRST LEVEL SCREENING CRITERIA
MAY 10, 2011
6‐18 | P a g e
Corridor Need & Objectives Screening Criteria Weighting Exercise – Average of Each Entity
CSKT Lake Co. City MDT* FHWA* Total Value
Truck traffic
Length of grades greater than 4 percent 3 2 3 2 1 11
Other
Overall planning level cost 2 3 3 2 3 13
Ability of utilities to be incorporated into bridge location and design 3 2 2 3 3 13
Community preference 1 1 2 1 1 6
Maintenance cost 3 3 2 3 2 13
*Note: The weighting exercise for these stakeholders resulted in an average of multiple individuals involved. Rounding of average results led to final values
contained in this table.

US 93 POLSON CORRIDOR PLANNING STUDY FIRST LEVEL SCREENING CRITERIA
MAY 10, 2011
6‐19 | P a g e
Table 6.21 Weight Point System Assigned to Screening Criteria
Total Points
from Table 6.20
Corresponding Level of
Importance
Highest Possible
Points given to
Objectives
Corresponding Points for each of the
Rating Factors
5 to 7 Highest Importance 1.0 0.0 0.5 1.0
8 or 9 High Importance 5.0 0.0 2.5 5.0
10 or 11 Moderate Importance 8.0 0.0 4.0 8.0
12 to 14 Low Importance 10.0 0.0 5.0 10.0
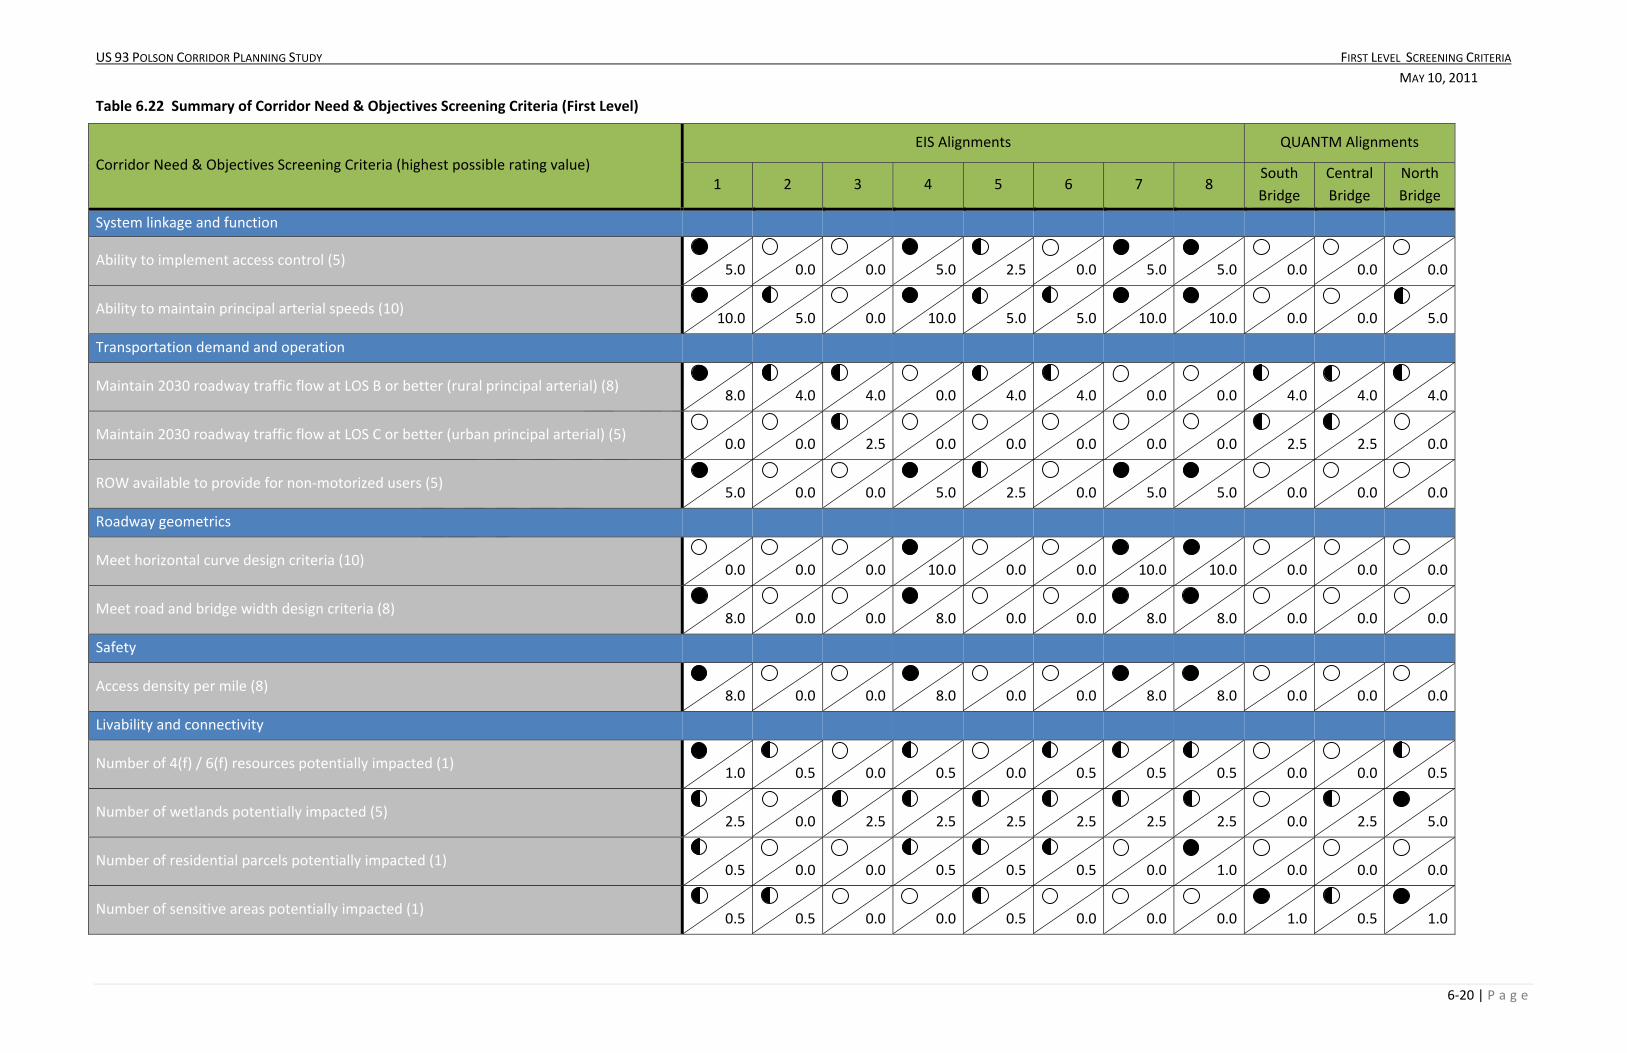
6.2.9 First Level Screening Results This scoring system helped identify which alignments could be dropped from further consideration and
which alignments should be carried forward to the second level of screening. Options with the lowest
overall numerical value were kept for further consideration and are detailed in Table 6.22. The
remaining alignments, which were dropped from further consideration, are also presented in Table 6.22
for completeness.
US 93 POLSON CORRIDOR PLANNING STUDY FIRST LEVEL SCREENING CRITERIA
MAY 10, 2011
6‐20 | P a g e
Table 6.22 Summary of Corridor Need & Objectives Screening Criteria (First Level)
Corridor Need & Objectives Screening Criteria (highest possible rating value)
EIS Alignments QUANTM Alignments
1 2 3 4 5 6 7 8 South
Bridge
Central
Bridge
North
Bridge
System linkage and function
Ability to implement access control (5) 5.0 0.0 0.0 5.0 2.5 0.0
5.0
5.0
0.0 0.0 0.0
Ability to maintain principal arterial speeds (10) 10.0 5.0 0.0 10.0 5.0 5.0
10.0
10.0
0.0 0.0 5.0
Transportation demand and operation
Maintain 2030 roadway traffic flow at LOS B or better (rural principal arterial) (8) 8.0 4.0 4.0 0.0 4.0 4.0
0.0
0.0
4.0 4.0 4.0
Maintain 2030 roadway traffic flow at LOS C or better (urban principal arterial) (5) 0.0 0.0 2.5 0.0 0.0 0.0
0.0
0.0
2.5 2.5 0.0
ROW available to provide for non‐motorized users (5) 5.0 0.0 0.0 5.0 2.5 0.0
5.0
5.0
0.0 0.0 0.0
Roadway geometrics
Meet horizontal curve design criteria (10) 0.0 0.0 0.0 10.0 0.0 0.0
10.0
10.0
0.0 0.0 0.0
Meet road and bridge width design criteria (8) 8.0 0.0 0.0 8.0 0.0 0.0
8.0
8.0
0.0 0.0 0.0
Safety
Access density per mile (8) 8.0 0.0 0.0 8.0 0.0 0.0
8.0
8.0
0.0 0.0 0.0
Livability and connectivity
Number of 4(f) / 6(f) resources potentially impacted (1) 1.0 0.5 0.0 0.5 0.0 0.5
0.5
0.5
0.0 0.0 0.5
Number of wetlands potentially impacted (5) 2.5 0.0 2.5 2.5 2.5 2.5
2.5
2.5
0.0 2.5 5.0
Number of residential parcels potentially impacted (1) 0.5 0.0 0.0 0.5 0.5 0.5
0.0
1.0
0.0 0.0 0.0
Number of sensitive areas potentially impacted (1) 0.5 0.5 0.0 0.0 0.5 0.0
0.0
0.0
1.0 0.5 1.0

US 93 POLSON CORRIDOR PLANNING STUDY FIRST LEVEL SCREENING CRITERIA
MAY 10, 2011
6‐21 | P a g e
Corridor Need & Objectives Screening Criteria (highest possible rating value)
EIS Alignments QUANTM Alignments
1 2 3 4 5 6 7 8 South
Bridge
Central
Bridge
North
Bridge
Connectivity to public parks and recreation (8) 0.0 4.0 8.0 0.0 4.0 4.0
0.0
0.0
8.0 8.0 4.0
Truck traffic
Length of grades greater than 4 percent (8) 8.0 4.0 4.0 8.0 8.0 4.0
8.0
8.0
0.0 8.0 8.0
Other
Overall planning level cost (10) 0.0 10.0 5.0 5.0 10.0 10.0
0.0
5.0
10.0 10.0 5.0
Ability of utilities to be incorporated into bridge location and design (10) 0.0 0.0 5.0 0.0 5.0 0.0
0.0
0.0
10.0 5.0 0.0
Community preference (1) 0.5 0.5 1.0 1.0 1.0 1.0
0.5
0.0
0.0 1.0 0.0
Maintenance cost (10) 0.0 10.0 10.0 5.0 5.0 10.0
5.0
0.0
10.0 10.0 5.0
Screen Result 57 38.5 42 68.5 50.5 41.5 62.5 63 45.5 51.5 37.5
US 93 POLSON CORRIDOR PLANNING STUDY FIRST LEVEL SCREENING CRITERIA
MAY 10, 2011
6‐22 | P a g e
Based on results of the first level of screening, it can be seen that five (5) alignment options score lowest
out of the eleven total alignments considered. These five (5) alignments were selected based on their
point ratings as measured against all 11 alignments. The point ratings for each alignment that were
within a range of 10 points or less were identified and selected for consideration. These include the
following:
North bridge crossing (score of 37.5)
EIS alignment 2 (score 38.5)
EIS alignment 6 (score 41.5)
EIS alignment 3 (score 42)
South bridge crossing (score 45.5)
The remaining six (6) alignments that scored outside the point margin were dropped from further
consideration. Reasons for exclusion of each of the alternatives are detailed below.
EIS Alignment 1
Alignment 1 was unable to accommodate eight of the 18 screening criteria and was moderately able to
accommodate 4 other screening criteria. Because this alignment traverses the heart of Polson’s
business district, there is a high access density. It would be difficult to implement access control
throughout the urban sections of this alignment. It would also be difficult to receive the public’s and
businesses’ support for widening the roadway footprint to accompany non‐motorized users, or to bring
the roadway up to current MDT design standards. Although this alignment is being dropped from
further consideration, there will be improvements required along the existing US 93 during the twenty‐
year planning horizon. Potential improvements to the existing US 93 will be identified in the Polson
Area Transportation Plan, which is currently under development at this time.
This alignment has the potential to impact a moderate number of residential parcels and sensitive areas,
and has the potential to impact the highest number of 4(f) and 6(f) resources. This alignment received
minimal support from the community.
EIS Alignment 4
Alignment 4 was unable to meet eight of the 18 screening criteria and was moderately able to meet five
other screening criteria. Because this alignment travels through the existing roadway network and
residential part of the city of Polson, this alignment has a very high access density throughout its urban
section. This alignment would be unable to implement access control.
With the constrained environment surrounding the urban portion of this alignment, this alignment
would be unable to provide additional ROW needed for non‐motorized users or to upgrade the existing
transportation facility to the current MDT roadway design standards. Due to the sharp horizontal curves

US 93 POLSON CORRIDOR PLANNING STUDY FIRST LEVEL SCREENING CRITERIA
MAY 10, 2011
6‐23 | P a g e
throughout this alignment, the desired standard for a 45 mph urban principal arterial would not be met.
This alignment also had steep grades, which would deter trucks from using this route.
This alignment has the potential to impact a moderate number of 4(f) and 6(f) resources and residential
parcels, and was not an alignment desired by the community. All of the factors described above caused
this alignment to be dropped from further consideration.
EIS Alignment 5
Alignment 5 was unable to meet three screening criteria. It was only moderately able to meet 10
additional screening criteria. Because a large portion of the length of this alignment travels through the
city limits of Polson, the posted speed limit would be reduced to that of an urban principal arterial. The
slower urban principal arterial speed, coupled with the number of long grades over four percent, could
deter trucks from using this route.
This alignment travels through a large amount of remote, virgin terrain which has minimal connections
to Polson’s transportation grid system. With only minimal connections to the existing transportation
system, this alignment is moderately able to provide connectivity to public parks and recreation
facilities. A high overall construction cost and moderate maintenance cost also played a factor in this
alignment’s elimination.
This alignment had the potential to impact a moderate number of residential parcels and sensitive
areas. Additionally, this alignment did not receive support from the community and was therefore not a
preferred alignment. All of the factors described above caused this alignment to be dropped from
further consideration.
EIS Alignment 7
Alignment 7 was unable to meet seven screening criteria and was moderately able to meet four
additional screening criteria. Because this alignment travels through the roadway network and
residential/commercial part of the city of Polson, this alignment has a very high access density
throughout its urban section. This alignment would be unable to accommodate access control.
Due to the horizontal curves near the two bridges for this alignment, the desired criteria for a 45 mph
urban principal arterial would not be met. This alignment also had steep grades and a slower speed
associated with an urban arterial, which would deter trucks from using this route.
This alignment has the potential to impact a moderate number of 4(f) and 6(f) resources and received
mixed feedback regarding its preference from the community. Additionally, this alignment would
require two new bridges, and potentially impact the downtown core, especially in light of recent
streetscape improvements to Main Street. All of the factors described above caused this alignment to
be dropped from further consideration.

US 93 POLSON CORRIDOR PLANNING STUDY FIRST LEVEL SCREENING CRITERIA
MAY 10, 2011
6‐24 | P a g e
EIS Alignment 8
Alignment 8 was unable to meet eight screening criteria and was moderately able to meet three
additional screening criteria. Because this alignment travels through the roadway network and
residential/commercial part of the city of Polson, this alignment has a very high access density
throughout its urban section. Similarly, this alignment would be unable to implement access control.
With the constrained environment surrounding the urban portion of this alignment, this alignment
would be unable to provide additional ROW needed for non‐motorized users or to upgrade the existing
transportation facility to the current MDT roadway design standards. Due to the right angle horizontal
curve near the bridge for this alignment, the desired criteria for a 45 mph urban principal arterial would
not be met. This alignment also had steep grades, which may deter trucks from using this route.
This alignment has the potential to impact a moderate number of 4(f) and 6(f) resources and a large
number of residential parcels. All of the factors described above caused this alignment to be dropped
from further consideration.
Central Bridge Crossing
The Central Bridge Crossing alignment was unable to meet five screening criteria and was moderately
able to meet five additional criteria. A high overall construction cost and maintenance cost played a
factor in the Central Bridge Crossing’s elimination. All of the factors described above caused this
alignment to be dropped from further consideration.
6.2.10 Refined Hybrid Alignments Community input, coupled with direction from the TOC, led to slight modifications of the five selected
alignments to minimize residential impacts near Ponderrilla Hills. Since the original EIS alignments
numbers 2 and 3 are relatively close to the Quantm generated alignments of the southern bridge
crossing and the northern bridge crossing, a hybrid was developed between the southern bridge
crossing alignment and EIS alignment number 3. A second hybrid was developed between the northern
bridge crossing alignment and EIS alignment number 2. These two hybrid alignments, referred to as the
“southern bridge crossing hybrid alignment” and the “northern bridge crossing hybrid alignment”
respectively, are shown on Figure 6‐2 on the following page. The third alignment under consideration,
EIS 6, has been modified slightly from that presented in the 1995 EIS to follow the existing roadway of
Ponderilla Drive. Should this alignment screen highest in the second level of screening, it is
recommended to further explore modifications to deviate from Ponderilla Drive by traversing to the
southeast along the irrigation canal system before tying into Kerr Dam Road.
The three hybrid alignments described above, and shown in Figure 6‐2, are recommended to be carried
forward into the second level of screening. The three hybrid alignments are reflective of the results of
the first level screening, and capture the analysis results accordingly. It is noted that the three hybrid
alignments are planning level “swaths” that may be subject to additional modifications after the second
level of screening is completed.

US 93 POLSON CORRIDOR PLANNING STUDY FIRST LEVEL SCREENING CRITERIA
MAY 10, 2011
6‐25 | P a g e
Figure 6‐2 Hybrid Alignments Forwarded to Second Level of Screening
6.3 References Carter Burgess/WGM Group Inc., F 5‐1(9)6, U.S. Highway 93 Evaro – Polson Final Environmental Impact
Statement and Section 4(f) Evaluation, June, 1996
Carter Burgess/WGM Group Inc., US Highway 93 – Polson, Traffic Operations and Environmental Study,
March, 1995
Northwest Environmental Training Center, Writing the Perfect EA/FONSI or EIS Training Course
Publication, September 3‐4, 2008
Pizzini, Greg, Access Management, Highways & Engineering Conference Presentation, 2007.
State of Montana Department of Transportation, A Guide to Functional Classification, Highway Systems
and Other Route Designations in Montana, January 2008