First half Financial Report as at June 30, 2014 - Fineco Bank · Main balance sheet aggregates 38...
162
First half Financial Report as at June 30, 2014
-
Upload
truongnguyet -
Category
Documents
-
view
213 -
download
1
Transcript of First half Financial Report as at June 30, 2014 - Fineco Bank · Main balance sheet aggregates 38...

First half Financial Report as at June 30, 2014

FinecoBank S.p.A.
Half-year Interim Financial Report
as at June 30, 2014

Contents

Board of Directors and Board of Statutory Auditors 2
Interim Report on Operations 4
Introduction to the half-year interim financial report 5
Summary data 6
Key figures 10
Business performance and main initiatives in the period
Commercial activities and development of new products and services
Fineco’s Competitive Positioning
Results achieved in the main areas of activity
The network of financial advisors
Related-Party Transactions
Operating structure
Human Resources
Technology infrastructure
Internal control system
Main risks and uncertainties
Organizational structure
12
16
17
19
25
28
30
30
32
33
34
35
Main balance sheet aggregates 38
Capital resources and prudential requirements 50
Income Statement Figures 51
Transactions with Group companies
Subsequent Events and Outlook
Reconciliation of condensed accounts to mandatory reporting schedule
60
61
63
Bank Financial Statements 65
Balance Sheet 66
Income Statement 67
Statement of Comprehensive Income 68
Statement of Changes in Shareholders’ Equity 69
Cash Flow Statement 71
Notes to the Accounts 72
Part A - Accounting Policies 73
Part B - Balance Sheet 80
Part C - Income Statement 97
Part E - information on risks and hedging policies
Part F - Shareholders’ Equity
Part H - Related-Party Transactions
Part I – Share-Based Payments
Part L - Segment Reporting
107
133
140
148
155
Condensed half-year financial statements certification pursuant to art. 81-ter of Consob Regulation no. 11971 of May 14, 1999, as amended
156

Share capital €200,070,430.89 fully paid-up, divided into 606,274,033 shares with a par value of €0.33.
Registered office
Piazza Durante 11, 20131 Milan, Italy
"FinecoBank Banca Fineco S.p.A." in abbreviated form "FinecoBank S.p.A.", or "Banca Fineco S.p.A." or "Fineco Banca S.p.A."
Company controlled by UniCredit S.p.A., Gruppo Bancario UniCredito, Register of Banking Groups no. 2008.1, Member of the National Guarantee Fund and National Interbank Deposit Guarantee Fund, Italian Banking
Association Code 03015, Tax Code and Milan Company Register no. 01392970404 – R.E.A. (Economic and Administrative Index) no. 1598155, VAT No. 12962340159

Board of Directors and Board of
Statutory Auditors

- 3 -
BOARD OF DIRECTORS AND BOARD OF STATUTORY AUDITORS
Board of Directors
Chairman Enrico Cotta Ramusino
Vice Chairman Francesco Saita
Managing Director Alessandro Foti
Directors Gianluigi Bertolli
Girolamo Ielo
Laura Stefania Penna
Mariangela Grosoli
Marina Natale
Pietro Angelo Guindani
Board of Statutory Auditors
Chairman Gian-Carlo Noris Gaccioli
Standing Auditors Barbara Aloisi
Marziano Viozzi
Alternate Auditors Federica Bonato
Marzio Duilio Rubagotti
External Auditors
Deloitte & Touche S.p.A.
Nominated Official in charge of drawing up Company Accounts
Lorena Pelliciari
On March 24, 2014 Mr. Alfredo Michele Malguzzi submitted his resignation from the position of Board Director. On April 15, 2014 the Ordinary Shareholders’ Meeting of FinecoBank S.p.A. appointed the new corporate bodies of the Bank and the Board of Statutory Auditors.

Interim Report on
Operations

Interim Report on Operations
- 5 -
INTRODUCTION TO THE HALF-YEAR INTERIM FINANCIAL REPORT
This half-year interim financial report at June 30, 2014 has been prepared in accordance with art. 154-ter, paragraph
2, of Legislative Decree no. 58 of February 24, 1998; it includes:
the condensed half-year financial statements have been drawn up in accordance with the recognition and
valuation criteria set out in the international accounting standards IAS/IFRS issued by the International Accounting
Standards Board (IASB) and approved by the European Commission; specifically, these interim financial
statements comply with the international accounting standard applicable to interim financial reports (IAS 34); the
financial statements are presented with a comparison to those of 2013: as required by IAS 34, the balance sheet
figures have been compared with those at December 31, 2013, while the income statement, statement of
comprehensive income, changes in equity and cash flow statement figures have been compared with the
corresponding figures for the first half of the previous year;
the Notes to the Accounts, which include, in addition to the detailed information required by IAS 34, presented
according to the schedules used in the financial statements, the additional information required by Consob and any
information that was deemed useful for a correct representation of the business situation;
the interim report on operations, which includes the condensed accounts, comments on the results for the period
and on significant events, as well as the additional information requested by Consob;
the condensed half-year financial statements certification pursuant to art. 81-ter of Consob Regulation no.
11971 of May 14, 1999, as amended.

Interim Report on Operations
- 6 -
SUMMARY DATA
Condensed Accounts
Balance Sheet
ASSETS 06.30.2014 12.31.2013 Amount %
Cash and cash balances 14 5 9 180.0%
Financial assets held for trading 10,407 4,700 5,707 121.4%
Loans and receivables with banks 13,476,117 16,330,912 (2,854,795) -17.5%
Loans and receivables with customers 696,142 641,250 54,892 8.6%
Financial investments 1,715,320 93,114 1,622,206 1742.2%
Hedging instruments 35,637 179,265 (143,628) -80.1%
Property, plant and equipment 11,391 10,772 619 5.7%
Goodwill 89,602 89,602 - -
Other intangible assets 7,915 8,014 (99) -1.2%
Tax assets 42,891 67,934 (25,043) -36.9%
Other assets 227,865 256,629 (28,764) -11.2%Total assets 16,313,301 17,682,197 (1,368,896) -7.7%
(Amounts in € thousand)
Changes
LIABILITIES AND SHAREHOLDERS' EQUITY 06.30.2014 12.31.2013 Amount %
Deposits from banks 1,026,852 1,648,675 (621,823) -37.7%
Deposits from customers 13,911,224 12,732,309 1,178,915 9.3%
Debt securities in issue 421,965 2,322,511 (1,900,546) -81.8%
Financial liabilities held for trading 4,867 2,301 2,566 111.5%
Hedging instruments 48,960 178,574 (129,614) -72.6%
Provisions for risks and charges 110,507 109,354 1,153 1.1%
Tax liabilities 52,975 37,701 15,274 40.5%
Other liabilities 264,249 231,623 32,626 14.1%
Shareholders' equity 471,702 419,149 52,553 12.5%
- capital and reserves 392,928 329,719 63,209 19.2%- revaluation reserves for available-for-sale financial assets and actuarial gains (losses) from defined benefit plans 4,912 4,214 698 16.6%- net profit (loss) 73,862 85,216 (11,354) -13.3%
Total liabilities and shareholders' equity 16,313,301 17,682,197 (1,368,896) -7.7%
(Amounts in € thousand)
Changes

Interim Report on Operations
- 7 -
Balance Sheet - Quarterly data ASSETS 06.30.2014 03.31.2014 12.31.2013 09.30.2013 06.30.2013
Cash and cash balances 14 7 5 7 8
Financial assets held for trading 10,407 8,405 4,700 5,600 5,606
Loans and receivables with banks 13,476,117 17,084,534 16,330,912 16,305,247 17,008,411
Loans and receivables with customers 696,142 669,141 641,250 550,292 561,002
Financial investments 1,715,320 93,934 93,114 92,406 102,329
Hedging instruments 35,637 130,687 179,265 160,226 158,275
Property, plant and equipment 11,391 10,718 10,772 9,615 8,697
Goodwill 89,602 89,602 89,602 89,602 89,602
Other intangible assets 7,915 8,055 8,014 7,683 7,879
Tax assets 42,891 48,420 67,934 43,089 44,178
Other assets 227,865 170,281 256,629 201,573 178,414Total assets 16,313,301 18,313,784 17,682,197 17,465,340 18,164,401
(Amounts in € thousand) LIABILITIES AND SHAREHOLDERS' EQUITY 06.30.2014 03.31.2014 12.31.2013 09.30.2013 06.30.2013
Deposits from banks 1,026,852 1,590,439 1,648,675 1,459,707 1,673,720
Deposits from customers 13,911,224 13,473,654 12,732,309 12,743,633 12,496,550
Debt securities in issue 421,965 2,322,527 2,322,511 2,324,047 3,076,452
Financial liabilities held for trading 4,867 7,902 2,301 4,998 4,853
Hedging instruments 48,960 130,411 178,574 159,649 157,436
Provisions for risks and charges 110,507 109,346 109,354 101,031 99,860
Tax liabilities 52,975 38,770 37,701 52,593 37,475
Other liabilities 264,249 184,969 231,623 206,909 228,392
Shareholders' equity 471,702 455,766 419,149 412,773 389,663
- capital and reserves 392,928 414,934 329,719 329,718 329,718- revaluation reserves for available-for-sale financial assets and for actuarial gains (losses) from defined benefit plans 4,912 3,906 4,214 3,636 3,683- net profit (loss) 73,862 36,926 85,216 79,419 56,262
Total liabilities and shareholders' equity 16,313,301 18,313,784 17,682,197 17,465,340 18,164,401
(Amounts in € thousand)

Interim Report on Operations
- 8 -
Income statement
06.30.2014 06.30.2013 Amount %
Net interest 115,940 95,905 20,035 20.9%Net fee and commission income 97,029 81,805 15,224 18.6%Net trading, hedging and fair value income 12,889 15,808 (2,919) -18.5%Net other expenses/income (1,572) (354) (1,218) 344.1%
OPERATING INCOME 224,286 193,164 31,122 16.1%
Payroll costs (31,835) (30,990) (845) 2.7%Other administrative expenses (106,991) (92,607) (14,384) 15.5%Recovery of expenses 37,542 28,054 9,488 33.8%Amortisation, depreciation and impairment losses on intangible and tangible assets (3,942) (3,491) (451) 12.9%
Operating costs (105,226) (99,034) (6,192) 6.3%
OPERATING PROFIT (LOSS) 119,060 94,130 24,930 26.5%
Net impairment losses on loans andprovisions for guarantees and commitments (1,291) (1,355) 64 -4.7%
NET OPERATING PROFIT (LOSS) 117,769 92,775 24,994 26.9%
Provisions for risks and charges (2,951) (360) (2,591) 719.7%Net income from investments - (6) 6 -100.0%
PROFIT (LOSS) BEFORE TAXFROM CONTINUING OPERATIONS 114,818 92,409 22,409 24.2%
Income tax for the period (40,956) (36,147) (4,809) 13.3%
PROFIT (LOSS) AFTER TAX FROM CONTINUING OPERATIONS 73,862 56,262 17,600 31.3%
NET PROFIT (LOSS) FOR THE PERIOD 73,862 56,262 17,600 31.3%
(Amounts in € thousand)
Changes

Interim Report on Operations
- 9 -
Income statement - Quarterly data
Q2 Q1 Q4 Q3 Q2 Q1
Net interest 57,607 58,333 43,119 41,254 47,525 48,380 Net fee and commission income 49,311 47,718 45,358 39,573 40,636 41,169 Net trading, hedging and fair value income 5,810 7,079 6,416 6,057 6,841 8,967 Net other expenses/income (758) (814) (4,025) (585) (914) 560
OPERATING INCOME 111,970 112,316 90,868 86,299 94,088 99,076
Payroll costs (16,065) (15,770) (16,474) (15,874) (15,650) (15,340)Other administrative expenses (55,029) (51,962) (41,965) (40,064) (44,408) (48,199)Recovery of expenses 18,735 18,807 14,624 14,319 13,985 14,069 Amortisation, depreciation and impairment losses onintangible and tangible assets (2,037) (1,905) (2,654) (1,936) (1,779) (1,712)
Operating costs (54,396) (50,830) (46,469) (43,555) (47,852) (51,182)
OPERATING PROFIT (LOSS) 57,574 61,486 44,399 42,744 46,236 47,894
Net impairment losses on loans andprovisions for guarantees and commitments (826) (465) (1,320) (600) (565) (790)
NET OPERATING PROFIT (LOSS) 56,748 61,021 43,079 42,144 45,671 47,104
Provisions for risks and charges 422 (3,373) (11,584) (4,115) 2,346 (2,706)Net income from investments - - - - (6) -
PROFIT (LOSS) BEFORE TAXFROM CONTINUING OPERATIONS 57,170 57,648 31,495 38,029 48,011 44,398
Income tax for the period (20,234) (20,722) (25,698) (14,872) (18,773) (17,374)
NET PROFIT (LOSS)FROM CONTINUING OPERATIONS 36,936 36,926 5,797 23,157 29,238 27,024
NET PROFIT (LOSS) FOR THE PERIOD 36,936 36,926 5,797 23,157 29,238 27,024
(Amounts in € thousand)
2014 2013
Main balance sheet figures
06.30.2014 12.31.2013 Amount %
Loan receivables with customers (1) 410,800 421,784 (10,984) -2.6%Total assets 16,313,301 17,682,197 (1,368,896) -7.7%Customer direct sales (2) 13,731,112 12,518,293 1,212,819 9.7%Customer indirect sales (3) 33,465,147 31,088,364 2,376,783 7.6%Total customer sales (direct and indirect) 47,196,259 43,606,657 3,589,602 8.2%Shareholders' equity 471,702 419,149 52,553 12.5%(Amounts in € thousand)
Changes
(1) Loans receivable with ordinary customers refer solely to loans granted to customers (current account overdrafts, credit cards and personal loans); (2) Customer direct sales include overdrawn current accounts, Supersave repos and the Cash Park deposit account; (3) Customer indirect sales consist of products placed online or through the sales networks of FinecoBank.

Interim Report on Operations
- 10 -
KEY FIGURES
Operating Structure
06.30.2014 12.31.2013 06.30.2013
No. of Employees 975 965 952No. of Human Resources 989 976 965No. of Financial Advisors 2,500 2,438 2,394No. of Operating financial outlets 320 311 301 Number of human resources: includes permanent employees, atypical employees, Directors and Group employees seconded to FinecoBank, net of FinecoBank employees seconded to the Group. Number of operating financial outlets: financial outlets managed by the Bank and financial outlets managed by financial advisors (Fineco Center).
Profitability, productivity and efficiency ratios
06.30.2014 12.31.2013 06.30.2013
Net interest/Operating income 51.69% 48.68% 49.65%Income from brokerage and other income/Operating income 48.31% 51.32% 50.35%Income from brokerage and other income/Operating costs 102.97% 100.53% 98.21%Cost/income ratio 46.92% 51.05% 51.27%Operating costs/TFA 0.46% 0.45% 0.49%Cost of risk 62 bp 83 bp 74 bpROE 36.58% 23.58% 33.97%Return on assets 0.45% 0.48% 0.31%EVA 65,900 68,142 47,747 RARORAC 80.19% 39.38% 55.30%ROAC 89.88% 49.25% 65.17%Total customer sales/Average employees 48,037 45,306 42,961 Total customer sales/(Average employees + average PFAs) 13,674 13,056 12,412 (Amounts in € thousand)
Key Income from brokerage and other income: Net fee and commission income, Net trading, hedging and fair value income and Net other expenses/income. Operating costs/TFA: ratio of operating costs to Total Financial Assets (direct and indirect sales). Operating costs as at June 30, 2014 and June 30, 2013 have been annualized; The TFA used for the ratio is the average for the period, calculated as the average between the period-end balance and the balance as at the previous December 31. Cost of risk: ratio between net impairment losses on loans and the average loans and receivables with ordinary customers. Net impairment losses on loans as at June 30, 2014 and June 30, 2013 have been annualized; Average ordinary loans to customers were calculated as the average between the period-end balance and the balance as at the previous December 31. ROE: the denominator used to calculate the index in question is the average shareholders' equity for the period (excluding dividends expected to be distributed and the revaluation reserves). The net profit for the period has been annualized. Return on assets: ratio of annualized net profit to total assets. EVA (Economic Value Added): shows the firm's ability to create value; calculated as the difference between net operating profit and the figurative cost of the allocated capital. RARORAC (Risk adjusted Return on Risk adjusted Capital): which is the ratio between EVA and Allocated/Absorbed Capital and expresses, in percentage, the capacity to create value for unit of risk taken. ROAC (Return on Allocated Capital): is the ratio of Net Operating Profit and Allocated Capital. The Allocated Capital is intended as the greater of internally calculated capital based on shared UniCredit Group models (Economic Capital) and regulatory capital. The regulatory capital used to calculate the indicators EVA, RARORAC and ROAC is calculated on a consolidated basis. To calculate the indicators as at June 30, 2014, the figure for internal capital is that at March 31, 2014, which is the latest available figure provided by the Parent Company.

Interim Report on Operations
- 11 -
Balance Sheet indicators
06.30.2014 12.31.2013
Loan receivables with ordinary customers/Total assets 2.52% 2.39%Loans and receivables with banks/Total assets 82.61% 92.36%Financial assets/Total assets 10.58% 0.55%Direct Sales/Total liabilities and shareholders' equity 84.17% 70.80%Debt securities in issue/Total liabilities and shareholders' equity 2.59% 13.13%Shareholders' equity (including profit)/Total liabilities and shareholders' equity 2.89% 2.37%Loans and receivables with ordinary customers/Customer direct sales 2.99% 3.37%
Credit quality 06.30.2014 12.31.2013
Impaired loans/Loan receivables with ordinary customers 1.19% 1.12%Non-performing loans/Loan receivables with ordinary customers 0.83% 0.78%Coverage (1) - Non-performing loans 80.93% 81.45%Coverage (1) - Doubtful loans 67.62% 67.41%Coverage (1) - Past-due impaired loans 44.16% 45.91%Coverage (1) - Total impaired loans 77.06% 77.66% (1) Calculated as the ratio between the amount of impairment losses and gross exposure. Solvency indicators
06.30.2014 12.31.2013
Common Equity Tier 1 Capital Ratio (Tier 1 capital/Risk-weighted assets -TIER 1 capital ratio at December 31, 2013) 19.50% 12.25%Total Own Funds Capital Ratio (Regulatory capital/Risk-weighted assets - Total capital ratio at December 31, 2013) 19.50% 12.25%
The “Common Equity Tier 1 capital ratio” and the “Total Own Funds capital ratio” at June 30, 2014 were calculated by
applying the supervisory regulations in force according to the Basel III regulatory framework.
At December 31, 2013, the RWAs used to calculate the Tier 1 Capital ratio and the Total capital ratio were determined
by applying the Basel II supervisory regulations, supplementing the total capital requirements of the Basel I “floor”,
which corresponds to the positive difference between 80% of the capital requirements calculated on the basis of
regulations in force as at December 31, 2006, and the sum of capital requirements for credit, counterparty, market and
operational risks, calculated using the Basel II provisions.

Interim Report on Operations
- 12 -
BUSINESS PERFORMANCE AND MAIN INITIATIVES IN THE PERIOD
FinecoBank is a direct bank operating as a one-stop solution provider in Italy, offering the retail customer segment a
full range of banking and investment products and services through a multi-channel structure that includes its own
network of financial advisors, its own website and a number of ad hoc mobile applications, with the support of the
UniCredit Group contact center and branches.
The products and services offered by FinecoBank include: (i) banking services, including current account and deposit
services, payment services, and issuing debit, credit and prepaid cards (banking); (ii) order execution services on
customers’ behalf, trading on own account, receipt and passing on of orders, with direct access to major global equity
markets and the ability to trade in CFDs (on currencies, indices, shares, bonds and commodities), futures, options,
bonds, ETFs and certificates (brokerage); and (iii) placement and distribution services of more than 5,000 products,
including mutual funds and SICAV sub-funds managed by 64 leading Italian and international investment firms,
insurance and pension products, as well as consulting services in the investment field (investing).
As at June 30, 2014, FinecoBank had 930,724 customers, 54,000 of whom were acquired during the reporting period
(+17% compared to the same period of the previous year) and Total Financial Assets (TFA) amounted to €47,196
million (+8.2% compared to December 31, 2013).
Main events during the period
In order to fully leverage FinecoBank’s assets and support its growth, on April 15, 2014 the Shareholders’ meeting,
upon proposal of the Board of Directors, approved the proposal for admission to listing on the MTA (Mercato
Telematico Azionario) of FinecoBank ordinary shares.
The listing and consequent expansion of the shareholder base will enable the Bank to strengthen the visibility of its
business model, thereby improving its standing in the market, thanks also to national and international institutional
investors becoming shareholders of the bank.
After the FinecoBank listing project began, in the meeting of April 15, 2014, the Board of Directors approved the new
2014-2018 Multi-Annual Plan. The new Plan, which amends the plan approved by the Board of Directors on March 10,
2014, takes into account the effects of the new liquidity investment policy as from April 1, 2014, the costs for the new
incentive system for employees and financial advisors and the costs related to the listing process.
On the same date - in line with best practice and the recommendations of the Corporate Governance Code of listed
companies and in accordance with the remuneration policies in place - the Board of Directors of FinecoBank approved
the adoption of a remuneration scheme aimed at incentivizing, retaining and motivating senior managers, "key people"
(intended as other Managers and Employees of the Company who, due to the importance and critical nature of their
role as well as their skills and potential can affect the company’s economic performance and sustainability) and
Financial Advisors.
As for the new liquidity investment policy, on March 27, 2014, the Board of Directors approved the first allocations in
view of the listing, which were carried out as of April 1, 2014. Specifically, UniCredit Securities with maturities ranging
from 2 years and 10 months to 7 years and 6 months were purchased for an amount corresponding to "Core" liquidity
(the most stable component, which amounts to €7.8 billion). These types of investment were determined by taking into
account the overall structure of the Bank’s financial statements and in a risk/reward optimization perspective. The

Interim Report on Operations
- 13 -
portion of liquid assets classified as "Non Core" was invested in Italian government bonds for a nominal amount of
€1.5 billion. At the same time, derivative contracts were entered into at the same time in order to convert the fixed rate
into a floating rate, in compliance with pre-defined limits on interest rate risk; residual Non Core liquidity continued to
be invested in the current account held with the parent UniCredit.
On June 27, 2014, the Bank announced the outcome of the global offering - which set the price at €3.7 per share,
equivalent to a market capitalization of the bank of €2,243 million. The global offering concerned 181,883,000 ordinary
shares, representing 30% of the share capital of the Bank. Overall, taking into account both the public offering and the
institutional placement, requests were received for 609,079,891 shares by 46,534 applicants, with a total demand
equal to 2.9 times the offer.
Trading of the shares started on July 2, 2014.
On July 17, 2014, the coordinators of the FinecoBank ordinary shares global offering (the '"Global Offering"), UBS
Investment Bank and UniCredit Corporate & Investment Banking, exercised the greenshoe option granted by
UniCredit for 27,283,000 shares, representing all the over-allotted shares. The purchase price of the shares issued
under the greenshoe option was €3.7 per share - corresponding to the offer price set in the Global Offering - for a
gross amount of €100,947,100.
Payment of the shares under the greenshoe option was made on July 22, 2014.
Performance of balance sheet aggregates
Total customer sales (direct and indirect) as at June 30, 2014 came to €47,196 million, an increase of 8.2% compared
to the end of 2013, thanks to net sales of €2,008 million and a positive effect driven by market performance of €1,581
million.
Indirect customer sales (Assets under Management-AUM plus Assets under Custody-AUC) amounted to €33,465
million, compared to €31,088 million as at December 31, 2013, up by 7.6%, confirming a constant growth trend and
ongoing improvement in sales quality. In this respect, the growth in "guided products & services” 1should be pointed
out, which continued to increase as a percentage of TFA, rising from 12.70% as at December 31, 2013 to 13.90% as
at June 30, 2014.
Direct sales also showed consistent growth, driven by the increasing number of new customers, thus confirming their
appreciation for the quality of the services. Direct sales mainly consist of 'transactional’ deposits that support all
customers’ transactions, confirming the high and increasing degree of customer loyalty, which in turn contributes to
improving the quality and stability of direct sales.
1Respectively FinecoBank products and/or services developed by investing in UCITs selected from among those distributed for each asset class taking into account customers’ different risk profiles and offered to FinecoBank customers under the guided open architecture model. At the date of this interim report, the guided products category includes the "Core Series” umbrella fund of funds and the "Core Unit” unit-linked policy, while the “Fineco Advice” advanced advisory service (investment) falls into the guided service category.

Interim Report on Operations
- 14 -
AUC = Assets under custody AUM = Assets under management TFA = Total Financial Assets (direct and indirect sales)
The table below shows the figures for the balance of direct sales, assets under management and assets under
administration of Fineco customers, including both those linked to a financial advisor and online customers.
Assets under administration and under management
06.30.2014 % 12.31.2013 % Change % Change
Current accounts and demand deposits 11,855,287 25.1% 10,666,629 24.5% 1,188,658 11.1%Time deposits and reverse repos 1,875,825 4.0% 1,851,664 4.2% 24,161 1.3%BALANCE DIRECT SALES 13,731,112 29.1% 12,518,293 28.7% 1,212,819 9.7%
Segregated accounts 15,077 0.0% 41,901 0.1% (26,824) -64.0%UCITS and other investment funds 19,579,138 41.5% 17,691,343 40.6% 1,887,795 10.7%Insurance products 1,968,314 4.2% 1,805,235 4.1% 163,079 9.0%BALANCE ASSETS UNDER MANAGEMENT 21,562,529 45.7% 19,538,479 44.8% 2,024,050 10.4%
Government securities, bonds and stocks 11,902,618 25.2% 11,549,885 26.5% 352,733 3.1%BALANCE ASSETS UNDER ADMINISTRATION 11,902,618 25.2% 11,549,885 26.5% 352,733 3.1%
BALANCE DIRECT AND INDIRECT SALES 47,196,259 100.0% 43,606,657 100.0% 3,589,602 8.2%
of which Guided products & services - Core series and Core Unit 4,208,652 64.1% 3,753,402 67.7% 455,250 12.1% - Advice 2,356,367 35.9% 1,792,844 32.3% 563,523 31.4%(Amounts in € thousand)
The table below shows the figures for the balance of direct sales, assets under management and assets under
administration of only the personal financial advisors network.
12,074
Direct
Net assets under management
Net assets under administration
Net direct sales
Market effect
43,607 1,375
19,539
21,562
1,18413,731
12,518
11,550 11,903
47,196
1,581
12.31.2013 06.30.2014

Interim Report on Operations
- 15 -
Assets under administration and under management - Financial Advisors Network - Source Assoreti
06.30.2014 % 12.31.2013 % Change % Change
Current accounts and demand deposits 8,326,223 21.2% 7,390,277 20.4% 935,946 12.7%Time deposits and reverse repos 1,330,309 3.4% 1,319,221 3.6% 11,088 0.8%BALANCE DIRECT SALES 9,656,532 24.5% 8,709,498 24.1% 947,034 10.9%
Segregated accounts 15,077 0.0% 41,901 0.1% (26,824) -64.0%UCITS and other investment funds 19,196,941 48.8% 17,344,996 47.9% 1,851,945 10.7%Insurance products 1,870,419 4.8% 1,703,434 4.7% 166,985 9.8%BALANCE ASSETS UNDER MANAGEMENT 21,082,437 53.6% 19,090,331 52.7% 1,992,106 10.4%
Government securities, bonds and stocks 8,615,054 21.9% 8,392,123 23.2% 222,931 2.7%BALANCE ASSETS UNDER ADMINISTRATION 8,615,054 21.9% 8,392,123 23.2% 222,931 2.7%
BALANCE DIRECT AND INDIRECT SALES 39,354,023 100.0% 36,191,952 100.0% 3,162,071 8.7% (Amounts in € thousand)
Performance of income statement aggregates Profit before tax amounted to €114.8 million (+24.2%).
Profit before tax increased sharply compared to the same period of the previous year, due to the improvement in net
interest margin (up €20 million) attributable to both the increase in volumes and the revision of liquidity investment
policies. Net fee and commission income posted an 18.6% increase, thanks to both asset management commissions
and the improvement in trading commissions as a result of the increase in the number of executed orders.
This confirms the success of a strategy that for years has targeted diversification and the introduction of new products
and services. Thanks to this positioning, customers have maintained and strengthened their relationship with
FinecoBank, precisely because, by using the platform or through the advice of financial advisors, they could find all the
necessary products and services to carry out their banking transactions and their investment and trading strategies.
Communications and external relations
The positioning strategy of "La Banca che semplifica la banca" (The Bank that Simplifies Banking) continued to take
root among the target audience, thanks above all to major communications bursts that confirmed TV and radio
(through programming 70% focused on informative content) as the fundamental media for reaching significant
awareness thresholds.
More specifically, two advertising bursts were run in the first half of 2014: the first in January and February, and the
second between late May and mid-June, timed to coincide with the lead-up to Fineco’s listing on the market.
Both advertising campaigns were centred on the slogan “Semplice come immaginare” (Simple, just like a dream), with
the aim of anchoring memories of the advertising campaign implemented in 2013 and consolidating Fineco's brand
awareness.
The two “Member gets Member” campaigns were planned in parallel with bursts of corporate communications, in order
to maximize their effectiveness. Overall, the two promotions resulted in approximately 20,000 new accounts being
opened.

Interim Report on Operations
- 16 -
Fineco is still the Italian bank with the most followers (over 7,000) on Twitter, while its fan page on Facebook has
passed the 21,000-fan mark, with very high levels of interaction and engagement.
“Local” marketing activities also intensified, with Personal Financial Advisors attending and participating in these
activities. In addition to the proven “Formats” (educational-business meetings with clients and prospects), the golf
competitions ("Fineco Golf Club") and the "Apex” events designed for top clients were especially successful.
COMMERCIAL ACTIVITIES AND DEVELOPMENT OF NEW PRODUCTS AND SERVICES
The main commercial activities, products and services provided in the first half of 2014 - which involved all the Bank’s
departments and units, within their respective areas, and consisted of feasibility studies, subsequent implementation
and sale/placement - are summarized below:
- extension of the “Member Get Member” campaign;
- introduction of CFDs on shares, new derivative instruments to invest in the American and British markets directly
in euro in intraday mode, with no need for a specific authorization, with zero trading commissions and free
information;
- release of the new Logos platform, which provides 100 additional tools including shares, indices, currencies,
commodities and bonds of the major world markets, new graphics, new functions (users can now search tools,
customize views and check P&L in a single screen) and faster order entry through the simultaneous opening of
multiple chips;
- release of the “MoneyMap” app for smartphone on the App Store and Google Play. The “MoneyMap” app
provides additional functions compared to the desktop version, including the ability to assign a reminder to each
expense, categorize cash expenses and withdrawals as soon as they are made, add a tag or a description for
each transaction, add a location for a charge directly from the user's smartphone, take a picture of the product or
the receipt and match it to a payment that has just made. In addition there are new online features such as the
ability to assign keywords (tags) to account transactions, view transactions by item and access account
transactions directly from the Brand Map;
- release of a new version of the public area of the Fineco website, with a new design and a more vertical layout,
updated with the most recent web technologies and design;
- introduction of the new ADVICE UNIT solution. This is a unit-linked life insurance by Skandia Vita S.p.A.,
exclusively distributed by Fineco, which allows for maximum customization of investments while ensuring the
financial efficiency provided by the “Advice” advisory service;
- introduction of the “Logos” current account for trading on Logos CFDs. The Logos account does not provide the
services typically associated with current accounts: debit and credit cards, cheques, direct debits of utility bills,
loans and credit lines. On the other hand, it can be used to transfer money in and out of the account as well as to
receive, transmit and execute orders (including trading for own account) on the market, limited to Logos CFDs.
The Logos account is available online via a desktop platform and a mobile app for tablets and Apple and Android
smartphones.

Interim Report on Operations
- 17 -
FINECO’S COMPETITIVE POSITIONING
Evolution of Italian households’ wealth
Our country is characterized by significant household wealth and a historically strong propensity to save. The net
wealth of Italian households at the end of 2012 was approximately €9,438 billion (source: Bank of Italy, The Wealth of
Italian households, 2013), 40% of which (€3,670 billion) is invested in financial assets.
On an international level, Italian households show a comparatively high net wealth, amounting in 2011 to 7.9 times
their gross disposable income; this ratio is comparable to that of France, the UK and Japan, and higher than that of the
United States, Germany and Canada, with a 12% savings rate, which is stable and above the European average
(11.3%), despite the crisis (Source: Eurostat - recalculated rate).
Given increasing market complexity and a growing need for professionally managed investments, Italians have shown
an increasing propensity to rely on financial advisors when selecting their investments.
Impact of the digitization of the market
In recent years there has been an increasing digitization of Italian society, directly related to demographic and
technological factors.
In the new, integrated multi-channel approach, as a general rule no individual channel is used exclusively, as
customers tend to combine them according to their preferences and current needs; accordingly, it has become
increasingly frequent for banking services to be offered together with brokerage and investing services.
Fineco’s products and services and main business segments
Banking
Fineco offers its clients a full range of direct banking services (mainly through online and mobile channels) that are
comparable to those offered by traditional banks and competitors in this segment.
Fineco has successfully increased its market share (estimated on the basis of direct sales), from 0.96% as at March
31, 2013 to 1.03% as at March 31, 2014, thanks to more robust growth than elsewhere in the industry (+3.98% vs
+0.70% growth in the banking system).
Estimates of assets under management by distribution channel ‐ AuM ‐ 16F
(Billions of euro)2
CAGR CAGR2011 2012 2013F 2014F 2015F 2016F 11‐13 (%) 13F‐16F (%)
Bank branches 269.6 273.3 304.3 326.9 345.0 363.2 6.2 6.1Financial advisors 113.1 128.0 144.9 161.0 177.0 194.6 13.2 10.3Institutional 368.3 407.3 427.9 452.8 478.0 502.8 7.8 5.5Total 751.0 808.6 877.1 940.7 1,000.0 1,060.6 8.1 6.5
Source: Prometeia, Osservatorio risparmi delle famiglie 2013 [Household savings monitor 2013], November 2013 edition 2 Figures net of duplications

Interim Report on Operations
- 18 -
Brokerage
Over time, Fineco has developed and consolidated a strong presence in the brokerage segment by offering order
execution services on customers’ behalf. As part of its brokerage activities Fineco also engages in proprietary trading.
The Bank has been a leading player in the Italian stock market since 2004.
In addition, Fineco ranks first among online brokers in Europe by number of executed orders, with 12,847,634 orders
executed as at June 30, 2014 (an increase compared to 11,766,905 as at June 30, 2013).
Data source: Half-year reports / Press Releases
Investing
Fineco offers customers a wide range of financial products especially in the asset management sector, proposing the
best products from major Italian and international firms, carefully selected through its Investment Services Department;
in recent years Fineco has also developed a successful investment advisory service through a dedicated advisory
platform, exclusively dedicated to financial advisors.
The financial advisory sector recently experienced strong growth in Italy, reaching a record high on March 31, 2014 in
terms of assets under management by Assoreti’s member firms (€288 billion).
In recent years the range of products and services offered by the networks has also undergone significant changes,
centering around a simplification of the business model. The traditional model according to which financial advisors’
activities were closely related to the products with the brand name of their respective groups has been gradually
changing, making way for more open architectures, with a general enlargement in the product range and a
containment of the costs incurred for production.
In this competitive environment, Fineco increased its TFAs by 16% in the 1st half of 2014 compared to the 1st half of
2013, from €33.8 billion to €39.4 billion. The table below (the last available date is March 2014 - Source Assoreti)
shows a positive growth trend in Fineco’s market share in terms of assets under management.
Data source: Assoreti Reports
The table below (the last available date is May 2014 - Source Assoreti) reports the net sales of Assoreti member firms,
compared with those of Fineco, the latter, showing an increase as a percentage of total Assoreti net sales (from 15.4
to 17.1%).
(Amounts in € million)
TOTAL MARKET TOTAL MARKET TOTAL MARKET
ASSORETI SHARE ASSORETI SHARE ASSORETI SHARE
TOTAL ASSETS UNDER MANAGEMENT 288,143 37,885 13.1% 279,193 36,192 13.0% 264,798 33,684 12.7%
MARCH 2014 DECEMBER 2013 MARCH 2013
FINECO FINECO FINECO

Interim Report on Operations
- 19 -
Data source: Assoreti Reports
As at May 31, 2014 Fineco ranked second in Italy in terms of net sales, while at March 31, 2014 it ranked third for
TFAs and absolute number of financial advisors2.
The following pages contain the main indicators and results of the main business segments: Brokerage, Banking and
Investing.
Given the Bank’s specific business model that provides for a high level of integration among its different activities,
these segments are interdependent. Indeed the Bank offers its services (banking and investment services) through a
network of financial advisors and online and mobile channels that operate in a coordinated and integrated manner.
All the activities were carried out with the aim of obtaining economic results from the "industrial" management of the
businesses, to minimise their financial risk. FinecoBank’s financial management approach is to manage risks with a
view to protecting the industrial returns on the various businesses while not assuming risk positions on its own
account.
RESULTS ACHIEVED IN THE MAIN AREAS OF ACTIVITY
BROKERAGE
The first half of the year transactions increased significantly due to renewed optimism among operators and an
increasingly wider range of products open to all target customers. Compared to the last period of the previous year the
segment of most active customers showed a recovery, but the level of transactions was still far from the activity peaks
recorded in recent years. Thus the redistribution of executed orders within the customer base continued; the
percentage reduction in transactions carried out by active traders has been progressively offset by the increased
number of less active customers who also choose Fineco for investing in the various markets. The continued growth of
new customers who made their first market order during this first half of the year bears special mention.
With regard to the individual products’ performance, CFDs and Logos - which now account for a significant portion of
Fineco brokerage revenues - grew further. The growth of CFDs and Logos also benefited from improvements over the
past few months concerning how these two products are offered:
new underlying products, Logos bonuses for non-active users, and a new Logos Desktop platform. Interest revenues
on open overnight margin positions also increased compared to 2013. Compared to 2013 Forex revenues decreased,
due to low volatility and low market volumes, as did Equity Trading Profit revenues affected by the impact of lower
internalized volumes as a result of the Tobin Tax.
In addition to the considerations made with regard to CFDs and Logos, the strategy for product innovation and
development continued with the introduction of different services and features:
- new CFDs on U.S. and UK stocks. The “zero commissions” option, so far only applicable to indices and forex, was
extended to equities for the first time;
2 Data source: Assoreti Report
(Amounts in € million)
TOTAL AS A % TOTAL MARKET
ASSORETI ASSORETI SHARE
NET SALES 9,146 1,568 17.1% 16,605 2,549 15.4%
FINECO FINECO
MAY 2014 DECEMBER 2013

Interim Report on Operations
- 20 -
- the new Logos desktop platform that, in addition to a new look and feel and improved usability, saw an increase in
the number of instruments that can be traded from approximately 50 to more than 150;
- the Logos bonus through which the bank can target promotional campaigns to specific customers;
- restyling of the markets and trading area with the introduction of new information tools such as the macroeconomic
data calendar, the introduction of intraday charts for CFDs, improved news service and improved look and feel of
the snapshots;
- ability to enter conditional orders, stop losses and profit taking on listed bonds, including on pre-existing positions;
- in order to extend the range of bonds offered for trading, an offline channel to trade unlisted securities was made
available. The number of instruments that can be traded is gradually expanding: the Bank currently has more than
1,000 securities available for trading, plus the approximately 9,000 available online.
The following table shows the number of orders on financial instruments recorded in the first half of 2014 compared to
the same period of the previous year.
06.30.2014 06.30.2013 Change % Change
Orders - Equity Italy (including internalised orders) 3,904,206 3,440,398 463,808 13.5%Orders- Equity USA 660,165 383,720 276,445 72.0%Orders- Equity other markets 249,689 169,623 80,066 47.2%Total equity orders 4,814,060 3,993,741 820,319 20.5%
Orders - Bonds 394,050 422,267 (28,217) -6.7%Orders - Derivatives 1,569,876 1,601,185 (31,309) -2.0%Orders - Forex 549,455 817,704 (268,249) -32.8%Orders - CFDs 542,545 315,536 227,009 71.9%Orders - Funds 1,036,837 961,127 75,710 7.9%Orders - Repos 17,064 19,809 (2,745) -13.9%TOTAL ORDERS 8,923,887 8,131,369 792,518 9.7%
The table shows a general increase in orders executed in the first half of 2014 compared to the same period of the
previous year, except for a marked decline in Forex orders and a slight contraction in Bonds, Derivatives and Repos;
the increase in transactions on foreign equity markets should also be pointed out, which confirms the validity of the
product and service diversification model.
The following table shows the volume of trades carried out as direct counterparty in orders placed by customers,
resulting from the internalization of orders received on shares, CFDs and “Logos” products, recorded in the first half of
2014 and first half of 2013. In the first half of 2014 the volumes traded on equity and forex markets recorded a
decrease, partially offset by an increase in the volume of "Logos" and CFD transactions.
06.30.2014 06.30.2013 Change % Change
Equity (internalisation) 20,821,728 28,589,920 (7,768,192) -27.2%Forex 35,329,820 52,925,226 (17,595,406) -33.2%CFDs and Logos 7,022,561 3,526,756 3,495,805 99.1%Total "Internalised" Volumes 63,174,109 85,041,902 (21,867,793) -25.7%(Amounts in € thousand)

Interim Report on Operations
- 21 -
The total number of orders executed refers to transactions carried out by retail and institutional customers for the purchase and sale of shares, bonds, derivatives, forex, CFDs, funds and repos.
BANKING
Banking
As regards banking products and services, the main innovations concerned the launch of the new “Logos” current
account and the simultaneous roll-out of the procedure for sending out digital codes for initial access to the current
account restricted area, and the launch of the new “Moneymap” app.
The Logos account is a new current account in euro that enables a limited number of transactions, oriented towards
Logos CFDs trading. On this type of account customers cannot request the services usually associated with current
accounts, such as debit and credit cards, cheques, direct debit for utility bills and credit lines, while the payment
services provided (e.g. bank transfers) are intended for liquidity management and/or transfer transactions that are
0 3,000,000 6,000,000 9,000,000
June 2013
June 2014
June 2013 June 2014Other Markets 61,753 126,281
Italy (MTA+AH) 6,100,188 6,558,519
USA 970,568 1,595,786
France 87,885 53,611
Germany 167,258 193,192
Number of orders executed on line broken down by stock market
Other Markets Italy (MTA+AH) USA France Germany
11,7
66,9
05
12,8
47,6
34
June 2013 June 2014
Total number of orders executed
+9.2%

Interim Report on Operations
- 22 -
necessary for and related to the above listed investments; similarly, order reception, transmission and execution
services are limited to orders arising from the mentioned Logos CFDs.
The new Moneymap app for smartphones should also be included among the innovations. MoneyMap is Fineco’s
household budgeting service with full current account integration, providing customers with completely automated
tracking of household expenditure.
No. of current accounts and balance of direct and indirect deposits
12,286 13,731
28,669
33,465
686,677
747,375
0
5,000
10,000
15,000
20,000
25,000
30,000
35,000
40,000
45,000
50,000
June 2013 June 2014
600,000
620,000
640,000
660,000
680,000
700,000
720,000
740,000
760,000
780,000
800,000
820,000
840,000
direct deposits indirect deposits no. of currents accounts
(Amounts in € thousand)
Credit
During the first half of 2014, the Bank continued to expand its range of credit products and services.
Specifically, as regards the credit cards segment, a number of measures were implemented to increase the efficiency
of re-issuing demagnetized cards, with a reduction of shipping times and production costs. As a result, the level of
customer satisfaction increased while customer care traffic decreased.
In line with the performance figures for last year, the indicators relating to the credit card sector showed an upward
trend. Specifically, a 5% increase was recorded in the number of active credit card holders with full repayment of
balance at term, whilst a 6% increase was recorded in the number of customers holding credit cards with instalment
payment plans (also known as revolving credit cards). Furthermore, the figure relating to spending, which continues to
be the main profitability driver, rose by 8% compared to the previous year, recording an overall sum of more than €1
billion. The spending of revolving cards represented 2% of the total.
At present, 45% of Fineco cards operate on the Visa circuit and the remaining 55% operate on the MasterCard circuit.
Spending amounts to 60% on the Visa circuit and 40% on the MasterCard circuit.

Interim Report on Operations
- 23 -
Finally, two further developments characterized the first half of the year:
placement of UniCredit loans: in January the Bank began to place UniCredit loans through the PFA network. The
introduction of the new products, which add to the range of existing credit products, is geared towards customer
retention;
loan secured with a lien on SICAVs: to make the offer more commercially attractive, the following SICAVs were
included as possible collateral: Pioneer – Fidelity – Pimco – Templeton – Carmignac - Russell Investments - M&G -
Black Rock - JP Morgan.
Number of valid activated Credit Cards
637,511584,555
June 2013 June 2014
FinecoBank Cards
(Amounts in € thousand)
Payment systems
During the first half of 2014 the OU in charge of the Bank payment systems implemented new services and collection
and payment procedures stemming both from regulatory changes that have affected the entire banking system and
from internal procedures and processes aimed at providing innovative services to customers, including specifically:
1,027,009
19,334
21,493
18,000
18,500
19,000
19,500
20,000
20,500
21,000
21,500
22,000
750,000
800,000
850,000
900,000
950,000
1,000,000
1,050,000
June 2013 June 2014
Credit Card spending (cash and revolving)
Spending cash Spending revolving

Interim Report on Operations
- 24 -
the national TV (RAI) licence payment service, available in the reserved area (www.fineco.it) for Fineco’s
customers, was migrated to a new technology platform. This innovation enables customers to obtain a real-time
receipt for payment of the licence and lower transaction costs;
direct debit payments (RID) were officially migrated to the new SEPA Direct Debit (SDD) infrastructure;
the SDD Attivi service was activated for creditor customers only, who already used the RID Attivi service;
the "Advanced" SEDA service (SEPA Compliant Electronic Database Alignment) was activated for Fineco
customers, supplementing the “Basic” service. As of May 2014 the SEDA procedure has replaced the Electronic
Database Alignment procedure thereby enabling companies and banks participating in the procedure to exchange
information on Sepa Direct Debit instructions before debit instructions are implemented;
INPDAP and ENPALS pensions are no longer received by bank transfer, but are directly managed by the pension
procedure, in the same way as INPS pensions;
payments through bank transfers and via cross-border transfers were officially migrated to the new SEPA Credit
Transfer (SCT) infrastructure regardless of the channel from which the customers’ orders originated;
in accordance with Directive 2007/64/EC (Payment Services Directive - PSD), the Sepa Transfer Recall (RECALL)
procedure was introduced both for SCTs received (Passive Recall) and SCTs sent (Active Recall). Under this
procedure, both active and passive transfer recalls can be managed automatically on behalf of customers;
pursuant to art. 27 of Legislative Decree 98/2011, which introduced a favourable tax treatment for young
entrepreneurs and redundant workers under mobility programmes, a process has been introduced for managing
tax transfers in favour of taxpayers classified in the “minimum” bracket, exonerating withholding agents from
applying the withholding tax on credit transfers.
The table below shows the number of transactions carried out during the six-month period ended June 30, 2014
compared with the same period of the previous year.
Number of transactions
Jun-13 Jun-14 change %
Incoming bank transfers
4,024,750 4,405,664 9%
Outgoing bank transfers
3,107,542 2,716,043 -13%
Cards* 31,978,412 36,511,091 14% Trans. with UCI branches
659,583 688,242 6%
Cheques 97,218 91,518 -6%
Misc. transactions 5,754,163 6,321,237 10%
TOTAL 45,621,668 50,743,795 11%
*POSpaymentsandATM,CreditCard,DebitCard,VPAYwithdrawals,top‐upsofReloadablecardsandFASTPayPayments**TelepassFamilycharges,RIDdirectdebits,MAV/RAV,RIBA,mobilephonetop‐ups,Pensions,F24PaymentsandPostalPayments

Interim Report on Operations
- 25 -
INVESTING
As part of its business, FinecoBank uses an open architecture business model to offer customers an extremely wide
range of asset management products - comprising collective asset management products, such as units of UCITS and
SICAV shares - from carefully selected Italian and international investment firms.
As at June 30, 2014, FinecoBank had signed placement agreements with 64 Italian and international investment firms
for the distribution of approximately 5,000 UCITS and SICAV sub-funds.
With a view to identifying the best products from the range to propose to customers and thereby optimize service
levels, FinecoBank has developed an additional selection process as part of the monitoring of its range of products,
aimed at identifying the best products available on the market at any time.
With this goal in mind, investment programmes were created starting in 2011, in partnership with Pioneer Investments
as manager. Exclusively targeted to the bank’s customers, the investments take the form of funds of funds (“Core
Series”) that invest in the best funds from among those distributed by the Bank, by individual asset class.
Through its financial advisors, FinecoBank offers its customers a traditional investment advisory service and, since
2010, an advanced advisory service called Fineco Advice.
Fineco Advice is an advisory platform that enables financial advisors to:
run diagnostics on customer portfolios invested with FinecoBank or with other banks, and conduct a detailed
mapping of asset allocation, the risk/return profile of the customer’s portfolio, the cost of each individual
instrument in which the portfolio is invested and the overall efficiency of the portfolio;
monitor portfolios invested with FinecoBank, which takes the form of ongoing advice on asset allocation, the
selection of individual financial instruments (strongly focused on high quality instruments in terms of ratings and
liquidity, among other aspects) and their consistency over time with the risk/return profile selected by the
customer.
Through its financial advisors FinecoBank also offers customers the option to subscribe different types of insurance
products and supplementary pension products offered by numerous insurance companies or investment firms.
Customers can thus benefit from health competition, which reflects on the quality of the products and services offered,
and have their varying needs met in relation to different levels of risk appetite.
The table below shows the amount of assets under management of Fineco customers, including both those linked to a
financial advisor and online customers.
06.30.2014 % 12.31.2013 % Change % Change
UCITS and other investment funds 19,579,138 90.8% 17,691,343 90.6% 1,887,795 10.7%Insurance products 1,968,314 9.1% 1,805,235 9.2% 163,079 9.0%Segregated accounts 15,077 0.1% 41,901 0.2% (26,824) -64.0%Total managed assets 21,562,529 100.0% 19,538,479 100.0% 2,024,050 10.4% (Amounts in € thousand)
THE NETWORK OF FINANCIAL ADVISORS
The first half of 2014 was marked by "outstanding” results; the half year was the best ever for FinecoBank, in terms of
quantitative and qualitative growth, confirming the constant attention paid to these two factors, which have driven the
Bank's growth over the past few years. Specifically, the following results were achieved in the first half of 2014:
total net sales of €1,773 million;

Interim Report on Operations
- 26 -
net assets under management of €1,355 million;
net sales of advisory services of €778 million;
new accounts opened in the first half: 41,050 new accounts.
The focus on advisory services has been and will be one of the central factors for 2014, which has been dubbed "the
advisory year”:
- with respect to the "fee only” advisory service called "Fineco Advice", the Bank’s objective has been to reach as
wide a coverage as possible, including through intensive training for all levels of the network and setting KPIs for
managers, in order for the whole organization to share the focus on this service, which aims to control risk and
eliminate conflicts of interest;
- as regards the CORE range, no new CORE Series sub-funds were introduced, with the Bank focusing its attention
on the insurance segment (called CORE Unit), introducing the new ADVICE Unit solution: a unit-linked life
insurance policy exclusively distributed by Fineco, which allows for maximum customization of investments while
ensuring the financial efficiency provided by the “Advice” advisory service.
As for the Wealth Management segment, high-level training courses were organized for participants in the Fineco
Wealth Advisor Forum (this training will be gradually extended to the whole network), in order to better target
consulting services to the Bank’s private customers, who represent a significant and growing portion of the network:
2% in terms of number of customers (15,035) and 37% in terms of assets (€14,398 million). The year's communication
campaigns and promotional initiatives had the same objective of supporting growth and increasing Fineco’s
attractiveness to top-end customers. In particular, the advertising campaign (a powerful campaign in terms of intensity
and geographical coverage) promotes brand awareness and focuses on the status the Bank is aiming for in terms of
positioning.
The promotional initiatives aimed at acquiring new customers were run for longer periods of time and, more
importantly, were designed using segmentation criteria that reward the assets transferred, consequently directing
efforts towards high-end customers.
With regard to customer events, new formats were introduced for this segment, with exclusive and high-value
meetings. In general, the number of events held decreased in the first half of the year, while the quality and returns of
those events increased (413 events were held which saw the participation of about 13,300 customers).
Recruiting has also played an important role. Since the beginning of the year 77 new PFAs have been hired, with a
background in banking and networks. In addition to these professionals, 29 “inexperienced” employees were recruited
as part of the “youth project”.
As at June 30, 2014, the network was made up of 2,500 personal financial advisors, who operate countrywide through
320 financial stores (Fineco Centers), managed directly by the Company or by the financial advisors themselves.

Interim Report on Operations
- 27 -
Personal Financial Advisors Network - assets
06.30.2014 % 12.31.2013 % Change % Change
Current accounts and demand deposits 8,326,223 21.2% 7,390,277 20.4% 935,946 12.7%Time deposits and reverse repos 1,330,309 3.4% 1,319,221 3.6% 11,088 0.8%BALANCE DIRECT SALES 9,656,532 24.5% 8,709,498 24.1% 947,034 10.9%
Segregated accounts 15,077 0.0% 41,901 0.1% (26,824) -64.0%UCITS and other investment funds 19,196,941 48.8% 17,344,996 47.9% 1,851,945 10.7%Insurance products 1,870,419 4.8% 1,703,434 4.7% 166,985 9.8%BALANCE ASSETS UNDER MANAGEMENT 21,082,437 53.6% 19,090,331 52.7% 1,992,106 10.4%
Government securities, bonds and stocks 8,615,054 21.9% 8,392,123 23.2% 222,931 2.7%BALANCE ASSETS UNDER ADMINISTRATION 8,615,054 21.9% 8,392,123 23.2% 222,931 2.7%
BALANCE DIRECT AND INDIRECT SALES 39,354,023 100.0% 36,191,952 100.0% 3,162,071 8.7%
The table above shows the breakdown of the managed assets attributable to the personal financial advisors network
as at June 30, 2014. Total assets, amounting to €39,354 million, increased by 8.7% compared to December 31, 2013.
C o mpo sit io n o f T o tal Sto ck o f A ssets P erso nal F inancial A dvisers N etwo rk as at
June 30, 2014
0.0%
4.8%
48.8%
53.6%46.4%
Administred/Direct GPF/GPMFunds InsuranceM anaged
Administred/Direct Managed
C o mpo sit io n o f T o tal Sto ck o f A ssets P erso nal F inancial A dvisers N etwo rk as at
D ecember 31, 2013
47.3% 52.7%
47.9%
4.7%
0.1%
Administred/Direct GPF/GPMFunds InsuranceM anaged
Administred/Direct Managed
Personal Financial Advisors Network - total net sales
1 st HALF 2014 % 1 st HALF 2013 % Change % Change
Current accounts and demand deposits 936,314 52.8% 415,394 26.9% 520,920 125.4%Time deposits and reverse repos (21,375) -1.2% (142,875) 121,500 -85.0%DIRECT SALES 914,939 51.6% 272,519 26.9% 642,420 235.7%
Segregated accounts (26,867) -1.5% (86,054) -5.6% 59,187 -68.8%UCITS and other investment funds 1,265,710 71.4% 1,675,818 108.6% (410,108) -24.5%Insurance products 115,703 6.5% (72,783) -4.7% 188,486 n.c.ASSETS UNDER MANAGEMENT 1,354,546 76.4% 1,516,981 98.3% (162,435) -10.7%
Government securities, bonds and stocks (496,398) -28.0% (246,155) -15.9% (250,243) 101.7%ASSETS UNDER ADMINISTRATION (496,398) -28.0% (246,155) -15.9% (250,243) 101.7%
TOTAL NET SALES - PFA NETWORK 1,773,087 100.0% 1,543,345 109.3% 229,742 14.9%(Amounts in € thousand)

Interim Report on Operations
- 28 -
Total net sales for the first half of 2014 stood at over €1,773 million, with a strong focus on assets under management
and Advisory services. More specifically, net sales from assets under management amounted to €1,355 million, while
the CORE Series, CORE Unit and Advice services generated €776 million in sales.
The acquisition of new customers proved to be an important growth driver, with 41,050 current accounts opened in the
first half through the financial advisors.
RELATED-PARTY TRANSACTIONS
In order to ensure full compliance with current legislative and regulatory provisions on disclosure of related-party
transactions, on December 13, 2010, FinecoBank approved the provisions for related-party transactions, in
compliance with the provisions of the Consob Regulation, approved by Resolution no. 17221 of March 12, 2010 and
subsequently amended by Resolution no. 17389 of June 23, 2010. On December 17, 2013 and January 27, 2014,
respectively, the Board of Directors of the Bank approved the “Global Policy for the management of transactions with
parties involving conflicts of interest" (Related Parties as defined by Consob, Associated Persons as defined by the
Bank of Italy and Bank Officers pursuant to Article 136 of the Consolidated Law on Banking (TUB)” (“Global Policy”)
and the “Global Operational Instructions for the management of transactions with parties involving conflicts of interest”,
issued by the Parent Company UniCredit as part of its management and coordination of subsidiaries.
In order to establish principles and rules that the Bank should apply as protection against the risks arising from
situations of potential conflict of interest due to specific persons having close relations with the Bank’s decision-making
centers, the Board of Directors of FinecoBank in the meeting of May 15, 2014 approved, with the prior favourable
opinion of the Audit and Related Parties Committee and the Board of Statutory Auditors, its "Procedures for the
management of transactions with parties involving conflicts of interest (the" Procedures "). The Procedures are
intended to provide a systematic overview, covering all governance aspects and areas of application, as well as
procedural and organizational aspects. They contain rules to be observed in the management of:
Related-Party transactions pursuant to the Consob Regulation adopted by resolution 17221 of March 12, 2010, as
amended;
Transactions with Associated Persons pursuant to the regulations on "Risk assets and conflicts of interest with
respect to Associated Persons, laid down by Bank of Italy Circular 263/2006, Title V, Chapter 5 ("New regulations
for the prudential supervision of banks”, as amended);
Obligations of Bank Officers pursuant to Article 136 of Legislative Decree 385 of September 1, 1993, “Consolidated
Law on Banking”.
The Procedures were drafted based on the fact that FinecoBank S.p.A. is a listed company, which means that the
legislation applicable to Issuers listed on regulated markets is directly relevant, but also considering that the bank
belongs to the UniCredit Banking Group and, accordingly, the parent company UniCredit exercises management and
coordination in this regard.
In the first half of 2014
1. two non-standard transactions were carried out with related parties/associated persons, based on the approval of
the Board of Directors on March 27, 2014, and specifically:
a material transaction, concerning the change in the liquidity investment policy of FinecoBank with the Parent
Company UniCredit S.p.A.;
and

Interim Report on Operations
- 29 -
a minor transaction, concerning the appointment of MedioBanca S.p.A. as sponsor for the admission to the
listing of the ordinary shares of the Bank.
The above transactions were approved by UniCredit's Related-Parties and Equity Investments Committee and by
(i) all members of FinecoBank's Audit Committee, the above transaction with Mediobanca and (ii) only by
Independent Directors of the Committee, the new liquidity investment policy. The latter transaction was also
examined by the Board of Directors of the Parent Company, on a conservative basis, given that until listing - given
the existence of a 100% control relationship - inter-group transactions would be excluded from the above decision-
making procedures;
2. three transactions were carried out with related parties/associated persons, based on the approval of the Board of
Directors on April 15, 2014, and specifically:
a minor, non-standard transaction was carried out at market conditions with UniCredit Bank AG concerning the
appointment of the mentioned bank as Joint Global Coordinator and Joint Bookrunner in the placement of the
Company’s shares for the purpose of the Listing; the fees due to the Syndicate were paid by the selling
Shareholder;
a minor, non-standard transaction was carried out at market conditions with Mediobanca concerning the
appointment of the mentioned bank as Joint Bookrunner in the placement of the Company’s shares for the
purpose of the Listing; the fees due to the Syndicate were paid by the selling Shareholder;
and
a minor, non-standard transaction, was carried out with UniCredit at non-market conditions, being free of
charge, concerning the signing of an agreement acknowledging the licence agreement for the "Fineco”
trademark;
3. based on the approval of the Board of Directors on June 27, 2014, and the prior favourable opinion of the Audit
and Related Parties Committee, a transaction consisting in a “Framework Resolution - Repo transactions with
institutional clients, term deposits from retail customers and related use of liquidity”, which will be valid until
October 31, 2014, supplemented by the quantitative limits set by the Board of Directors on July 15, 2014. The
Audit and Related Parties Committee of FinecoBank expressed a favourable opinion on the above transaction.
During the first half of 2014, inter-group transactions and transactions with related parties in general, both Italian and
foreign, were conducted within the ordinary course of business and related financial activities of the Bank and were
carried out under conditions similar to those applied to transactions with unrelated third parties. Intra-group
transactions were carried out based on assessments of a mutual economic advantage, and the determination of
applicable terms and conditions took place in compliance with the criteria of substantial correctness, keeping in mind
the common goal of creating value for the entire UniCredit group. The same principle was also applied in relation to
the provision of intra-group services, combined with the principle of regulating such services at minimal rate solely to
recover related production costs.
For more information on this matter, please refer to the Notes to the condensed half-year financial statements - Part H
Related-Party Transactions.
During the six months ended June 30, 2014 no atypical or unusual transaction was carried out.

Interim Report on Operations
- 30 -
OPERATING STRUCTURE
HUMAN RESOURCES
As at June 30, 2014, FinecoBank’s workforce consisted of 989 people compared to 976 as at December 31, 2013; the
breakdown was as follows:
Human Resources June 30, 2014 December 31, 2013
FinecoBank employees 975 965
Workers with atypical contracts* (+) 3 1
Group employees seconded to FinecoBank (+) 5 4
FinecoBank employees seconded to the Group (-)** (2) (2)
Total human resources excluding Directors 981 968
Directors (+) 8 8
Total human resources 989 976
* 1 project-based staff member and 2 leased staff members as at June 30, 2014, 1 project-based staff member as at December 31, 2013.
** Of whom, one seconded on a 50% basis.
As in previous years, in the first half of 2014 the Bank’s activities to strengthen and optimize the workforce continued,
with a focus on business development, organizational support and control and risk management.
Twenty-five people were hired in the first six months of the year, of whom 3 from other Group Companies and 22 from
the market.
Of the 22 new recruits from the market, over half were employed in the CRM area. These were mainly young
graduates, who are offered the chance to start a process through which they can get to know the Company, by taking
on various positions within the different areas and functions of the Bank, and therefore the opportunity for professional
development in the future.
Again, in the first six months of the year, the Bank implemented an internal job rotation system involving 36 people,
through which, on one hand, it was able to fill vacant positions within the company, and, on the other, to ensure the
continued professional development of staff.
During the first half of the year, 15 employees left the Bank, including 2 who resigned and 11 who were transferred to
Group companies.
The total staff turnover rate was 4.1% (2.6% new recruits and 1.5% staff members leaving).

Interim Report on Operations
- 31 -
The Bank’s workforce can be broken down as follows:
Category Men Women Total
06.30.2014 12.31.2013 06.30.2014 12.31.2013 06.30.2014 12.31.2013
Senior Managers 19 20 3 3 22 23
Managers 194 195 74 74 268 269
Professional Areas 337 339 348 334 685 673
Total 550 554 425 411 975 965
As at June 30, 2014 part-time staff totalled 67, accounting for 6.9% of the workforce, with the female employees
representing around 44%.
Average staff seniority was 6.9 years, while the average age was approximately 38 years.
EMPLOYEE TRAINING
In the course of the 1st half of 2014, staff training focused both on the acquisition and consolidation of skills according
to business needs and on the continuing professional development of individual skills, focusing training hours on
mandatory, technical and linguistic training.
MANDATORY TRAINING
FinecoBank is committed to the establishment and strengthening of a risk and compliance culture across the
organization, in order for our business to stay not only profitable but also sustainable over time.
For this reason, during the first half of 2014, the Bank paid great attention to mandatory training for all employees who
attended the courses both in e-learning mode, using the Group My Learning Platform, and through live seminars for
specific subjects. Staff attendance at the courses was monitored in order to ensure that all employees acquired full
understanding of the compulsory subjects, thereby insulating the Company against operational, legal and reputational
risks.
The training was especially focused on anti-money laundering issues. In collaboration with the Compliance Officer, a
plan was launched that has involved and will involve employees at various levels in live seminars and workshops
throughout 2014. Approximately 63 hours of training were provided in the first half of the year.
In addition, during the first six months, mandatory attendance at the Operational Risks course was extended to the
entire workforce.
Technical and behavioural training
During the first six months of the year, training sessions were organized for the acquisition of technical skills needed to
improve company productivity and the level of employee specialization.
The training was especially targeted at ICT staff who, in 2013, had already benefited from extensive training for special
projects.
Risk Management and Compliance staff attended several specific technical courses requested by the heads of
function and had the opportunity - like all positions within the Bank - to undertake the Risk Diploma Path organized by
the UniCredit Group Risk Academy (dedicated to risk training) via the Group My Learning platform.

Interim Report on Operations
- 32 -
In the Customer Care area, training courses were held for “new recruits” on technical subjects, as well as “ongoing”
training courses on technical and behavioural subjects (with a special focus on Communication and Service), with a
view to maintaining high quality service standards and a constant customer focus.
Training in support of the Bank’s Business Continuity plan also continued, through coaching certified in a register of
activities.
Finally, the coaching programme started in 2013 was completed in the first half of 2014.
Foreign language training
During the first half of 2014, 284 employees were involved in foreign language training through participation in English
courses (either in the classroom or over the telephone) that will end in the second half of the year. In some cases (e.g.
Executives) received "one-to-one" training courses in Business English. German courses continued for around 10
employees. Employee participation in foreign language training is based on requests made by the individual heads of
function, according to the specific professional needs of their colleagues.
TECHNOLOGY INFRASTRUCTURE
There are essentially six elements to FinecoBank's information system:
Banking application software;
On-line Trading system (dedicated applications for the real-time sale/purchase of securities and financial
instruments on the main European and American markets);
A management system for the operations room and for institutional investors, and access to the information/order
sections of numerous Italian/foreign markets;
A management system for investment services such as Funds, SICAVs and Bank Insurance;
A credit card management system, with the issue of cards for Visa and MasterCard circuits;
A personal financial advisors network management system, enabling advisors to work on all FinecoBank products
through a single portal.
In the first half of 2014, the ICT Area carried out its usual activities for the technological upgrading, consolidation and
development of the Information System in order to provide new and more versatile added value services to customers.
Specifically, from an architectural perspective, work continued on optimizing infrastructure and applications, as well as
the continuous improvement and fine-tuning of the applications security architecture.
The main projects included:
- The new Logos account;
- ADVICE, aimed at improving the financial advisory service offered to customers.
In the banking sector, the third release of MoneyMap was issued together with the related app for the mobile channel.
On the SEPA channel, recurrent bank transfers were enabled and customers without the SMSPIN feature have been
given the option to transfer money with next business day account crediting.
As for the trading segment, new CFDs on U.S. and UK stocks were released.

Interim Report on Operations
- 33 -
INTERNAL CONTROL SYSTEM
The internal control system is a fundamental part of the overall governance system of banks; it ensures that
operations are carried out in line with the Bank strategies and policies and based on principles of sound and
prudent management.
Circular no. 263 of December 27, 2006 - 15th update of July 2, 2013 - defines the principles and guidelines to which
the internal control system of banks must conform; in this respect, the general principles of organization are defined, the
role and responsibilities of governing bodies are specified and the characteristics and roles of corporate control functions
are outlined.
The internal control system must provide protective measures that cover all types of business risk. The primary responsibility
for these tasks lies with the bank’s bodies, each in accordance with its specific duties. The structure of tasks and lines of
responsibility of corporate functions and bodies must be clearly specified.
Banks, including FinecoBank, must apply the provisions according to the proportionality principle, i.e. taking into
account the operating scale and organizational complexity, the nature of the activities carried out and type of services
provided.
As part of the supervisory review and evaluation process, the Bank of Italy verifies the banks' internal control system in
terms of completeness, suitability, functionality (in terms of efficiency and effectiveness) and reliability.
In accordance with the provisions laid down by the Regulatory Authority, the internal control system of the Bank
consists of a set of rules, functions, organizational structures, resources, processes and procedures aimed at
ensuring the achievement of the following objectives, in compliance with the principles of sound and prudent
management:
verifying the implementation of the Bank’s strategies and policies;
containing risk within the limits set out in the Bank Risk Appetite Framework - "RAF";
preventing the Bank’s involvement, even if unintentional, in unlawful activities (with specific reference to
money laundering, usury and the financing of terrorism);
protecting the value of assets and preventing losses;
ensuring the effectiveness and efficiency of corporate processes;
ensuring the security and reliability of the Bank information and ICT procedures;
ensuring transactions’ compliance with the law, supervisory regulations as well as internal policies, procedures
and regulations.
In terms of the methods applied, the internal control system of Fineco is based on four types of controls:
level one controls (“line controls”): these are controls relative to individual activities and are carried out according
to specific operational procedures based on a specific internal regulation. Monitoring and continuously updating
these processes is entrusted to "process supervisors" who are charged with devising controls able to ensure the
proper performance of daily activities by the staff concerned, as well as the observance of any delegated
powers. The processes subject to control relate to units that have contact with customers as well as completely
internal Bank units;
level two controls: these are controls related to daily operations connected with the process to measure

Interim Report on Operations
- 34 -
quantifiable risks and are carried out by units other than operating units, on an ongoing basis. the Risk
Management function controls market, credit and operational risks, as regards compliance with limits assigned to
operating functions and the consistency of operations of individual production areas with established risk/return
objectives; the Compliance Officer function is responsible for controls on non-compliance risks;
level three controls: these controls are typical of internal auditing, based on analysis of information obtained from
databases or company reports, as well as on-site controls. The purpose of these controls is to check the
functioning of the overall internal control system and identify any anomalous trends, or infringements of
procedures or regulations. These controls are assigned to the Internal Audit function, which operates at a central
level, at UniCredit, based on a specific service agreement;
institutional supervisory controls: these refer to controls by Bank bodies, including in particular the Board of
Statutory Auditors and the Supervisory Body pursuant to Legislative Decree no. 231 of 8 June 2001.
Considering the functions and structures involved, the Internal Control System is based on:
control bodies and functions including, to the extent of each of their respective areas of responsibility, the Board
of Directors, the Audit and Related Parties Committee, the Remuneration and Appointments Committee, the
Managing Director and the General Manager, the Board of Statutory Auditors, the Supervisory Body set up
pursuant to Legislative Decree 231/01 and the corporate control functions (Risk Management, Compliance3,
Internal Audit) as well as other company functions with specific internal control duties4;
procedures for the coordination of entities involved in the internal control and risk management system; these
procedures provide for:
o cooperation and coordination among control functions, through specific information flows that are formalized
in internal regulations and through managerial committees dedicated to control issues;
o application of the Group coordination model defined as part of the management and coordination activity
carried out by the Parent Company;
o definition of information flows both between corporate bodies and control functions within the Bank, and with
the Parent Company, in order for the latter to be able to properly carry out its management and coordination
activities.
MAIN RISKS AND UNCERTAINTIES
For more details of the risks and uncertainties faced by the Bank in the current market situation, reference is made to
Part E – Information on risks and hedging policies of the Notes to the Accounts.
3This function includes the Anti Money Laundering Service, responsible for managing the correct application of regulations on anti money laundering and combating the financing of terrorism. 4The legislative framework and the codes of conduct assign control tasks to specific functions - other than corporate control functions - whose work should be seen as being a functional part of the Internal Control System. In the specific case of FinecoBank, these include the Local Control System for legislation concerning related-party transactions carried out with associated persons in a conflict of interest situation (under the responsibility of the Corporate Affairs Unit of the Legal & Corporate Affairs Department), the Nominated Official in charge of drawing up Company Accounts pursuant to Article 154-bis of the Consolidated Finance Act (identified as the Bank's CFO), the Officer in charge of Health and Safety at Work; the Human Resources function, the Head of Business Continuity & Crisis Management and the Head of Outsourcing Management. All corporate functions, other than corporate control functions, also participate in the Internal Control System by carrying out the level-one controls included in the business processes within their responsibility.

Interim Report on Operations
- 35 -
ORGANIZATIONAL STRUCTURE
The organizational structure of the Bank is consistent with the Group Organization Guidelines issued by the Parent
Company UniCredit S.p.A.
The Guidelines set out organizational principles and rules designed to ensure their uniform application across all
Group Legal Entities, through:
clear organizational principles and criteria;
specific organizational documents;
suitable processes for organizational changes.
The Group Organization Guidelines set out structured organizational rankings on four levels (Division, Department,
Unit and Team) based on their size and the organizational complexity of the operations overseen.
During the first half of 2014, one the most significant organizational changes concerned the Investment Services
Department. More specifically, as an alternative to the standardized services for retail customers, Fineco offers a new
Asset Protection service to customers in the Private Banking segment and the PFA Network, and especially the
Wealth Advisors; the new service provides assistance, support and training on topics related to asset protection and
the generational transfer of wealth. The new service is offered through external consultants and companies
specializing in estate planning and taxation, asset protection and optimization of real estate assets.
Accordingly, the Investment Services Department was assigned new responsibilities and was renamed as "Investment
and Wealth Management Services Department".
In summary, the Department’s new activities will cover the following areas:
training and assistance to the network of advisors on legal, corporate and tax matters related to asset protection
and the planning and management of the generational transfer of wealth;
organization of events aimed at strengthening the relationship with customers in the “Private Banking” segment.
Organizational Model
Fineco’s current organizational model is based on a functional model.
A functional model promotes economies of scale and facilitates the development of vertical skills and knowledge within
each area. The model guarantees the necessary decision-making mechanisms, whilst maintaining the "horizontal link"
between the various functions. Although the current arrangement applies the concept of "functional" specialization, a
project-based approach is maintained for every phase of definition and release of products and services.
The horizontal links are guaranteed by the work of specific committees that monitor business lines and the progress of
the most important projects, also to guarantee the necessary synergies of distribution channels.
The following organizational units report to the Managing Director: Network PFA Department, Investment Services and
Wealth Management Department, Direct Bank Department, CFO Department (Chief Financial Officer), CRO
Department (Chief Risk Officer), Network Controls, Monitoring And Services Department, Legal & Corporate Affairs
Department, GBS Department (Global Banking Services), Human Resources Unit, Compliance Officer Unit, and
Identity & Communications Team.
The organizational model identifies four main functional lines, which govern:
- the sales network (Network PFA Department);
- investment services (Investment Services and Wealth Management Department);
- direct banking (Direct Bank Department);

Interim Report on Operations
- 36 -
- operational functioning (GBS Department).
In summary:
- The Network PFA Department is responsible for overseeing the management and development of Fineco’s
network of financial advisors;
- The Investment Services And Wealth Management Department is responsible for monitoring the development
of products placed by the Bank and the financial advisory services provided to all Customers;
- The Direct Bank Department is responsible for overseeing the development of new products and services in the
two core components of Fineco (Trading and Banking) and the related placement process through direct channels
(Internet and telephone);
- The Investment Services And Wealth Management Department and the Direct Bank Department work closely
with each other in order to develop a combined and synergistic offering of products and services to customers, in line
with the Bank’s marketing and business strategies.
- The GBS (Global Banking Services) Department coordinates the organizational units in charge of monitoring the
organizational/operating processes and the ICT and logistics systems needed to ensure the effective and efficient
operation of business support systems. The following organizational units report to the GBS Department: Information
Security & Fraud Management Team, ICT – Information & Communication Technology Department, CRM – Customer
Relationship Management Department, Organization & Bank Operations Department, Financial Operations
Department, Network Services Unit, General Services Unit.
The synergies between the distribution channels and the monitoring of decision-making processes that cut across the
Departments are ensured by a Management Committee.
As regards audit activities, FinecoBank, in line with the instructions of the Parent Company, has adopted an
outsourcing model based on a specific service agreement signed with UniCredit, acting as Group outsourcer. Under
the model, the Audit and Related Parties Committee (a committee established within the Board of Directors) is
responsible for liaising with the Bank and the outsourcer, in addition to supporting the Board of Directors – with
information, advisory, recommendation and investigation functions – using a risk-oriented approach to identify the
guidelines for the entire internal control system and the assessment of its effectiveness and efficiency.
The functioning and jurisdiction of the above Committee are defined in the Board of Directors' Rules and Regulations.
The organizational structure of FinecoBank is as follows:

Interim Report on Operations
- 37 -
In relation to and in order to meet, FinecoBank’s operational needs in view of the stock market listing, the Bank had to
make some organizational changes. In this regard, on May 15, 2014 the Board of Directors passed resolution to
assign the duties of General Manager to the Managing Director of the Bank, effective from July 1, 2014; the said
duties will consist of supervising the ordinary management of FinecoBank and hierarchically reporting to the Board of
Directors.
Moreover, with regard to the management of relations with investors and intermediaries, FinecoBank set up the new
role of Investor Relator who represents the Bank vis à vis the national and international financial community. The
Investor Relator is therefore the point of contact between the Bank and the market and works with the entire company
to maintain and promote compliance with regulations on corporate reporting.
To carry out this activity, FinecoBank has adopted an outsourcing method based on a specific service agreement
signed with UniCredit, appointing a UniCredit employee as Head of Investor Relations ([email protected]).

Interim Report on Operations
- 38 -
MAIN BALANCE SHEET AGGREGATES
ASSETS 06.30.2014 12.31.2013 Amount %
Cash and cash balances 14 5 9 180.0%
Financial assets held for trading 10,407 4,700 5,707 121.4%
Loans and receivables with banks 13,476,117 16,330,912 (2,854,795) -17.5%
Loans and receivables with customers 696,142 641,250 54,892 8.6%
Financial investments 1,715,320 93,114 1,622,206 1742.2%
Hedging instruments 35,637 179,265 (143,628) -80.1%
Property, plant and equipment 11,391 10,772 619 5.7%
Goodwill 89,602 89,602 - -
Other intangible assets 7,915 8,014 (99) -1.2%
Tax assets 42,891 67,934 (25,043) -36.9%
Other assets 227,865 256,629 (28,764) -11.2%Total assets 16,313,301 17,682,197 (1,368,896) -7.7%
(Amounts in € thousand)
Changes
LIABILITIES AND SHAREHOLDERS' EQUITY 06.30.2014 12.31.2013 Amount %
Deposits from banks 1,026,852 1,648,675 (621,823) -37.7%
Deposits from customers 13,911,224 12,732,309 1,178,915 9.3%
Debt securities in issue 421,965 2,322,511 (1,900,546) -81.8%
Financial liabilities held for trading 4,867 2,301 2,566 111.5%
Hedging instruments 48,960 178,574 (129,614) -72.6%
Provisions for risks and charges 110,507 109,354 1,153 1.1%
Tax liabilities 52,975 37,701 15,274 40.5%
Other liabilities 264,249 231,623 32,626 14.1%
Shareholders' equity 471,702 419,149 52,553 12.5%
- capital and reserves 392,928 329,719 63,209 19.2%- revaluation reserves for available-for-sale financial assets and actuarial gains (losses) from defined benefit plans 4,912 4,214 698 16.6%- net profit (loss) 73,862 85,216 (11,354) -13.3%
Total liabilities and shareholders' equity 16,313,301 17,682,197 (1,368,896) -7.7%
(Amounts in € thousand)
Changes

Interim Report on Operations
- 39 -
Financial assets held for trading
Financial assets held for trading consist of:
bonds, shares and derivatives classified as HFT (held for trading), amounting to €5.4 million, held in the
Bank's portfolio as a result of trading activity, and intended to be traded in the short term. In June 2014, two
transactions were carried out (arbitrages related to share capital increases) in order to leverage the Bank’s
large Portfolio of Assets, i.e. the amount of securities that clients make available to the Bank and which
provide a return only if used by the Bank. In addition, as a service to customers, the Bank assessed the
opportunity of avoiding customers losing the full value of certain not sold and not exercised rights, whose
value may be especially high in the event of a strongly dilutive capital increase. Both transactions are totally
risk free, being fully hedged;
the positive valuation of spot contracts for securities in the HFT portfolio and currencies to be settled in time
frames established by market practices ("regular way") for €3.6 million, which correspond to negative
valuations booked under item 40 "Financial liabilities held for trading";
the positive valuation of CFDs on indices and Forex for €1.4 million;
CFDs on indices and currencies are "Over the counter" derivative contracts that require the payment of a differential
generated by the difference between the opening and closing price of the financial instrument. The bank in operational
terms covers the imbalance of customer positions, by underwriting futures on the indices underlying the CFDs on
indices, or through Forex transactions with institutional counterparties to hedge CFD transactions in open currencies
with customers' currency; consequently, the positive valuation booked under "Financial assets held for trading" more
or less balanced the negative valuations booked under "Financial liabilities held for trading".
Loans and receivables with banks
06.30.2014 12.31.2013 Amount %
Current accounts and demand deposits 1,378,975 9,433,356 (8,054,381) -85.4%Time deposits 3,016,939 3,563,334 (546,395) -15.3%Other loans: 1 Reverse repos 45,318 5,584 39,734 711.6% 2 Other 22,480 6,022 16,458 273.3%Debt securities 9,012,405 3,322,616 5,689,789 171.2%Total 13,476,117 16,330,912 (2,854,795) -17.5%(Amounts in € thousand)
Changes
Loans and receivables with banks for current accounts and demand deposits mainly consist of accounts held with
UniCredit, with a book value of €1,357 million and to a lesser extent, of current accounts held with non-Group Banks
for transactions in securities.
The time deposits recognized under assets consist of the deposit held with UniCredit for compulsory reserves, with a
book value of €130.5 million, in addition to time deposits held with UniCredit with a book value of €2,886.5 million,
opened in order to invest the funds collected through repos and CashPark transactions with retail customers and
repos with credit institutions, with the same maturities.
In the item Other Loans, the item Other relates to the amount of the initial margins placed with credit institutions from
derivative transactions as well as from current receivables associated with the provision of financial services.

Interim Report on Operations
- 40 -
The debt securities held in the portfolio and included in the category “Loans and receivables” mainly consist of debt
securities issued by UniCredit for an amount of €9,012 million.
As regards the increase in securities held in the portfolio compared to December 31, 2013, it should be noted that, as
part of the listing process, the Board of Directors' meeting on March 27, 2014 approved the main guidelines for the
liquidity investment policy, in force from April 1, 2014. More specifically, for the stable "Core” liquidity, the Bank
purchased UniCredit bonds with maturities ranging from 2 years and 10 months to 7 years and 6 months, for a total
nominal amount of €7,650 million and USD 250 million and with interest rates calculated considering, for each
maturity, the annual average, in the year preceding the issue date, of the secondary market spreads applied to
UniCredit medium to long-term senior bonds issued on the institutional market. These types of investment were
determined by taking into account the overall structure of the Bank’s balance sheet and with a view to optimizing its
liquidity risk profile, in line with the amount of sight deposits considered as “Core” (which therefore can be invested in
the medium/long term) and with the objective of diversifying these investments in terms of maturities. The bonds
issued by UniCredit and reserved for FinecoBank are freely transferable to third parties throughout the term of the
bond.
At the same time, debt securities included in the category "Loans and receivables", issued by UniCredit and held by
Fineco at December 31, 2013, with a nominal value of €1,850 million and USD 70 million were sold to UniCredit, as,
following the purchase of the bonds mentioned above, maintaining these securities in the portfolio was no longer
considered appropriate.
Loans and receivables with customers
06.30.2014 12.31.2013 Amount %
Current accounts 111,720 101,195 10,525 10.4%Reverse repos 163,596 120,860 42,736 35.4%Mortgages 67 76 (9) -11.8%Credit cards and personal loans 297,614 319,087 (21,473) -6.7%Other loans 123,144 100,031 23,113 23.1%Debt securities 1 1 - 0.0%Total 696,142 641,250 54,892 8.6%(Amounts in € thousand)
Changes
Loans and receivables with customers, amounting to €696 million, can essentially be broken down as follows:
€411 million in loans to ordinary customers;
€163 million in reverse repos;
€45 million in collateral deposits, initial and variation margins with clearing houses for derivative transactions;
€77 million relating to current receivables associated with the provision of financial services.

Interim Report on Operations
- 41 -
Reverse repos are represented by "Multiday leverage" transactions, securities lending transactions guaranteed by
sums of money readily available to the lender and which are basically the equivalent of repos on securities.
Other loans mainly consist of collateral deposits, initial and variation margins with clearing houses for derivative
transactions, mostly on behalf of third parties, as well as current receivables associated with the provision of financial
services.
Loans and receivables with customers(Management reclassification) 06.30.2014 12.31.2013 Amount %
Current accounts 108,715 98,455 10,260 10.4%Use of credit cards 197,736 219,010 (21,274) -9.7%Personal loans 98,084 98,241 (157) -0.2%Other loans 1,377 1,402 (25) -1.8%Performing loans 405,912 417,108 (11,196) -2.7%
Current accounts 3,005 2,740 265 9.7%Mortgages 67 76 (9) -11.8%Use of credit cards 111 130 (19) -14.6%Personal loans 1,683 1,706 (23) -1.3%Other loans 22 24 (2) -8.3%Impaired loans 4,888 4,676 212 4.5%
Loan receivables with ordinary customers 410,800 421,784 (10,984) -2.6%
Reverse repos 163,577 120,804 42,773 35.4%Reverse repos - impaired 19 56 (37) -66.1%Collateral deposits and initial and variation margins 44,995 32,007 12,988 40.6%Current receivables associated with the - -provision of financial services 76,750 66,598 10,152 15.2%Debt securities 1 1 - 0.0%Current receivables and other receivables 285,342 219,466 65,876 30.0%
Loans and receivables with customers 696,142 641,250 54,892 8.6%(Amounts in € thousand)
Changes
The portfolio of loan receivables with ordinary customers mainly consists of receivables for personal loans, current
accounts and credit card use; overall, loans to ordinary customers decreased by 2.6%, due to a lesser use of credit
cards with full payment of the balance at term partly offset by a greater use of current account credit lines.
Impaired assets
Category06.30.2014 12.31.2013 06.30.2014 12.31.2013 06.30.2014 12.31.2013 06.30.2014 12.31.2013
Non-performing loans 17,884 17,664 (14,473) (14,387) 3,411 3,277 80.93% 81.45%Doubtful loans 1,967 2,065 (1,330) (1,392) 637 673 67.62% 67.41%Past-due loans 1,540 1,444 (680) (663) 860 781 44.16% 45.91%Total 21,391 21,173 (16,483) (16,442) 4,908 4,731 77.06% 77.66%(Amounts in € thousand)
Gross amount Impairment provision Net amount Coverage ratio

Interim Report on Operations
- 42 -
The amount of impaired loans net of impairment losses was €4.9 million, €3.4 million of which in non-performing loans,
€0.6 million in doubtful loans and €0.9 million in past-due loans. Impaired loans mostly relate to current account
overdrafts, credit card use and personal loans.
Impaired customer loans represent 1.19% of loan receivables with ordinary customers, up against the figure of 1.12%
as at December 31, 2013 as a result of the reduction in loans for use of credit cards with full payment of the balance at
term.
Financial investments
06.30.2014 12.31.2013 Amount %
Financial assets designated at fair value through profit or loss - 3,199 (3,199) -100.0%Available-for-sale financial assets 1,715,320 89,915 1,625,405 1807.7%Total 1,715,320 93,114 1,622,206 1742.2%(Amounts in € thousand)
Changes
Debt securities classified as Financial assets at fair value through profit or loss in the portfolio as at December 31,
2013 were sold during the first half of 2014.
Available-for-sale financial assets comprise debt securities issued by governments, including in particular Italian
government bonds with a book value of €1,705 million, French government bonds with a book value of €10.3 million,
and investments in companies in which the Bank does not exercise control or significant influence amounting to €5
thousand, including 20 shares of UniCredit Business Integrated Solutions S.c.p.A. totalling €172.
As regards the increase in debt securities compared to December 31, 2013, in the first half of 2014, as part of the
guidelines for the new liquidity investment policy that entered into force on April 1, 2014, the portion of liquid assets
classified as "Non Core" was invested in Italian government bonds for a nominal amount of €1,500 million while
derivative contracts were entered into at the same time in order to convert the fixed rate into a floating rate in
compliance with pre-defined limits on interest rate risk.
A portion of debt securities classified in the Available-for-sale financial assets portfolio are entirely used as collateral
for bankers' drafts or guarantees with third parties for a book value of €91.6 million.

Interim Report on Operations
- 43 -
Hedging instruments
06.30.2014 12.31.2013 Amount %
Asset hedging derivatives - positive valuations 646 47,784 (47,138) -98.6%Liability hedging derivatives - positive valuations 9,280 75,359 (66,079) -87.7%Adjustment to the value of assets underportfolio hedge 25,711 56,122 (30,411) -54.2%Total assets 35,637 179,265 (143,628) -80.1%
of which:Positive valuations 10,664 125,197 (114,533) -91.5%Related accrued assets and liabilities (738) (2,054) 1,316 -64.1%Adjustments to the value of hedged assets 25,711 56,122 (30,411) -54.2%Total assets 35,637 179,265 (143,628) -80.1%
Asset hedging derivatives - negative valuations 38,007 93,987 (55,980) -59.6%Liability hedging derivatives - negative valuations 572 47,814 (47,242) -98.8%Adjustment to the value of assets underportfolio hedge 10,381 36,773 (26,392) -71.8%Total liabilities 48,960 178,574 (129,614) -72.6%
of which:Negative valuations 36,676 144,546 (107,870) -74.6%Related accrued assets and liabilities 1,903 (2,745) 4,648 n.d.Adjustments to the value of hedged liabilities 10,381 36,773 (26,392) -71.8%Total liabilities 48,960 178,574 (129,614) -72.6%(Amounts in € thousand)
Changes
Summary of hedging derivative valuations 06.30.2014 Assets Liabilities Difference
Valuation of asset and liability hedging derivatives 10,664 36,676 (26,012)Change in fair value of hedged assets/liabilities 25,711 10,381 15,330Revaluation reserve before related taxation - (10,682) 10,682Total 36,375 36,375 -(Amounts in € thousand)
Hedged assets consist of receivables for personal loans due from retail customers, bonds issued by UniCredit
belonging to the “Loans and Receivables category” and securities issued by the Italian Central Government and
classified as “Available-for-sale financial assets”.
Hedged liabilities refer to bonds issued by FinecoBank, entirely subscribed by the Parent Company and recognized as
debt securities in issue.
Accruals relating to asset and liability hedging derivatives amount respectively to €-0.7 million and €1.9 million, and
are included in the net interest margin.
Positive and negative valuations of hedging derivatives relate solely to derivative contracts that the Bank has entered
into to provide a hedge against interest rate risk inherent in the above-mentioned assets and liabilities, whose income
statement effect is zero.

Interim Report on Operations
- 44 -
Property, plant and equipment
As in previous financial years, investments in electronic machines were made to guarantee the ongoing update of the
hardware used by all FinecoBank departments, and in particular by the IT department.
Investments in office furniture and fittings and equipment are primarily intended for use in new financial stores.
Property, plant and equipment
Balance 01.01.2014
Investments as at
06.30.2014
Other Changes-
Sales
Depreciation and write-downs as at
06.30.2014
Balance 06.30.2014
Properties 2,734 - - (57) 2,677Electronic machines 5,846 1,841 - (1,100) 6,587Office Furniture and Fittings 834 266 10 (210) 900Plant and machinery 1,358 109 - (240) 1,227TOTAL 10,772 2,216 10 (1,607) 11,391
(Amounts in € thousand)
Goodwill
As at June 30, 2014 there were no indicators of impairment of the goodwill recorded in the financial statements; For all
other information regarding impairment testing, carried out annually, see the Annual Report as at December 31, 2013.
As at June 30, 2014, the goodwill recorded in the financial statements was made up as follows:
06.30.2014 12.31.2013
Goodwill relating to Fineco On Line Sim S.p.A. 16,087 16,087Goodwill relating to the trading and banking division of Banca della Rete 2,034 2,034Goodwill relating to PFA division formerly FinecoGroup S.p.A. 3,463 3,463Goodwill relating to PFA division formerly UniCredit Xelion Banca S.p.A. 68,018 68,018Total 89,602 89,602(Amounts in € thousand)
Goodwill relating to Fineco On Line Sim S.p.A.
On April 3, 2001 the merger of Fineco On Line Sim S.p.A., the business division of Fineco Sim S.p.A., into FinecoBank
was completed.
This merger was carried out on the basis of a share swap ratio of 3.7 shares of the acquiring company for each share
of the acquired company, with a consequent increase in the share capital of FinecoBank. The difference between the
increase in capital of the acquiring company and the amount of shareholders' equity of the acquired company gave
rise to a share swap loss recorded under goodwill.
The balance, amounting to €16 million, is equal to the balance at January 1, 2004, the date of transition to IAS, plus
the unamortized amount of the substitute tax, paid for recognition of the loss for tax purposes.
Goodwill relating to the Trading and Banking division of Banca della Rete
On September 1, 2003, FinecoBank acquired the "On-line Banking" and "On-line Trading" business divisions of Banca
della Rete, as part of the business plan to rationalize the reorganization of Banca della Rete, in accordance with the
directives of the then Parent Company Capitalia S.p.A..
The amount of €2 million recorded in the balance sheet is the same as the amount as at January 1, 2004, the date of
transition to IAS.

Interim Report on Operations
- 45 -
Goodwill relating to PFA division formerly FinecoGroup S.p.A.
On October 1, 2005, FinecoBank acquired the Personal Financial Advisors business division from FinecoGroup
S.p.A., which was created from the progressive merger of three different group networks: FinecoBank S.p.A., former
Bipop Carire S.p.A. and Banca Manager S.p.A..
The transaction was carried out for a consideration mutually agreed by the parties and subject to a ‘fairness opinion',
leading to the recognition of €3.5 million of goodwill.
Goodwill relating to PFA division formerly UniCredit Xelion Banca S.p.A.
As a result of the merger of UniCredit Xelion Banca S.p.A. into FinecoBank on July 7, 2008, FinecoBank S.p.A.
recorded goodwill of €68 million under intangible assets, arising from previous extraordinary transactions carried out
by UniCredit Xelion Banca S.p.A., more specifically:
Year 2000: acquisition of the PFA division, formerly Fida SIM, by UniCreditSIM, later merged into Xelion Sim
S.p.A., which then became UniCredit Xelion Banca S.p.A.. The balance, amounting to €1 million, is equal to the
balance at January 1, 2004, the date of transition to IAS;
Year 2001: merger of UniCreditSIM into Xelion Sim S.p.A., which then became UniCredit Xelion Banca S.p.A.. The
balance, amounting to €13.8 million, is equal to the balance at January 1, 2004, the date of transition to IAS;
Year 2003: spin-off of the personal financial advisors division, formerly Credit, Rolo and CRT by UniCredit Banca to
UniCredit Xelion Banca S.p.A.. The balance, amounting to €19.1 million, is equal to the balance at January 1, 2004,
the date of transition to IAS;
Year 2004: acquisition of the PFA division from Ing Italia. This transaction resulted in the recognition of goodwill of
€34.1 million.
It should be noted that all the goodwill (totalling €90 million) relates to acquisitions of businesses or companies
carrying out trading activities or the distribution of financial, banking and insurance products through personal financial
advisors.
These activities have been fully integrated with FinecoBank's ordinary operations, as a result it is no longer possible to
isolate the contribution of each company/business division from the Bank’s overall income; this means that to establish
the reasonableness of the value of goodwill recognized in the financial statements it is necessary to take account of
the Bank’s comprehensive income. The cash generating unit (CGU) is therefore the Bank as a whole.
In fact, in view of the specific business model adopted by FinecoBank, which envisages a high level of integration
between personal financial advisors and the trading and banking platform, the allocation of costs/revenues to the
business units is not considered relevant or meaningful; the personal financial advisors network is an integral part of
the overall offer, along with banking, brokerage and investing services.
Other intangible assets
Other intangible assets mainly include purchases and the implementation of information technology procedures with
useful lives of several years, required in order to manage the development and ongoing provision by the Bank of new
and more versatile high-added-value services for customers, as well as infrastructure and application optimizations,
enhancements to architecture for application security, and the developments needed to meet the new regulatory
requirements.

Interim Report on Operations
- 46 -
Intangible assets Balance 01.01.2014
Investments as at
06.30.2014
Other changes-
sales
Amortization and write-downs as at
06.30.2014
Balance 06.30.2014
Software 6,853 2,171 - (2,163) 6,861Other intangible assets 1,161 65 - (172) 1,054TOTAL 8,014 2,236 - (2,335) 7,915
Tax Assets and Other Assets
06.30.2014 12.31.2013 Amount %
Tax assetsCurrent assets 2,401 25,264 (22,863) -90.5%Deferred tax assets 37,155 39,197 (2,042) -5.2%Deferred tax assets pursuant to Law 214/2011 3,335 3,473 (138) -4.0%Total 42,891 67,934 (25,043) -36.9%
Other assetsItems in processing 16,621 9,488 7,133 75.2%Definitive items not recognised under other items 59,573 62,491 (2,918) -4.7%Current receivables not relatedto the provision of financial services 2,055 1,707 348 20.4%Tax items other than those includedin the item "Tax assets" 123,221 160,908 (37,687) -23.4%Prepayments 16,376 10,940 5,436 49.7%Improvement and incremental expenses incurred on leasehold assets 9,899 10,962 (1,063) -9.7%Other items 120 133 (13) -9.8%Total 227,865 256,629 (28,764) -11.2%(Amounts in € thousand)
Changes
The decrease in “Tax assets" of €25 million is mainly due to the use of previously paid IRES income tax and IRAP
corporate tax advances.
With regard to the “Other assets", "Tax items other than those included in the item “tax assets", decreased as a result
of the release of tax advances paid, in our capacity as withholding agents, for the substitute tax on other income.
Deposits from banks
06.30.2014 12.31.2013 Amount %
Deposits from central banks - - - -Deposits from banksCurrent accounts and demand deposits 23,201 29,139 (5,938) -20.4%Loans Repos 1,002,633 1,619,295 (616,662) -38.1%Other liabilities 1,018 241 777 322.4%Total 1,026,852 1,648,675 (621,823) -37.7%(Amounts in € thousand)
Changes
The item current accounts and demand deposits mainly consists of reciprocal current accounts and loans with
UniCredit group companies, with a book value of €19 million, as well as reciprocal current accounts and loans with
banks outside the Group of €4.2 million.
Repos include €965.6 million of transactions performed with UniCredit and €10.5 million of transactions with UniCredit
AG Monaco.
(Amounts in € thousand)

Interim Report on Operations
- 47 -
Deposits from customers
Deposits from customers, mainly consisting of current accounts, the Cash Park deposit account and Supersave repos,
totalled €13,911 million, an increase of 9.3% compared to December 31, 2013.
06.30.2014 12.31.2013 Amount %
Current accounts and demand deposits 11,856,287 10,666,363 1,189,924 11.2%Time deposits 1,674,202 1,699,635 (25,433) -1.5%Loans Repos 312,207 304,380 7,827 2.6%Other liabilities 68,528 61,931 6,597 10.7%Deposits from customers 13,911,224 12,732,309 1,178,915 9.3%(Amounts in € thousand)
Changes
Debt securities in issue
06.30.2014 12.31.2013 Amount %
Bonds 421,965 2,322,511 (1,900,546) -81.8%(Amounts in € thousand)
Changes
During the first half of 2014, the Bank reimbursed securities in issue for a nominal amount of €1,500 million
(repurchased in previous years); it also partially repurchased bonds issued for a total nominal amount of €1,850 million
and USD 70 million.
These bonds had been issued at par in 2011 and fully underwritten by UniCredit, while the Bank had underwritten
bonds issued by UniCredit, in light of both the Bank and UniCredit needing to hold bonds in their portfolio for the
purposes of their activities. As described above, by underwriting other bonds issued by UniCredit as part of the
liquidity investment policy defined as of April 1, 2014 and following the gradual reduction in repo transactions with
customers that had led the Bank and UniCredit to reciprocally underwrite and issue such bonds, both parties were
able to sell part of the securities held in the portfolio and to repurchase the securities in issue.
Financial liabilities held for trading
Financial liabilities held for trading consist of:
technical overdrafts classified under as HFT (held for trading), held in the Bank's portfolio as a result of trading
activity, for an amount of €0.5 million, mainly related to the aforementioned transactions booked as financial
assets held for trading;
the negative valuation of spot contracts for securities in the HFT portfolio and currencies to be settled in time
frames established by market practices ("regular way") for €3.3 million, which correspond to positive
valuations booked under item 20 "Financial assets held for trading";
the negative valuation of CFDs on indices and Forex for €1.1 million.
CFDs on indices and currencies are "Over the counter" derivative contracts that require the payment of a differential
generated by the difference between the opening and closing price of the financial instrument. In operational terms,
the Bank covers the imbalance of customer positions by underwriting futures on the indices underlying the CFDs on
indices, or through Forex transactions with institutional counterparties to hedge CFD transactions in open currencies

Interim Report on Operations
- 48 -
with customers' currency; consequently, the negative valuations booked under "Financial liabilities held for trading"
more or less balanced the positive valuations booked under "Financial assets held for trading".
Provisions for risks and charges
Provisions for risks and charges include allowances for a total of €110.5 million, for which, given a liability of uncertain
amount and expiry, a current obligation was identified as the result of a past event and it was possible to make a
reliable estimate of the amount resulting from the fulfilment of said obligation.
The disbursements, with estimated maturity exceeding 18 months, were discounted to present value using a rate
equal to the time value of money.
"Staff expenses" include the provisions made for the variable remuneration to be paid to employees in subsequent
years, which have an uncertain due date and/or amount.
Changes06.30.2014 12.31.2013 Amount %
Legal disputes 51,319 55,578 (4,259) -7.7%- Pending proceedings 38,043 40,573 (2,530) -6.2%- Claims 13,276 15,005 (1,729) -11.5%
Staff expenses 2,329 - 2,329 -
Other 56,859 53,776 3,083 5.7%- Supplementary customer indemnity provision 35,864 32,178 3,686 11.5%- Contractual payments and payments under non-competition agreements 1,986 1,916 70 3.7%- Tax disputes 7,299 7,439 (140) -1.9%- Other provisions 11,710 12,243 (533) -4.4%Total provisions for risks and charges - other provisions 110,507 109,354 1,153 1.1%(Amounts in € thousand)

Interim Report on Operations
- 49 -
Tax liabilities and Other liabilities
06.30.2014 12.31.2013 Amount %
Tax liabilitiesCurrent liabilities 30,156 16,842 13,314 79.1%Deferred tax liabilities 22,819 20,859 1,960 9.4%Total 52,975 37,701 15,274 40.5%
Other liabilitiesItems in processing 69,335 47,398 21,937 46.3%Definitive items not recognised under other items 62,747 34,396 28,351 82.4%Payables to employees and other personnel 12,671 15,229 (2,558) -16.8%Payables to Directors and Statutory auditors 265 244 21 8.6%Current payables not relatedto the provision of financial services 35,625 27,400 8,225 30.0%Tax items other than those includedin the item "Tax liabilities " 59,774 83,854 (24,080) -28.7%Social security contributions to be paid 4,299 4,853 (554) -11.4%Adjustments for illiquid portfolio items 14,827 13,847 980 7.1%Other items 555 640 (85) -13.3%
Employee severance pay provision 4,149 3,761 388 10.3%Total 264,247 231,622 32,625 14.1%(Amounts in € thousand)
Changes
The increase in “Tax liabilities" of €15 million was due to:
- higher income taxes for the year resulting from an increase in taxable income;
- higher deferred tax liabilities calculated on the deductible portion of goodwill.
With regard to the "Other liabilities", there was an increase in "Items in processing" relating to outgoing bank transfers,
an increase in “Definitive items not recognized under other items", relating to the settlement of credit card transactions
and the settlement of securities and coupons, a reduction in "Tax items other than those included in the item “Tax
liabilities”", as a result of the release of the tax payable to the tax authorities for stamp duty and for withholding taxes
on current account interest income, in our capacity as withholding agent.
Shareholders' equity
As at June 30, 2014, the Bank's share capital came to €200 million, and was divided into 606,274,033 shares with a
par value of €0.33 each. Reserves comprise the legal reserve amounting to €33.1 million, the extraordinary reserve
amounting to €157.7 million, and retained earnings for an amount of €0.2 million.
The Bank does not hold, and did not hold during the period ended June 30, 2014, any treasury shares in the portfolio.
Following the Shareholders' Meeting resolution of April 15, 2014, the profit for the year 2013 of €85.2 million was
allocated as follows:
€4.3 million to the legal reserve;
€58.9 million to the extraordinary reserve;
€20 million, equal to €0.033 per share, to the shareholder;
€2 million to charitable donations.

Interim Report on Operations
- 50 -
Shareholders' equity
Item/Amount 06.30.2014 12.31.2013 Amount %
Share capital 200,070 200,070 - -Share premium reserve 1,934 1,934 - -Reserves - - Legal reserve 33,061 28,800 4,261 14.8% - Extraordinary reserve 157,692 98,744 58,948 59.7% - Other reserves 171 171 - -Revaluation reserves 4,912 4,214 698 16.6%Net Profit (Loss) for the year 73,862 85,216 (11,354) -13.3%Total 471,702 419,149 52,553 12.5%(Amounts in € thousand)
Changes
CAPITAL RESOURCES AND PRUDENTIAL REQUIREMENTS
06.30.2014 12.31.2013
Common Equity Tier 1 - CET1 338,752 316,008Additional Tier 1 – AT1 - -TIER 2 – T2 - -Total Own Funds 338,752 316,008
Common Equity Tier 1 Capital Ratio (Tier 1 capital/Risk-weighted assets -TIER 1 capital ratio at December 31, 2013) 19.50% 12.25%Total Own Funds Capital Ratio (Regulatory capital/Risk-weighted assets - Total capital ratio at December 31, 2013) 19.50% 12.25%(Amounts in € thousand)
Total own funds as at June 30, 2014 amounted to €339 million.
In the absence of a formal dividend policy, for the purpose of calculating own funds as at June 30, 2014, retained
earnings included in Common Equity Tier 1, amounting to €21.9 million, were estimated with reference to the average
pay out of the last three years, as established in (EU) Commission Delegated Regulation no. 241/2014, supplementing
regulation EU 575/2013 of the European Parliament.
The “Common Equity Tier 1 capital ratio” and the “Total Own Funds capital ratio” as at June 30, 2014 were calculated
by applying the supervisory regulations in force according to the Basel III regulatory framework.
At December 31, 2013, the Common Equity Tier 1 and Total Own Funds used in the calculation were re-determined
by applying the rules in force as at January 1, 2014, while the RWAs used to calculate the Tier 1 Capital ratio and the
Total capital ratio were determined by applying the Basel II supervisory regulations, supplementing the total capital
requirements of the Basel I “floor”, which corresponds to the positive difference between 80% of the capital
requirements calculated on the basis of regulations in force as at December 31, 2006, and the sum of capital
requirements for credit, counterparty, market and operational risks, calculated using the Basel II provisions.

Interim Report on Operations
- 51 -
INCOME STATEMENT FIGURES
Condensed Income Statement
06.30.2014 06.30.2013 Amount %
Net interest 115,940 95,905 20,035 20.9%Net fee and commission income 97,029 81,805 15,224 18.6%Net trading, hedging and fair value income 12,889 15,808 (2,919) -18.5%Net other expenses/income (1,572) (354) (1,218) 344.1%
OPERATING INCOME 224,286 193,164 31,122 16.1%
Payroll costs (31,835) (30,990) (845) 2.7%Other administrative expenses (106,991) (92,607) (14,384) 15.5%Recovery of expenses 37,542 28,054 9,488 33.8%Amortisation, depreciation and impairment losses on intangible and tangible assets (3,942) (3,491) (451) 12.9%
Operating costs (105,226) (99,034) (6,192) 6.3%
OPERATING PROFIT (LOSS) 119,060 94,130 24,930 26.5%
Net impairment losses on loans andprovisions for guarantees and commitments (1,291) (1,355) 64 -4.7%
NET OPERATING PROFIT (LOSS) 117,769 92,775 24,994 26.9%
Provisions for risks and charges (2,951) (360) (2,591) 719.7%Net income from investments - (6) 6 -100.0%
PROFIT (LOSS) BEFORE TAXFROM CONTINUING OPERATIONS 114,818 92,409 22,409 24.2%
Income tax for the period (40,956) (36,147) (4,809) 13.3%
PROFIT (LOSS) AFTER TAX FROM CONTINUING OPERATIONS 73,862 56,262 17,600 31.3%
NET PROFIT (LOSS) FOR THE PERIOD 73,862 56,262 17,600 31.3%
(Amounts in € thousand)
Changes

Interim Report on Operations
- 52 -
Net interest margin
The net interest margin as at June 30, 2014 came to €116 million, an increase of 20.9% on the same period of 2013.
It is important to note that during the first half of 2014, liquidity investment policies were amended to a certain extent,
and specifically:
as of January 1, 2014, the Bank updated the parameters and models used to define the portion of sight deposits
that may be considered "Core", which feature greater duration/stability, and the "Non Core" portion. Liquidity
classified as "Core" with duration exceeding one year was entirely considered as a source of medium/long-term
structural financing. The interest rate paid on “Core” deposits is increased by a spread calculated as the average
of the spreads paid by UniCredit on the market on the total amount of medium/long-term senior bonds issued,
irrespective of their maturity In the past the spread was calculated as the weighted average of the spreads paid
by UniCredit on the market on time deposits with maturity equal to the average estimated life associated with the
various components of "Core" liquidity;
as of April 1, 2014, "Core" liquidity has been invested in UniCredit bonds with maturities ranging from 2 years and
10 months to 7 years and 6 months, for a total nominal amount of €7,650 million and USD 250 million. These
types of investment were determined by taking into account the overall structure of the Bank’s balance sheet and
with a view to optimize the risk/return profile of the investments and diversify their maturities. The portion of
liquidity classified as "Non Core" was invested in liquid assets or assets readily convertible into cash, including
Italian government bonds, for a nominal amount of €1,500 million (while derivative contracts were entered into at
the same time in order to convert the fixed rate into a floating rate in compliance with pre-defined limits on interest
rate risk).
This new portfolio structure contributed to an increased flow of interest income resulting from the investment of sight
deposits (the average lending rate went from 1.52% in the first half of 2013 to 2.03% in the first half of 2014).
Interest income 06.30.2014 06.30.2013 Amount %
Financial assets held for trading 1 5 (4) -80.0%Available-for-sale financial assets 4,918 903 4,015 444.6%Loans and receivables with banks 126,181 151,074 (24,893) -16.5%Loans and receivables with customers 14,533 12,954 1,579 12.2%Financial assets designated at fair value through profit or loss 5 69 (64) -92.8%Hedging derivatives 4,084 3,918 166 4.2%Other assets - 1 (1) -100.0%Total interest income 149,722 168,924 (19,202) -11.4%(Amounts in € thousand)
Changes

Interim Report on Operations
- 53 -
Interest expense 06.30.2014 06.30.2013 Amount %
Deposits from banks (3,499) (6,188) 2,689 -43.5%Deposits from customers (30,282) (46,894) 16,612 -35.4%Debt securities in issue - (19,936) 19,936 -100.0%Other liabilities (1) (1) - 0.0%Total interest expense (33,782) (73,019) 39,237 -53.7%
Net interest 115,940 95,905 20,035 20.9%(Amounts in € thousand)
Changes
The following table provides a breakdown of interest income associated with banks and customers:
Breakdown of interest income 06.30.2014 06.30.2013 Amount %
Interest income on loans and receivables with banks 126,181 151,074 (24,893) -16.5%- current accounts 55,136 68,481 (13,345) -19.5%- reverse repos 457 462 (5) -1.1%- time deposits for compulsory reserve 159 401 (242) -60.3%- time deposits 22,088 61,621 (39,533) -64.2%- other loans 6 6 - 0.0%- debt securities 48,335 20,103 28,232 140.4%
Interest income on loans and receivables with customers 14,533 12,954 1,579 12.2%- current accounts 2,289 1,658 631 38.1%- reverse repos 6,020 4,894 1,126 23.0%- credit cards 1,772 1,638 134 8.2%- personal loans 4,366 4,707 (341) -7.2%- other loans 86 57 29 50.9%(Amounts in € thousand)
Changes
Interest income on loans and receivables with banks amounted to €126.1 million decreasing by €24.9 million
compared to the same period of the previous year.
The decrease in interest income on current accounts, amounting to €13.3 million, was mainly due to the reduction in
the volume of reciprocal current accounts, partially offset by the positive effect of the aforementioned revision of
liquidity investment policies in the first quarter. In contrast there was an increase in interest income on debt securities
amounting to €28.2 million, due to the investment of "Core" liquidity in UniCredit bonds.
Finally, interest income on time deposits decreased due to lower volumes and changes in market rates, which steadily
declined during 2013; on the contrary, in the first quarter of 2013 interest was boosted by the positive effect of
transactions launched in 2012 and concluded in the first few months of 2013.
Interest income on loans and receivables with customers amounted to €14.5 million, showing an increase of 12.2%
thanks to higher interest on "Multiday leverage" securities lending transactions guaranteed by cash.

Interim Report on Operations
- 54 -
The following table provides a breakdown of interest expense related to banks and customers:
Breakdown of interest expense 06.30.2014 06.30.2013 Amount %
Interest expense on deposits from banks (3,499) (6,188) 2,689 -43.5%- current accounts (176) (35) (141) 402.9%- other loans (14) (13) (1) 7.7%- reverse repos (3,309) (6,140) 2,831 -46.1%
Interest expense on deposits from customers (30,282) (46,894) 16,612 -35.4%- current accounts (9,352) (8,046) (1,306) 16.2%- demand deposits (28) (46) 18 -39.1%- time deposits (18,994) (35,251) 16,257 -46.1%- reverse repos (1,908) (3,551) 1,643 -46.3%(Amounts in € thousand)
Changes
Interest expense on deposits from banks amounted to €3.5 million, down by €2.7 million compared to the same period
of the previous year, attributable to lower interest accrued on repos due to the reduction in volumes and changes in
market rates.
Interest expense on deposits from customers came to €30.3 million, down by €16.6 million compared to June 30,
2013, due to a reduction in volumes and in the interest rate paid on "Cash Park" time deposits.
Income from brokerage and other income
06.30.2014 06.30.2013 Amount %
Net interest 115,940 95,905 20,035 20.9%
Net fee and commission income 97,029 81,805 15,224 18.6%Net trading, hedging and fair value income 12,889 15,808 (2,919) -18.5%Net other expenses/income (1,572) (354) (1,218) 344.1%Operating income 224,286 193,164 31,122 16.1%(Amounts in € thousand)
Changes
Net fee and commission income
Management reclassification 06.30.2014 06.30.2013 Amount %
Management, brokerage and consultancy services:1. securities trading and order collection 42,599 37,731 4,868 12.9% 2. currency trading (102) (192) 90 -46.9% 3. custody and administration of securities (1,874) (1,872) (2) 0.1% 4. placement of securities, investment fund units and segregated accounts 58,918 52,357 6,561 12.5% 6. investment advisory services 61 (25) 86 n.c. 7. distribution of insurance products 6,748 6,010 738 12.3% 8. distribution of other products (126) (108) (18) 16.7%Collection and payment services 5,383 4,519 864 19.1%Holding and management of current/deposit accounts (3,574) (3,506) (68) 1.9%Other fee expense personal financial advisors (12,013) (12,742) 729 -5.7%Securities lending (1,146) (2,338) 1,192 -51.0%Other Services 2,155 1,971 184 9.3%Total 97,029 81,805 15,224 18.6%(Amounts in € thousand)
Changes

Interim Report on Operations
- 55 -
Net fee and commission income amounted to €97 million, increasing by 18.6% compared to the same period of the
previous year.
This increase was mainly attributable to the increase in net fee and commission income from trading and asset
management, units in investment funds and segregated accounts, thanks to the increase in assets under management
and securities trading and order collection commissions, as a result of the increase in the number of orders executed.
Net trading, hedging and fair value income is mainly determined from gains realized from securities trading and CFDs.
The decrease of €2.9 million is attributable to lower profits from securities trading and Forex CFDs, partially offset by
greater profits from trading on CFDs on indices.
The Balance of Net other expenses/income also includes the net gains and losses on disposal and repurchase
transactions related to the securities issued by the Bank and classified in the "Loans and Receivables" portfolio, which
were sold to UniCredit, and the repurchase of securities issued by the Bank and underwritten by UniCredit.
As described above, by underwriting bonds issued by UniCredit as part of the new liquidity investment policy and
following the gradual reduction in repo transactions with customers that had led the Bank and UniCredit to reciprocally
underwrite and issue such bonds, both parties were able to sell part of the securities held in the portfolio and to
repurchase the securities in issue, thereby realizing a gain (loss) on the disposal or the repurchase. For more details
see the section “Loans and receivables with banks”.
Operating costs
Breakdown of operating costs 06.30.2014 06.30.2013 Amount %
Payroll costs (31,835) (30,990) (845) 2.7%Other administrative expenses (106,991) (92,607) (14,384) 15.5%Recovery of expenses 37,542 28,054 9,488 33.8%Amortisation, depreciation and impairment losses onintangible and tangible assets (3,942) (3,491) (451) 12.9%Total operating costs (105,226) (99,034) (6,192) 6.3%(Amounts in € thousand)
Changes

Interim Report on Operations
- 56 -
Payroll costs 06.30.2014 06.30.2013 Amount %
1) Employees (30,886) (29,889) (997) 3.3% - wages and salaries (21,481) (20,443) (1,038) 5.1% - social security contributions (5,790) (5,659) (131) 2.3% - severance pay (390) (387) (3) 0.8%- allocation to employee severance pay provision (67) (71) 4 -5.6% - payments to external pension funds: a) defined contribution (1,237) (1,175) (62) 5.3% - costs related to share-based payments (386) (571) 185 -32.4% - other employee benefits (1,535) (1,583) 48 -3.0%2) Other staff (51) (55) 4 -7.3%3) Directors and statutory auditors (456) (423) (33) 7.8%4) Early retirement costs - - - n.c.5) Recovery of expenses for employees seconded to other companies 54 40 14 35.0%6) Recovery of expenses for employees seconded to the Company (496) (663) 167 -25.2%Total (31,835) (30,990) (845) 2.7%(Amounts in € thousand)
Changes
Payroll costs as at June 30, 2014 went up by 2.7%, mainly due to the increase in the number of human resources from
965 as at June 30, 2013 to 989 as at June 30, 2014.
Note that item "costs related to share-based payments", refers to the costs incurred by FinecoBank for share-based
payments involving financial instruments issued by UniCredit S.p.A..
To correctly assess the development of administrative costs they must be analysed in conjunction with the recovery of
expenses, and the contributions of "Indirect taxes and duties" and "Advertising expenses – marketing and
communication" must be separated out from "Other administrative expenses".
The total of other administrative expenses and recovery of expenses amounted to €69.4 million, an increase of €4.9
million compared to the same period of the previous year. Costs showed an overall reduction if it is considered that, in
the first half of 2014, the costs related to the listing of FinecoBank were booked as incurred for €5.2 million.

Interim Report on Operations
- 57 -
Other administrative expenses and recovery of expenses 06.30.2014 06.30.2013 Amount %
1) INDIRECT TAXES AND DUTIES (38,502) (28,955) (9,547) 33.0%2) MISCELLANEOUS COSTS AND EXPENSESA) Advertising expenses - Marketing and communication (11,977) (15,075) 3,098 -20.6%Mass media campaigns (9,283) (11,921) 2,638 -22.1%Marketing and promotions (2,617) (3,089) 472 -15.3%Sponsorships (58) (44) (14) 31.8%Conventions and internal communications (19) (21) 2 -9.5%B) Expenses related to credit risk (598) (544) (54) 9.9%Credit recovery expenses (369) (338) (31) 9.2%Commercial information and company searches (229) (206) (23) 11.2%C) Expenses related to personnel (9,155) (6,061) (3,094) 51.0%Personnel training (259) (203) (56) 27.6%Car rental and other payroll costs (22) (26) 4 -15.4%Personal financial advisor expenses (8,532) (5,556) (2,976) 53.6%Travel expenses (311) (229) (82) 35.8%Premises rentals for personnel (31) (47) 16 -34.0%D) ICT expenses (13,741) (14,466) 725 -5.0%Lease of ICT equipment and software (2,157) (2,544) 387 -15.2%Software expenses: lease and maintenance (3,001) (2,905) (96) 3.3%ICT communication systems (1,592) (1,754) 162 -9.2%ICT services: external personnel/outsourced services (3,327) (3,521) 194 -5.5%Financial information providers (3,664) (3,742) 78 -2.1%E) Consulting and professional services (5,086) (1,501) (3,585) 238.8%Consultancy for ordinary operations (408) (281) (127) 45.2%Consultancy for strategy, business development andorganisational optimisation (2,125) - (2,125) n.c.Legal expenses (1,315) (3) (1,312) 43733.3%Legal disputes (1,238) (1,217) (21) 1.7%F) Real estate expenses (10,535) (10,564) 29 -0.3%Real estate services (343) (343) - 0.0%Repair and maintenance of furniture, machinery, and equipment (125) (121) (4) 3.3%Maintenance of premises (528) (510) (18) 3.5%Premises rentals (8,455) (8,035) (420) 5.2%Cleaning of premises (265) (239) (26) 10.9%Utilities (819) (1,316) 497 -37.8%G) Other functioning costs (17,397) (15,441) (1,956) 12.7%Surveillance and security services (185) (200) 15 -7.5%Postage and transport of documents (1,250) (1,388) 138 -9.9%Administrative and logistic services (7,409) (6,727) (682) 10.1%Insurance (1,816) (1,929) 113 -5.9%Printing and stationery (292) (278) (14) 5.0%Association dues and fees (5,642) (4,552) (1,090) 23.9%Other administrative expenses (803) (367) (436) 118.8%H) Recovery of costs 37,542 28,054 9,488 33.8%Recovery of ancillary expenses 198 95 103 108.4%Recovery of taxes 37,344 27,959 9,385 33.6%Total (69,449) (64,553) (4,896) 7.6%(Amounts in € thousand)
Changes
Indirect taxes and duties net of Recovery of taxes increased by €0.2 million, mainly attributable to the amount of
"Tobin Tax" paid on transactions executed by the Bank on its own behalf.
Advertising – marketing and communication expenses decreased by €3.1 million, due to lower investments in
advertising planned and implemented in the first half of 2014 compared to the first half of 2013.

Interim Report on Operations
- 58 -
There was an increase of €7.8 million compared to the previous year in other administrative expenses net of indirect
taxes and duties, recovery of taxes and advertising expenses – marketing and communication.
This increase is attributable to greater expenses for financial advisors, as a result of higher intensity recruitment
beginning in 2012. This resulted in higher costs for trade association dues and fees mainly owing to the increase in
charges for the ENASARCO association and the FIRR termination compensation fund, due to the increased number of
advisors and the commissions used as the basis for determining dues.
These were in addition to “Legal expenses”, “Consultancy for strategy, business development and organizational
optimization” and “Association duties and fees” linked to the listing project.
Impairment losses on intangible assets relate mainly to the amortization of the costs incurred for computer software
with a long-term useful life and did not show any significant change with respect to the previous year.
Impairment losses on tangible assets refer to the depreciation applied to electronic machines, plant and machinery,
office furniture and fittings. These increased by €0.4 million on the previous year, mainly due to greater depreciation
applied to electronic machines.
Profit (loss) before tax from continuing operations
06.30.2014 06.30.2013 Amount %
Operating profit (loss) 119,060 94,130 24,930 26.5%
Net impairment losses on loans andprovisions for guarantees and commitments (1,291) (1,355) 64 -4.7%Net operating profit (loss) 117,769 92,775 24,994 26.9%
Provisions for risks and charges (2,951) (360) (2,591) 719.7%Net income from investments - (6) 6 -100.0%Profit before tax 114,818 92,409 22,409 24.2%(Amounts in € thousand)
Changes
Net impairment losses on loans did not show any significant change compared to June 30, 2013.
Provisions for risks and charges showed an increase of €2.6 million related to a revised accounting method for
marketing campaigns, which in the first half of 2013 had resulted in reallocations through profit or loss for a total of
€2.9 million. Starting from 2014, the net provisions for risks and charges in relation to marketing campaigns are
booked in a specific item (item 20 Interest expense and similar charges), in order to provide a more accurate
accounting recognition.
Profit before tax amounted to €114.8 million, increasing by 24.2% on June 30, 2013 due to the positive contribution
from net interest margin, as a result of the revision of the liquidity investment policies mentioned above, and from net
fee and commission income, owing to the increase in commission income deriving from assets under management
and securities trading and order collection, which largely offset the increase in administrative costs related to the listing
project.
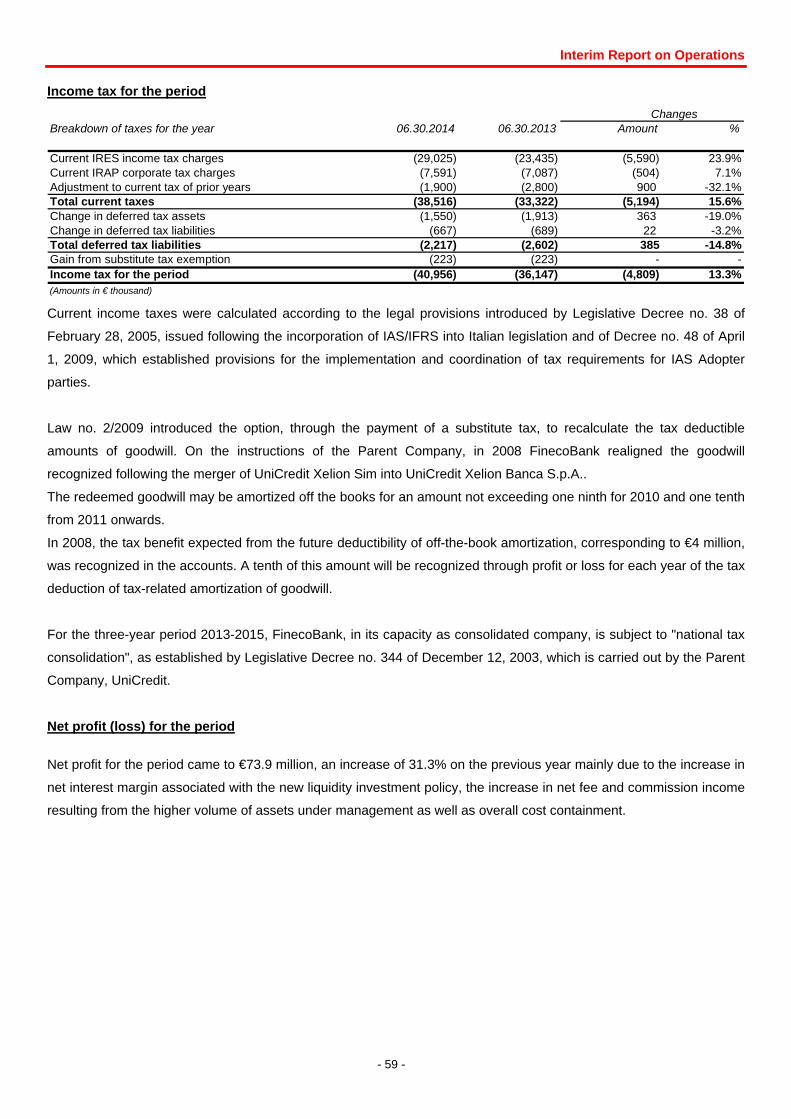
Interim Report on Operations
- 59 -
Income tax for the period
Breakdown of taxes for the year 06.30.2014 06.30.2013 Amount %
Current IRES income tax charges (29,025) (23,435) (5,590) 23.9%Current IRAP corporate tax charges (7,591) (7,087) (504) 7.1%Adjustment to current tax of prior years (1,900) (2,800) 900 -32.1%Total current taxes (38,516) (33,322) (5,194) 15.6%Change in deferred tax assets (1,550) (1,913) 363 -19.0%Change in deferred tax liabilities (667) (689) 22 -3.2%Total deferred tax liabilities (2,217) (2,602) 385 -14.8%Gain from substitute tax exemption (223) (223) - -Income tax for the period (40,956) (36,147) (4,809) 13.3%(Amounts in € thousand)
Changes
Current income taxes were calculated according to the legal provisions introduced by Legislative Decree no. 38 of
February 28, 2005, issued following the incorporation of IAS/IFRS into Italian legislation and of Decree no. 48 of April
1, 2009, which established provisions for the implementation and coordination of tax requirements for IAS Adopter
parties.
Law no. 2/2009 introduced the option, through the payment of a substitute tax, to recalculate the tax deductible
amounts of goodwill. On the instructions of the Parent Company, in 2008 FinecoBank realigned the goodwill
recognized following the merger of UniCredit Xelion Sim into UniCredit Xelion Banca S.p.A..
The redeemed goodwill may be amortized off the books for an amount not exceeding one ninth for 2010 and one tenth
from 2011 onwards.
In 2008, the tax benefit expected from the future deductibility of off-the-book amortization, corresponding to €4 million,
was recognized in the accounts. A tenth of this amount will be recognized through profit or loss for each year of the tax
deduction of tax-related amortization of goodwill.
For the three-year period 2013-2015, FinecoBank, in its capacity as consolidated company, is subject to "national tax
consolidation", as established by Legislative Decree no. 344 of December 12, 2003, which is carried out by the Parent
Company, UniCredit.
Net profit (loss) for the period
Net profit for the period came to €73.9 million, an increase of 31.3% on the previous year mainly due to the increase in
net interest margin associated with the new liquidity investment policy, the increase in net fee and commission income
resulting from the higher volume of assets under management as well as overall cost containment.

Interim Report on Operations
- 60 -
TRANSACTIONS WITH GROUP COMPANIES
The following table provides a summary of outstanding assets, liabilities, guarantees and commitments as at June 30,
2014 in relation to Group companies.
Assets Liabilities Guarantees andcommitments
Transactions with the Parent Company UniCredit S.p.A. 13,444,888 1,415,032 266,070Transactions with companies controlled by UniCredit S.p.A. 30,154 33,594 -(Amounts in € thousand)

Interim Report on Operations
- 61 -
SUBSEQUENT EVENTS AND OUTLOOK
SUBSEQUENT EVENTS
On July 15, 2014, following the listing of the ordinary shares of the Bank, the Board of Directors of FinecoBank
approved:
the total number of newly issued FinecoBank shares freely assignable to the recipients of the stock granting plan
"2014-2017 Multi Year Top Plan Management" (guidelines approved by the Board of Directors on April 15, 2014
and related regulation by the Board of Directors on May 15, 2014, with execution conditional on listing), and the
allocation of the shares quota for the year 2014. Specifically, the total number of shares that can be assigned under
the plan has been set at 2,523,400. The quota allocated for 2014 amounted to 630,850 shares (grant date
September 30, 2014). As defined by the Plan Rules, the allocation of the other quotas is expected in 2015, 2016
and 2017. The number of shares allocated to each quota may decrease according to the Bank’s requirement to
keep the ratio between the variable and fixed part of the remuneration in line with the rules applicable at the time.
In order to ensure a more appropriate balance between the short-, medium- and long-term variable components of
remuneration, the Board of Directors may reduce the value of the variable remuneration granted under the Plan
down to the limit of 100% of fixed remuneration. The shares allotted pursuant to the above rules, will actually be
assigned after a three-year vesting period (i.e. in 2017 for the quota allotted in 2014), upon satisfaction of pre-
defined conditions;
the list of employees identified as Key People under the “2014 Plan Key People” plan (stock granting plan, whose
guidelines were approved by the Board of Directors on April 15, 2014 and the related regulation by the Board of
Directors on May 15, 2014, with execution conditional on listing), and the shares to be allocated to the said people.
The total number of newly issued shares allocated under the plan amounted to 796,390 (grant date September 30,
2014); they will be assigned, upon verification that pre-defined conditions have been satisfied, in three annual
tranches, the first of which in 2015 and the third in 2017.
The dilution effect for shareholders arising from the free capital increases used in execution of the mentioned stock
granting plans and the Group Incentive System is calculated as a maximum of 0.61% of the fully diluted capital.
On July 17, 2014, the coordinators of FinecoBank ordinary shares global offering (the '"Global Offering"), UBS
Investment Bank and UniCredit Corporate & Investment Banking, exercised the greenshoe option granted by
UniCredit for 27,283,000 shares, representing all the over-allotted shares. The purchase price of the shares issued
under the greenshoe option was €3.7 per share - corresponding to the offer price set in the Global Offering - for a
gross amount of €100,947,100. Payment of the shares under the greenshoe option was made on July 22, 2014.
Including the shares subject to the greenshoe option, the Global Offering concerned a total of 209,166,000
FinecoBank ordinary shares, representing approximately 34.5% of the share capital, for a total corresponding value of
approximately €774 million, before fees and expenses.

Interim Report on Operations
- 62 -
OUTLOOK AND MAIN RISKS AND UNCERTAINTIES IN THE SECOND HALF OF THE YEAR
The second part of 2014 will probably be characterized by ongoing uncertainty related to a difficult macroeconomic
environment where any signs of economic recovery are scarce.
Fineco will continue to pursue its strategy of consolidation and further strengthening of its competitive positioning in
the Italian market of integrated banking, brokerage and investing services. Achieving this goal will require the network
of financial advisors to be strengthened, leveraging innovation to expand the range of product and services offered,
and developing the advisory area in order to meet the increasingly sophisticated needs of a broader customer base.
All these activities will be supported by advertising investments aimed at consolidating customers’ perception of the
fundamental characteristics of FinecoBank’s proposal: simplicity, transparency and innovation.
The above steps reflects a strategy that combines the main trends characterizing the competitive environment in which
we operate: the increasing digitization of society and a growing demand for financial advisory services.
NUMBER OF TREASURY SHARES AND SHARES IN THE PARENT COMPANY
FinecoBank does not hold, and did not hold during the first half of 2014, including through other companies or third
parties, treasury shares or shares of the Parent Bank.
Milan – August 1, 2014
THE BOARD OF DIRECTORS
The Chairman The Managing Director
Enrico Cotta Ramusio Alessandro Foti

Interim Report on Operations
- 63 -
RECONCILIATION OF CONDENSED ACCOUNTS TO MANDATORY REPORTING SCHEDULE
ASSETS 06.30.2014 12.31.2013
Cash and cash balances = item 10 14 5
Financial assets held for trading = item 20 10,407 4,700
Loans and receivables with banks = item 60 13,476,117 16,330,912
Loans and receivables with customers = item 70 696,142 641,250
Financial investments 1,715,320 93,114 30. Financial assets designated at fair value through profit or loss - 3,199 40. Available-for-sale financial assets 1,715,320 89,915
Hedging instruments 35,637 179,265 80. Hedging derivatives 9,926 123,143 90. Changes in fair value of portfolio hedged financial liabilities 25,711 56,122
Property, plant and equipment = item 110 11,391 10,772
Goodwill = item 120. Intangible assets of which: goodwill 89,602 89,602
Other intangible assets = item 120 net of goodwill 7,915 8,014
Tax assets = item 130 42,891 67,934
Other assets = item 150 227,865 256,629Total assets 16,313,301 17,682,197(Amounts in € thousand)
LIABILITIES AND SHAREHOLDERS' EQUITY 06.30.2014 12.31.2013
Deposits from banks = item 10 1,026,852 1,648,675
Deposits from customers 13,911,224 12,732,309 20. Deposits from customers 13,911,224 12,732,309
Debt securities in issue 421,965 2,322,511 30. Debt securities in issue 421,965 2,322,511
Financial liabilities held for trading = item 40 4,867 2,301
Hedging instruments 48,960 178,574 60. Hedging derivatives 38,579 141,801 70. Changes in fair value of portfolio hedged financial assets 10,381 36,773
Provisions for risks and charges = item 120 110,507 109,354
Tax liabilities = item 80 52,975 37,701
Other liabilities 264,249 231,623 100. Other liabilities 260,100 227,862 110. Employee severance pay provision 4,149 3,761
Shareholders' equity 471,702 419,149
- capital and reserves 392,928 329,719 160. Reserves 190,924 127,715 170. Share premium reserve 1,934 1,934 180. Share capital 200,070 200,070- revaluation reserves 4,912 4,214 130. Revaluation reserves of which: Available-for-sale financial assets 3,287 641 130. Revaluation reserves actuarial gains (losses) from defined benefit plans 1,625 3,573- net profit = item 200 73,862 85,216
Total liabilities and shareholders' equity 16,313,301 17,682,197
(Amounts in € thousand)

Interim Report on Operations
- 64 -
INCOME STATEMENT 06.30.2014 06.30.2013
Net interest 115,940 95,905 30. Net interest margin 115,940 95,905
Dividends and other income from equity investments - - 70. Dividend income and similar revenue 4 - less: dividends from held for trading equity instruments included in item 70 (4) -
Net fee and commission income = item 60 97,029 81,805 60. Net fee and commission income 97,029 81,805
Net trading, hedging and fair value income 12,889 15,808 80. Gains (losses) on financial assets and liabilities held for trading 12,867 15,524 + dividends from held for trading equity instruments (from item 70) 4 - 90. Fair value adjustments in hedge accounting - - 110. Gains (losses) on assets and liabilities at fair value through profit and loss 18 284
Net other expenses/income (1,572) (354) 190. Other net operating income 35,974 27,699 less: other operating income - of which: recovery of costs (37,542) (28,054) 100. Gains (losses) on disposal and repurchase of: a) loans and receivables 49,159 - 100. Gains (losses) on disposal and repurchase of: d) financial liabilities (49,163) -
OPERATING INCOME 224,286 193,164
Payroll costs (31,835) (30,990) 150. Administrative costs - a) payroll costs (31,835) (30,990)
Other administrative expenses (106,991) (92,607) 150. Administrative costs - b) other administrative expenses (92,607)
Recovery of expenses 37,542 28,054 190. Other net operating income - of which: recovery of costs 37,542 28,054
Amortisation, depreciation and impairment losses on intangible and tangible assets (3,942) (3,491) 170. Impairment/write-backs on property, plant and equipment (1,607) (1,175) 180. Impairments/write-backs on intangible assets (2,335) (2,316)
Operating costs (105,226) (99,034)
OPERATING PROFIT (LOSS) 119,060 94,130
Net impairment losses on loans and provisions for guarantees and commitments (1,291) (1,355) 130. Impairment losses/write-backs on: a) loans and receivables (1,331) (1,355) 130. Impairment losses/write-backs on: d) other financial assets 40 -
NET OPERATING PROFIT (LOSS) 117,769 92,775
Provisions for risks and charges (2,951) (360) 160. Provisions for risks and charges (2,951) (360)
Net income from investments - (6) 240. Gains (losses) on disposal of investments - (6)
PROFIT (LOSS) BEFORE TAXFROM CONTINUING OPERATIONS 114,818 92,409
Income tax for the period (40,956) (36,147) 260. Tax expense (income) related to profit or loss from continuing operations (40,956) (36,147)
NET PROFIT (LOSS)FROM CONTINUING OPERATIONS 73,862 56,262
NET PROFIT (LOSS) FOR THE PERIOD 73,862 56,262
(Amounts in € thousand)

Bank Financial Statements
Bank
financial statements

Bank Financial Statements
- 66 -
BALANCE SHEET
BALANCE SHEET - ASSETS 06.30.2014 12.31.2013
10. Cash and cash balances 13,728 4,63420. Financial assets held for trading 10,406,679 4,700,33530. Financial assets designated at fair value through profit or loss - 3,199,39940. Available-for-sale financial assets 1,715,319,674 89,914,77360. Loans and receivables with banks 13,476,117,258 16,330,912,20770. Loans and receivables with customers 696,141,729 641,249,95180. Hedging derivatives 9,926,293 123,142,67790. Changes in fair value of
portfolio hedged financial assets (+/-) 25,711,333 56,122,418110. Property, plant and equipment 11,390,555 10,771,844120. 97,516,629 97,615,790
of which- goodwill 89,601,768 89,601,768
130. Tax assets 42,891,393 67,934,309a) current tax assets 2,401,351 25,264,179b) deferred tax assets 40,490,042 42,670,130 out of which for purposes of Law 214/2011 3,335,171 3,473,290
150. Other assets 227,865,255 256,629,063Total assets 16,313,300,526 17,682,197,400
BALANCE SHEET - LIABILITIES AND SHAREHOLDERS' EQUITY 06.30.2014 12.31.2013
10. Deposits from banks 1,026,852,314 1,648,675,36620. Deposits from customers 13,911,223,622 12,732,308,95530. Debt securities in issue 421,965,149 2,322,511,05840. Financial liabilities held for trading 4,866,978 2,301,40960. Hedging derivatives 38,579,390 141,800,65470. Changes in fair value of
portfolio hedged financial liabilities (+/-) 10,381,305 36,773,39580. Tax liabilities 52,975,266 37,700,727
a) current tax liabilities 30,155,919 16,841,629b) deferred tax liabilities 22,819,347 20,859,098
100. Other liabilities 260,098,188 227,861,470110. 4,149,204 3,760,989120. Provisions for risks and charges 110,507,276 109,354,461
b) other provisions 110,507,276 109,354,461130. Revaluation reserves 4,911,830 4,214,349160. Reserves 190,922,980 127,714,418170. Share premium reserve 1,934,113 1,934,113180. Share capital 200,070,431 200,070,431200. Net Profit (Loss) for the year 73,862,480 85,215,605Total liabilities and shareholders' equity 16,313,300,526 17,682,197,400

Bank Financial Statements
- 67 -
INCOME STATEMENT
INCOME STATEMENT 01.01.2014/06.30.2014 01.01.2013/06.30.2013
10. Interest income and similar revenues 149,721,822 168,923,74420. Interest expenses and similar charges (33,781,342) (73,019,079)30. Net interest margin 115,940,480 95,904,66540. Fee and commission revenues 199,783,545 179,951,81050. Fee and commission expenses (102,754,740) (98,146,629)60. Net fee and commission income 97,028,805 81,805,18170. Dividend income and similar revenue 4,136 22180. Gains (losses) on financial assets and liabilities held for trading 12,867,009 15,523,76890. Fair value adjustments in hedge accounting - -100. Gains (losses) from disposal or repurchase of: (4,219) 20
a) loans and receivables 49,159,044 20d) financial liabilities (49,163,263) -
110. Gains (losses) on financial assets/liabilities18,204 284,066
120. Operating income 225,854,415 193,517,921130. Impairment losses on: (1,291,395) (1,354,531)
a) loans and receivables (1,330,906) (1,354,531)d) other financial assets 39,511 -
140. Net profit (loss) from financial activities 224,563,020 192,163,390150. Administrative costs (138,825,971) (123,597,100)
a) payroll costs (31,834,550) (30,990,071)b) other administrative expenses (106,991,421) (92,607,029)
160. Net provisions for risks and charges (2,951,402) (359,678)170. Impairment/Write-backs on property, plant and equipment (1,607,426) (1,174,699)180. Impairment/write-backs on intangible assets (2,334,515) (2,316,160)190. Other net operating income 35,975,064 27,699,089200. Operating costs (109,744,250) (99,748,548)240. Gains (losses) on disposal of investments (421) (6,287)250. Total profit (loss) before tax from
continuing operations 114,818,349 92,408,555260. Tax expense (income) related to profit or loss from continuing operations (40,955,869) (36,146,826)270. Total profit (loss) after tax from
continuing operations 73,862,480 56,261,729290. Net Profit (Loss) for the period 73,862,480 56,261,729
Earnings per share (€) 0.12 0.09Diluted earnings per share (€) 0.12 0.09
Notes:
For further information on “Earnings per share” and “Diluted earnings per share” please see Notes to the Accounts, Part C -
Information on the Income Statement, Section 21.

Statement of Comprehensive Income
- 68 -
STATEMENT OF COMPREHENSIVE INCOME
01.01.2014/06.30.2014 01.01.2013/06.30.2013
10. Net Profit (Loss) for the period 73,862,480 56,261,729
Other comprehensive income after tax withoutreclassification through profit or loss40. Defined benefit plans (1,948,708) -Other comprehensive income after tax withreclassification through profit or loss100. Available-for-sale financial assets 2,646,189 (9,112)130. Total of other comprehensive income after tax 697,481 (9,112)140. Comprehensive income (item 10+130) 74,559,961 56,252,617

Statement of Changes in Shareholders' Equity
- 69 -
STATEMENT OF CHANGES IN SHAREHOLDERS' EQUITY
200,
070
,43
1
1,9
34,1
13
190,
922
,98
0
4,9
11,8
30
73,
862
,48
0
471,
701
,83
4
697
,48
1
73,
862
,48
0
74,
559
,96
1
Sto
ck
optio
n s -
Ow
n sh
are
deriv
ativ
e s -
Cha
nge
s in
equ
ity
inst
rum
ent s -
Dis
trib
utio
n
of
ext
rao
rdin
ary
div
iden
ds
-
Pur
chas
e of
ow
n sh
are
s -
Issu
es
of n
ew
shar
es
--
(22
,00
7,0
43)
(22
,00
7,0
43)
63,
208
,562
(63
,20
8,5
62) -
200,
070
,43
1
1,9
34,1
13
127,
714
,41
8
4,2
14,3
49
85,
215
,60
5
419,
148
,91
6-
200,
070
,431
1,93
4,11
3
127,
714
,418
4,21
4,34
9
85,
215
,605
419,
148
,916
Sha
re c
apita
l:
a) o
rdin
ary
sha
res
b) o
ther
sh
ares
Sha
re p
rem
ium
res
erve
Re
serv
es:
a) fr
om
pro
fits
b) o
ther
Re
valu
atio
n re
serv
es
Equ
ity in
stru
men
ts
Tre
asu
ry s
hare
s
Ne
t Pro
fit (
Los
s) fo
r th
e p
erio
d
Sha
reho
lder
s' e
quity
Bal
ance
as
at
12.
31.
201
3D
ivid
end
s an
d o
the
r di
strib
utio
ns
Bal
anc
e a
s a
t 01
.01.
201
4
Ch
ange
in
ope
ning
b
ala
nce
Ch
ang
e d
urin
g th
e y
ear
Sha
reh
olde
rs' e
quity
tra
nsa
ctio
ns
The
div
ide
nds
pai
d to
sh
are
hold
ers
amou
nt t
o €
20,0
07,0
43.
09,
equ
al t
o €
0.0
33 p
er
sha
re.
Allo
catio
n of
pro
fit fr
om
pre
vio
us y
ear
Sta
tem
en
t o
f C
ha
ng
es in
Sh
areh
old
ers'
Eq
uit
y a
s a
t 0
6.3
0.2
014
Res
erve
s
Sh
areh
old
er
s' e
qui
ty a
t 0
6.3
0.2
014
Com
preh
ens
ive
inco
me
as a
t 0
6.3
0.2
014
Ch
ang
es in
re
serv
es

Statement of Changes in Shareholders' Equity
- 70 -
200
,070
,431
1,9
34,1
13
127
,713
,847
3,6
82,8
37
-
56,2
61,7
29
389
,662
,957
(9,1
12)
56,2
61,7
29
56,2
52,6
17
Sto
ck
optio
ns -
Ow
n s
har
e de
rivat
ives
-
Cha
nges
in
equ
ity
inst
rum
ent s -
Dis
trib
utio
n of
ext
rao
rdin
ary
divi
dend
s -
Pur
chas
e of
ow
n sh
ares
-
Issu
es
of n
ew
shar
es -
- -
(114
,057
,559
)
(114
,057
,559
)
11,4
09,1
26
(11
,409
,126
) -
200,
070,
431
1,93
4,11
3
116,
304,
721
3,69
1,94
9
125,
466,
685
447,
467,
899
-
200,
070,
431
1,93
4,11
3
116,
304,
721
3,69
1,94
9
125,
466,
685
447,
467,
899
Sha
re c
apita
l:
a)
ord
inar
y sh
ares
b)
oth
er s
har
es
Sha
re p
rem
ium
res
erve
Res
erve
s:
a)
from
pro
fits
b)
oth
er
Rev
alua
tion
rese
rves
Equ
ity in
stru
men
ts
Tre
asu
ry s
hare
s
Ret
aine
d P
rofit
(Lo
ss)
Net
Pro
fit (
Los
s) fo
r th
e pe
riod
Sha
reho
lde
rs' e
qui
ty
Sta
tem
ent
of
Ch
ang
es
in S
har
eh
old
ers'
Eq
uit
y a
s at
06
.30.
2013
Res
erve
s
Ba
lanc
e as
a
t 01
.01.
2013
Cha
nge
in
op
enin
g b
alan
ce
Ba
lanc
e as
a
t 12
.31.
2012
Sha
reho
lder
s' e
qui
ty a
t 06
.30.
2013
Cha
nge
durin
g th
e ye
ar
Com
pre
hen
siv
e in
com
e as
at
06.3
0.20
13
Sha
reho
lder
s' e
quity
tra
nsa
ctio
ns
Th
e di
vid
end
s p
aid
to s
har
ehol
ders
am
oun
t to
€11
1.85
7.55
9,09
, eq
ual t
o €0
.184
5 p
er s
hare
.
Ch
ang
es in
re
serv
es
Allo
catio
n o
f pro
fit fr
om
prev
iou
s ye
ar
Div
iden
ds
and
othe
r d
istr
ibut
ions

Cash Flow Statement
- 71 -
CASH FLOW STATEMENT
Indirect method
A. OPERATING ACTIVITIES 06.30.2014 06.30.2013
1. Operations 77,932,513 68,902,191
- profit (loss) for the period 73,862,480 56,261,729- capital gains/losses on financial assets/liabilities held for trading and on assets/liabilities at fair value through profit and loss (123,074) (647,820)- capital gains/losses on hedging transactions - -- net write-offs/write-backs due to impairment 1,514,004 1,607,493- net write-offs/write-backs on tangible and intangible assets 3,941,941 3,490,859- provisions and other income/expenses 5,451,351 701,578- duties, taxes and tax credits not paid 13,557,550 3,864,486- net impairment/write-backs on disposal groups classified as held for sale after tax - -- other adjustments (20,271,739) 3,623,866
2. Cash flows from/used by financial assets (7,429,928,774) 1,423,082,164
- financial assets held for trading (1,826,691) 6,854,333- financial assets designated at fair value through profit or loss 3,196,673 7,220,875- available-for-sale financial assets (1,604,752,040) (39,900,154)- loans and receivables with banks: on demand - -- loans and receivables with banks: other loans and receivables (5,821,434,366) 1,474,535,427- loans and receivables with customers (56,544,956) (9,260,294)- other assets 51,432,606 (16,368,023)
3. Cash flows from/used by financial liabilities (1,298,570,406) (155,424,492)
- deposits from banks: on demand - -- deposits from banks: other payables (616,670,675) (377,614,420)- deposits from customers 1,192,830,724 226,514,722- debt securities in issue (1,900,545,909) -- financial liabilities held for trading (1,190,580) (6,623,279)- financial liabilities at fair value through profit and loss - -- other liabilities 27,006,034 2,298,485
Net cash flows from/used in operating activities (8,650,566,667) 1,336,559,863
B. INVESTMENT ACTIVITIES
1. Cash flows from- sales of equity investments - -- collected dividends on equity investments - -- sales of financial assets held to maturity -- sales of tangible assets 128 214- sales of intangible assets - -- disposal of businesses - -
2. Cash flows used in- purchases of equity investments - -- purchases of financial assets held to maturity - -- purchases of tangible assets (2,215,522) (1,176,446)- purchases of intangible assets (2,235,353) (2,019,663)- purchases of businesses
Net cash flows from/used in investing activities (4,450,747) (3,195,895)
C. FUNDING ACTIVITIES
- issue/purchase of treasury shares - -- issue/purchase of equity instruments - -- dividends and other distributions (22,007,043) (114,057,559)
Net cash flows from/used in financing activities (22,007,043) (114,057,559)
NET LIQUIDITY GENERATED / ABSORBED DURING THE PERIOD (8,677,024,457) 1,219,306,409
RECONCILIATION
Balance Sheet ItemsCash and cash balances at the beginning of the year 10,038,098,537 9,305,413,792Net liquidity generated/absorbed during the period (8,677,024,457) 1,219,306,409Cash and cash balances: effect of changes in exchange rates 11,380,044 2,509,380Cash and cash balances at the end of the period 1,372,454,124 10,527,229,581
The term "cash and cash balances" means cash recorded under item 10 of assets "cash and cash balances" and the
liquid assets recorded under item 60 of assets "Loans and receivables with banks" (consisting of current accounts and
deposits maturing within 3 months) net of the equivalent liquid liabilities recorded under item 10 of liabilities "Deposits
from banks" (represented by current accounts and deposits maturing within 3 months).

Notes to the Accounts
Notes to the Accounts

Notes to the Accounts
- 73 -
PART A – ACCOUNTING POLICIES
A.1 GENERAL
Section 1 - Statement of Compliance with IFRS
These interim financial statements for the six-month period ended June 30, 2014 have been prepared in accordance
with the recognition and valuation criteria set out in the International Financial Reporting Standards (“IFRS”) issued by
the International Accounting Standards Board (IASB), including the SIC and IFRIC interpretation documents, as
endorsed by the European Commission pursuant to European Union Regulation no. 1606/2002 of July 19, 2012,
implemented in Italy through Legislative Decree no. 38 of February 28, 2005.
Specifically, the half-year report as at June 30, 2014 complies with the international accounting standard applicable to
interim financial reports (IAS 34). Based on paragraph 10 of IAS 34, the half-year financial statements have been
prepared in a condensed form.
Section 2 - Preparation criteria
As stated above, these condensed half-year financial statements have been prepared in accordance with the IFRS
endorsed by the European Commission.
The half-year financial statements have been prepared in a condensed form and therefore should be read in
conjunction with the annual financial statements as at December 31, 2013.
The condensed half-year financial statements comprise the Balance Sheet, the Income Statement, the Statement of
Comprehensive Income, the Statement of Changes in Shareholders’ Equity, the Cash Flow Statement (compiled using
the “indirect” method), and these explanatory Notes5. They are included in the half-year financial report prepared
pursuant to Article 154-ter, paragraph 3 of Legislative Decree no. 58/98 which contains the Directors’ Interim Report
on operations.
The figures in the financial statements are provided in euros, as the currency of account, and in thousands of euros in
the Notes, unless otherwise indicated.
The condensed half-year financial statements as at June 30, 2014 have been prepared on a going concern basis, in
accordance with IAS 1, as there are no doubts or uncertainties as to the Bank’s ability to continue its business
operations and to continue operating for the foreseeable future (at least 12 months).
The measurement criteria adopted are therefore consistent with this assumption and with the principles of accrual-
based accounting, the relevance and materiality of accounting information, and the prevalence of economic substance
over legal form. These criteria have not changed compared to the previous year, with the exception of the following
Section A.2 “The main items of the Accounts” and Section 4- “Other matters”, with reference to new standards and
interpretations becoming effective.
5 Some of the tables contain the following symbols: (-) indicates that the item is equal to zero or its amount is less than 1 thousand euro; "X" indicates that the amount for that item is not required in accordance with the provisions of the Bank of Italy Circular no. 262/2005.

Notes to the Accounts
- 74 -
The activity of the Bank is not affected by any significant seasonal and/or cyclical factor.
Section 3 - Subsequent events
On July 15, 2014, following the listing of the ordinary shares of the Bank, the Board of Directors of FinecoBank
approved:
the total number of newly issued FinecoBank shares freely assignable to the recipients of the stock granting plan
"2014-2017 Multi Year Top Plan Management" (guidelines approved by the Board of Directors on April 15, 2014
and related regulation by the Board of Directors on May 15, 2014, with execution conditional on listing), and the
allocation of the shares quota for the year 2014. Specifically, the total number of shares that can be assigned under
the plan has been set at 2,523,400. The quota allocated for 2014 amounted to 630,850 shares (grant date
September 30, 2014). As defined by the Plan Rules, the allocation of the other quotas is expected in 2015, 2016
and 2017. The number of shares allocated to each quota may decrease according to the Bank’s requirement to
keep the ratio between the variable and fixed part of the remuneration in line with the rules applicable from time to
time. In order to ensure a more appropriate balance between the short-, medium- and long-term variable
components of the remuneration, the Board of Directors may reduce the value of the variable remuneration granted
under the Plan down to the limit of 100% of the fixed remuneration. The shares allotted pursuant to the above
rules, will actually be assigned, after a three-year vesting period (i.e. in 2017 for the quota allotted in 2014), upon
satisfaction of pre-defined conditions;
the list of employees identified as Key People under the “2014 Plan Key People” plan (stock granting plan whose
guidelines were approved by the Board of Directors on April 15, 2014 and the related regulation by the Board of
Directors on May 15, 2014, with execution conditional on listing), and the shares to be allocated to the said people.
The total number of newly issued shares allocated under the plan amounted to 796,390 (grant date September 30,
2014); they will be assigned, upon verification that pre-defined conditions have been satisfied, in three annual
tranches, the first of which in 2015 and the third in 2017.
The dilution effect for shareholders arising from the free capital increases used in execution of the mentioned stock
granting plans and the Group Incentive System is calculated as a maximum of 0.61% of the fully diluted capital.
No significant events occurred after June 30, 2014 that would make it necessary to change any of the information
given in the condensed half-year financial statements. Please refer to the specific section of the Interim Report on
Operations for a description of the significant events after half-year end.
The condensed half-year financial statements were approved by the Board of Directors' meeting of August 1, 2014,
which authorized their publication.
Section 4 - Other Matters
In 2014, the following accounting standards, amendments and interpretations have become effective for reporting
periods beginning on or after January 1, 2014:
IAS 27 revised – Separate Financial Statements (EU Regulation 1254/2012);
IAS 28 revised - Investments in Associates and Joint Ventures (EU Regulation 1254/2012);

Notes to the Accounts
- 75 -
IFRS 10 - Consolidated Financial Statement (EU Regulation 1254/2012);
IFRS 11 - Joint Arrangements (EU Regulation 1254/2012);
IFRS 12 - Disclosure of Interests in Other Entities (EU Regulation 1254/2012);
Amendments to IAS 36 - Impairment of Assets - Recoverable Amount Disclosures for Non-Financial Assets (EU
Regulation 1374/2013);
Amendments to IAS 32 – Financial Instruments: presentation – Offsetting Financial Assets and Financial Liabilities
(EU Regulation 1256/2012);
Amendments to IAS 39 - Financial Instruments: Novation of Derivatives and Continuation of Hedge Accounting (EU
Regulation 1375/2013);
Amendments to IFRS 10, IFRS 11 and IFRS 12 – Transition Guidance (EU Regulation 313/2013);
Amendments to IFRS 10, IFRS 12 and IAS 27 – Investment Entities (EU Regulation 1174/2013);
IFRIC 21 – Levies (EU Regulation 634/2014).
Where applicable, these accounting standards, amendments and interpretations had no impact on the financial
position and results of the Bank as at June 30, 2014.
In 2014 the European Commission did not approve any other accounting standards.
Finally, as at June 30, 2014, the IASB issued the following accounting standards and interpretations or revisions
thereof, whose approval process by the European Union is still ongoing:
IFRS 9 – Financial Instruments (November 2009) and subsequent amendments:
o Amendments to IFRS 9 – Mandatory Effective Date and Transition – December 2011;
o Hedge accounting and amendments to IFRS9, IFRS7 and IAS 39 – November 2013;
IFRS 14 - Rate-regulated activities (January 2014);
IFRS 15 - Revenue from contracts with customers (May 2014);
Amendments to IAS 16 and IAS 41: Agriculture Bearer plants (June 2014)
Amendments to IAS 16 and IAS 38: Clarification of acceptable methods of depreciation and amortization (May
2014);
Amendments to IFRS 11: Accounting for Acquisitions of Interests in Joint Operations (May 2014)
Amendments to IAS 19 - Defined benefit plans: Employee contributions (November 2013);
Annual Improvements to International Financial Reporting Standards, 2010-2012 Cycle (December 2013);
Annual Improvements to International Financial Reporting Standards, 2011-2013 Cycle (December 2013).
However, application of these principles by the Bank is subject to their approval by the European Union.

Notes to the Accounts
- 76 -
Risks and uncertainties related to the use of estimates
In the application of the accounting policies, the management is required to make judgments, estimates and
assumptions about the carrying amounts of certain assets and liabilities as well as the information regarding potential
assets and liabilities. The estimates and associated assumptions are based on historical experience and other factors
that are considered to be relevant. Actual results may differ from these estimates.
Estimated figures have been used for the recognition of some of the largest value-based items in the half-year
financial statements as at June 30, 2014, as required by the accounting standards and regulations described above.
These estimates are largely based on calculations of future recoverability of the values recognized in the accounts
according to the rules laid down in current legislation and have been made on the assumption of a going concern, i.e.
without contemplating the possibility of the forced sale of the items measured.
The processes adopted support the values recognized at June 30, 2014.
Valuation is particularly complex given the uncertainty of the macroeconomic and market situation, characterized by
the significant volatility of financial indicators used in the valuation process and still high levels of credit quality
impairment.
The parameters and information used to check the above-mentioned values are therefore significantly affected by
such factors, which could change rapidly in ways that are currently unforeseeable, such that further effects on future
book values cannot be ruled out.
The estimates and underlying assumptions are reviewed on an ongoing basis. Any changes resulting from these
reviews are recognized in the period in which the review was carried out, provided the change only concerns that
period. If the revision concerns both current and future periods it is recognized accordingly in both current and future
periods.
Uncertainty affecting estimates is generally inherent in the determination of:
- fair value of financial instruments not listed in active markets;
- receivables, and in general, all other financial assets/liabilities;
- employee severance pay provision (Italy) and other employee and financial advisor benefits;
- provisions for risks and charges;
- goodwill;
- deferred tax assets;
- tax liabilities.
This is because the quantification of these items is mainly influenced by the performance of the financial markets,
which affect interest rates, price fluctuations, actuarial assumptions and, more generally, the creditworthiness of
borrowers and counterparties, as well as the progress and development of ongoing or potential litigation.
In this regard, there have been no changes in estimate criteria compared to those applied in the preparation of
financial statements for the year ended December 31, 2013.

Notes to the Accounts
- 77 -
A.2 THE MAIN ITEMS OF THE ACCOUNTS
With regard to the classification and valuation of the main items, please refer to Part A.2 of the Notes to the
Consolidated Accounts as at December 31, 2013.
The costs incurred for the listing of FinecoBank ordinary shares, which was completed on July 2, 2014 when trading
on the shares began, were booked to the income statement as incurred, with the exception of commissions due to the
Syndicate in charge of the Public Offer and the Syndicate in charge of the Institutional Placement, which were paid by
the selling Shareholder.
With regard to specific Fair Value hedging derivatives of securities included in the portfolio of “Available-for-sale
financial assets”, entered into in the first half - the fair value changes of the hedging instrument were recognized
through profit or loss in item 90. “Fair value adjustments in hedge accounting”; fair value changes of the hedged item
attributable to the hedged risk (interest rate risk) were recognized through profit or loss in the same item; fair value
changes of the hedged item attributable to the non-hedged risk (essentially, credit risk) were recognized in the
Revaluation reserves for available-for-sale financial assets.
A.3 DISCLOSURE ON TRANSFERS BETWEEN PORTFOLIOS OF FINANCIAL ASSETS
A.3.1 Reclassified financial assets: book value, fair value and effects on comprehensive income
No data to report.
A.3.2 Reclassified financial assets: Impact on comprehensive income before transfer
No data to report.
A.3.3 Transfer of financial assets held for trading
No data to report.
A.3.4 Effective interest rate and cash flows expected from reclassified assets
No data to report.
A.4 INFORMATION ON FAIR VALUE
Qualitative information
With reference to the qualitative information on fair value, the reader should refer to the annual Financial Statements
as at December 31, 2013 - Part A.4 of the Notes.
Quantitative information
The following tables show a breakdown of financial assets and liabilities designated at fair value on a recurrent basis
according to the levels of the fair value hierarchy set out in IFRS 13, based on the observability of inputs used in the
valuation techniques, the transfers of assets and liabilities between level 1 and level 2, as well as the annual changes
of Level 3 assets or liabilities.

Notes to the Accounts
- 78 -
A.4.5 Fair Value Hierarchy
A.4.5.1 Assets and liabilities measured at fair value on a recurring basis: breakdown by level of fair value
Assets/Liabilities designated at fair value through profit and loss L1 L2 L3 L1 L2 L31. Financial assets held for trading 8,880 1,509 18 3,717 969 142. Financial assets designated at fair value through profit or loss - - - 3,199 - -3. Available-for-sale financial assets 1,715,314 - - 89,910 - -4. Hedging derivatives - 9,926 - - 123,143 -5. Property, plant and equipment - - - - - -6. Intangible assets - - - - - -
Total 1,724,194 11,435 18 96,826 124,112 141. Financial liabilities held for Trading 3,760 1,107 - 1,709 592 -2. Financial liabilities at fair value through profit and loss - - - - - -3. Hedging derivatives - 38,579 - - 141,801 -
Total 3,760 39,686 - 1,709 142,393 -(Amounts in € thousand)
Total 06.30.2014 Total 12.31.2013
Key: L1 = Level 1 - L2 = Level 2 - L3 = Level 3
A.4.5.1.1 Assets and liabilities measured at fair value on a recurring basis: transfers between levels of fair value
hierarchy (level 1 and level 2)
No data to report.
A.4.5.2 Assets measured at fair value on a recurring basis (level 3): changes of the period
Financial assets held for trading
Financial assets designated at fair
value through profit or loss
Available-for-sale financial assets
Hedging derivatives
Property, plant and equipment
Intangible assets
1. Opening balances 14 - - - - -2. Increases2.1 Purchases 1,379 - - - - -2.2 Profits recognised in:2.2.1 Income Statement 16 - - - - - - of which Unrealised gains 4 - - - - -2.2.2 Equity - - - -2.3 Transfers from other levels - - - - - -2.4 Other increases - - - - - -3. Decreases3.1 Sales (1,391) - - - - -3.2 Redemptions - - - - - -3.3 Losses recognised in:3.3.1 Income Statement - - - - - - - of which Unrealised losses - - - - - -3.3.2 Equity - - - -3.4 Transfers to other levels - - - - - -3.5 Other decreases - - - - - -4. Closing balances 18 - - - - -(Amounts in € thousand)
A.4.5.3 Liabilities measured at fair value on a recurring basis (level 3): changes of the period
No change to report.

Notes to the Accounts
- 79 -
A.4.5.4 Assets and liabilities not measured at fair value or measured at fair value on a non-recurring basis: breakdown
by level of fair value
Asset/Liabilities not measuredat fair value or measured at fair valueon a non-recurring basis BV L1 L2 L3 BV L1 L2 L31. Held-to-maturity investments - - - - - - - -2. Loans and receivables with banks 13,476,117 - 9,752,660 4,196,642 16,330,912 - 16,425,906 -3. Loans and receivables with customers 696,142 - 1 710,980 641,250 - 650,772 4,7314. Property, plant and equipment held for investment 2,677 - - 4,813 2,734 - - 4,8135. Non-current assets and disposal groups disposal groups classified as held for sale - - - - - - - -
Total 14,174,936 - 9,752,661 4,912,435 16,974,896 - 17,076,678 9,5441. Deposits from banks 1,026,852 - - 1,026,852 1,648,675 - 1,648,675 -2. Deposits from customers 13,911,224 - 223,591 13,688,945 12,732,309 - 12,739,102 -3. Debt securities in issue 421,965 - 439,399 - 2,322,511 - 2,422,470 -4. Liabilities associated with assets classified as held for sale - - - - - - - -
Total 15,360,041 - 662,990 14,715,797 16,703,495 - 16,810,247 -(Amounts in € thousand)
Total 06.30.2014 Total 12.31.2013
As of 2014, as a result of fine-tuning the processes for the allocation of fair value levels within the Group, Loans and
Receivables with banks and with customers and Deposits from banks and from customers with maturity less than 12
months, for which the fair value has been considered as approximately equal to their book value, have been classified
in level 3 of the fair value hierarchy. As at December 31, 2013, they were categorized into level 2.
Key: L1 = Level 1 - L2 = Level 2 - L3 = Level 3 - BV = Book Value
A.5 DAY-ONE PROFIT/LOSS
Financial instruments are initially recognized at fair value on the recognition date.
The fair value of financial instruments, other than those measured at fair value through profit or loss, at their initial
recognition date is usually assumed to be equal to the amount collected or paid (transaction price). The same applies
to financial instruments held for trading and financial instruments measured at fair value classified in level 1 and, in
many cases, level 2 of the fair value hierarchy, for which fair value - based on prices indirectly obtained from the
market - and transaction price coincide; any difference from the amount collected or paid is recognized in the
appropriate line items of the income statement on initial recognition of the instrument.
In the case of Level 3 financial instruments whose fair value is determined using valuation techniques, the transaction
price, which generally represents the best estimate of fair value upon initial recognition, differs from the fair value
determined at the same date, on the basis of valuation techniques. In this case, initial recognition must always be at
price and the resulting profit/loss - "day-one profit/loss” - is only recognized in the income statement based on changes
in the factors on which market participants base their valuations when setting prices.
There are no "day-one profits/losses" to disclose in accordance with paragraph 28 of IFRS 7.

Notes to the Accounts
- 80 -
PART B -BALANCE SHEET
ASSETS
Section 1 - Cash and cash balances - Item 10
1.1 Cash and cash balances: breakdown
Total 06.30.2014 Total 12.31.2013
(a) Cash 14 5(b) Demand deposits with Central Banks - -
Total 14 5(Amounts in € thousand)
Section 2 - Financial assets held for trading - Item 20
2.1 Financial assets held for trading: breakdown by category
Item/AmountLevel 1 Level 2 Level 3 Level 1 Level 2 Level 3
A. On-balance sheet assets1. Debt securities 44 - - 48 - - 1.1 Structured securities 3 - - 4 - - 1.2 Other debt securities 41 - - 44 - -2. Equity instruments 5,152 - 17 9 - 143. Units in investment funds. - - - 1,936 - -4. Loans - - - - - - 4.1 Reverse repos - - - - - - 4.2 Other - - - - - -
Total A 5,196 - 17 1,993 - 14B. Derivative instruments1. Financial derivatives 3,684 1,509 1 1,724 969 - 1.1 trading derivatives 3,684 1,509 1 1,724 969 - 1.2 related to the fair value option - - - - - - 1.3 other - - - - - -2. Credit derivatives - - - - - - 2.1 trading derivatives - - - - - - 2.2 related to the fair value option - - - - - - 2.3 other - - - - - -
Total B 3,684 1,509 1 1,724 969 -Total (A+B) 8,880 1,509 18 3,717 969 14
(Amounts in € thousand)
Total 06.30.2014 Total 12.31.2013
Trading financial derivatives refer to the positive valuation of Forex Contracts for Difference (CFDs), CFDs on indices
and related Futures on indices used to hedge CFDs. They amounted to €1,442 thousand (€908 thousand as at
December 31, 2013).
Sub-item B.1.1 Derivative instruments - Trading financial derivatives includes the positive valuations of spot contracts
for securities classified in the HFT portfolio and currencies to be settled in times established by market practices
(“regular way”). They amounted to €3,536 thousand (€1,786 thousand as at December 31, 2013).

Notes to the Accounts
- 81 -
Section 3 - Financial assets at fair value through profit or loss – Item 30
3.1. Financial assets at fair value through profit or loss: breakdown by category
Item/AmountLevel 1 Level 2 Level 3 Level 1 Level 2 Level 3
A. On-balance sheet assets1. Debt securities - - - 3,199 - - 1.1 Structured securities - - - 844 - - 1.2 Other debt securities - - - 2,355 - -2. Equity instruments - - - - - -3. Units in investment funds. - - - - - -4. Loans - - - - - - 4.1 Structured - - - - - - 4.2 Other - - - - - -
Total - - - 3,199 - -Cost - - - 3,211 - -(Amounts in € thousand)
Total 06.30.2014 Total 12.31.2013
Securities classified as Financial assets designated at fair value through profit or loss as at December 31, 2013 were
sold during the first half of 2014.
Section 4 - Available-for-sale financial assets – Item 40
4.1 Available-for-sale financial assets: breakdown by category
Item/AmountLevel 1 Level 2 Level 3 Level 1 Level 2 Level 3
1. Debt securities 1,715,315 - - 89,910 - - 1.1 Structured securities - - - - - - 1.2 Other debt securities 1,715,315 - - 89,910 - -2. Equity instruments - - 5 - - 5 2.1 Carried at fair value - - - - - - 2.2 Carried at cost - - 5 - - 53. Units in investment funds. - - - - - -4. Loans - - - - - -
Total 1,715,315 - 5 89,910 - 5(Amounts in € thousand)
Total 06.30.2014 Total 12.31.2013
Equity instruments carried at cost refer to equity investments in companies in which the Bank does not exercise
control or have a significant influence, for an amount equal to €5 thousand. These instruments are not listed, therefore
the fair value may not be reliably determined.
The other debt securities are issued by the Italian Government, for a book value of €1,705,038 thousand (€79,871
thousand as at December 31, 2013) and by the French Government, for a book value of €10,277 thousand (€10,039
thousand as at December 31, 2013).
As regards the increase in debt securities compared to December 31, 2013, in the first half of 2014, as part of the
guidelines for the new liquidity investment policy that entered into force on April 1, 2014, the portion of liquid assets
classified as "Non Core" was invested in government bonds issued by the Italian Government for a nominal amount of
€1,500,000 thousand while derivative contracts were entered into at the same time in order to convert the fixed rate
into a floating rate in compliance with pre-defined limits on interest rate risk.

Notes to the Accounts
- 82 -
A portion of debt securities classified in the Available-for-sale financial assets portfolio are entirely used as collateral
for bankers' drafts or guarantees with third parties for a book value of €91,601 thousand.
Section 6 - Loans and receivables with banks – Item 60
6.1 Loans and receivables with banks: breakdown by category
Type of transaction/Amount
Level 1 Level 2 Level 3 Level 1 Level 2 Level 3
A. Loans and receivables with Central Banks - - - - - - - -1. Time deposits - X X X - X X X2. Compulsory reserves - X X X - X X X3. Reverse repos - X X X - X X X4. Other - X X X - X X XB. Loans and receivables with banks 13,476,117 - 9,752,660 4,196,642 16,330,912 - 16,425,906 -1. Loans 4,463,712 - 267,781 4,196,642 13,008,296 - 13,013,702 -1.1 Current accounts and demand deposits 1,378,975 X X X 9,433,356 X X X1.2 Time deposits 3,016,939 X X X 3,563,334 X X X1.3 Other loans X X X X X X - Reverse repos 45,318 X X X 5,584 X X X - Finance leases - X X X - X X X - Other 22,480 X X X 6,022 X X X2. Debt securities 9,012,405 - 9,484,879 - 3,322,616 - 3,412,204 -2.1 Structured securities 12 X X X 12 X X X2.2 Other debt securities 9,012,393 X X X 3,322,604 X X X
Total 13,476,117 - 9,752,660 4,196,642 16,330,912 - 16,425,906 -(Amounts in € thousand)
Total 06.30.2014 Total 12.31.2013
BVFV
BVFV
Key FV = fair value BV = book value
Loans and receivables with banks for current accounts and demand deposits mainly consist of accounts held with
UniCredit, with a book value of €1,357,172 thousand (€9,415,098 thousand as at December 31, 2013), and to a lesser
extent, of current accounts held with other banks not belonging to UniCredit group for transactions in securities.
Time deposits consist of the deposit held with UniCredit for compulsory reserves, with a book value of €130,461
thousand (€124,028 thousand as at December 31, 2013), in addition to time deposits held with UniCredit with a book
value of €2,886,478 thousand (€3,439,306 thousand as at December 31, 2013), opened to invest the liquidity collected
through repos and CashPark transactions with retail customers and through repos with credit institutions, with the
same maturities.
The debt securities held in the portfolio and included in the category “Loans and receivables” mainly consist of debt
securities issued by UniCredit for an amount of €9,012,403 thousand.
As regards the increase in securities held in the portfolio compared to December 31, 2013, it should be noted that, as
part of the listing process, the Board of Directors' meeting on March 27, 2014 approved the main guidelines for the
liquidity investment policy, in force from April 1, 2014. More specifically, “Core” liquidity has been invested in UniCredit
bonds with maturities ranging from 2 years and 10 months to 7 years and 6 months, for a total nominal amount of
€7,650 million and USD 250 million. These types of investment were determined by taking into account the overall
structure of the Bank’s balance sheet and with a view to optimize the risk/return profile of the investments and diversify
their maturities.
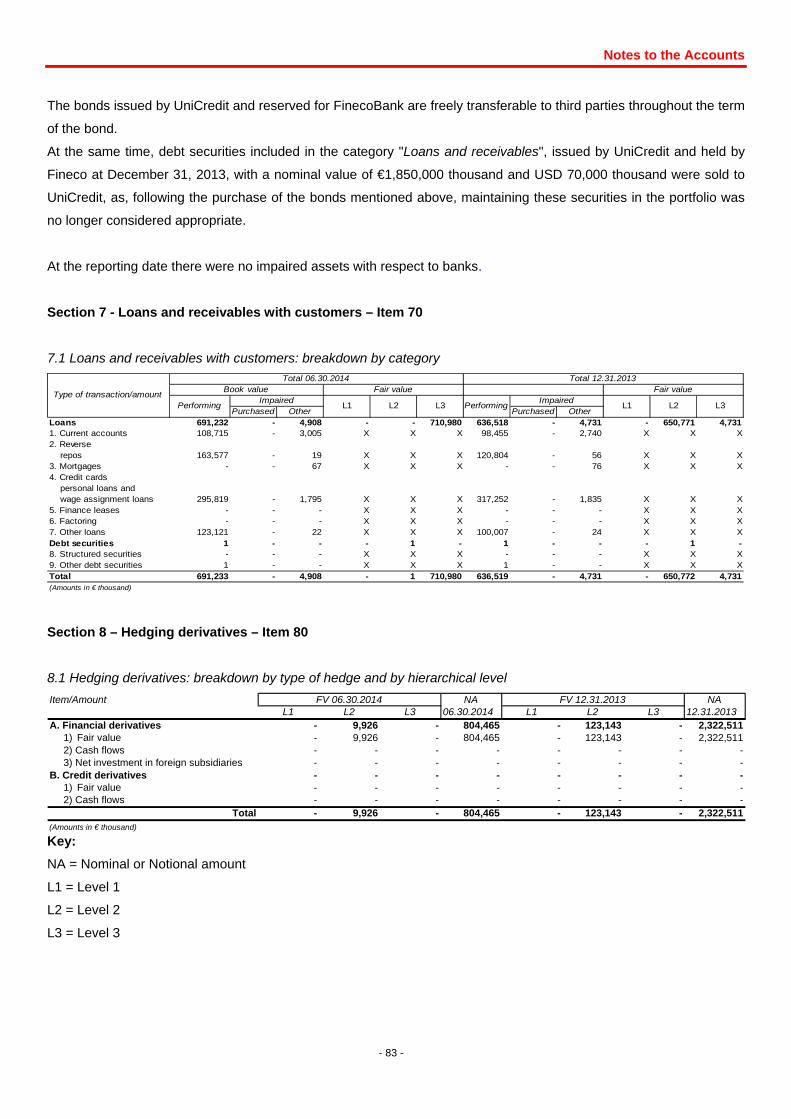
Notes to the Accounts
- 83 -
The bonds issued by UniCredit and reserved for FinecoBank are freely transferable to third parties throughout the term
of the bond.
At the same time, debt securities included in the category "Loans and receivables", issued by UniCredit and held by
Fineco at December 31, 2013, with a nominal value of €1,850,000 thousand and USD 70,000 thousand were sold to
UniCredit, as, following the purchase of the bonds mentioned above, maintaining these securities in the portfolio was
no longer considered appropriate.
At the reporting date there were no impaired assets with respect to banks.
Section 7 - Loans and receivables with customers – Item 70
7.1 Loans and receivables with customers: breakdown by category
Purchased Other Purchased OtherLoans 691,232 - 4,908 - - 710,980 636,518 - 4,731 - 650,771 4,7311. Current accounts 108,715 - 3,005 X X X 98,455 - 2,740 X X X2. Reverse repos 163,577 - 19 X X X 120,804 - 56 X X X3. Mortgages - - 67 X X X - - 76 X X X4. Credit cards personal loans and wage assignment loans 295,819 - 1,795 X X X 317,252 - 1,835 X X X5. Finance leases - - - X X X - - - X X X6. Factoring - - - X X X - - - X X X7. Other loans 123,121 - 22 X X X 100,007 - 24 X X XDebt securities 1 - - - 1 - 1 - - - 1 -8. Structured securities - - - X X X - - - X X X9. Other debt securities 1 - - X X X 1 - - X X XTotal 691,233 - 4,908 - 1 710,980 636,519 - 4,731 - 650,772 4,731(Amounts in € thousand)
Total 12.31.2013
L3Type of transaction/amount
Total 06.30.2014Book value Fair value Fair value
PerformingImpaired
L2L1 L2 L3 PerformingImpaired
L1
Section 8 – Hedging derivatives – Item 80
8.1 Hedging derivatives: breakdown by type of hedge and by hierarchical level
Item/Amount NA NAL1 L2 L3 06.30.2014 L1 L2 L3 12.31.2013
A. Financial derivatives - 9,926 - 804,465 - 123,143 - 2,322,511 1) Fair value - 9,926 - 804,465 - 123,143 - 2,322,511 2) Cash flows - - - - - - - - 3) Net investment in foreign subsidiaries - - - - - - - -B. Credit derivatives - - - - - - - - 1) Fair value - - - - - - - - 2) Cash flows - - - - - - - -
Total - 9,926 - 804,465 - 123,143 - 2,322,511(Amounts in € thousand)
FV 06.30.2014 FV 12.31.2013
Key:
NA = Nominal or Notional amount
L1 = Level 1
L2 = Level 2
L3 = Level 3

Notes to the Accounts
- 84 -
Section 9 – Changes in fair value of portfolio hedged items – Item 90
9.1 Adjustments to the value of hedged financial assets: breakdown by hedged portfolios
Total 06.30.2014 Total 12.31.2013
1. Positive changes1.1 of specific portfolios 26,204 100,241 a) loans and receivables 26,204 100,241 b) available-for-sale financial assets - -1.2 overall - -2. Negative changes2.1 of specific portfolios (493) (44,119) a) loans and receivables (493) (44,119) b) available-for-sale financial assets - -2.2 overall - -
Total 25,711 56,122(Amounts in € thousand)
Adjustments to the value of hedged assets/Amount
Section 11 - Property, plant and equipment - Item 110
11.1 Property, plant and equipment used in the business: breakdown of assets carried at cost
Asset/Amount Total 06.30.2014 Total 12.31.2013
1. Owned assets 8,714 8,038a) land - -b) buildings - -c) office furniture and fittings 900 834d) electronic systems 6,587 5,846e) other 1,227 1,3582. Assets under financial lease - -a) land - -b) buildings - -c) office furniture and fittings - -d) electronic systems - -e) other - -
Total 8,714 8,038(Amounts in € thousand)
11.2 Property, plant and equipment held for investment purposes: breakdown of assets carried at cost
Asset/Amount
L1 L2 L3 L1 L2 L3
1. Owned assets 2,677 - - 4,813 2,734 - - 4,813 a) land - - - - - - - - b) buildings 2,677 - - 4,813 2,734 - - 4,8132. Assets under financial lease - - - - - - - - a) land - - - - - - - - b) buildings - - - - - - - -
Total 2,677 - - 4,813 2,734 - - 4,813(Amounts in € thousand)
Total 06.30.2014 Total 12.31.2013Book value
Fair value Book value
Fair value

Notes to the Accounts
- 85 -
Section 12 - Intangible assets - Item 120
12.1 Intangible assets: breakdown
Asset/AmountFinite life Indefinite life Finite life Indefinite life
A.1 Goodwill X 89,602 X 89,602A.2 Other Intangible assets 7,915 8,014A.2.1 Assets carried at cost: a) Intangible assets generated internally - - - - b) Other assets 7,915 - 8,014 -A.2.2 Assets valued at fair value : a) Intangible assets generated internally - - - - b) Other assets - - - -
Total 7,915 89,602 8,014 89,602(Amounts in € thousand)
Total 06.30.2014 Total 12.31.2013
Other information - Goodwill
Goodwill relates to buy-outs of divisions or companies engaged in trading activities or the distribution of financial,
banking and insurance products through personal financial advisors. These activities have been fully integrated with
FinecoBank's ordinary operations, as a result it is not possible to isolate the contribution of each company/business
division from the Bank’s overall income; this means that to establish the reasonableness of the value of goodwill
recognized in the financial statements it is necessary to take account of the Bank’s comprehensive income.
The cash generating unit (CGU) is the Bank as a whole. In fact, in view of the specific business model adopted by
FinecoBank, which envisages a high level of integration between personal financial advisors and the trading and
banking platform, an allocation of costs/revenues for business units is not considered relevant or meaningful; the
personal financial advisors network is an integral part of the overall offer, which includes banking, brokerage and
investing services.
As regards the annual impairment test, as at June 30, 2014 no indicators of an impairment of goodwill recognized in
the financial statements have been identified. The main assumptions used in the impairment test carried out with
reference to December 31, 2013 were analysed, in qualitative terms, considering in particular changes in forecasts
used in that test following the approval by the Board of Directors on April 15, 2014 of the new Business Plan for the
period 2014-2018, already submitted to the Board for approval in the meeting held on March 10, 2014 (and also
approved by the Board of Directors of UniCredit S.p.A. on March 11, 2014). The Business Plan has been revised to
take into account the effects of the new liquidity investment policy as from April 1, 2014, costs relative to the new
incentive system for employees and financial advisors and costs relative to the listing process.
Based on the results of those qualitative analyses, the result of the impairment test as at December 31, 2013 was also
confirmed with reference to June 30, 2014. For all other information on the impairment test, reference should be made
to the Financial Statements as at December 31, 2013.

Notes to the Accounts
- 86 -
Section 13 - Tax Assets and Tax Liabilities - Asset item 130 and liability item 80
Current tax assets and current tax liabilities
Asset/Amount Total 06.30.2014 Total 12.31.2013
Current tax assets 2,401 25,264
Current tax liabilities 30,156 16,842
(Amounts in € thousand)
The decrease in “Current Tax assets" was mainly due to the use of previously paid IRES income tax and IRAP
corporate tax advances.
With regard to risks arising from tax disputes or audits, there are no changes to report compared to what was
discussed in the 2013 financial statements, except for the closure, in April 2014, of the procedure for the tax
assessment settlement concerning the notice of payment for 2008, which was received at the end of 2013. The
settlement amount for that year was set at €244 thousand as tax and €122 thousand by way of penalties and accrued
interest; provisions for these sums had already been allocated in the financial statements at December 31, 2013. The
Bank made the payment on April 18, 2014 for a total amount of €367 thousand (including interest accrued up to the
date of payment).
13.1 Deferred tax assets: breakdown
Asset/Amount Total 06.30.2014 Total 12.31.2013
Allocations through equity 35,750 37,843Allocations through equity 1,405 1,354Impairment losses on receivables (of which pursuant to Law 214/2011) 3,335 3,473
Total 40,490 42,670(Amounts in € thousand)
13.2 Deferred tax liabilities: breakdown
Asset/Amount Total 06.30.2014 Total 12.31.2013
Property plant and equipment / Intangible assets 21,193 20,527Other financial instruments /assets/ liabilities 1,626 332
Total 22,819 20,859(Amounts in € thousand)

Notes to the Accounts
- 87 -
Section 15 - Other assets - Item 150
15.1 Other assets: breakdown
Total 06.30.2014 Total 12.31.2013
Items in transit not allocated to relevant accounts 2 13Items in processing: - notes, cheques and other documents 16,327 9,108 - POS and ATM cards 280 379 - other items in processing 14 1Current receivables not relatedto the provision of financial services 2,055 1,707Definitive items not recognised under other items: - securities and coupons to be settled 8,680 8,283 - fees to be charged to customers 22,247 33,020 - amounts to be settled via clearing houses - 908 - other transactions 28,645 20,281Tax items other than those recognised under item 140: - tax advances 113,829 151,540 - tax credit 9,392 9,356 - tax advances on employee severance indemnities - 12Receivables due to disputed items not deriving from lending 119 119Prepayments 16,376 10,940Improvement and incremental expenses incurred on leasehold assets 9,899 10,962
Total 227,865 256,629(Amounts in € thousand)
LIABILITIES
Section 1 - Deposits from banks - Item 10
1.1 Deposits from banks: breakdown by category
Type of transaction/Amount Total 06.30.2014 Total 12.31.2013
1. Deposits from central banks - -2. Deposits from banks 1,026,852 1,648,6752.1 Current accounts and demand deposits 23,201 29,1392.2 Time deposits - -2.3 Loans 1,002,633 1,619,295 2.3.1 Repos 1,002,633 1,619,295 2.3.2 Other - -2.4 Liabilities in respect of commitments to repurchase treasury shares - -2.5 Other liabilities 1,018 241
Total 1,026,852 1,648,675Fair value - level 1 - -Fair value - level 2 - 1,648,675Fair value - level 3 1,026,852 -Total fair value 1,026,852 1,648,675(Amounts in € thousand)

Notes to the Accounts
- 88 -
Section 2 - Deposits from customers - Item 20
2.1 Deposits from customers: breakdown by category
Type of transaction/Amount Total 06.30.2014 Total 12.31.2013
1. Current accounts and demand deposits 11,856,287 10,666,3632. Time deposits 1,674,202 1,699,6353. Loans 312,207 304,380 3.1 Repos 312,207 304,380 3.2 Other - -4. Liabilities in respect of commitments to repurchase treasury shares - -5. Other liabilities 68,528 61,931
Total 13,911,224 12,732,309Fair value - level 1 - -Fair value - level 2 223,591 12,739,102Fair value - level 3 13,688,945 -Total fair value 13,912,536 12,739,102(Amounts in € thousand)
Section 3 - Debt securities in issue - Item 30
3.1. Debt securities in issue: breakdown by category
Type of transaction/AmountLevel 1 Level 2 Level 3 Level 1 Level 2 Level 3
A. Securities1. Bonds 421,965 - 439,399 - 2,322,511 - 2,422,470 - 1.1 structured - - - - - - - - 1.2 other 421,965 - 439,399 - 2,322,511 - 2,422,470 -2. Other securities - - - - - - - - 2.1 structured - - - - - - - - 2.2 other - - - - - - - -
Total 421,965 - 439,399 - 2,322,511 - 2,422,470 -(Amounts in € thousand)
Total 06.30.2014 Total 12.31.2013
Book valueFair value
Book valueFair value
During the first half of 2014, the Bank reimbursed securities in issue for a nominal amount of €1,500,000 thousand
(repurchased in previous years); it also partially repurchased bonds issued for a total nominal amount of €1,850,000
thousand and USD 70,000.
The mentioned bonds had been issued at par in 2011 and had been fully underwritten by UniCredit, while the Bank
had underwritten bonds issued by UniCredit, following the need for both the Bank and UniCredit to hold bonds in the
portfolio useful for their activity. As described above, by underwriting other bonds issued by UniCredit as part of the
liquidity investment policy defined as of April 1, 2014 and following the gradual reduction in repo transactions with
customers that had led the Bank and UniCredit to reciprocally underwrite and issue such bonds, both parties were
able to sell part of the securities held in the portfolio and to repurchase the securities in issue.
3.2 Breakdown of item 30 "Debt securities in issue": subordinated securities
No data to report.

Notes to the Accounts
- 89 -
Section 4 - Financial liabilities held for trading - Item 40
4.1 Financial liabilities held for trading: breakdown by category
Type of transaction/AmountL1 L2 L3 L1 L2 L3
A. On-balance sheet liabilities1. Deposits from banks - - - - - - - - - -2. Deposits from customers 3,815 521 - - 521 633 - - - -3. Debt securities - - - - X - - - - X 3.1 Bonds - - - - X - - - - X 3.1.1 Structured - - - - X - - - - X 3.1.2 Other bonds - - - - X - - - - X 3.2 Other securities - - - - X - - - - X 3.2.1 Structured - - - - X - - - - X 3.2.2 Other - - - - X - - - - X
Total A 3,815 521 - - 521 633 - - - -B. Derivative instruments1. Financial derivatives X 3,239 1,107 - X X 1,709 592 - X 1.1 Trading derivatives X 3,239 1,107 - X X 1,709 592 - X 1.2 Related to fair value option X - - - X X - - - X 1.3 Other X - - - X X - - - X2. Credit derivatives X - - - X X - - - X 2.1 Trading derivatives X - - - X X - - - X 2.2 Related to fair value option X - - - X X - - - X 2.3 Other X - - - X X - - - X
Total B X 3,239 1,107 - X X 1,709 592 - XTotal (A+B) X 3,760 1,107 - X X 1,709 592 - X(Amounts in € thousand)
NA FV*
Total 06.30.2014 Total 12.31.2013FV
NAFV
FV*
Key
FV = fair value
FV* = Fair value calculated excluding the changes in value due to the change in the issuer's credit rating since the
issue date
NA = Nominal or Notional amount
L1 = Level 1
L2 = Level 2
L3 = Level 3
Trading financial derivatives refer to the negative valuation of Forex Contracts for Difference (CFDs), CFDs on indices
and related Futures on indices used to hedge CFDs. They amounted to €1,086 thousand (€572 thousand as at
December 31, 2013).
Sub-item B.1.1 Derivative instruments - Trading financial derivatives includes the negative valuations of spot contracts
for securities classified in the HFT portfolio and currencies to be settled in times established by market practices
(“regular way”). They amounted to €3,259 thousand (€1,730 thousand as at December 31, 2013).

Notes to the Accounts
- 90 -
Section 6 - Hedging derivatives - Item 60
6.1 Hedging derivatives: breakdown by type of hedge and by hierarchical level
Item/Amount NA NAL1 L2 L3 06.30.2014 L1 L2 L3 12.31.2013
A. Financial derivatives - 38,579 - 2,795,936 - 141,801 - 3,382,879 1) Fair value - 38,579 - 2,795,936 - 141,801 - 3,382,879 2) Cash flows - - - - - - - - 3) Net investment in foreign subsidiaries - - - - - - - -B. Credit derivatives - - - - - - - - 1) Fair value - - - - - - - - 2) Cash flows - - - - - - - -
Total - 38,579 - 2,795,936 - 141,801 - 3,382,879(Amounts in € thousand)
Fair value 06.30.2014 Fair value 12.31.2013
Key:
NA = Nominal or Notional amount
L1 = Level 1
L2 = Level 2
L3 = Level 3
Section 7 – Changes in fair value of portfolio hedged items - Item 70
7.1 - Adjustments to the value of hedged financial liabilities
Total 06.30.2014 Total 12.31.2013
1. Positive changes to financial liabilities 10,875 81,0772. Negative changes to financial liabilities (494) (44,304)
Total 10,381 36,773(Amounts in € thousand)
Changes to hedged financial liabilities/Amounts

Notes to the Accounts
- 91 -
Section 10 – Other liabilities – Item 100
10.1 Other liabilities: breakdown
Total 06.30.2014 Total 12.31.2013
Accrued expenses other than those to be capitalisedfor the financial liabilities concerned 176 183Other liabilities relative to employees 12,631 15,229Other liabilities relative to other personnel 40 -Other liabilities due to Directors and Statutory Auditors 265 244Sums available to be paid to customers 121 181Items in processing: - incoming bank transfers 4,145 2,819 - outgoing bank transfers 60,222 44,326 - POS and ATM cards 462 - - other items in processing 4,507 253Current payables not relatedto the provision of financial services 35,625 27,400Definitive items not recognised under other items: - securities and coupons to be settled 24,682 12,417 - other items 38,065 21,979Adjustments for illiquid portfolio items 14,827 13,847Tax items other than those included in item 80: - sums withheld from third parties as withholding agent 22,349 26,157 - other 37,425 57,697Prepayments 257 276Social security contributions to be paid 4,299 4,853
Total 260,098 227,861(Amounts in € thousand)
Section 11 – Allocation to employee severance pay provision – Item 110
The balance of item “Allocation to employee severance pay provision” at June 30, 2014 amounted to €4,149 thousand
(€3,761 thousand at December 31, 2013).
The following table shows the main actuarial assumptions used to measure the liability.
Description of the main actuarial assumptions 06.30.2014 12.31.2013
Discount rate 2.60% 3.30%Expected inflation rate 1.60% 1.80%
Section 12 - Provisions for risks and charges - Item 120
12.1 - Provisions for risks and charges: breakdown
Item/Amount Total 06.30.2014 Total 12.31.2013
1. Pensions and other post-retirement benefit obligations - -2. Other provisions for risks and charges 110,507 109,354 2.1 legal disputes 51,319 55,577 2.2 staff expenses 2,329 - 2.3 other 56,859 53,777
Total 110,507 109,354(Amounts in € thousand)

Notes to the Accounts
- 92 -
Sub-item 2.2 “staff expenses” includes provisions made in relation to the variable remuneration to be paid to
employees in subsequent years which have an uncertain due date and/or amount. The related income component is
recognized as "Payroll costs".
Other provisions for risks and charges under sub-item 2.3 include the agents’ supplementary indemnity provision
amounting to €35,864 thousand compared with €32,178 thousand as at December 31, 2013.
Total 06.30.2014 Total 12.31.2013
Legal disputes 51,319 55,578- Legal actions underway 38,043 40,573- Claims 13,276 15,005
Staff expenses 2,329 -
Other 56,859 53,776- Supplementary customer indemnity provision 35,864 32,178- Contractual payments and payments under non-competition agreements 1,986 1,916- Tax disputes 7,299 7,439- Other provisions 11,710 12,243
Total provisions for risks and charges - other provisions 110,507 109,354(Amounts in € thousand)
Provisions for risks and charges 12.31.2013 Uses Transfers Other changes* Provisions 06.30.2014H1 2014 H1 2014
Legal disputes- Legal actions underway 40,573 (2,608) 417 - (339) 38,043- Claims 15,005 (2,712) (417) - 1,400 13,276
Staff expenses - - 565 - 1,764 2,329
Other- Supplementary customer indemnity provision 32,178 (705) - 2,535 1,856 35,864- Contractual payments and payments under non-competition agreements 1,916 - - 32 38 1,986- Tax disputes 7,439 (140) - - - 7,299- Other provisions 12,243 (1,205) - - 672 11,710Total provisions for risks and charges 109,354 (7,370) 565 2,567 5,391 110,507(Amounts in € thousand)
* The item "Other changes" refers to the Actuarial gains (losses) recognised in the item "Revaluation reserve" in implementation of IAS 19R.
The following table shows the main actuarial assumptions used to measure the liability for the Agents’ supplementary
indemnity provision.
Description of the main actuarial assumptions 06.30.2014 12.31.2013
Discount rate 2.60% 3.30%Wage increase rate 3.00% 3.00%

Notes to the Accounts
- 93 -
Section 14 - Bank's shareholders' equity - Items 130, 150, 160, 170, 180, 190 and 200
14.1 "Share capital" and "Treasury shares": breakdown
Share capital amounts to €200,070,430.89, fully paid-up, comprising 606,274,033 ordinary shares with a par value of
€0.33.
The Bank does not hold, and did not hold during the period ended June 30, 2014, any treasury shares in the portfolio.
Item/Amount Total 06.30.2014 Total 12.31.2013
1. Share capital 200,070 200,0702. Share premium reserve 1,934 1,9343. Reserves - Legal reserve 33,061 28,800 - Extraordinary reserve 157,692 98,744 - Other reserves 171 1714. (Treasury shares) - -5. Revaluation reserves 4,912 4,2146. Equity instruments - -7. Net Profit (Loss) for the year 73,862 85,216
Total 471,702 419,149(Amounts in € thousand)
Following the Shareholders' Meeting resolution of April 15, 2014, the 2013 profit for the year of €85,216 thousand was
allocated as follows:
€4,261 thousand to the legal reserve;
€58,948 thousand to the extraordinary reserve;
€20,007 thousand, equal to €0.033 per share, to the shareholder;
€2,000 thousand as charitable donations.

Notes to the Accounts
- 94 -
14.2 Share capital - Number of shares: annual changes
Items/typeOrdinary Other
A. Shares outstanding at the beginning of the year - fully paid 606,274,033 - - not fully paid - -A.1 Treasury shares (-) - -A.2 Shares outstanding: opening balance 606,274,033 -B. IncreasesB.1 New issues - against payment: - business combinations - - - bonds converted - - - warrants exercised - - - other - - - free - to employees - - - to directors - - - other - -B.2 Sale of treasury shares - -B.3 Other changes - -C. DecreasesC.1 Cancellation - -C.2 Purchase of treasury shares - -C.3 Business transfers - -C.4 Other changes - -D. Shares outstanding: closing balance 606,274,033 -D.1 Treasury shares (+) -D.2 Shares outstanding as at the end of the year - - - fully paid 606,274,033 - - not fully paid - -
Total 06.30.2014
14.3 Share capital: other information
The shares are not subject to any right, privilege or constraint; there are no shares reserved for issue under option and
sales contracts.
14.4 Reserves of profit: other information
Reserves consist of the legal reserve, amounting to €33,061 thousand, the extraordinary reserve, amounting to
€157,692 thousand and retained earnings, for an amount of €171 thousand.

Notes to the Accounts
- 95 -
Section 15 - Other information
1 Guarantees given and commitments
Transactions Total 06.30.2014 Total 12.31.2013
1) Financial guarantees given 306,833 306,815 a) Banks 306,033 306,033 b) Customers 800 7822) Commercial guarantees given 4 4 a) Banks 4 4 b) Customers - -3) Irrevocable commitments to lend funds 278,954 178,000 a) Banks 815 28,028 i) certain to be called on 815 28,028 ii) not certain to be called on - - b) Customers 278,139 149,972 i) certain to be called on 278,139 149,972 ii) not certain to be called on - -4) Commitments underlying credit derivatives: protection sales - -5) Assets given as collateral for third-party obligations - -6) Other commitments - -Total 585,791 484,819(Amounts in € thousand)
Financial guarantees given to banks include 5 guarantees issued on request of UniCredit, with indefinite duration, for a
total amount of €256,065 thousand, the guarantee requested for UniCredit for transactions on foreign markets, for
€10,000 thousand, and the commitment with the National Interbank Deposit Guarantee Fund (FITD), for €39,968
thousand.
Irrevocable commitments to lend funds mainly refer to spot contracts for the purchase and sale of securities to be
settled in times established by market practices (“regular way”).
2. Assets given as collateral for own liabilities and commitments
Portfolios Total 06.30.2014 Total 12.31.2013
1. Financial assets held for trading - -2. Financial assets designated at fair value through profit or loss - -3. Available-for-sale financial assets - -4. Held-to-maturity investments - -5. Loans and receivables with banks 225,586 188,9896. Loans and receivables with customers - -7. Property, plant and equipment - -
Total 225,586 188,989(Amounts in € thousand)
Assets given as collateral for own liabilities and commitments shown in item “Loans and receivables with banks” refer
to bonds issued by UniCredit, classified in the “Loans and Receivables” category, subscribed by the Bank in order to
conduct repos with the obligation for the buyer to resell the assets covered by the transaction upon expiration of said
transaction; bonds are given as collateral for the entire duration of the repos.

Notes to the Accounts
- 96 -
FinecoBank also used debt securities issued by governments as collateral for bankers' drafts or as guarantee with
third parties in relation to transactions on foreign markets: more specifically, the Bank used bonds issued by the Italian
and French governments, classified as Available-for-sale assets, for a book value of €91,601 thousand (€89,910
thousand as at December 31, 2013). Securities are used as collateral until the Bank decides to stop the transactions
for which the collateral or guarantees are granted.
3. Information on operating leases
With regard to outstanding non-cancellable leases, the future payments amount to:
- €3,822 thousand up to twelve months;
- €1,289 thousand from one to five years.
There are no sub-leases in place.
4. Securities lending transactions
FinecoBank conducts securities lending transactions on a continuous and systematic basis, with the objective of
optimizing the returns of customer portfolios, satisfying the requests of institutional counterparties and obtaining a
profit for the Bank. FinecoBank operates as the borrower, borrowing the securities of its customers and using them in
repos and securities lending transactions guaranteed by cash amounts with retail and institutional customers
interested in the temporary ownership of the securities. In the case of securities lending transactions guaranteed by
other securities, which are not recognized as liabilities or commitments in the accounts, FinecoBank has used bond
issues of UniCredit, classified as “Loans and Receivables”, as guarantees; for this purpose, the Bank has deposited
debt securities issued by UniCredit in a dedicated portfolio held at the Custodian bank, representing an amount higher
than that of the securities borrowed from customers, in order to provide a collective guarantee.
The nominal value of the underlying securities not recognized as assets in the accounts totalled €971,520 thousand,
broken down as follows:
Securities received on loan from: Sold Sold in repos Other purposes
Banks - - -Financial companies - 3,692 -Insurance - - -Non-financial companies - 8,880 -Other entities 3,815 948,751 6,382Total nominal value 3,815 961,323 6,382(Amounts in € thousand)
Type of securities (nominal value at 06.30.2014)
Securities received on loan from: Sold Sold in repos Other purposes
Banks - - -Financial companies - 4,002 -Insurance - - -Non-financial companies - 9,597 -Other entities 521 1,085,180 7,918Total nominal value 521 1,098,779 7,918(Amounts in € thousand)
Type of securities (fair value at 06.30.2014)

Notes to the Accounts
- 97 -
PART C - INCOME STATEMENT
SECTION 1 - INTEREST INCOME AND EXPENSE - Items 10 and 20
1.1 Interest income and similar revenues: breakdown
Items/Type Debt securities Loans Other transactions Total Total06.30.2014 06.30.2013
1. Financial assets held for trading 1 - - 1 52. Available-for-sale financial assets 4,918 - - 4,918 9033. Held-to-maturity investments - - - - -4. Loans and receivables with banks 48,334 77,847 - 126,181 151,0745. Loans and receivables with customers - 14,533 - 14,533 12,9546. Financial assets designated at fair value through profit and loss 5 - - 5 697. Hedging derivatives - - 4,084 4,084 3,9188. Other assets - - - - 1Total interest income 53,258 92,380 4,084 149,722 168,924(Amounts in € thousand)
Interest accrued on impaired assets, relating exclusively to the item Loans and receivables with customers, amounted
to €173 thousand (€202 thousand as at June 30, 2013).
1.4 Interest expenses and similar charges: breakdown
Items/Type Payables Securities Other transactions Total Total06.30.2014 06.30.2013
1. Deposits from central banks - - - - -2. Deposits from banks (3,499) - - (3,499) (6,188)3. Deposits from customers (30,282) - - (30,282) (46,894)4. Debt securities in issue - - - - (19,936)5. Financial liabilities held for trading - - - - -6. Financial liabilities at fair value through profit and loss - - - - -7. Other liabilities and provisions - - (1) (1) (1)8. Hedging derivatives - - - - -
Total (33,781) - (1) (33,782) (73,019)(Amounts in € thousand)

Notes to the Accounts
- 98 -
SECTION 2 - FEE AND COMMISSION INCOME AND EXPENSE - Items 40 and 50
2.1 Fee and commission income: breakdown
Type of service/Amount Total 06.30.2014 Total 06.30.2013
(a) guarantees given 30 29(b) credit derivatives - -(c) management, brokerage and consulting services: 181,290 162,571 1. securities trading 40,852 37,476 2. currency trading - - 3. portfolio management - - 3.1. individual - - 3.2. collective - - 4. custody and administration of securities 150 106 5. custodian bank - - 6. placement of securities 113,007 103,512 of which commissions for maintenance of UCI placement 99,205 86,036 7. reception and transmission of orders 6,788 4,670 8. advisory services 7,507 5,004 8.1. related to investments 7,507 5,004 8.2. related to financial structure - - 9. distribution of third-party services: 12,986 11,803 9.1. portfolio management 840 1,658 9.1.1 individual 75 1,093 9.1.2 collective 765 565 9.2. insurance products 12,143 10,135 9.3. other products 3 10(d) collection and payment services 13,483 12,075(e) securitisation servicing - -(f ) factoring - -(g) tax collection services - -(h) management of multilateral trading systems - -(i) management of current accounts 2,693 3,161(j) other services 2,288 2,116Total 199,784 179,952(Amounts in € thousand)
2.3 Fee and commission expense: breakdown
Service/Amount Total 06.30.2014 Total 06.30.2013
(a) guarantees received (15) (15)(b) credit derivatives - -(c) management and brokerage services: (93,345) (88,485) 1. securities trading (3,839) (3,303) 2. currency trading (102) (192) 3. portfolio management - - 3.1 own - - 3.2 delegated to third parties - - 4. custody and administration of securities (2,024) (1,978) 5. placement of financial instruments - - 6. cold-calling to offer securities, products and services (87,380) (83,012)(d) collection and payment services (8,100) (7,555)(e) other services (149) (159)(f) securities lending transactions (1,146) (1,933)Total (102,755) (98,147)(Amounts in € thousand)

Notes to the Accounts
- 99 -
SECTION 4 – Gains (losses) on financial assets and liabilities held for trading – Item 80
4.1 Gains (losses) on financial assets and liabilities held for trading: breakdown
As at June 30, 2014
Transaction/Income item Unrealised gains Realised Unrealised losses Realised Net profit or loss(A) profits (B) (C) losses (D) [(A+B)-(C+D)]
1. Financial assets held for trading 4 30,514 (227) (28,318) 1,973 1.1 Debt securities 1 21 - (7) 15 1.2 Equity instruments 3 30,491 (227) (28,296) 1,971 1.3 Units in investment funds - 2 - (15) (13) 1.4 Loans - - - - - 1.5 Other - - - - -2. Financial liabilities held for trading 18 - - - 18 2.1 Debt securities - - - - - 2.2 Payables - - - - - 2.3 Other 18 - - - 183. Other financial assets and liabilities: exchange differences X X X X 1,8774. Derivatives 3,857 9,719 (3,419) (5,659) 8,999 4.1 Financial derivatives: 3,857 9,719 (3,419) (5,659) 8,999 - On debt securities and interest rates 18 142 (12) (66) 82 - On equity securities and share indices 3,839 9,394 (3,407) (5,526) 4,300 - On currency and gold X X X X 4,501 - Other - 183 - (67) 116 4.2 Credit derivatives - - - - -Total 3,879 40,233 (3,646) (33,977) 12,867(Amounts in € thousand)
As at June 30, 2013
Transaction/Income item Unrealised gains Realised Unrealised losses Realised Net profit or loss(A) profits (B) (C) losses (D) [(A+B)-(C+D)]
1. Financial assets held for trading 10 51,484 (25) (39,843) 11,626 1.1 Debt securities 8 105 (7) (9) 97 1.2 Equity instruments 2 44,495 (18) (39,834) 4,645 1.3 Units in investment funds - - - - - 1.4 Loans - - - - - 1.5 Other - 6,884 - - 6,8842. Financial liabilities held for trading 53 - (4) (1) 48 2.1 Debt securities - - - - - 2.2 Payables - - - - - 2.3 Other 53 - (4) (1) 483. Other financial assets and liabilities: exchange differences X X X X 1,3084. Derivatives 3,592 3,807 (3,395) (2,108) 2,542 4.1 Financial derivatives: 3,592 3,807 (3,395) (2,108) 2,542 - On debt securities and interest rates 16 - (29) - (13) - On equity securities and share indices 3,576 3,791 (3,366) (2,100) 1,901 - On currency and gold X X X X 646 - Other - 16 - (8) 8 4.2 Credit derivatives - - - - -Total 3,655 55,291 (3,424) (41,952) 15,524(Amounts in € thousand)

Notes to the Accounts
- 100 -
SECTION 5 – Fair value adjustments in hedge accounting – Item 90
5.1 Fair value adjustments in hedge accounting: breakdown
Income item/Amount Total 06.30.2014 Total 06.30.2013
A. Gains on:A.1 Fair value hedging instruments 179,635 77,916A.2 Hedged asset items (in fair value hedge relationship) 24,728 84,872A.3 Hedged liability items (in fair value hedge relationship) 40,795 -A.4 Cash-flow hedging derivatives - -A.5 Assets and liabilities denominated in currency - -Total gains on hedging activities (A) 245,158 162,788B. Losses on:B.1 Fair value hedging instruments (186,794) (84,872)B.2 Hedged asset items (in fair value hedge relationship) (45,791) (570)B.3 Hedged liability items (in fair value hedge relationship) (12,573) (77,346)B.4 Cash-flow hedging derivatives - -B.5 Assets and liabilities denominated in currency - -Total losses on hedging activities (B) (245,158) (162,788)C. Fair value adjustments in hedge accounting (A-B) - -(Amounts in € thousand)
SECTION 6 – Gains (Losses) on disposals/repurchases – Item 100
6.1 Gains (Losses) on disposals/repurchases: breakdown
Profit LossNet profit
(loss)Profit Loss
Net profit (loss)
Financial assets1. Loans and receivables with banks 78,805 (29,646) 49,159 - - -2. Loans and receivables with customers - - - - - -3. Available-for-sale financial assets 3.1 Debt securities - - - - - - 3.2 Equity instruments - - - - - - 3.3 Units in investment funds - - - - - - 3.4 Loans - - - - - -4. Held-to-maturity investments - - - - - -Total assets 78,805 (29,646) 49,159 - - -Financial liabilities1. Deposits from banks - - - - - -2. Deposits from customers - - - - - -3. Debt securities in issue 29,408 (78,571) (49,163) - - -Total liabilities 29,408 (78,571) (49,163) - - -(Amounts in € thousand)
Total 06.30.2014 Total 06.30.2013Item/Income item
Net gains and losses on disposals and repurchases, amounting to €-4 thousand, refer to securities issued by the Bank
and classified in the "Loans and Receivables" portfolio, which were sold to UniCredit, and securities issued by the
Bank and underwritten by UniCredit, which were repurchased by the Bank; these transactions are described in Section
6 - Loans and receivables with banks - Item 60 and in Section 3 - Debt securities in issue - Item 30.

Notes to the Accounts
- 101 -
SECTION 7 – Gains (losses) on financial assets and liabilities measured at fair value – Item 110
7.1 Gain (losses) on financial assets and liabilities measured at fair value through profit and loss: breakdown
As at June 30, 2014
Transaction/Income item Unrealised gains Realised Unrealised losses Realised Net profit or loss(A) profits (B) (C) losses (D) [(A+B)-(C+D)]
1. Financial assets - 19 - (1) 18 1.1 Debt securities - 19 - (1) 18 1.2 Equity instruments - - - - - 1.3 Units in investment funds - - - - - 1.4 Loans - - - - -2. Financial liabilities - - - - - 2.1 Debt securities - - - - - 2.2 Deposits from banks - - - - - 2.3 Deposits from customers - - - - -3. Other financial assets and liabilities: exchange differences X X X X -4. Credit and financial derivatives - - - - -Total - 19 - (1) 18(Amounts in € thousand)
As at June 30, 2013
Transaction/Income item Unrealised gains Realised Unrealised losses Realised Net profit or loss(A) profits (B) (C) losses (D) [(A+B)-(C+D)]
1. Financial assets 83 379 - (178) 284 1.1 Debt securities 83 379 - (178) 284 1.2 Equity instruments - - - - - 1.3 Units in investment funds - - - - - 1.4 Loans - - - - -2. Financial liabilities - - - - - 2.1 Debt securities - - - - - 2.2 Deposits from banks - - - - - 2.3 Deposits from customers - - - - -3. Other financial assets and liabilities: exchange differences X X X X -4. Credit and financial derivatives - - - - -Total 83 379 - (178) 284(Amounts in € thousand)
SECTION 8 – Impairment losses - Item 130
8.1 Impairment losses on loans and receivables: breakdown
Transaction/Income itemWrite-offs Other A B A B
A. Loans and receivables with banks - - - - - - - - - - Loans - - - - - - - - - - Debt securities - - - - - - - - -B. Loans and receivables with customers (24) (2,488) (371) 132 868 - 552 (1,331) (1,355) Impaired related to purchase agreements - - - - - - - - Loans - - X - - - X - - - Debt securities - - X - - - X - - Other loans (24) (2,488) (371) 132 868 - 552 (1,331) (1,355) - Loans (24) (2,488) (371) 132 868 - 552 (1,331) (1,355) - Debt securities - - - - - - - - -C. Total (24) (2,488) (371) 132 868 - 552 (1,331) (1,355)(Amounts in € thousand)
Total 06.30.2013
Impairments (1) Write-backs (2)Total
06.30.2014Micro
MacroMicro Macro

Notes to the Accounts
- 102 -
Key
A = From interest B = Other write-backs
In the period there were no impairment losses on Available-for-sale financial assets.
8.4 Impairment losses on other financial transactions: breakdown
Transaction/Income itemWrite-offs Other A B A B
A. Guarantees given - - - - - - - - -B. Credit derivatives - - - - - - - - -C. Commitments to disburse funds - - - - - - - - -D. Other transactions - - - - 40 - - 40 -E. Total - - - - 40 - - 40 -(Amounts in € thousand)
Impairments (1) Write-backs (2)Total
06.30.2014Total
06.30.2013Micro
MacroMicro Macro
Key
A = From interest B = Other write-backs
SECTION 9 – Administrative costs – Item 150
9.1 Payroll costs: breakdown
Type of expense/Amount Total 06.30.2014 Total 06.30.2013
1) Employees (30,886) (29,889) a) wages and salaries (21,481) (20,443) b) social security contributions (5,790) (5,659) c) employee severance fund (390) (387) d) pension costs - - e) allocation to employee severance pay provision (67) (71) f) provision for retirements and similar provisions - defined contribution - - - defined benefit - - g) payments to external pension funds - defined contribution (1,237) (1,175) - defined benefit - - h) costs related to share-based payments (386) (571) i) other employee benefits (1,535) (1,583)2) Other staff (51) (55)3) Directors and statutory auditors (456) (423)4) Early retirement costs - -5) Recovery of expenses for employees seconded to other companies 54 406) Recovery of expenses for employees seconded to the company (496) (663)Total (31,835) (30,990)(Amounts in € thousand)
Sub-item h) “costs related to share-based payments”, includes costs recognized in the income statement in relation to
share-based payments of the Parent Company UniCredit.

Notes to the Accounts
- 103 -
9.3 Pensions and other post-retirement defined-benefit obligations costs and revenues
No data to report.
9.5 Other administrative expenses: breakdown
Total 06.30.2014 Total 06.30.2013
1) INDIRECT TAXES AND DUTIES (38,502) (28,955)2) MISCELLANEOUS COSTS AND EXPENSESA) Advertising expenses - Marketing and communication (11,977) (15,075)Mass media campaigns (9,283) (11,921)Marketing and promotions (2,617) (3,089)Sponsorships (58) (44)Conventions and internal communications (19) (21)B) Expenses related to credit risk (598) (544)Credit recovery expenses (369) (338)Commercial information and company searches (229) (206)C) Expenses related to personnel (9,155) (6,061)Personnel training (259) (203)Car rental and other payroll costs (22) (26)Personal financial advisor expenses (8,532) (5,556)Travel expenses (311) (229)Premises rentals for personnel (31) (47)D) ICT expenses (13,741) (14,466)Lease of ICT equipment and software (2,157) (2,544)Software expenses: lease and maintenance (3,001) (2,905)ICT communication systems (1,592) (1,754)ICT services: external personnel/outsourced services (3,327) (3,521)Financial information providers (3,664) (3,742)E) Consulting and professional services (5,086) (1,501)Consultancy for ordinary operations (408) (281)Consultancy for strategy, business development andorganisational optimisation (2,125) -Legal expenses (1,315) (3)Legal disputes (1,238) (1,217)F) Real estate expenses (10,535) (10,564)Real estate services (343) (343)Repair and maintenance of furniture, machinery, and equipment (125) (121)Maintenance of premises (528) (510)Premises rentals (8,455) (8,035)Cleaning of premises (265) (239)Utilities (819) (1,316)G) Other functioning costs (17,397) (15,441)Surveillance and security services (185) (200)Postage and transport of documents (1,250) (1,388)Administrative and logistic services (7,409) (6,727)Insurance (1,816) (1,929)Printing and stationery (292) (278)Association dues and fees (5,642) (4,552)Other administrative expenses (803) (367)Total (106,991) (92,607)(Amounts in € thousand)
Charges related to the listing project, amounting to €5.2 million, were mainly included in items “Legal expenses”,
“Consultancy for strategy, business development and organizational optimization”, “Association duties and fees” and
“Advertising expenses – Marketing and communication”.

Notes to the Accounts
- 104 -
SECTION 10 – Net provision for risks and charges – Item 160
10.1 Net provision for risks and charges: breakdown
Provisions Reallocations Total Provisions Reallocations TotalLegal disputes (7,770) 6,710 (1,060) (8,389) 7,611 (778)Supplementary customer indemnity provision (1,856) - (1,856) (1,515) - (1,515)Other provisions for risks and charges (38) 3 (35) (1,046) 2,980 1,934Total (9,664) 6,713 (2,951) (10,950) 10,591 (359)(Amounts in € thousand)
Total 06.30.2014 Total 06.30.2013
SECTION 11 – Impairments/write-backs on property, plant and equipment – Item 170
11.1 Impairment/write-backs on property, plant and equipment: breakdown
Asset/Income item Depreciation Write-downs Write-backs Net gain (loss) Net gain (loss)(a) for impairment (b) (c) 06.30.2014 (a+b-c) 06.30.2013
A. Property, plant and equipment A.1 Owned (1,594) (13) - (1,607) (1,175) - Used in the business (1,538) (13) - (1,551) (1,119) - Held for investment (56) - - (56) (56) A.2 Finance lease - - - - - Used in the business - - - - - - Held for investment - - - - -Total (1,594) (13) - (1,607) (1,175)(Amounts in € thousand)
SECTION 12 – Impairments/write-backs on intangible assets – Item 180
12.1 Impairments on intangible assets: breakdown
Asset/Income item Depreciation Write-downs Write-backs Net gain (loss) Net gain (loss)(a) for impairment (b) (c) 06.30.2014 (a+b-c) 06.30.2013
A. Intangible assets A.1 Owned (2,335) - - (2,335) (2,316) - Generated internally by the Company - - - - - - Other (2,335) - - (2,335) (2,316) A.2 Finance leaseTotal (2,335) - - (2,335) (2,316)(Amounts in € thousand)

Notes to the Accounts
- 105 -
SECTION 13 – Other net operating income – Item 190
13.1 Other operating expenses: breakdown
Type/Amount Total 06.30.2014 Total 06.30.2013
Refunds and allowances (127) (176)Penalties, fines and unfavourable rulings (628) (956)Improvements and incremental expenses incurred on leasehold properties (1,566) (1,355)Improvements and incremental expenses incurred on group properties (6) (7)Exceptional write-downs of assets (409) (465)Other operating expense (446) (96)Total (3,182) (3,055)(Amounts in € thousand)
Exceptional write-downs of assets include costs incurred for credit card fraud of €396 thousand (€433 thousand as at
June 30, 2013).
13.2 Other operating income: breakdown
Type/Amount Total 06.30.2014 Total 06.30.2013
Recovery of costs: 37,542 28,054 - ancillary expenses - other 198 95 - taxes 37,344 27,959 Rental income from real estate investments 115 114 Other income from current year 1,500 2,586 Total 39,157 30,754 (Amounts in € thousand)
SECTION 18 – Tax expense (income) related to profit or loss from continuing operations – Item 260
18.1 Tax expense (income) related to profit or loss from continuing operations: breakdown
Income item/Amount Total 06.30.2014 Total 06.30.2013
1. Current tax (-) (36,839) (30,745)2. Adjustment to current tax of prior years (+/-) (1,900) (2,800)3. Reduction of current tax for the year (+) - -3.bis Reduction of current tax for the year due to tax receivables pursuant to Law 214/2011 (+) - -4. Changes in deferred tax assets (+/-) (1,550) (1,913)5. Changes in deferred tax liabilities (+/-) (667) (689)6. Tax expense for the period (-) (-1+/-2+3+/-4+/-5) (40,956) (36,147)(Amounts in € thousand)

Notes to the Accounts
- 106 -
SECTION 20 – Other information
1.1 Designation of Parent Company
UniCredit S.p.A.
Rome Register of Companies
Registered in the Register of Banking Groups and Parent Company of the UniCredit Banking Group with code 2008.1
1.2 Registered Office of Parent Company
Registered Office: Rome, Via A. Specchi, 16 -
Head Office: Milan, Piazza Cordusio
SECTION 21 - Earnings per share
21.1 Average number of diluted shares
Basic earnings per share are calculated by dividing the net profit of the six month period by the average number of
ordinary shares outstanding (the number of ordinary shares outstanding is the same during all the periods presented).
As at June 30, 2014 there were no transactions in place resulting in a dilutive effect on earnings per share.
06.30.2014 06.30.2013Net profit for the period (€ thousands) 73,862 56,262Average number of outstanding shares 606,274,033 606,274,033Earnings per share (basic and diluted) 0.12 0.09
On April 15, 2014 - in line with best practices and the recommendations of the Corporate Governance Code for listed
companies and in accordance with the remuneration policies in place - the Board of Directors of FinecoBank approved
the adoption of a remuneration scheme aimed at incentivizing, retaining and motivating senior managers, "key people"
(intended as other Managers and Employees of the Bank who, due to the relevance and critical nature of their role as
well as their skills and potential can affect the company’s economic performance and sustainability) and the Financial
Advisors, as described in Part I – Share-based payments.
Shares for the plans referred to in points 1), 2) and 3) of Part I – “Share-based payments” will be issued through free
capital increases in accordance with Article 2349 of the Italian Civil Code. For the resolutions pertaining to the
maximum number of shares that may be assigned under these plans and the related dilutive effect for shareholders
resulting from the free capital increases, please refer to Part A.1 - Section 3 - Subsequent Events of these Notes.

Notes to the Accounts
- 107 -
PART E - INFORMATION ON RISKS AND HEDGING POLICIES
Introduction
In order to ensure lean and efficient management of risks, the risk management process is structured in accordance
with the organizational choices made by the Group and the provisions of the Supervisory Instructions for Banks
pertaining to the internal control system.
Risk management and control is performed by the Risk Management function of FinecoBank in collaboration with the
same function of the Parent Company, which performs its role of guidance, coordination and control of risks at Group
level. The organizational model considers a specific point of reference for Italy through the Chief Risk Officer function
(CRO) of the Parent Company, to which has been assigned the responsibilities related to credit risks, operational risks
and reputational risks of the Italian perimeter, as well as the managerial coordination of Risk Management functions in
the Italian Legal Entities - among which FinecoBank - have been assigned.
FinecoBank is responsible for first and second-level monitoring, especially for verifying that the risk level of individual
companies is compatible with the guidelines set by the Parent Company, individual company equity, and prudential
supervisory rules.
As an aid to the reader, an explanatory glossary of terms used is provided at the end of this section.
Organizational structure
The Board of Directors of FinecoBank (“Board”) is tasked with setting the strategic policies and the guidelines for the
organizational and operational structures, overseeing and monitoring their timely execution within the risk profiles of
assigned. The Board is responsible for promoting a company culture that empowers controls, in compliance with the
indications and principles contained in the Supervisory Instructions, setting and approving strategies for identifying and
evaluating risk, and approving the strategic guidelines and risk management policies. The Board also verifies that the
internal control structure is consistent with the risk tolerance established and approves policies for the management of
risks.
The Managing Director has been assigned specific powers by the Board of Directors in all the Bank’s areas of activity.
These powers are to be exercised in accordance with the applicable regulations and within the limits of the Parent
Company directives and the policies, instructions, limits, risk assumption procedures and using the operational
methods governed by the applicable information notices. The Managing Director puts in place the necessary
measures to ensure the establishment and maintenance of an efficient and effective internal control system.
The CRO Department, in line with the instructions and the guidelines of the Parent Company, is responsible for credit
operations and risk management. The disclosure, at various levels, is provided by the Strategic Bodies and Officers
(Managing Director, Board of Directors, Risk Committee). In relation to the Basel II Pillar 2 instructions, reputational
and business risk and, in collaboration with the CFO, liquidity risk are also monitored and reported.
The CRO and the Chief Financial Officer (CFO) are responsible for proposing and adapting the Group Risk Appetite
Framework to FinecoBank and setting risk management strategies and policies, in line with the Bank’s strategies and
objectives, coordinating and monitoring their implementation by the units responsible, also in the various company
areas.

Notes to the Accounts
- 108 -
The CRO Department ensures the control of the Bank’s overall risk profile monitoring the various types of exposure, in
accordance with the methods established by the Parent Company.
The Risk Management Unit prevents and monitors different components of Bank risks. The function specifically
controls credit, market and operational risks to which the Bank is exposed. The Risk Management function also
monitors business, reputational and liquidity risk. The Risk Management Unit supports the CRO, in the area of
responsibility of the Department, in monitoring and reporting to the Strategic Bodies and Officers.
The corporate governance structure for operational risk involves the establishment of the Risks Committee, which
defines the strategies for the mitigation and assessment of all types of risk, within the directives issued by the Parent
Company, and approves and validates the internal procedures and operating manuals for operational risk.
Lastly, the participation by the Chief Risk Officer and Head of Risk Management in the Products Committee ensures
oversight of the operational risk associated with the Bank's new business activities, as well as creating and
disseminating a risk culture in the various functional areas.
Section 1 – Credit Risk
Qualitative information
1. General aspects
FinecoBank’s objective is to provide an adequate range of products able to satisfy and encourage loyalty among
customers, through a competitive and complete offer. The development of the products and of the product line must
also seek to maintain portfolio quality and, in any event, adequate processes to monitor profitability.
Lending is expanded through the development of new products, or modification of existing ones, as well as through
the protection of market share achieved. The factors that generate credit risk are determined by acceptance and
creditworthiness polices, which are always adequately correlated to the risk/return ratio, and therefore remuneration of
the product.
In line with the Risk Appetite established by the Group, FinecoBank sets the Credit Risk Strategies as an instrument
for credit risk management. The Strategies focus on loans and receivables with customers and are aimed at reducing
cost of risk and rates of default by setting the Target Risk and optimizing the loan portfolio.
The quality of the loan portfolio, which is constantly monitored and supported by risk mitigation instruments, is
protected by scoring models that contribute to evaluation during the approval process, ensuring that it is consistent
and controlled. In addition to adequate coverage of the risk levels, monitoring of the portfolio and its segmentation by
product and seniority allow a better understanding of the best loan issue strategies. The identification of any high-risk
areas permits intervention on the automated measurement systems as well as on disbursement standards, with the
possibility to take measures to limit credit risk in advance.
In the first half of 2014, lending activity continued to focus on granting credit lines, mostly backed by assets, issuing
credit cards with full payment of the balance at term to current account holders, and granting personal loans.

Notes to the Accounts
- 109 -
In the first half of the year, loans to ordinary customers grew due to an increased use of credit lines for the product
"Fido con Mandato a Vendere su Amministrato e Sicav” (Credit line backed by assets under management and
SICAVs, with mandate for selling) introduced in 2013: customers can obtain a credit line in proportion to the amount of
securities they hold. The new offering is designed to meet the liquidity needs of affluent customers to avoid
divestitures.
Choices concerning the investment of the Bank’s liquidity are governed by a prudential approach aimed at containing
credit risk and mainly involve deposits with UniCredit and the subscription of bonds issued by the latter. Please refer to
the following sections for a description of the new liquidity investment policies.
2. Credit Risk Management Policies
2.1 Organizational aspects
The credit process can be broken down into the following stages:
• assessment of creditworthiness
• granting/disbursement of credit
• credit monitoring
• management of impaired loans
• risk measurement and control
The assessment of creditworthiness entails ascertaining the ability of the borrower to repay. It is performed by specific
centralized and specialist operating units in the various product lines disbursed to customers (personal loans, credit
cards, credit lines). On receipt of the request, the offices in question assess the reliability of documentation, evaluate
the equity and income situation, and gather information, also by consulting public records, private banks and system
data such as the information contained in the Bank of Italy’s risk center and in the Group archives.
In addition to an assessment of creditworthiness by the dedicated functions, credit approval also requires that they
assess the compatibility of the request with the customer's overall situation, considering the amount requested and
agreeing on a different amount with the customer, where necessary, evaluate and finalize guarantees, if any, linking
them to credit lines and filing them according to specific processes. Lastly, the decision-making parties approve or
reject the application on the basis of their powers or send the application to a higher decision-making body.
Credit monitoring is carried out on credit lines to check that the economic situation of the Customer and of the
guarantor that resulted in the approval has not changed. This check may entail collecting updated system data and
information, as well as information from private banks. Checks are carried out according to established processes at
set intervals, and may vary according to the amount of the credit line granted.
In line with the general principles laid down by the Regulatory Authority, receivables are classified on the basis of the
level of impairment, which may be established on the basis of qualitative or quantitative criteria.
The management of impaired loans entails taking all action necessary to restore them to normality or to recover the
credits in situations where the relationship cannot be continued. All of these measures are established by specific

Notes to the Accounts
- 110 -
processes based on the type and amount of the past-due loan and the past-due period as well as taking into account
any financial assets of the customer, which may be offered as collateral. Credit collection is performed through
payment reminders directly carried out by FinecoBank as well as through reminders and debt recovery carried out by
specialized, authorized external companies.
Lastly, management also entails forecasting losses on an individual basis, which is continuously updated based on the
progress of recovery actions for the amounts due or based on information collected during the recovery actions.
The measurement and control of credit risk takes place at the assessment stage with the support of scoring tools that
analyse the customers' socio-demographic profiles, making an assessment of individual counterparties on a statistical
basis and supplementing the assessment, on one hand, with the support of credit bureaus for a better knowledge of
public and private data and on the other hand, with information contained in the Bank of Italy's risk center.
Credit risk control is also performed through the systematic assessment of the performance of loan portfolios in order
to estimate expected losses and intervene on disbursement policies where necessary.
2.1.1 Factors that generate Credit Risk
In the course of its credit business activities FinecoBank is exposed to the risk that its loans may, due to the
deterioration of the debtor’s financial condition, not be repaid at maturity, and thus result in a partial or full write-down.
This risk is always inherent in traditional lending operations regardless of the form of the credit facility. The main
reasons for default lie in the borrower’s lack of autonomous ability to ensure the repayment of the debt.
In addition to the granting and disbursement of credit, FinecoBank is also exposed to counterparty risk for all the
activities for all clearing and pre-clearing operations with the institutional and banking counterparties necessary to
conduct the Bank’s business. Counterparty risk is defined as the risk that a counterparty to one of the transactions is in
default prior to the final settlement of the financial flows involved in the transaction. The counterparties in these
transactions could default as a result of insolvency, political and economic events, lack of liquidity, operating problems
or other reasons.
Other transactions involving counterparty risk are:
• entering into derivative contracts;
• purchasing and selling securities, futures, or currencies;
• holding third-party securities.
In addition, “Non-Traditional Credit Risk” is generated by leverage/short transactions conducted through securities
lending. Leverage/short transactions conducted through securities lending, also when there are automatic stop losses
performed within the margins, can generate credit risk if the security lacks liquidity (for example, in the case of
dramatic events that affect the normal functioning of markets) and/or the margin is insufficient. To anticipate such
events, scenario analyses are conducted periodically to assess the impacts and implement appropriate mitigation
policies.

Notes to the Accounts
- 111 -
FinecoBank monitors and manages the specific risk of each counterparty and the overall risk of loan portfolios through
procedures, structures and rules that steer, govern and standardize the assessment and management of credit risk, in
line with the Group principles and best practice, and which are capable of extending their effectiveness to all phases of
the economic cycle.
FinecoBank reports all information to the Parent Company that can help it in its assessment of each FIBS counterparty
(“Financial Institutions, Banks and Sovereigns”) that FinecoBank intends to have dealings with and with respect to
whom a risk limit (ceiling) is to be set within which the Group intends to operate.
The assessment is conducted within the risk limits assigned to the counterparty’s Economic Group, i.e. considering the
Group’s exposure towards all the parties legally and economically linked to the counterparty. At the end of the
assessment, the Parent Company assigns FinecoBank a risk limit that has to be monitored.
2.2 Management, measurement and control system
The measurement of credit risk during the issue process is supported by automated assessment systems (so-called
credit scoring systems). These systems also incorporate all available information and facts: public and private data
provided by Credit rating bureaus, Risk Center data flows or information requests submitted to the Bank of Italy, Group
archives with data relating to positions shared with other Group banks and other performance information on
customers, historicised by FinecoBank. During the loan application process, attention is always focused on the
possibility of optimizing all information concerning customers that has been provided by the Bank, the Group and the
System.
The collection of any guarantees, their assessment and the margins between the fair value of the guarantee and the
amount of the loan granted are a simple kind of support to risk mitigation, but there is no relevant positive correlation
between the value of the financial guarantee and the applicant's creditworthiness.
The collective write-downs of the "performing" loan portfolio are determined using migration rates, through transition
matrices, both from performing loans to non-performing loans and for each classification status (past due, doubtful,
non-performing) by combining the default rates with the expected recovery rates individually calculated for non-
performing loans and taking account of any supporting guarantees.
The global assessment of portfolio risks, in order to identify the sustainability of the asset and the remuneration
margins, is made both with the assistance of a tool shared with the Parent Company (Credit Tableau de Bord), which
contains all the main risk indicators and the largest receivables of those listed, and with the support of specific product
reports that identify the trend of default rates, broken down by disbursement period and default level.
The monitoring of credit risk as part of the management of the trading book is conducted by breaking it down into
rating class and issuer sector, which determine the implicit risk of contracts.

Notes to the Accounts
- 112 -
2.2.1 Credit Risk Strategies
The Group Credit Risk Strategies (GCRS) are one of the advanced instruments for managing credit risk. Consistent
both with the budget process and industry expert views, the GCRS provide a set of guidelines and operative targets on
the loan portfolio evolution (new business), aimed at improving the overall risk-return profile of the portfolio.
Based on the Group’s risk appetite, FinecoBank identifies its own targets related to credit quality and profitability of its
loan portfolio which are then defined in FinecoBank’s risk appetite.
FinecoBank’s Credit Risk Strategies focus on loans and receivables with customers. The objective is therefore to keep
risk/default levels within the limits.
Credit risk strategies are set by using the main credit risk measures established by the Parent Company in order to
correctly and prudentially manage credit portfolio risk.
2.3 Credit risk mitigation techniques
In order to mitigate risk when granting the different types of credit facilities, various types of collateral are obtained:
liens on shares, bonds or investment funds, insurance contracts and government bonds are used to guarantee current
account overdraft facilities, whilst the registration of first mortgages is quite rare.
2.4 Impaired financial assets
Loans are classified as past due, doubtful or non-performing in accordance with the criteria set forth by the Bank of
Italy and the thresholds established by the Parent Company, with methods differing according to product type.
Generally speaking, the classification of problem loans is usually objective, while the classification as non-performing,
linked to the customer's insolvency, is always individual and defined on the basis of the progress of debt recovery
actions.
The loss estimate for classified positions is also individual.
The classification criterion used for overdrawn accounts is related to the performance of debt recovery activity or the
forced sale of securities to cover debts.
The restructuring of loans is only authorized if the amount past due has been paid in full in observance of the original
payment schedule, or if considerable payments have been made leading the Bank to believe the debt exposure is very
likely to be repaid.
The procedure for the management of irregularly performing loans involves actions that may be taken to recover debts
by ranking them by seniority of expiration.

Notes to the Accounts
- 113 -
Quantitative information
A. Credit quality
A.1 Impaired and performing loans: amounts, write-downs, changes, distribution by business activity/region
A.1.1 Breakdown of financial assets by portfolio and credit quality (book value)
Portfolio/quality Non-performing Doubtful loans Restructured Past-due Past-due Other assetsloans loans impaired non-impaired Total
loans loans1. Financial assets held for trading - - - - - 5,238 5,2382. Available-for-sale financial assets - - - - - 1,715,314 1,715,3143. Held-to-maturity investments - - - - - - -4. Loans and receivables with banks - - - - - 13,476,117 13,476,1175. Loans and receivables with customers 3,411 637 - 860 23,954 667,280 696,1426. Financial assets designated at fair value through profit or loss - - - - - - -7. Financial instruments classified as held for sale - - - - - - -8. Hedging derivatives - - - - - 9,926 9,926
Total June 30, 2014 3,411 637 - 860 23,954 15,873,875 15,902,737Total December 31, 2013 3,277 673 - 781 18,662 17,167,763 17,191,156(Amounts in € thousand)
As at June 30, 2014 there were no impaired purchased loans.
A.1.2 Breakdown of credit exposures by portfolio and credit quality (gross and net values)
Portfolio/quality Gross Specific Net Gross Portfolio Netexposure impairment exposure exposure impairment exposure
1. Financial assets held for trading - - - X X 5,238 5,2382. Available-for-sale financial assets - - - 1,715,314 - 1,715,314 1,715,3143. Held-to-maturity investments - - - - - - -4. Loans and receivables with banks - - - 13,476,117 - 13,476,117 13,476,1175. Loans and receivables with customers 21,391 (16,483) 4,908 698,773 (7,539) 691,234 696,1426. Financial assets designated at fair value through profit or loss - - - X X - -7. Financial instruments classified as held for sale - - - - - - -8. Hedging derivatives - - - X X 9,926 9,926
Total June 30, 2014 21,391 (16,483) 4,908 15,890,204 (7,539) 15,897,829 15,902,737Total December 31, 2013 21,174 (16,443) 4,731 17,065,063 (7,722) 17,186,425 17,191,156(Amounts in € thousand)
Impaired assets PerformingTotal
(net exposure)
As at June 30, 2014, there were no performing loans to customers renegotiated under collective agreements and no
impaired purchased loans; no partial write-offs have been made on impaired financial assets.
Breakdown by maturity of net performing loans to customers, amounting to €691,234 thousand (€636,519 thousand as
at December 31, 2013), is as follows:
- not past due of €667,280 thousand (€617,858 thousand as at December 31, 2013);
- not-impaired, past due between 1 day and 90 days of €19,089 thousand (€18,015 thousand as at December 31,
2013);
- not-impaired, past due between 90 days and 180 days of €4,739 thousand (€451 thousand as at December 31,
2013);
- not-impaired, past due between 180 days and 1 year of €122 thousand (€191 thousand as at December 31, 2013);
- not-impaired, past due by more than 1 year of €4 thousand (€5 thousand as at December 31, 2013).
Other performing loans shown in table A.1.2 are all not past due.

Notes to the Accounts
- 114 -
A.1.3 On-balance sheet and off-balance-sheet credit exposures to banks: gross and net values
Type of exposure/Amount Exposure Specific Portfolio Netgross impairments impairments exposure
A. On-balance sheet exposuresa) Non-performing loans - - X -b) Doubtful loans - - X -c) Restructured loans - - X -d) Past-due impaired loans - - X -e) Other assets 13,476,151 X - 13,476,151Total A 13,476,151 - - 13,476,151
B. Off-balance sheet exposuresa) Impaired - - X -b) Other 556,444 X - 556,444Total B 556,444 - - 556,444(Amounts in € thousand)
In the above table, item B. "Off-balance sheet exposures" includes the counterparty risk related to repos that can be
classified as "Securities Financing Transactions" (SFT) defined in prudential regulations, amounting to €237,387
thousand.
There were no securities lending transactions collateralised by other securities or without a cash guarantee with
banks.
A.1.4 On-balance sheet credit exposures to banks: gross change in impaired exposures:
No data to report.
A.1.5 On-balance sheet credit exposures to banks: trend in total write-downs
No data to report.

Notes to the Accounts
- 115 -
A.1.6 On-balance sheet and off-balance-sheet credit exposures to customers: gross and net values
Type of exposure/Amount Exposure Specific Portfolio Netgross impairments impairments exposure
A. On-balance sheet exposuresa) Non-performing loans 17,884 (14,473) X 3,411b) Doubtful loans 1,967 (1,330) X 637c) Restructured loans - - X -d) Past-due impaired loans 1,540 (680) X 860e) Other assets 2,414,097 X (7,539) 2,406,558Total A 2,435,488 (16,483) (7,539) 2,411,466
B. Off-balance sheet exposuresa) Impaired 1 - X 1b) Other 445,723 X - 445,723Total B 445,724 - - 445,724(Amounts in € thousand)
In the above table, item B. "Off-balance sheet exposures" includes the counterparty risk related to securities lending
transactions collateralised by other securities and to repos that can be classified as "Securities Financing
Transactions" (SFT) defined in prudential regulations, amounting to €437,921 thousand.
There were no securities lending transactions without cash guarantees with customers.
A.1.7 On-balance sheet credit exposures to customers: trend of gross impaired exposures:
Source / Categories Non-performing loans Doubtful loans Restructured Past-dueloans loans
A. Opening balance - gross exposure 17,664 2,065 - 1,444 of which: assets sold but not derecognised - - - -B. Increases B.1 inflows from performing loans 22 378 - 3,350 B.2 transfers from other categories - of impaired exposures 1,850 1,791 - - B.3 Other increases 139 220 - 413C. Decreases C.1 outflows to performing loans - (338) - (395) C.2 de-recognitions (1,491) (6) - - C.3 collections (299) (313) - (1,434) C.4 disposals - - - - C.4 bis losses on disposal - - - - C.5 transfers to other categories of impaired exposures - (1,827) - (1,814) C.6 other decreases (1) (3) - (24)D Gross exposure closing balance 17,884 1,967 - 1,540 of which: assets sold but not derecognised - - - -(Amounts in € thousand)
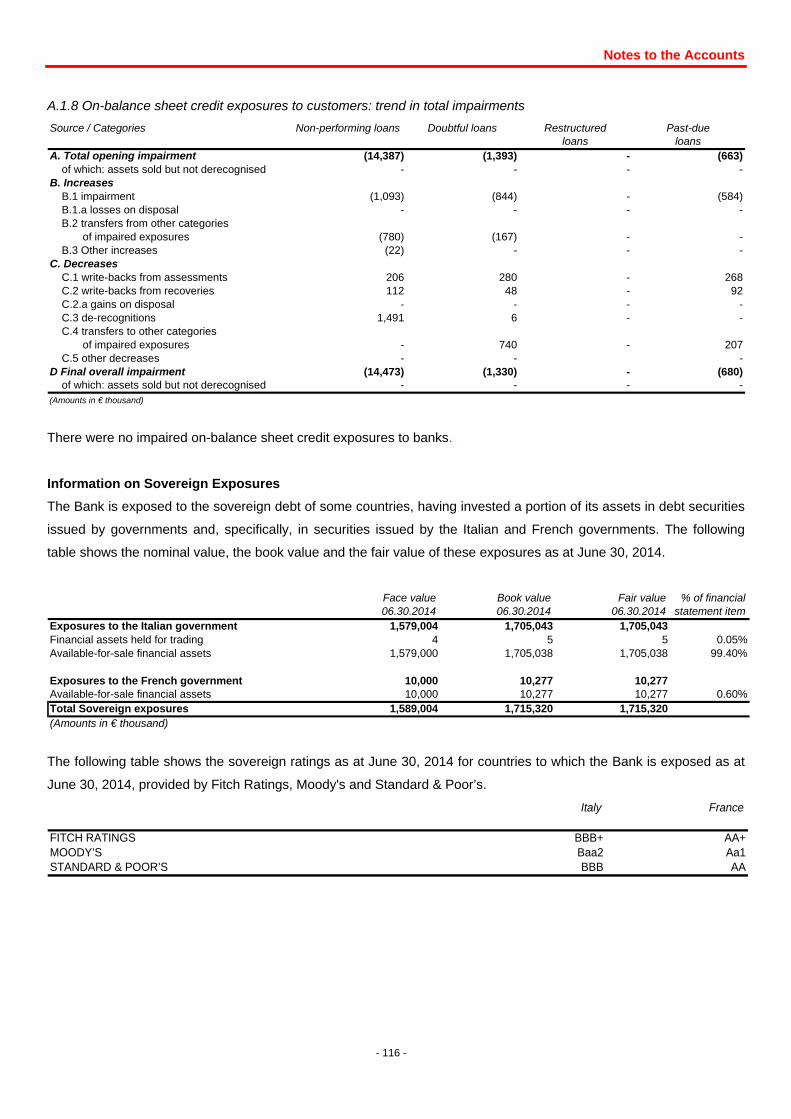
Notes to the Accounts
- 116 -
A.1.8 On-balance sheet credit exposures to customers: trend in total impairments
Source / Categories Non-performing loans Doubtful loans Restructured Past-dueloans loans
A. Total opening impairment (14,387) (1,393) - (663) of which: assets sold but not derecognised - - - -B. Increases B.1 impairment (1,093) (844) - (584) B.1.a losses on disposal - - - - B.2 transfers from other categories of impaired exposures (780) (167) - - B.3 Other increases (22) - - -C. Decreases C.1 write-backs from assessments 206 280 - 268 C.2 write-backs from recoveries 112 48 - 92 C.2.a gains on disposal - - - - C.3 de-recognitions 1,491 6 - - C.4 transfers to other categories of impaired exposures - 740 - 207 C.5 other decreases - - -D Final overall impairment (14,473) (1,330) - (680) of which: assets sold but not derecognised - - - -(Amounts in € thousand)
There were no impaired on-balance sheet credit exposures to banks.
Information on Sovereign Exposures
The Bank is exposed to the sovereign debt of some countries, having invested a portion of its assets in debt securities
issued by governments and, specifically, in securities issued by the Italian and French governments. The following
table shows the nominal value, the book value and the fair value of these exposures as at June 30, 2014.
Face value Book value Fair value % of financial06.30.2014 06.30.2014 06.30.2014 statement item
Exposures to the Italian government 1,579,004 1,705,043 1,705,043Financial assets held for trading 4 5 5 0.05%Available-for-sale financial assets 1,579,000 1,705,038 1,705,038 99.40%
Exposures to the French government 10,000 10,277 10,277Available-for-sale financial assets 10,000 10,277 10,277 0.60%Total Sovereign exposures 1,589,004 1,715,320 1,715,320(Amounts in € thousand)
The following table shows the sovereign ratings as at June 30, 2014 for countries to which the Bank is exposed as at
June 30, 2014, provided by Fitch Ratings, Moody's and Standard & Poor’s.
Italy France
FITCH RATINGS BBB+ AA+MOODY’S Baa2 Aa1STANDARD & POOR’S BBB AA

Notes to the Accounts
- 117 -
As at June 30, 2014, investments in debt securities issued by sovereign states accounted for 10.5% of the Bank’s total
assets.
There were no structured debt securities among the sovereign debt securities held by the Bank.
The Bank is therefore exposed to fluctuations in the price of Italian and French public debt securities. Tensions or
volatility in the government bond market could negatively impact on the Bank’s financial position and performance.
Section 2 - Market risk
Market risk derives from the effect that changes in market variables (interest rates, securities prices, exchange rates,
etc.) can cause to the economic value of the Bank’s portfolio, if it includes the assets held in the trading book (assets
held for trading) as well as those in the banking book, i.e. the transactions connected to strategic investment choices.
Risk Management Strategies and Processes
The Parent Company’s Board of Directors lays down strategic guidelines for taking on market risks by calculating
capital allocation for the Parent company and its subsidiaries, depending on risk appetite and value creation objectives
in proportion to risks assumed.
The Board of Directors of FinecoBank, in line with the Group's approach, approves a general framework of reference
for market risk and any significant changes, relating to the organizational structure, strategies, and methods.
FinecoBank’s strategy is to keep the minimum level of market risk in line with business needs and the limits set by the
Parent Company.
Market risk in FinecoBank is defined through two sets of limits:
• Global measures of market risk (e.g. VaR): which are meant to establish a boundary to the economic capital
absorption and to the economic loss accepted in trading activities; these limits must be consistent with assigned
revenue targets and the defined risk taking capacity;
• Granular measures of market risk (Sensitivity limits, Stress scenario limits, Nominal limits): which exist
independently of, but act in concert with the global limits; in order to control more effectively and more specifically
different risk types, desks and products, these limits are generally granular sensitivity or stress-related limits. The
levels set for granular limits aim at limiting the concentration in individual risk factors and the excessive exposure in
risk factors which are not sufficiently covered under VaR.
Structure and Organization
In order to ensure the effective implementation of operations and the consistency of policies, methods and practices
related to market risk in the Group legal entities, the Group model for activities related to market risk is based on the
definition of specific responsibilities.
In its relations with FinecoBank, the Parent Company is mainly responsible for:
• establishing, implementing and refining appropriate measures at global level for measuring exposure to market risk;
• setting risk limits, based on measurements identified, in line with the risk appetite approved by the Group.
The Market Risk function of FinecoBank, within the Risk Management Unit, in full compliance with local legal and
regulatory obligations, works together with the Market Risk Management Italy Function of the Parent Company and is
tasked primarily – but not exclusively – with:

Notes to the Accounts
- 118 -
• calculating the risk measurements for the global and granular measures for the Bank’s portfolios;
• checking that the measurements are compatible with the approved limits;
• initiating the escalation process when limits are exceeded, engaging the Market Risk Management Italy function of
the Parent Company;
• discussing and approving new products with innovative and complex market risk profiles, providing the Financial
Risk Italy function of the Parent Company with adequate information in order for the said function to issue a non-
binding opinion on the matter.
Risk measurement and reporting systems
Trading Book
The main tool used by FinecoBank to measure the market risk of trading positions is Value at Risk (VaR), calculated
using the historic simulation approach.
The historic simulation method involves the daily revaluation of positions on the basis of market price trends over an
appropriate observation period. The resulting distribution of gains and losses is analysed to determine the effect of
extreme market fluctuations on portfolios. The percentile value of the distribution corresponding to the set confidence
level represents the VaR. The following parameters are used to calculate VaR: confidence level 99%; time horizon of 1
day; daily update of the time series; observation period of 500 days.
Banking Book
The primary responsibility for monitoring and controlling Market Risk management in the Banking Book lies with the
Bank’s competent Bodies. The Parent Company is responsible for monitoring market risk in the banking book at
consolidated level, while sharing this responsibility with the relevant functions of the Legal Entities at local level.
The Parent Company, defines structure, data and frequency of the necessary Group and local level reporting.
Market risk in the banking book mainly consists of credit spread risk, interest rate risk and foreign exchange risk.
Credit spread risk mainly arises from investments in debt securities held for liquidity purposes. Market risk associated
with the bond portfolio is monitored and subject to limits on the notional amount, the sensitivity to Economic Value and
the Value at Risk.
The management of interest rate risk focuses on stabilizing this second type of risk. The banking book interest rate
risk measure covers both the value and net interest income risk aspects. More precisely, the different, and
complementary, perspectives involve:
• Economic value perspective: variation in interest rates can affect the economic value of assets and liabilities. The
economic value of the Bank can be viewed as the present value of the expected net cash flows, defined as the
expected cash flows on assets minus the expected cash flows on liabilities. A relevant risk measure from this
perspective is the economic value sensitivity per time bucket for a 1bp rate shock. This measure is reported to the
relevant committees to assess the economic value impact of various changes in the yield curve. The economic value
sensitivity is also calculated for a 200bp parallel shock. A monitoring variable from this perspective is the value at risk
resulting from interest rate risk exposure;
• Income perspective: the focus of analysis is the impact of changes of interest rates on accrual or reported Net
Interest Income that is the difference between revenues generated by interest sensitive assets and the cost related to

Notes to the Accounts
- 119 -
interest sensitive liabilities. An example of a measure of risks used is Net Interest Income sensitivity for a 100bp
parallel shock in rates. This measure provides an indication of the impact that such a shock would have on the net
interest income over the next 12 months. For these rate scenarios the 0% floor is considered for the downward shock
in view of the current low rate environment. Additional scenarios that are evaluated include steepening and flattening
scenarios (non-parallel shocks).
The third type of risk is foreign exchange risk. This exposure mainly derives from a mismatching of assets and
liabilities in USD. Exchange rate risk is hedged through the matching of assets and liabilities denominated in currency
or through spot transactions in foreign currencies.
Procedures and methodologies for Valuation of Trading Book positions
FinecoBank ensures that the value applied to each trading book position appropriately reflects the current fair (market)
value, i.e. the amount for which an asset could be exchanged, or a liability settled, between knowledgeable, willing
parties in an arm’s length transaction. The fair value of each financial instrument is based on, or derived from,
observable market prices or inputs. The availability of observable prices or inputs differs by product and market, and
might change over time.
If observable prices or parameters are readily and regularly available (i.e. satisfying adequate liquidity requirements),
they are directly employed in the determination of fair value (mark-to-market).
In non-active markets or for certain instruments, for which observable prices or inputs are not available, fair values are
calculated using valuation techniques that are appropriate for the specific instrument (mark-to-model). This approach
involves estimation and judgment and, therefore, might require valuation adjustments which take into account bid-ask
spreads, liquidity and counterparty risk, besides the employed pricing model. In addition, each pricing model used for
fair value calculation is validated by a dedicated function independent from business units.
According to the Group Market Risk Governance Guidelines, which define principles and rules for managing and
controlling activities potentially involving a market risk, in order to ensure the adequate separation between functions
in charge of development activities and functions in charge of validation, all valuation models developed by the front-
office functions of Group companies need to be centrally and independently tested and validated by the Market Risk
functions of the Parent Company. Model validation is also carried out centrally for any novel system or analysis
framework whose utilization has a potential impact on the Bank’s economic results.
In addition to daily marking to market or marking to model, Independent Price Verification (IPV) shall be performed by
FinecoBank’s Risk Management. This is the process by which market prices or model inputs are regularly verified for
accuracy and independence. While daily marking to market or marking to model may be performed by front-office
dealers, verification of market prices and model inputs is performed at least monthly.

Notes to the Accounts
- 120 -
Risk measures
VaR
The VaR calculated within the measurement of the market risk of the banking and trading book uses a historical
simulation approach. The choice of model adopted by the Parent Company has a series of advantages:
• easy to understand and communicate;
• does not require any explicit assumptions about the particular functional form of the distribution of yields of the risk
factors;
• does not require estimation of the variance-covariance matrix of the market factors that may affect the value of the
portfolio.
• captures the correlation structure reflected in the simultaneous changes in market factors, implicitly assuming that it
will remain constant in the future.
On the other hand VaR models based on historical simulations do not provide any information on the amount of the
loss exceeding the VaR. This why the framework established by the Parent Company uses additional instruments
such as stress tests.
2.1 Interest rate risk and price risk – regulatory trading book
Qualitative information
A. General aspects
The trading book is used to hold debt securities (ordinary and subordinated, structured and plain vanilla), equity
instruments, and certificates – listed and non-listed – related to brokerage activities with retail customers.
FinecoBank does not perform proprietary trading and does not assume speculative positions in its books. Entries in
the Bank’s trading book are recorded against brokerage activities with retail customers particularly during the sale of
OTC instruments. Other entries in the trading book are made for the internalisation of various financial instruments
when the Bank is a counterparty to the customer. This activity is performed as a result of the options introduced by the
MiFID which allow the execution of orders for financial instruments in a number of execution venues including internal
execution.
B. Processes for managing and methods for measuring interest rate risk and price risk
For both a description of internal processes for monitoring and managing risk and an illustration of the methodologies
used to analyse exposure, please refer to the introduction.
Quantitative information
1. Regulatory trading book: internal models and other methods of sensitivity analysis
FinecoBank monitors the VaR of the Trading Book on a weekly basis.
As at June 30, 2014, the daily VaR of the trading book amounted to €170 thousand.

Notes to the Accounts
- 121 -
2.2 Interest rate risk and price risk – banking book
Qualitative information
A. General aspects, management processes and measurement methods for interest rate risk and price risk
Interest rate risk consists of changes in interest rates that are reflected in:
• interest income sources, and thus, the Bank’s earnings (cash flow risk);
• the net present value of assets and liabilities, due to their impact on the present value of future cash flows (fair
value risk).
In line with the Group approach, FinecoBank measures and monitors interest rate risk daily, within the methodological
framework and the corresponding limits or thresholds set by the Parent Company. These relate to the sensitivity of the
net interest margin and the economic value.
Interest rate risk has an impact on all owned positions resulting from strategic investment decisions (banking book).
The main sources of interest rate risk can be classified as follows:
• repricing risk - the risk resulting from timing mismatches in maturities and the repricing of the Bank’s assets and
liabilities; the main features of this risk are:
o yield curve risk – risk resulting from exposure of the bank’s positions to changes in the slope and shape of the
yield curve;
o basis risk – risk resulting from the imperfect correlation in lending and borrowing interest rate changes for
different instruments that may also show similar repricing characteristics;
• optionality risk – risk resulting from implicit or explicit options in the Group’s banking book positions.
Within the organizational framework described above, the Board of Directors of FinecoBank approves the limits on
interest rate risk previously agreed with the Parent Company. These limits are set in terms of VaR (calculated using
the methodology described above in relation to the trading book).
FinecoBank is responsible for managing the exposure to interest rate risk within the limits assigned.
To assess effects of the change in the interest rate curve on the banking book, scenario analyses are conducted that
involve the parallel shifts in the rate curve of +/- 100 bps and +/- 200 bps at weekly intervals. For more details see
section 2. Banking book: Internal models and other methods of sensitivity analysis.
B. Fair value hedging activities
Hedging strategies aimed at complying with interest rate risk limits for the banking portfolio are carried out with listed
or unlisted derivative contracts. These derivatives, which are usually interest rate swaps, are the type of contracts
most used.
Macro-hedging is generally used, meaning hedges related to the amounts of cash contained in asset or liability
portfolios.
C. Cash flow hedging activity
There are currently no cash flow hedges generated by FinecoBank business operations.

Notes to the Accounts
- 122 -
D. Hedges of foreign investments
There are currently no hedges of foreign investments within FinecoBank’s business operations.
Quantitative information
1. Banking book: internal models and other methods of sensitivity analysis
The following table provides the results of the analyses conducted.
Currency Value analysis (Shift + 100 bp)
Value analysis (Shift - 100 bp)
Value analysis (Shift + 200 bp)
Value analysis (Shift - 200 bp)
Value analysis
(Shift + 1 bp) IRVaR*
EUR 29,836 -5,456 11,709 33,795 60
USD 408 177 913 -95 5
Other currencies -8 19 103 -15 0
Total 30,236 -5,260 12,725 33,685 65 406 (Amounts in € thousand)
*1 day holding period, confidence level 99%
The sensitivity analysis on net interest margin, which was conducted assuming a shift of + 100 basis points on the
euro interest rate curve, showed an impact of €30,236 thousand as at June 30, 2014. A shift of -100 basis points
showed an impact of - €5,260 thousand.
The sensitivity analysis on the value of shareholders' equity, which was conducted assuming a shift of + 200 basis
points on the euro interest rate curve, showed an impact of €12,725 thousand. A shift of -200 basis points showed an
impact of €33,685 thousand.
The sensitivity analysis on the value of shareholders' equity, which was conducted assuming a shift of + 1 basis point,
showed an overall impact of €65 thousand.
The interest rate VaR figure for FinecoBank came to approximately €406 thousand.
Total VaR, including the Credit Spread Risk component arising from government securities held as investment of
liquidity, amounted to €7,376 thousand.
2.3 Exchange rate risk
Qualitative information
A. General aspects, management processes and measurement methods for exchange rate risk
As part of its treasury activities, FinecoBank collects funds in foreign currencies, mainly US dollars, through customer
current accounts and repos, subsequently investing these funds in bonds, current accounts and time deposits with the
Parent Company.
The impact on the value of balance sheet items is estimated using the Forex VaR indicator.

Notes to the Accounts
- 123 -
The VaR of the Bank's positions is not used for the calculation of the Pillar 1 capital requirement because the
traditional standardized approach is used. The VaR is only used for management purposes.
B. Exchange rate risk hedging
Exchange rate risk is hedged through the matching of assets and liabilities denominated in currency or through spot
transactions in foreign currencies.
The component of exchange rate risk that contributes to the formation of the overall VaR is usually tied to the temporal
mismatch between assets and liabilities in US dollars.
Quantitative information
1. Internal models and other methods of sensitivity analysis
As at June 30, 2014, the daily Forex VaR of the overall portfolio (banking and trading books) was approximately €22
thousand.
Section 3 – Liquidity Risk
Qualitative information
A. General aspects, management processes and measurement methods for liquidity risk
Liquidity risk can be succinctly defined as the risk that FinecoBank, also due to unexpected future events, is unable to
meet its payment obligations or to efficiently match expected cash inflows and outflows. Generally, there are two
distinct types of liquidity risk: i) the funding liquidity risk, i.e. the risk that FinecoBank is unable to meet its payment
commitments and obligations in an efficient manner due to its inability to raise funds without jeopardizing its core
business and/or its financial situation ; and (ii) the market liquidity risk, i.e. the risk that FinecoBank is unable to sell a
financial asset without incurring capital losses due to an illiquid market and/or the timing required to complete the
transaction.
To address its exposure to liquidity risk - in terms of both funding liquidity risk and market liquidity risk - FinecoBank
invests the portion of liquidity that according to its internal analyses is less stable ("non-core liquidity") in liquid assets
or assets readily convertible into cash, such as, for example, demand deposits, short-term loans or government bonds
that can be used as a source of short-term financing with the central bank.
Finally, as regards, the contractual maturity mismatch between sources and uses (“Contractual maturity risk”) in the
current management of its liquidity, each week FinecoBank monitors the mismatch between expected cash inflows
and outflows at different time intervals, up to a maximum of one year. This is to make sure that the sum of the
differences between the expected cash inflows and outflows over the next 12 months is always positive.
FinecoBank's main source of funding is the deposits of it customers.

Notes to the Accounts
- 124 -
Behavioural models for asset and liability items
The Group has developed specific behavioural models aimed at estimating the maturity profile of asset and liability
items that do not have a contractual maturity; Indeed, some items that are perceived as due on demand, are actually
subject to a more “rigid” behaviour.
More specifically, modelling of assets and liabilities aims to construct a replication profile that best reflects the
behavioural characteristics of the items. An example is on demand items: estimates of the maturity profile reflect the
perceived stickiness. These behavioural models are developed by the Planning, Finance and Administration function
of the Parent Company and validated by the Risk Management function of the Parent Company and FinecoBank.
Section 4 - Operational risk
Qualitative information
A. General aspects, operational processes and methods for measuring operational risk
Operational risk
Operational risk is defined as the risk of losses due to errors, violations, interruptions, or damage caused by internal
processes, personnel, systems or by external events. This definition includes legal and compliance risk, but not
strategic and reputational risk.
For example, losses arising from the following can be defined as operational: internal or external fraud, employment
practices and workplace safety, customer claims, product distribution, fines and penalties for regulatory breaches,
damage to the Company’s physical assets, business disruption and system failures, and management of processes.
Group operational risk framework
The recognition, measurement, control and management of operational risk are carried out according to the principles
established by Basel II in the "New Basel agreement on Capital" and in line with the "New regulations for the
prudential supervision of banks" (Bank of Italy Circular no. 263 of December 27, 2006 as amended), which incorporate
instructions on international convergence for the measurement of capital and of capital ratios.
These principles and provisions have been set out in the Group Framework for the management of operational risk
and adopted in FinecoBank’s Operational Risk Manual approved by the Board of Directors.
The methods for classifying data and verifying its completeness, scenario analysis, risk indicators and risk capital
reporting and measurement are set by the Group Operational & Reputational Risks department of the Parent
Company and applied by FinecoBank in its capacity as a Group Legal Entity. A pivot element of the risk control
framework is the operational risk management application, allowing the collection of the data required for operational
risk control and capital measurement.
The compliance of the risk control and measurement system with external regulations and Group standards is
assessed through an internal validation process, under the responsibility of the Group Internal Validation department
of the Parent Company, which is independent from the Group Operational & Reputational Risks department.
FinecoBank has obtained the approval of the Bank of Italy for the use of advanced approaches (AMA) to calculate its
capital requirement for operational risk with effect from June 30, 2010.

Notes to the Accounts
- 125 -
Organizational structure
The Strategic Direction Body is responsible for approving all aspects relating to the Group operational risk framework
and verifying the adequacy of the measurement and control system and is regularly updated on changes to the risk
profile and operational risk exposure, with support from the appropriate risk committees if required.
In addition to the Strategic Direction Body, the corporate governance structure for operational risk consists of the
Risks Committee – introduced from June 24, 2009 – which examines all risk issues submitted to it, and approves and
validates the internal procedures and operating manuals for operational risk.
The reports produced by Risk Management for the Risks Committee and for the Board of Directors ensure that
management and the control bodies are constantly updated on the trend in operational risk within the Bank and can
actively intervene in the management and mitigation of the risks. The Chief Risk Officer's participation in the Products
Committee ensures oversight of the operational risk associated with the Bank's new business activities.
The Operational Risk Management (ORM) team is part of the broader Risk Management office which reports to the
Chief Risk Officer of FinecoBank who in turn reports directly to the Managing Director.
The main activities carried out by the Risk Management office in terms of operational risk are:
recognition, classification, validation and reporting of operating losses with consequent identification of problem
areas;
assessment of potential risks through scenario analyses and risk indicators (Key Risk Indicator-KRI);
monitoring and optimisation of the internal control system;
policies to mitigate and transfer risk through insurance cover;
development of an operational risk culture within the Bank;
generating reports for Senior Management on risk trends.
Internal validation process
In compliance with external regulations, the operational risk control and measurement system is subject to an internal
validation process established by the Parent Company, in order to verify its compliance with minimum requirements
and Group standards. This process is owned by the Pillar 2 Risks and Operational Risk Validation unit, within the
Group Internal Validation department.
The use of the Advanced Measurement Approach (AMA) to calculate regulatory capital requires the preparation of an
annual report on the management and control system for operational risk by the Operational Risk team. This Annual
Report contains a self-assessment of the system and a detailed examination of the governance structure, the process
for collecting data on losses, the scenario analyses and internal control system, as well as the operational use of the
measurement system.
The Report is submitted to the approval of the Board of Directors and is validated by the Internal Audit department and
Group GIV (Group Internal Validation). For 2013, the Internal Audit department and Group GIV confirmed that
adequate protection measures are in place for operating risk as well as the adequacy of the existing management and
control system.
Operational risk management
Operational risk management consists of the review of processes to reduce the risks found and the management of
the related insurance policies, with the identification of the suitable deductibles and limits.

Notes to the Accounts
- 126 -
The Risks Committee and the Product Committee, from September 2011, have been joined by a Permanent Work
Group (PWG), whose members include the CRO, the Risk Manager and the Organization function aimed at sharing
their respective expertise in relation to the projects planned or in under way, new processes and products, or changes
to them, and anything else that may affect the Bank's risk profile. The PWG's ultimate objective is to identify and then
develop new mitigation measures.
As part of the prevention of operational risk and to control sales channels remotely, the Risk Management office has
focused on fraud prevention measures.
The development of remote monitoring to prevent fraud has led to the creation of a system called System of Fraud
Identification and Analysis (SoFIA). This system enables a larger amount of data and information on individual
indicators to be analysed at the same time and enables possible irregularities to be detected on a daily basis through
an alert system.
In this way, all of the names put forward to be checked are assessed at the same time with regard to all remote
indicators (30 indicators).
On the basis of qualitative and quantitative assessments of these indicators, the assigned staff select any cases that
need to be reported to the Network Controls Department, Monitoring and Network Services Department – reporting
directly to the Managing Director – for subsequent examination.
Moreover, the Operational Risk team is updated annually on the results of the tests conducted in accordance with the
Business Continuity and Disaster Recovery plans.
Risk capital measurement and allocation mechanism
Operational risk is measured internally by means of:
collecting data on losses;
monitoring Key Risk Indicators (KRI);
scenario analysis
remote control of sales channels
The collection and classification of operating losses is managed by a Group system called Application for Risk
Gauging On line (ARGO).
In addition to being used for internal prevention and improvement purposes, the information gathered is also used to
calculate Pillar 1 and 2 capital requirements.
In terms of key risk indicators, there are currently 47 risk indicators split into nine control areas (Legal, Claims, Credit
Cards, Back Office, PFA, IT systems, Payment Systems, Current Accounts, HR) which the Bank uses to measure its
exposure to operational risk. If an indicator shows an irregular value, this may be related to changes in the exposure to
operational risk.
Scenario analyses enable FinecoBank's exposure to operational risk, characterized by low frequency but high
potential impact, to be estimated. The scenarios are identified by analysing internal losses, external events, risk
indicator trends, critical processes, products and risk classes.
The inclusion of the data generated through the analyses of the scenario and of the trend of risk indicators are a
forward-looking element of the risk capital calculation model.
Data collection and control is managed at local level, while the management and maintenance of the model to
calculate regulatory capital is centralized for all Legal Entities of the Group at the Parent Company.

Notes to the Accounts
- 127 -
Risk capital for operational risk used for regulatory purposes as at June 30, 2014, amounted to €59,139 thousand.
Risks arising from significant legal disputes
FinecoBank is involved in individually insignificant legal proceedings over which there is considerable uncertainty
regarding the outcome and the amount of possible charges. Where it is possible to reliably estimate the amount of
possible charges and the charges are considered likely, provisions have been made in an appropriate amount based
on the circumstances and consistent with international accounting standards. Specifically, as a precaution against
these obligations and customers’ complaints that have not yet resulted in legal proceedings, as at June 30, 2014,
FinecoBank had a provision in place for risks and charges of €51,319 thousand.
Risks arising from tax disputes and audits
With regard to risks arising from tax disputes or audits, there are no changes to report compared to what was
discussed in Part E of the Notes to the 2013 financial statements, except for the closure in April 2014 of the procedure
for the tax assessment settlement relating to the notice of payment for 2008, received at the end of 2013. The
settlement amount for that year was set at €244 thousand as tax and €122 thousand by way of penalties and accrued
interest; provisions for these sums had already been allocated in the financial statements at December 31, 2013. The
Bank made the payment on April 18, 2014 for a total amount of €367 thousand (including interest accrued up to the
date of payment).
Quantitative information
Internal operating loss data is the main component used to calculate capital requirements against operational risk.
Loss analyses enable the ORM team to make assessments on FinecoBank’s exposure to operational risk and to
identify any critical areas.
As at June 30, 2014, operating losses recorded in the accounts amounted to approximately €2 million.
The main sources of operating losses are shown below by “event type”, i.e. by type of event that generated them
according to the New Basel II Accord:
Internal fraud: losses due to unauthorized activities, fraud, embezzlement or infringement of laws, regulations or
company directives that involve at least one internal staff member of the bank or a resource hired under an agency
contract;
External fraud: losses owing to fraud, embezzlement or violation of laws by subjects external to the bank;
employment practices and workplace safety: losses due to actions not compliant with the law or to agreements
regarding employment, health and safety, to the payment of compensation for bodily harm, or to cases of
discrimination or non-application of equality conditions;
customers, products and professional practices: losses arising from non-fulfilment of professional obligations
towards customers or from the nature or characteristics of the products or services provided;
damage from external events: losses arising from external events, including natural disasters, acts of terrorism and
vandalism;
business disruption and system failures: losses owing to business disruption and system failures or interruptions;
process management, execution and delivery: losses due to deficiencies in the completion of transactions or
management of processes, as well as losses due to relations with commercial counterparties, vendors and suppliers.

Notes to the Accounts
- 128 -
Section 5 - Other Risks and information
Although the types of risk described above represent the main categories, there are, other types that FinecoBank
considers important. In accordance with the provisions of Basel II Pillar 2, FinecoBank – with the support of the Parent
Company – has identified other types of risk in addition to the credit, market, operational and liquidity risks described
above:
Business risk is defined as adverse, unexpected changes in business volume and/or margins that are not due to
credit, market and operational risks. Business risk can result, above all, from a serious deterioration in the market
environment, changes in the competitive situation or customer behaviour, as well as changes in the legal framework;
Strategic risk is the risk of suffering potential losses due to decisions or radical changes in the business
environment, improper implementation of decisions, lack of responsiveness to changes in the business environment,
which result in negative impacts to the risk profile, capital and earnings as well as the overall direction and scope of a
bank over the long run;
Reputational risk, which represents the current or future risk of a fall in profits resulting from a negative perception
of the Bank’s image by Customers, counterparties, shareholders, investors or Supervisory Authorities.
FinecoBank has not included Real Estate Risk within the Bank's scope of risk, because it does not hold significant
positions in real estate, nor does it include Financial Investment Risk, as it does not possess large non-speculative
financial investments in companies external to the Group.
Following the identification of the significant risks, the Parent Company establishes the best way to analyse them in
qualitative and quantitative terms. The quantitative measurement is carried out by the Parent Company using data
sent by FinecoBank and is used to calculate the Internal Capital.
Credit, market, operational and business risks are measured quantitatively by the Parent Company, using:
• economic capital, calculation of the benefit of diversification and aggregation as a component of internal capital
(including prudential cushion for model risk and variability of the economic cycle);
• Stress tests.
Internal Capital is the capital set aside as a buffer against the potential losses inherent in the Group’s business
activities and it takes into consideration all risk types that the Group has identified as measurable in terms of Economic
Capital in line with Pillar II requirements.
For control purposes, Internal Capital is calculated quarterly by the Parent Company based on the periodic figures
sent by FinecoBank; it is also projected for budgeting purposes.
The multi-dimensional nature of risk makes it necessary to supplement the measurement of economic capital with
stress testing, not only in order to estimate losses in certain scenarios, but also to ascertain the impact of their
determinants.
The stress test is one of the instruments used control significant risks in order to assess the Bank's vulnerability to
“exceptional but plausible” events, providing additional information to the monitoring activities.
Stress testing, in accordance with regulatory requirements, is conducted on the basis of a set of internally defined
stress scenarios and is performed at least twice a year by specific Parent Company functions.

Notes to the Accounts
- 129 -
ICAAP - Internal Capital Adequacy Assessment Process Measuring the risk profile is a fundamental element of the Internal Capital Adequacy Assessment Process under Basel
II Pillar 2 (ICAAP).
The Group’s approach to ICAAP relies on the definition of the “Risk Governance”, as a preliminary requirement, while
the process consists of following phases:
• defining the scope and identifying the risks;
• assessing the risk profile;
• defining risk appetite and capital allocation;
• monitoring and reporting.
Capital adequacy is assessed by considering the balance between assumed risks, both Pillar I and Pillar II, and the
available capital. With respect to Pillar II, the relevant metric is the Risk Taking Capacity, which is the ratio of available
capital (Available Financial Resources - AFR) to Internal Capital.
The main elements of the internal process for determining capital adequacy include the setting and monitoring of the
risk appetite. The risk appetite is defined as the level of risk that the Bank is willing to accept for the pursuit of its
strategic objectives and business plan, taking into account the interests of its Customers and its Shareholder, capital
requirements and other requirements.
The main objectives of the risk appetite are:
Explicitly assessing the risks, and their interconnections at local and Group level, that the Bank decides to assume
(or avoid) in a long-term perspective;
Specifying the types of risk that the Bank intends to assume, setting targets, triggers and limits under both normal
operating and stress conditions;
Ensuring a risk-return profile "ex-ante" consistent with sustainable long-term growth, as defined by the return
forecasts of the strategic plan/budget;
Ensuring that the business developed within the limits of risk tolerance established by the Board of Directors of
FinecoBank, in accordance with the applicable national and international regulations;
Supporting discussions on future policy options with regard to the risk profile;
Guiding the vision of internal and external stakeholders towards a risk profile consistent with the strategic plan;
Providing qualitative descriptions for risks that are difficult to quantify (e.g. strategic, reputational, compliance) to
strategically guide the review of processes and the internal control system.
The risk appetite includes a statement and a set of KPIs. The Statement sets out the Bank's positioning in terms of
strategic objectives and associated risk profiles, while the KPIs are designed to quantitatively measure the Bank's in
the following categories:
• Risk ownership
• Regulatory requirements;
• Profitability and risk;
• Control over specific types of risk.

Notes to the Accounts
- 130 -
For each KPI respective thresholds are identified, consisting of targets, triggers and limits. The setting of the
thresholds is evaluated on a case by case basis, also through managerial decisions by the Board of Directors of
FinecoBank, in compliance with the regulatory requirements and of the supervisory bodies and considering the
consistency with the Group risk appetite.
The metrics are the subject of regular monitoring and reporting, at least quarterly. The monitoring, be competence, is
carried out by the CRO Department, the CFO Department and the Italy Liquidity Center (Parent Company).

Notes to the Accounts
- 131 -
Glossary
Available financial resources (AFR)
AFR are the resources that can be used to safeguard the bank from insolvency. The AFR are an economic measure that consider the potential reserves, hybrid debt instruments, IFRS reserves, goodwill and other intangible assets, treasury shares held and the expected profits.
Banking book The set of positions other than those included in the regulatory trading book are recorded in the banking book.
Core Tier 1 Ratio The percentage of a bank’s Tier 1 Capital to its risk-weighted assets. Tier 1 capital also consists of:
paid in capital; reserves (including share premium) retained earnings
Cost of Risk
The ratio between loan loss provisions and loans and receivables with customers. It is one of the indicators of the bank assets’ level of risk: the lower the ratio, the less risky the bank assets.
Credit Quality – EL EL%= EL/EAD Represents the expected loss as a percentage of the exposure in the event of default (EAD) of the performing portfolio. The perimeter is the customers of the performing portfolio.
Economic capital Capital level that is required to cover the losses that may occur with at a time horizon of one year and a certain probability or confidence level. Economic Capital is a measure of the variability of the Expected Loss of the portfolio and depends on the degree of diversification of the portfolio itself.
Funding
Provision, in various forms, of the funds necessary to finance business activities or particular financial transactions.
Internal Capital Represents the amount of capital required to cover potential losses and is required to support the business activities and positions held. Internal Capital is the sum of the aggregated Economic Capital and a cushion that considers the effects of the cycle and model risk.
Key Risk Indicators The risk indicators are quantitative metrics that reflect exposure to Operational Risks of specific processes or products: the value expressed by an indicator should be related to changes in risk levels.
Leverage Ratio The leverage ratio is the ratio between the total assets net of intangible assets and shareholders' equity, net of intangible assets.
Model Risk Category
The MRCs have been introduced at the group level in order to characterize the types of operational loss in more detail. They are obtained from the combination of the seven event types established by Basel II with one or more of products offered to customers.

Notes to the Accounts
- 132 -
Risk Taking Capacity
Ratio between Available Financial Resources and Internal Capital. Includes a prudential buffer (cushion).
RWA - Risk-Weighted Assets
RWA: On-balance sheet assets and off-balance sheet assets (derivatives and guarantees) classified and weighted by different coefficients referring to risks, following banking rules issued by local Regulatory Authorities (i.e. Bank of Italy, Bafin, etc.), to calculate solvency ratios.
Sensitivity
The greater or lesser degree of sensitivity with which certain assets or liabilities react to changes in rates or other reference parameters.
Sensitivity Analysis Sensitivity analysis quantifies the change in value of a financial portfolio resulting from an unfavourable change in major risk factors (interest rate, exchange rate, equity)
Tier 1 Capital
The most reliable and liquid part of a bank’s capital, as defined by regulatory rules.
Total Capital Ratio The percentage of a bank’s Tier 1 and Tier 2 capital to its risk-weighted assets. Tier 2 capital consists of:
valuation reserves innovative capital and hybrid instruments
Trading Book Positions held for trading are those held intentionally for a subsequent sale in the near term and/or assumed with the intention of benefiting, in the short term, from the differences between buying and selling prices, or other price or interest rate interest variations.
Value at Risk A method used for quantifying risk. It measures potential future losses which will not be exceeded within a specified period and with a specified probability.

Notes to the Accounts
- 133 -
PART F – SHAREHOLDERS’ EQUITY
Section 1 - Bank's shareholders' equity
A. Qualitative information
The management and allocation of capital (regulatory and economic), aimed at ensuring that the amount of capital and
the related ratios are consistent with the risk profile assumed and comply with regulatory provisions, is carried out at
Group level, given that the quality and the amount of capital resources of the individual Group companies are
established on the basis of more general Group objectives and under Group management and coordination.
B. Quantitative information
B.1 Bank's shareholders' equity: breakdown
Amount 06.30.2014 Amount 12.31.2013
1. Share capital 200,070 200,0702. Share premium reserve 1,934 1,9343. Reserves 190,924 127,715 - from profits 190,924 127,715 a) legal 33,061 28,800 b) statutory - - c) treasury shares - - d) other 157,863 98,915 - other - -4. Equity instruments - -5. (Treasury shares) - -6. Revaluation reserves 4,912 4,214 - Available-for-sale financial assets 3,287 641 - Property, plant and equipment - - - Intangible assets - - - Hedging instruments of foreign investments - - - Cash flow hedges - - - Exchange differences - - - Non-current assets classified as held for sale - - - Actuarial gains (losses) on - - defined benefits plans 1,625 3,573 - Revaluation reserves for - - associates carried at equity - - - Special revaluation laws - -7. Net Profit (Loss) for the year 73,862 85,216Total 471,702 419,149(Amounts in € thousand)

Notes to the Accounts
- 134 -
B.2 Revaluation reserves for available-for-sale financial assets: breakdown
Asset/Amount
Positive reserve Negative reserve Positive reserve Negative reserve
1. Debt securities 3,359 (72) 673 (32)2. Equity instruments - - - -3. Units in investment funds. - - - -4. Loans - - - -
Total 3,359 (72) 673 (32)(Amounts in € thousand)
Total 06.30.2014 Total 12.31.2013
B.3 Revaluation reserves for available-for-sale financial assets: annual changes
Debt securities Equity instruments Units in investment funds
Loans
1. Opening balances 641 - - -2. Increases2.1 Fair value increases 2,744 - - -2.2 Reclassification through profit or loss of negative reserves - from impairment - - - - - from disposal - - - -2.3 Other increases - - - -3. Decreases3.1 Fair value reductions (89) - - -3.2 Impairment losses - - - -3.3 Reclassification through profit or loss of positive reserves - from disposal (9) - - -3.4 Other increases - - - -4. Closing balance 3,287 - - -(Amounts in € thousand)
Section 2 - Regulatory capital and ratios
1.1 Regulatory capital - Own funds
A. Qualitative information
Own funds are measured on a quarterly basis in accordance with regulatory provisions. The results are reported to the
Parent Company's Board of Directors.
As at June 30, 2014, Own Funds, calculated by applying the supervisory regulations in force according to the Basel III
regulatory framework, amounted to €338,752 thousand, satisfying the mandatory regulatory requirements.
The “Common Equity Tier 1” and “Total Own Funds” were re-determined by applying the rules in force as of January
1, 2014.
06.30.2014 12.31.2013
Common Equity Tier 1 - CET1 338,752 316,008Additional Tier 1 – AT1 - -TIER 2 – T2 - -Total Own Funds 338,752 316,008(Amounts in € thousand)

Notes to the Accounts
- 135 -
1. Common Equity Tier 1
Common Equity Tier 1 - CET1 consists of the following elements:
share capital of €200 million, made up of 606,274,033 ordinary shares of a nominal value of €0.33 each;
the share premium reserve of €1,934 thousand;
the legal reserve, the extraordinary reserves and retained earnings of €190,923 thousand;
accumulated other comprehensive income (OCI), which consists of the positive reserve of debt securities issued by
central governments of EU member countries, held in the "available-for-sale financial assets" portfolio after
December 31, 2009, amounting to €3,287 thousand, and the IAS19 Reserve, amounting to €1,625 thousand;
the share of the profit for the first half of 2014 to be allocated to the reserves, amounting to €21,935 thousand. To
this end, in the absence of a formal dividend policy, for the purpose of calculating own funds as at June 30, 2014,
retained earnings included in Common Equity Tier 1 were estimated with reference to the average pay out of the
last three years, as established in the European Commission Delegated Regulation (EU) no. 241/2014,
supplementing regulation EU 575/2013 of the European Parliament.
The following deductions have been made from Common Equity Tier 1:
• book value of goodwill, net of deferred taxes, amounting to €68,409 thousand;
• other intangible assets, amounting to €7,915 thousand;
• deferred tax assets (DTA) depending on future profitability and arising from temporary differences that exceed 10%
of CET1, amounting to €2,810 thousand.
Finally, the effects from applying the transitional provisions laid down in Bank of Italy Circular no. 285, concerning own
funds, were taken into account; specifically:
• with regard to deferred tax assets (DTA) depending on future profitability and arising from temporary differences that
exceed 10% of CET1, a 20% deduction was made for the year 2014, if they arose after January 1, 2014, and a 0%
deduction otherwise; this resulted in a deduction of €40 thousand compared to the deduction of €2,810 thousand
mentioned above;
• the positive revaluation reserves related to debt securities issued by central governments of EU member countries,
held in the "available-for-sale financial assets" portfolio after December 31, 2009, were neutralized for an amount of
€3,287 thousand,
• a 100% negative prudential filter was applied for 2014 for an amount of €1,372 thousand, on the IAS19 reserve in
order to essentially restore the situation prior to IAS 19.
With regard to defined benefit plans under IAS 19, the entry into force on January 1, 2013 of the amendments (IAS
19R) that prescribe the elimination of the corridor method – with the resulting recognition of the present value of the
defined benefit obligation – had an impact on FinecoBank shareholders' equity due to the recognition of net actuarial
gains/losses in revaluation reserves, which were not previously recognized, in application of the said method. From a
regulatory point of view, in order to avoid an artificial volatility in the calculation of regulatory capital before and after
the introduction of the “CRR/CRD IV Package”, the supervisory authority ordered the implementation of a prudential
filter designed to neutralize the impact of these amendments on 2014.

Notes to the Accounts
- 136 -
Lastly, it should be noted that, as required by the Bank of Italy in its communication of December 23, 2013 "Circular
no. 285. Implementation in Italy of Regulation (EU) no. 575/2013 (CRR) and Directive 2013/36/EU (CRDIV), on
January 29, 2014", FinecoBank informed the Bank of Italy that it intended to exercise the option to completely
neutralize the unrealized gains and losses recognized in the revaluation reserves relating to debt securities held in the
“Available-for-sale financial assets" portfolio after December 31, 2009, limited only to debt securities issued by central
governments of EU member countries.
2. Additional Tier 1 - AT1
No data to report.
3. Tier 2 - T2
No data to report.
B. Quantitative information
Reconciliation of Regulatory capital with Carrying amounts
06.30.2014 12.31.2013
Common Equity Tier 1 - CET1CET1 instrumentsShare capital 200,070 200,070Share premium reserve 1,934 1,934ReservesReserves 190,923 127,714Accumulated other comprehensive income (OCI) 4,912 4,214Profit allocated to reserves 21,935 63,209 Profit for the year 73,862 85,216 Dividends and charitable donations (51,927) (22,007)DeductionsGoodwill to be deducted from regulatory capital (68,409) (69,075) Goodwill (89,602) (89,602) Deferred taxes relating to goodwill 21,193 20,527Other intangible assets (7,915) (8,014)Other deductions (2,810) (7,596)Transitory regime– impact on CET1 (1,888) 3,552
Common Equity Tier 1 - CET1 338,752 316,008
Additional Tier 1 – AT1 - -
TIER 2 – T2 - -
Total Own Funds 338,752 316,008(Amounts in € thousand)

Notes to the Accounts
- 137 -
The “Common Equity Tier 1” and “Total Own Funds” were re-determined by applying the rules in force as of January
1, 2014.
Report on Regulatory capital
06.30.2014
Common Equity Tier 1 - CET1Opening balance 316,008Profit for the year allocated to reserves 21,935Changes in accumulated other comprehensive income (OCI) 697Goodwill net of deferred taxes 667Other intangible assets 99Other deductions 4,786Transitory regime– impact on CET1 (5,440)Closing balance 338,752Additional Tier 1 – AT1)Opening balance -Closing balance -TIER 2 – T2Opening balance -Closing balance -
Total Own Funds 338,752(Amounts in € thousand)
2.2 Capital adequacy
A. Qualitative information
As at June 30, 2014, FinecoBank prudential regulatory requirements were determined by applying the current
supervisory regulations of the Basel III Traditional Standardized Approach, except for capital requirements for
operational risk, which were calculated using Advanced Measurement Approaches.
According to Basel III supervisory regulations, those entities that use internal ratings-based approaches for calculating
capital requirements for credit risk and the Advanced Measurement Approaches for calculating own funds
requirements for operational risk must hold own funds that are at all times equal to or greater than 80% of the Basel I
requirements (CRR 575/2013 art. 500).
As at December 31, 2013, FinecoBank prudential regulatory requirements were determined by applying the
supervisory regulations of the Basel II Traditional Standardized Approach, except for capital requirements for
operational risk, which were calculated using advanced approaches. To this end, the Bank supplemented the total
capital requirements for the “floor” set by Bank of Italy regulations in force at the time, corresponding to the positive
difference between 80% of the capital requirements calculated on the basis of regulations in force as at December 31,
2006, and the sum of capital requirements for credit, counterparty, market and operational risks, calculated using the
current supervisory regulations of the Basel II Traditional Standardized Approach. As at December 31, 2013, the floor
was €90,828 thousand, net of the 25% reduction granted to banks belonging to a banking group.

Notes to the Accounts
- 138 -
C. Quantitative information
06.30.2014 12.31.2013 06.30.2014 12.31.2013A. RISK ASSETSA.1 Credit and counterparty risk 16,965,532 18,756,147 993,473 1,073,917 1. Traditional standardised approach 16,965,532 18,756,147 993,473 1,073,917 2. Internal rating method - - - - 2.1 Basic - - - - 2.2 Advanced - - - - 3. Securitisations - - - -B. REGULATORY CAPITAL REQUIREMENTSB.1 Credit and counterparty risk 79,478 85,913B.2 Market risk 3,388 3,335 1. Traditional standardised approach 3,388 3,335 2. Internal models - - 3. Concentration risk - -B.3 Operational risk 56,139 64,912 1. Basic method - - 2. Traditional standardised approach - - 3. Advanced measurement approach 56,139 64,912B.4 Other prudential requirements 3 -B.5 Other calculation elements - 52,288B.6 Total prudential requirements 139,008 206,448C. RISK ASSETS AND CAPITAL RATIOSC.1 Risk-weighted assets 1,737,602 2,580,595
C.2 Tier 1 capital/Risk-weighted assets (Tier 1 capital ratio)19.50% 12.25%
C.3 Regulatory capital including Tier 3/ Risk-weighted assets (Total capital ratio) 19.50% 12.25%(Amounts in € thousand)
Category/AmountNon weighted assets Weighted assets
Risk-weighted assets have been calculated by multiplying the total of prudential requirements by 12.5 (the inverse of
the minimum compulsory coefficient of 8%).
According to Basel III supervisory regulations, in force as of January 1, 2014, entities that use internal ratings-based
approaches for calculating capital requirements for credit risk and Advanced Measurement Approaches for calculating
own funds requirements for operational risk must hold own funds that are at all times equal to or greater than 80% of
the Basel I requirements (CRR 575/2013 art. 500), thereby replacing the requirement to supplement the Basel I floor
set forth in the previous Bank of Italy regulation (Bank of Italy Circular no. 263).
This led to a reduction in capital requirements, which more than offset the elimination of the 25% reduction in capital
requirements granted to banks belonging to a banking group under the previous legislation in force until December 31,
2013.

Notes to the Accounts
- 139 -
Capital requirement per type of risk and approach adopted
Type of risk Approach used Capital requirements Capital requirementsBasel 3 06.30.2014 Basel 2 12.31.2013
Capital requirements credit and counterparty risk
Standardised method for On-balance sheet risk-weighted assets and Guarantees given and commitments to disburse funds, Current value approach for Derivative contracts and CRM - Comprehensive method with regulatory adjustments for SFTs
79,478 85,913
Market risk1. Currency risk Traditional standardised approach 1,405 1,1732. Risk position debt securities Traditional standardised approach 1,784 1,2543. Risk position equity instruments Traditional standardised approach 199 9064. Position risk commodities Traditional standardised approach - -
3,388 3,333
1. Concentration risk Traditional standardised approach - -- -
1. Risk of adjustment of valuation of credit Traditional standardised approach - -- -
1. Settlement risk Traditional standardised approach 3 23 2
1. Advanced measurement approach Advanced measurement approach 56,139 64,91256,139 64,912
- 121,104
- (68,816)
139,008 206,448(Amounts in € thousand)
Supplement for Basel I floor
Reduction for banks belonging to a Banking Group *
Total capital requirements
Capital requirements - settlement risk
Capital requirements market risk
Capital requirements - concentration risk
Capital requirements - risk of adjustment of valuation of credit
Capital requirements operational risk
* The 25% reduction in capital requirements granted to banks belonging to a banking group was cancelled by
Regulation (EU) 575/2013 as of January 1, 2014.

Notes to the Accounts
- 140 -
PART H – RELATED-PARTY TRANSACTIONS
Information on the fees paid to key management personnel and on related-party transactions, according to IAS 24, are
shown below.
1. Details of Top Managers' Compensation
Key management personnel are persons having authority and responsibility for planning, directing, and controlling
FinecoBank's activities, directly or indirectly. This category includes Board members and members of the Board of
Statutory Auditors, pursuant to requirements of the Bank of Italy Circular no. 262 of December 22, 2005 as amended,
as well as the Managing Director, the Deputy General Manager/GBS Manager, the Chief Financial Officer, the PFA
Network Commercial Manager, the Direct Bank Manager and the Investment & Wealth Management Services
Manager6.
Total 06.30.2014 Total 06.30.2013
Fees paid to "Key Management Personnel", Directors
and the Board of Statutory Auditorsa) short-term benefits 2,049 947b) post-employment benefits 105 52
of which under defined benefit plans - -of which under defined contribution plans 105 52
c) other long-term employee benefits 6 -d) termination benefits - -e) share-based payments 293 178TOTAL 2,453 1,177(Amounts in € thousand)
2. Related-party transactions
With regard to related-party transactions, in the first half of 2014:
1. two non-standard transactions were carried out with related parties/associated persons, based on the approval of
the Board of Directors on March 27, 2014, and specifically:
a material transaction, concerning the change in the liquidity investment policy of FinecoBank with the Parent
Company UniCredit S.p.A.;
and
a minor transaction, concerning the appointment of MedioBanca S.p.A. as sponsor for the admission to listing of
the ordinary shares of the Bank.
The above transactions were approved by UniCredit's Related-Parties and Equity Investments Committee and by
(i) all members of FinecoBank's Audit Committee, the above transaction with Mediobanca and (ii) only by
Independent Directors of the Committee, the new liquidity investment policy. The latter transaction was also
examined by the Board of Directors of the Parent Company, on a conservative basis, given that at present, due to
100% control, inter-group transactions would be excluded from the above decision-making procedures;
6As at June 30, 2013, the key managers of the Bank comprised Board members, members of the Board of Statutory Auditors and the Managing Director. As at June 30, 2014, key managers of the Bank also include the Deputy General Manager/GBS Manager, the Chief Financial Officer, the PFA Network Commercial Manager, the Direct Bank Manager and the Investment & Wealth Management Services Manager, as they were identified as key managers by the Board of Directors on March 27, 2014.

Notes to the Accounts
- 141 -
2. three transactions were carried out with related parties/associated persons, based on the approval of the Board of
Directors on April 15, 2014, and specifically:
a minor, non-standard transaction was carried out at market conditions with UniCredit Bank AG concerning the
appointment of the mentioned bank as Joint Global Coordinator and Joint Bookrunner in the placement of the
Company’s shares for the purpose of the Listing; the fees due to the Syndicate were paid by the selling
Shareholder;
a minor, non-standard transaction was carried out at market conditions with Mediobanca concerning the
appointment of the mentioned bank as Joint Bookrunner in the placement of the Company’s shares for the
purpose of the Listing; the fees due to the Syndicate were paid by the selling Shareholder;
and
a minor, non-standard transaction, was carried out with UniCredit at non-market conditions, being free of
charge, concerning the signing of an agreement acknowledging the licence contract of the "Fineco” trademark;
3. based on the approval of the Board of Directors on June 27, 2014, and the prior favourable opinion of the Audit
and Related Parties Committee, a transaction consisting in a “Framework Resolution - Repo transactions with
institutional clients, term deposits from retail customers and related use of liquidity”, which will be valid until
October 31, 2014, supplemented by the quantitative limits set by the Board of Directors on July 15, 2014. The
Audit and Related Parties Committee of FinecoBank expressed a favourable opinion on the above transaction.
During the first half of 2014, inter-group transactions and transactions with related parties in general, both Italian and
foreign, were conducted within the ordinary course of business and related financial activities of the Bank,
and were carried out under conditions similar to those applied to transactions with unrelated third parties. Intra-group
transactions were carried out based on assessments of a mutual economic advantage, and the determination of
applicable terms and conditions took place in compliance with the criteria of substantial correctness, keeping in mind
the common goal of creating value for the entire UniCredit group. The same principle was also applied in relation to
the provision of intra-group services, combined with the principle of regulate such services at minimal rate solely to
recover related production costs.
Lastly, with regard to transactions of significant financial and economic relevance, during 2012, FinecoBank S.p.A.
issued 5 bank guarantees in favour of the Italian Revenue Agency upon request by UniCredit, with indefinite duration
(specifically of a duration until payment of the underlying sums), for a total amount of €256,065 thousand, plus interest
accrued and accruing until request for payment from the Italian Revenue Agency. The bank guarantees were issued to
secure the obligations assumed by UniCredit in relation to five VAT refund suspension orders issued by the Italian
Revenue Agency and entail the assumption by FinecoBank S.p.A. of an irrevocable payment commitment on demand,
within 30 days and without any exceptions. In the previous year, following the settlement of an assessment notice
issued by the Regional Department of Liguria, for €4,505 thousand, replaced by another assessment notice issued by
the same Department up to the amount settled, a guarantee already issued by FinecoBank S.p.A. was replaced, with
amounts unchanged; this transaction did not change the commitments undertaken according to the forms, procedures
and risks already assessed during 2012, which did not change in the first half of 2014.

Notes to the Accounts
- 142 -
The following table shows the outstanding assets, liabilities, guarantees and commitments as at June 30, 2014 for
each group of related parties according to IAS 24:
Directors and key personnel
Other related parties
Total% of carrying
amountFinancial assets held for trading - 30 30 0.29%Loans and receivables with customers 11 6,728 6,739 0.05%Other assets - 2,826 2,826 1.24%Total assets 11 9,584 9,595 0.06%Deposits from banks - 601 601 0.06%Deposits from customers 1,259 6,925 8,184 0.06%Other liabilities - 417 417 0.16%Total liabilities 1,259 7,943 9,202 0.06%Guarantees given and commitments - - - -(Amounts in € thousand)
Amounts at 06.30.2014
The following table sets out the impact of the above transactions with related parties on the main Income Statement
items, for each group of related parties.
Directors and key personnel
Other related parties
Total% of carrying
amountInterest income and similar revenues - 1 1 0.00%Interest expenses and similar charges (4) (8) (12) 0.04%Fee and commission revenues - 14,657 14,657 7.34%Fee and commission expensess (1) (269) (270) 0.26%Other administrative expenses - (4,042) (4,042) 3.78%Other net operating income 4 8 12 0.03%(Amounts in € thousand)
Income Statement at 06.30.2014
The category “Directors and key personnel" includes dealings with Directors and key personnel of FinecoBank
(excluding their fees, which are discussed in point 1. Details of Top Managers' Compensation) and the Parent
Company UniCredit, mainly concerning assets for credit card use, liabilities for funds held with the Bank and profits
and losses generated from the aforesaid assets and liabilities.
The “other related parties” category includes:
- close family members of key management personnel (i.e. those family members who, as is expected, may
influence - or be influenced by - the person in question);
- companies controlled (or jointly controlled) by, or associated with, "key management personnel" or their close
family members;
- associates, and their subsidiaries, of the Parent Company UniCredit;
- shareholders, and their subsidiaries, of the Parent Company UniCredit.
Transactions with “Other related parties”, mainly refer to:
assets for credit card use, liabilities for funds held with the Bank or securities lending transactions guaranteed by
sums of money;
assets for current receivables associated with the provision of financial services, mainly referring to fees for the
placement of asset management and insurance products principally carried out for Aviva S.p.A., BlackRock
(Channel Islands) Limited, CNP UniCredit Vita S.p.A., CreditRas Vita S.p.A. and Pimco Europe Ltd.;

Notes to the Accounts
- 143 -
profits and losses generated from the above assets and liabilities, mainly referring to subscription and management
fee and commission income relative to the placement of asset management and insurance products.
The above item "Other related parties" does not include amounts as at June 30, 2014 and the income components
accrued in the first half of 2014 relating to the Parent Company UniCredit and the UniCredit group companies, which
are presented further below.
TRANSACTIONS WITH THE PARENT COMPANY AND OTHER UNICREDIT GROUP COMPANIES
Total Transactions with UniCredit group companies Total 06.30.2014 % of carryingamount
Assets 13,475,042 82.60%Financial assets held for trading 39 0.37%Loans and receivables with banks 13,446,662 99.78%Loans and receivables with customers 13,315 1.91%Hedging derivative assets 9,926 100.00%Other assets 5,100 2.24%
Liabilities 1,448,626 8.88%Deposits from banks 995,453 96.94%Deposits from customers 371 0.00%Debt securities in issue 421,965 100.00%Financial liabilities held for trading 23 0.47%Hedging derivative liabilities 38,580 100.00%Tax liabilities (17,629) -33.28%Other liabilities 9,863 3.79%
Guarantees 266,070 45.42%Guarantees given 266,070 45.42%
Income StatementInterest income and similar revenues 130,043 86.86%Interest expenses and similar charges (3,311) 9.80%Fee and commission revenues 43,404 21.73%Fee and commission expensess (2,613) 2.54%Gains (losses) on financial assets and liabilities held for trading 725 5.63%Fair value adjustments in hedge accounting (7,158) n.d.Gains (losses) from disposal or repurchase 481 n.d.Administrative costs (9,504) 6.85%Other net operating income 125 0.35%(Amounts in € thousand)

Notes to the Accounts
- 144 -
The following table summarizes transactions with UniCredit group companies as at June 30, 2014:
Company Assets Liabilities Guarantees and Income Statementcommitments
Unicredit S.p.A. 13,444,888 1,415,032 266,070 127,233Unicredit Bank AG 15,770 10,520 - 1,481Unicredit Bank AG Milano 519 14,899 - (10,869)Direktanlage.AT AG 37 979 - 95Unicredit Credit Management Bank S.p.A. - 87 - (50)Localmind S.p.A. - 119 - (2)Unicredit Luxemburg Finance SA - - - 35Unicredit Business Integrated Solutions S.C.p.A. 507 3,116 - (6,621)Pioneer Investment Management SGR p.A. 1,463 122 - 5,246Fineco Leasing S.p.A. - 253 - 277Dab Bank AG 2 3,474 - 343Cordusio Società Fiduciaria per Azioni 112 25 - 13Pioneer Asset Management SA Luxemburg 11,744 - - 35,011Total 13,475,042 1,448,626 266,070 152,192(Amounts in € thousand)
The following tables contain a breakdown of the items relating to Assets, Liabilities, Costs and Revenue for each
company of the Group.
Transactions with parent companies
Transactions with UniCredit S.p.A. Total 06.30.2014
Assets 13,444,888Loans and receivables with banks 13,430,372Hedging derivative assets 9,926Other assets 4,590Liabilities 1,415,032Deposits from banks 980,504Debt securities in issue 421,965Hedging derivative liabilities 23,863Tax liabilities (17,629)Other liabilities 6,329Guarantees 266,070Guarantees given 266,070Income Statement 127,233Interest income and similar revenues 130,596Interest expenses and similar charges (3,292)Fee and commission revenues 820Fee and commission expensess (2,171)Fair value adjustments in hedge accounting 3,358Gains (losses) from disposal or repurchase 481Administrative costs (2,569)Other net operating income 10(Amounts in € thousand)

Notes to the Accounts
- 145 -
Transactions with companies controlled by UniCredit S.p.A.
Transactions with UniCredit Bank AG Total 06.30.2014
Assets 15,770Loans and receivables with banks 15,770Liabilities 10,520Deposits from banks 10,520Income Statement 1,481Interest income and similar revenues 199Interest expenses and similar charges (12)Fee and commission revenues 1,294(Amounts in € thousand)
Transactions with UniCredit Bank AG, Milan Total 06.30.2014
Assets 519Loans and receivables with banks 519Liabilities 14,899Hedging derivative liabilities 14,716Other liabilities 183Income Statement (10,869)Interest income and similar revenues (752)Fee and commission revenues 553Fee and commission expenses (3)Fair value adjustments in hedge accounting (10,517)Administrative costs (150)(Amounts in € thousand)
Transactions with Direktanlage.AT AG Total 06.30.2014
Assets 37Financial assets held for trading 37Liabilities 979Deposits from banks 970Financial liabilities held for trading 9Income Statement 95Interest expenses and similar charges (2)Fee and commission revenues 6Fee and commission expenses (49)Gains (losses) on financial assets and liabilities held for trading 140(Amounts in € thousand)
Transactions with UniCredit Credit Management Bank S.p.A. Total 06.30.2014
Liabilities 87Other liabilities 87Income Statement (50)Administrative costs (50)(Amounts in € thousand)

Notes to the Accounts
- 146 -
Transactions with Localmind S.p.A. in liquidation Total 06.30.2014
Liabilities 119Deposits from customers 119Income Statement (2)Interest expenses and similar charges (2)(Amounts in € thousand)
Transactions with UniCredit Luxembourg Finance SA Total 06.30.2014
Income Statement 35Fee and commission revenues 35(Amounts in € thousand)
Transactions with UniCredit Business Integrated Solutions S.C.p.A. Total 06.30.2014
Assets 507Other assets 507Liabilities 3,116Other liabilities 3,116Income Statement (6,621)Administrative costs (6,737)Other net operating income 116(Amounts in € thousand)
Transactions with Pioneer Investment Management SGR p.A. Total 06.30.2014
Assets 1,463Loans and receivables with customers 1,463Liabilities 122Other liabilities 122Income Statement 5,246Fee and commission revenues 5,346Fee and commission expenses (100)(Amounts in € thousand)
Transactions with Fineco Leasing S.p.A. Total 06.30.2014
Liabilities 253Deposits from customers 253Income Statement 277Interest expenses and similar charges (1)Fee and commission revenues 278(Amounts in € thousand)

Notes to the Accounts
- 147 -
Transactions with Dab Bank AG Total 06.30.2014
Assets 2Financial assets held for trading 2Liabilities 3,474Deposits from banks 3,460Financial liabilities held for trading 14Income Statement 343Interest expenses and similar charges (3)Fee and commission revenues 32Fee and commission expenses (270)Gains (losses) on financial assets and liabilities held for trading 584(Amounts in € thousand)
Transactions with Cordusio Società Fiduciaria per Azioni Total 06.30.2014
Assets 112Loans and receivables with customers 109Other assets 3Liabilities 25Other liabilities 25Income Statement 13Fee and commission revenues 31Fee and commission expenses (21)Administrative costs 3(Amounts in € thousand)
Transactions with Pioneer Asset Management SA Luxembourg Total 06.30.2014
Assets 11,744Loans and receivables with customers 11,744Income Statement 35,011Fee and commission revenues 35,011(Amounts in € thousand)

Notes to the Accounts
- 148 -
PART I – SHARE-BASED PAYMENTS
A. Qualitative information
1. Description of share-based payments
1.1 Outstanding instruments
Group Medium & Long Term Incentive Plans for employees that will be settled with shares of the Parent Company
UniCredit, include the following categories:
- Stock Options allocated to selected Top & Senior Managers and Key Talents and consisting of rights to subscribe
UniCredit shares.
- Performance Stock Options & Performance Shares allocated to selected Top & Senior Managers and Key
Talents of the Group and consisting respectively of subscription rights and free UniCredit ordinary shares that the
Parent Company undertakes to grant, conditional upon achieving performance targets approved by the Parent
Company’s Board.
- Employee Share Ownership Plan (ESOP), which offers eligible Company employees the possibility to buy
UniCredit ordinary shares with the following advantages: granting of free ordinary shares (or the rights to receive
them) measured on the basis of the shares purchased by each Participant ("Investment Shares") during the
"Enrolment Period". The granting of free ordinary shares is subordinated to vesting conditions (other than market
conditions) stated in the Plan Rules.
- Group Executive Incentive System that offers eligible Group Executives a variable remuneration for which
payment will be made in five years. For the first two years, the beneficiaries receive cash payments, while in the
subsequent years they receive payment in cash and shares, in relation to the achievement of individual and Group
performance targets set in the Plan Rules.
- Share Plan For Talent, offering eligible key talents free UniCredit ordinary shares that the Parent Company
undertakes to grant, upon achievement of performance targets set by the Parent Company's Board of Directors.
- Group Executive Incentive System 2014 (Bonus Pool), offering selected Executives and relevant personnel
identified on the basis of regulatory requirements, a bonus structure consisting of immediate payments (following
performance evaluation) and deferred payments in cash and ordinary UniCredit shares, over a period of 6 years
(immediate payment for 1 year and deferred payments for 5 years). This payment structure ensures that bonuses
are aligned to shareholders’ interests and is subject to malus clauses (which apply in the event that specific
profitability, liquidity and capital thresholds are not met both at Group level and at Country/Division level) and
clawback clauses (to the extent they are legally applicable) in accordance with the plan rules (both vesting
conditions other than market conditions).
In addition to the outstanding instruments described above and replacing the Group Executive Incentive System 2014
(Bonus Pool), on May 15, 2014, the Board of Directors of FinecoBank approved the Regulations for the plans
described below, the guidelines of which had already been approved by the Board of Directors on April 15, 2014 with
execution conditional upon listing. The regulations were approved by the shareholders’ meeting of FinecoBank on
June 5, 2014.

Notes to the Accounts
- 149 -
In particular, the following plans were approved:
1) Group Incentive System - "2014 Group Incentive System - SVP and other key personnel with bonus <500k" and
"2014 Group Incentive System - EVP and higher levels and other key personnel with bonus> 500k"
This is an incentive system for "key personnel", comprising two distinct UniCredit Group short-term plans. These
plans (the "Incentive Systems 2014") provide for the payment of cash to the beneficiaries (50% of the accrued
bonus) and, limited to beneficiaries who are employees of Fineco, the assignment of free shares of the Bank (the
remaining 50%). Under the Incentive Systems 2014, the total variable remuneration to be paid to beneficiaries in
2015 is determined and allocated according to a "bonus pool” approach. The Bank’s bonus pool will be determined
based upon the performance of the Bank and of the business at UniCredit Group level, in line with UniCredit
Group’s overall results. More specifically, the bonus pool and, consequently, the bonus granted to beneficiaries
may be reduced if UniCredit Group as a whole does not achieve minimum profitability, liquidity and capital targets
(“entry condition”), in application of the "solidarity” principles advocated by the Bank of Italy in the field of
remuneration and incentives. Within the bonus pool, bonuses will be granted to beneficiaries in relation to the
achievement of individual targets - achieved in 2014 - linked to the Bank’s strategic plan and related to profitability
and sustainability objectives over time (i.e. economic results actually achieved and how they will be achieved). The
payment of bonuses will also be linked to the observance of corporate values and of compliance and conduct rules
at the individual level. At the end of the reporting period, on the basis of results, the Board of Directors of the Bank
will determine the overall bonus pool for beneficiaries - who are employees of the Bank - and will define the exact
number of shares to be granted, on the basis of the average price of Fineco shares during the 30 trading days
preceding the date of the relevant Board of Directors’ meeting. A portion of the individual bonus will be paid to
beneficiaries in deferred tranches, spread over a 6 year period (2015-2020), in order for the remuneration to reflect
the risks assumed by the Bank and UniCredit Group in the performance of their business over time. During that
period, the still unpaid portion of the bonus may be reduced on the basis of minimum profitability, liquidity and
capital results (zero factor) simultaneously achieved by the Company and the relevant business at UniCredit Group
level, and by UniCredit Group as a whole. Payment of the deferred bonus tranches shall also be subject to
verification that the beneficiary is still an employee of the Company or other companies of the UniCredit Group and
that it is in compliance with the internal and external regulations in force at the time.
2) 2014 - 2017 Multi-year Plan – Top management”
This is a stock granting plan for the top management of the Bank. This plan, whose execution was conditional upon
the listing of the Bank, provides for the free assignment of newly issued FinecoBank shares to the beneficiaries.
The above shares will be granted to beneficiaries in 4 annual instalments, of which the first on completion of the
listing and the subsequent ones in 2015, 2016 and 2017. On those dates, the number of shares actually allocated
may decrease if - on the basis of the market value of Fineco shares on those dates - a reduction were necessary to
keep the ratio between the variable and fixed part of the remuneration within the limits set by applicable
regulations. In order to ensure a more appropriate balance between the short- and long-term variable components
of the remuneration, the Board of Directors may reduce the value of the variable remuneration granted under the
Top Management Plan to a limit of 1:1 with respect to fixed remuneration. The shares granted as above will vest
over a three-year period (in 2017 for the first tranche, and in 2020 for the fourth). Vesting is subject to the following
conditions: (i) the beneficiary is still employed by the Bank; (ii) the beneficiary has observed internal and external

Notes to the Accounts
- 150 -
regulations in force; (iii) long-term sustainability, in terms of the Bank's profitability and solidity, verified during the
vesting period prior to each payment, has been maintained.
3) “2014 Plan – Key people”
This is a stock granting plan for executives and employees of the Bank (other than the "Top Management Plan”
beneficiaries) who, in the Bank’s opinion, can significantly contribute to the Bank’s profitability and sustainability
(“Key People Plan”), due to their role, skills and potential. This plan provides for the free assignment to the
beneficiaries of newly issued FinecoBank shares whose overall number is determined on the basis of the Global
Offer and notified to the concerned parties. The shares determined as above will vest in favour of the beneficiaries
in 3 annual instalments, of which the first in 2015 and the last in 2017 (vesting period), unless the Board of
Directors decides that a longer vesting period applies, limited to beneficiaries who are "key persons" (as defined by
the Bank of Italy Regulation concerning incentives and remuneration). Vesting is subject to the following conditions:
(i) long-term sustainability, in terms of the Bank's profitability and solidity, verified during the vesting period prior to
each payment, has been maintained; (ii) the beneficiary is still employed by the Bank; (iii) the beneficiary has
observed internal and external regulations in force.
Shares for the plans referred to in points 1), 2) and 3) will be issued through free capital increases in accordance with
Article 2349 of the Italian Civil Code. For the resolutions pertaining to the maximum number of shares that may be
assigned under these plans and the related dilutive effect for shareholders resulting from the gratuitous capital
increases, please refer to Part A.1 - Section 3 - Subsequent Events of these Notes.
4) “2014 Plan - PFA”
This is a stock granting plan for financial advisors in the Bank’s network, with the exception of financial advisors
who are beneficiaries of network entry incentives during 2014 (“PFA Plan 2014”). Under the plan, beneficiaries will
receive FinecoBank ordinary shares whose total number will be determined on the basis of the average market
price of FinecoBank shares during the 30 trading days preceding the share allocation to the beneficiaries. This
assignment (and consequent notice to beneficiaries of the number of shares set) will take place in March 2015,
following approval of the 2014 draft financial statements, and is subject to the Bank's entire network of financial
advisors meeting their net sales targets in 2014. In any case, failure by the Bank’s entire network of financial
advisors to meet the pre-defined net sales target shall not preclude the assignment of the benefit; in this case, the
amount to be paid in shares is set according to decreasing parameters in line with the deviation from the target.
The number of shares allocated to each beneficiary shall be determined on the basis of: (i) the size of the portfolio
(calculated taking into account its various components) held by the beneficiary (if the beneficiaries are the financial
advisors) or by the financial advisors who are part of the network section coordinated by a single manager (if the
beneficiaries are the network managers) at the end of the reporting period; and (ii) the level of performance, in
percentage terms, with respect to the achievement of quantitative and qualitative targets respectively of the
beneficiary (if the beneficiaries are the financial advisors) or of the financial advisors who are part of the network
section coordinated by a single manager (if the beneficiaries are the network managers) for the reporting period.
The said shares will vest in favour of the beneficiaries in 3 annual instalments, of which the first in 2015 and the last
in 2017 (vesting period), unless the Board of Directors decides that a longer vesting period applies, limited to
beneficiaries who are "key persons” of the network (as defined by the Bank Italy Regulation concerning incentives

Notes to the Accounts
- 151 -
and remuneration), where provided by the applicable regulatory provisions. Vesting is subject to the following
conditions: (i) long-term sustainability, in terms of the Bank's profitability and solidity, verified during the vesting
period prior to each payment, has been maintained; (ii) the beneficiary is still acting as agent for the Bank; (iii) the
beneficiary has observed internal and external regulations in force. The maximum value of shares to be allocated
under the 2014 PFA Plan is €14,953,000.
5) “2015 - 2017 Plan - PFA”
This is a stock granting plan for financial advisors of the Bank's network, including – as of January 1 of the year
after the one in which entry incentives have expired – financial advisors who received network entry incentives over
the 2015 - 2017 period (“2015-2017 Plan -PFA”). Under the plan, beneficiaries shall receive ordinary shares of the
Bank, in proportion to the period of their participation in the plan, the total number of which shall be determined on
the basis of the average market price of Fineco shares during the 30 trading days preceding the share allocation to
the beneficiaries. This assignment (and consequent notice to beneficiaries of the number of shares set) will take
place in March 2018, following approval of the 2017 draft financial statements, and is subject to the Bank's entire
network of financial advisors meeting a cumulative net sales target for the three-year period 2015-2017. In any
case, failure by the Bank’s entire network of financial advisors to meet the pre-defined net sales target shall not
preclude the assignment of the benefit; in this case, the plan provides for the assignment of a decreasing number
of shares in line with the deviation from the target. The number of shares that will be allocated to each beneficiary
shall be determined on the basis of: (i) the size of the portfolio (calculated taking into account its various
components) held by the beneficiary (if the beneficiaries are the financial advisors) or by the financial advisors who
are part of the network section coordinated by a single manager (if the beneficiaries are the network managers);
and (ii) the level of performance, in percentage terms, with respect to the achievement of quantitative and
qualitative targets respectively of the beneficiary (if the beneficiaries are the financial advisors) or of the financial
advisors who are part of the network section coordinated by a single manager (if the beneficiaries are the network
managers). These individual targets are defined for each year of the reference period and for the three years
cumulatively. In any case, the benefit that will be paid to each beneficiary will be such that, where required by
applicable law, the ratio between the recurring and the non-recurring part of the remuneration laid down by the
applicable law is respected in each of the years in question. To this end, the Bank will send each of the plan’s
beneficiaries a communication for the achievement of the annual target and the cumulative target in relation to any
previous years. Failure to meet the annual target does not prevent the beneficiary from receiving the bonus,
provided that he/she reaches the three-year target. The shares will vest in favour of and be assigned to the
beneficiaries in 3 annual instalments, of which the first in 2018 and the last in 2020 (vesting period), unless the
Board of Directors decides that a longer vesting period applies, limited to beneficiaries who are "key persons” of the
network (as defined by the Bank Italy Regulation concerning incentives and remuneration), where provided by the
applicable regulatory provisions. Vesting is subject to the following conditions: (i) long-term sustainability, in terms
of the Bank's profitability and solidity, verified during the vesting period prior to each payment, has been
maintained; (ii) the beneficiary is still acting as agent for the Bank; (iii) the beneficiary has observed internal and
external regulations in force. The maximum value of shares to be allocated under the 2015-2017 PFA Plan is
€19,969,000.

Notes to the Accounts
- 152 -
Shares to be allocated under the plans referred to in points 4) and 5) will be purchased by the Bank on the market on
the basis of an authorization by the Shareholders' Meeting pursuant to Article 2357 of the Italian Civil Code.
1.2 Measurement model
1.2.1 Stock Options and Performance Stock Options
The Hull and White Evaluation Model has been adopted to measure the economic value of Stock Options and
Performance Stock Options.
This model is based on a trinomial tree price distribution using the Boyle's algorithm and estimates the early exercise
probability on the basis of a deterministic model connected to:
- reaching a Market Share Value equal to an exercise price-multiple (M);
- probability of beneficiaries' early exit (E) after the end of the Vesting Period.
No new Performance Stock Option Plans were granted during 2014.
1.2.2 Other equity instruments - Share Plan for Talent
The plan offers free UniCredit ordinary shares, granted in three instalments, each with annual vesting, to selected
beneficiaries.
The economic value of Performance Shares is measured considering the share market price at the grant date less the
present value of the future dividends during the performance period. Parameters are estimated by applying the same
model used for Stock Options measurement.
No new Performance Shares’ Plans were granted during 2014.
1.2.3 Group Executive Incentive System
The amount of the incentive will be determined on a basis of the achievement of quantitative and qualitative goals
stated by the plan. In particular, the overall evaluation is expressed as a percentage, from a minimum of 0% to a
maximum of 150% (non market vesting conditions). This percentage, adjusted by the application of a risk/opportunity
factor – Group Gate – at first payment, multiplied by the incentive will determine the effective amount that will be paid
to the beneficiary. The Group Gate applies to all payments under the Group Incentive System 2013 for Executive Vice
Presidents (EVP).
The balance-sheet and income statement effects are spread according to the term of the Plans.

Notes to the Accounts
- 153 -
Group Executive Incentive System 2013 - Shares
The economic value of shares granted is measured considering the share market price at the grant date less the
present value of the future dividends during the performance period.
Shares granted
Group Executive Incentive System 2013
First
instalment (2016)
Second instalment
(2017)
Third instalment7
(2018) Bonus Opportunity Economic Value - (Grant Date) 01.29.2013 01.29.2013 01.29.2013 Number of Shares - Date of Board resolution 03.11. 2014 03.11. 2014 03.11. 2014 Vesting Period Start Date 01.01.2013 01.01.2013 01.01.2013 Vesting Period End Date 12.31.2015 12.31.2016 12.31.2017 UniCredit Share Market Price [€] 5.862 5.862 5.862 Average Economic Value of Vesting conditions [€] -0.200 -0.299 -0.427 Performance Shares Fair Value per unit at Grant Date [€] 5.662 5.563 5.435
Group Executive Incentive System 2014 (Bonus Pool)
The new incentive system 2014 is based on a bonus pool approach, in line with regulatory requirements and market
practices; this approach sets out:
• the system’s sustainability, by linking it directly to business results and aligning it to relevant risk categories through
specific indicators that reflect the risk appetite framework;
• the link between the bonus and our organizational structure, the bonus pool being defined at Country/Division level
and further consolidated at Group level;
• the allocation of bonuses to beneficiaries identified as Executives and other key personnel on the basis of criteria
laid down in the Regulation of the European Banking Association, and to other specific roles, based on local
regulatory requirements;
• a payment structure that spans a period of 6 years (immediate payment for 1 year plus 5 deferred years) with
immediate and deferred payments in cash and shares, fully aligned with the latest regulatory requirements.
The profit and loss and net equity effects will be recognized on the basis of the instruments' vesting period.
1.2.4 Employee Share Ownership Plan (Piano Let’s Share 2014)
The following table shows the parameters used in relation to the Free Shares (or rights to receive them) associated
with the "Employee Share Ownership Plan" approved in 2013 (ESOP 2014).
Measurement of Free Shares ESOP 2014
Free Shares
First instalment
Free Shares Second
instalment Date of granting of Free Shares to Group employees 02.05.2014 To be defined Vesting Period Start Date 01.01.2014 07.31.2014 Vesting Period End Date 01.01.2015 07.31.2015 Free Shares Fair Value per unit [€] 5.774 To be defined
7 Only for Plans assigned to the Executive Vice Presidents

Notes to the Accounts
- 154 -
All the income statement and balance-sheet effects of the plan, relating to the Free Shares granted are recognized
during the vesting period (except for the adjustments which, in line with the plan rules, are recorded at the first closing
after the vesting period).
B. Quantitative information
Effects on Profit and Loss
Stock granting plans involving shares of the Bank, and whose execution is subject to the outcome of the Public
Offering and admission to listing on the MTA market - Borsa Italiana of FinecoBank ordinary shares, will show their
balance-sheet and income statement effects during the vesting period, as of the 2nd half of 2014.
The income statement and balance-sheet effects of share-based incentive systems of the Parent Company UniCredit
are shown below.
Financial statement presentation related to share-based payments
Total Vested Plans Total Vested PlansCosts 386 571 - connected to Equity Settled Plans 386 571Debts paid to UniCredit S.p.A. forvested plans 1 -Debts due to UniCredit S.p.A.1 1,889 1,610(Amounts in € thousand)
06.30.2014 06.30.2013
1Amount equal to the economic value accrued for services rendered by employees that are the beneficiaries of the plans that grant UniCredit
shares.

Notes to the Accounts
- 155 -
PART L – SEGMENT REPORTING
The Bank does not provide segment reporting information as its business model provides for a high level of integration
among its different activities. FinecoBank offers its services (banking and investment services) through a network of
financial advisors and online and mobile channels, that operate in a coordinated and integrated manner. The fully-
comprehensive nature of the services offered allows the Bank to act as a one-stop solution for customers' banking and
investment requirements.
This strategy, which is strongly anchored to the customer, means that revenues and margins relative to various
products/services (investing, banking and brokerage) are highly interdependent on each other.
This integration approach has also inspired top management in setting company targets and identifying the means to
achieve them.
As regards information on revenues from customers by product/service, in view of the above, reference should be
made to information in Part C - Information on the income statement of these notes.
FinecoBank mainly targets retail customers in Italy; information concerning geographic segments and the degree of
dependency on main customers is therefore considered by top management as not being of material importance for
information purposes, and is not therefore disclosed.

Condensed half-year financial statements certification pursuant to art. 81-ter of Consob Regulation no. 11971 of May 14, 1999, as amended
Condensed half-year financial
statements certification
pursuant to art. 81-ter of
Consob Regulation no. 11971
of May 14, 1999, as amended

Condensed half-year financial statements certification pursuant to art. 81-ter of Consob Regulation no. 11971 of May 14, 1999, as amended
- 157 -
1. The undersigned, Alessandro Foti, as Managing Director of FinecoBank S.p.A., and Lorena Pelliciari, as Nominated
Official in charge of drawing up the Company Accounts of FinecoBank S.p.A, taking into account the provisions of
Article 154-bis, par. 3 and 4 of Legislative Decree 58 of February 24, 1998, do hereby certify:
• the adequacy in relation to the Company’s features and
• the actual application
of the administrative and accounting procedures for drawing up the condensed half-year financial statements, in the
first half of 2014.
2. The adequacy of the administrative and accounting procedures employed to draw up the condensed half-year
financial statements has been evaluated by applying a model defined within the UniCredit Group, in accordance with
the “Internal Controls - Integrated Framework (CoSO)” and the “Control Objective for IT and Related Technologies
(Cobit)]”, which are international commonly accepted standards for the internal control system and for financial
reporting.
3. The undersigned also certify that:
3.1 The condensed half-year financial statements:
a) were prepared in compliance with applicable international accounting standards recognized by the European
Community pursuant to European Parliament and Council Regulation 1606/2002 of July 19, 2002;
b) correspond to the results of the books and accounting records;
c) are suitable to provide an accurate representation of the financial position and performance of the issuer;
3.2 the Interim Report on Operations includes a reliable analysis of the most significant events in the first six
months of the financial year and their impact on the condensed half-year financial statements, together with a
description of the main risks and uncertainties concerning the remaining six months of the year. The Interim Report
on Operations also contains a reliable analysis of information on significant related-party transactions.
Milan – August 1, 2014
Alessandro Foti Lorena Pelliciari

Follow us �neco.it | 800.92.92.92