
First Half and Second Quarter Financial Results Fiscal … on Micro Piezo print heads ... with high...
34
October 25, 2006 First Half and Second Quarter Financial Results First Half and Second Quarter Financial Results Fiscal Year 2006 Fiscal Year 2006 (Ending March 2007) (Ending March 2007)
Transcript of First Half and Second Quarter Financial Results Fiscal … on Micro Piezo print heads ... with high...

October 25, 2006
First Half and Second Quarter Financial ResultsFirst Half and Second Quarter Financial Results
Fiscal Year 2006Fiscal Year 2006
(Ending March 2007)(Ending March 2007)

1
Disclaimer
When reviewing this information please note that the information wascreated as of the date of the information, should be considered in thecontext of the circumstances prevailing at that time and is only correct asof that date. The information contains certain forward-looking statementsthat are subject to known and unknown risks and uncertainties that couldcause actual results to differ materially from those expressed or implied bysuch statements. Such risks and uncertainties include, but are not limitedto, the competitive environment, market trends, general economicconditions, exchange rate fluctuations and our ability to continue to timelyintroduce new products and services.
This report is a simple translation of the Japanese version of secondquarter financial results of FY2006 explanatory presentation prepared inJapanese. No reclassification nor rearrangement has been made.
Numerical values: Any portion of an amount less than the unit stNumerical values: Any portion of an amount less than the unit stated is disregarded.ated is disregarded.Percentages: Rounded off to one decimal place.Percentages: Rounded off to one decimal place.

2
2. FY2006 Business Outlook2. FY2006 Business Outlook
1. FY2006 1H Financial Results1. FY2006 1H Financial Results

3
11
22
33
44
55
Give direction to the inkjet-related product portfolio
Refo
rmP
lanfo
rR
eform
Plan
for
Imp
rovin
gE
arnin
gs
Po
tential
Imp
rovin
gE
arnin
gs
Po
tential
Isin
Pro
gress
Isin
Pro
gress
Redefine & reinforce the business and product portfolioRedefine & reinforce the business and product portfolio
Reorganize the electronic device businessesReorganize the electronic device businesses
Streamline costsStreamline costs
Reform the governance systemReform the governance system
Reform the corporate cultureReform the corporate culture
Promote structural and overall staffing structure reforms
Introduce a corporate executive officer system to clarify corporate executiondecisions and supervision, reduce the number of directors, reduce directorterms to one year and increase importance of annual performance evaluations
Go back to the spirit of "Creativity and challenge," "S&A," and "One Epson" toradically boost earnings potential and ensure solid future growth.
Epson GroupMid-Range Business Policies
Epson GroupEpson GroupMidMid--Range Business PoliciesRange Business Policies
Promote thorough design-to-cost and cost streamlining
Reform Plan for Improving Earnings PotentialReform Plan for Improving Earnings Potential—— FirstFirst--Half ProgressHalf Progress ——

4
Developed inkjet system for color filter fabrication
Enhance & expand inkjetprinter business segment
Developed industrial inkjet applicationsbased on Micro Piezo print heads
World's first gen-8-capable inkjetsystem for fabricating color filters(used at Sharp's Kameyama plant)
Use inkjet system to form alignment layeron HTPS panels for front projectors
Business segmentBusiness segment
Prototyped a 20-layer circuit board
Examining business expansion of machines forindustrial inkjet applications
Industrial segmentIndustrial segment
20-layer circuit board (front)
Color filter fabrication system
Specific business segments
Print-on-demand (POD) segment
Collaboration with business partners
World‘s first inkjet alignment layer0.6“XGA HTPS
Liquid crystal color filter
Develop Applications forDevelop Applications forMicro Piezo Print Head TechnologyMicro Piezo Print Head Technology
Inkjet printhead
Material inputMaterial input
Printing
Material
output
5
¥2.10
¥115.38
¥145.97
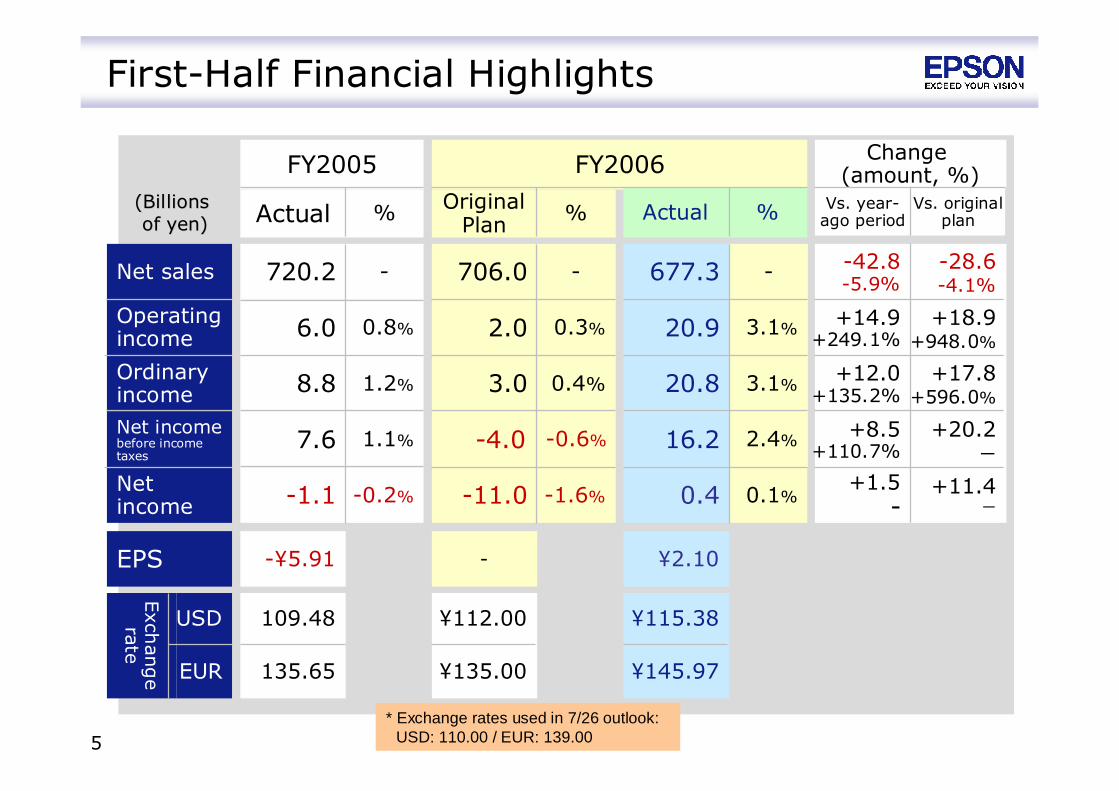
First-Half Financial Highlights
FY2006
Net sales
Operatingincome
Ordinaryincome
Netincome
%Actual
Net incomebefore incometaxes
Change(amount, %)FY2005
Actual %(Billions(Billionsof yen)of yen)
EPS
OriginalPlan % Vs. year-
ago periodVs. original
plan
USD
EUR
Exch
ange
rate
+18.9+948.0%
+17.8+596.0%
-28.6-4.1%
+20.2-
+11.4-
720.2
6.0
8.8
-1.1
0.8%
1.2%
-0.2%
-
7.6 1.1%
-¥5.91
3.1%
3.1%
0.1%
-
20.9
20.8
0.4
677.3
2.4%16.2
706.0
2.0
3.0
-11.0
0.3%
0.4%
-1.6%
-
-4.0 -0.6%
-
+14.9+249.1%
+12.0+135.2%
-42.8-5.9%
+8.5+110.7%
+1.5-
109.48
135.65
¥112.00
¥135.00
* Exchange rates used in 7/26 outlook:USD: 110.00 / EUR: 139.00
6
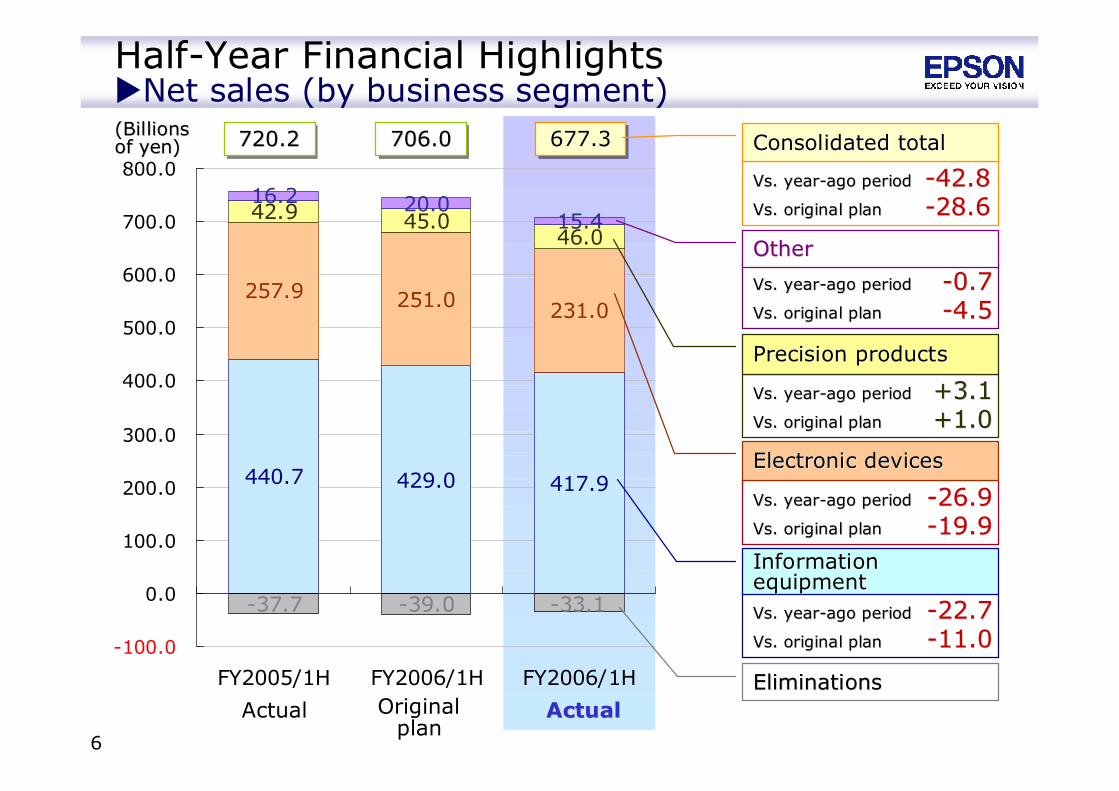
Vs. yearVs. year--ago periodago period --22.722.7Vs. original planVs. original plan --11.011.0
Vs. yearVs. year--ago periodago period --26.926.9Vs. original planVs. original plan --19.919.9
Vs. yearVs. year--ago periodago period +3.1+3.1Vs. original planVs. original plan +1.0+1.0
Vs. yearVs. year--ago periodago period --0.70.7Vs. original planVs. original plan --4.54.5
440.7 429.0 417.9
257.9 251.0 231.0
42.9 45.046.0
16.2 20.015.4
-33.1-37.7 -39.0
-100.0
0.0
100.0
200.0
300.0
400.0
500.0
600.0
700.0
800.0
FY2005/1H FY2006/1H FY2006/1H
Half-Year Financial HighlightsNet sales (by business segment)(Billions(Billionsof yen)of yen) 720.2720.2720.2 677.3677.3677.3706.0706.0706.0
InformationInformationeequipmentquipment
ElectronicElectronic ddevicesevices
PrecisionPrecision pproductsroducts
OtherOther
EliminationsEliminations
Vs. yearVs. year--ago periodago period --42.842.8Vs. original planVs. original plan --28.628.6
Consolidated totalConsolidated total
Actual Originalplan
ActualActual

7
Half-Year Financial HighlightsOperating income (by business segment)
15.0 15.0
32.3
-3.0 -7.0 -8.3
1.0 1.0
-7.3-7.0 -6.2
2.7
-20.0
-10.0
0.0
10.0
20.0
30.0
40.0
50.0
60.0
70.0
80.0
FY2005/1H FY2006/1H FY2006/1H
6.06.06.0 20.920.920.92.02.02.0
InformationInformationequipmentequipment
Electronic devicesElectronic devices
Precision productsPrecision products
OtherOther
Vs. yearVs. year--ago periodago period +17.2+17.2Vs. original planVs. original plan +17.3+17.3
Vs. yearVs. year--ago periodago period --5.25.2Vs. original planVs. original plan --1.31.3
Vs. yearVs. year--ago periodago period +1.7+1.7Vs. original planVs. original plan +1.7+1.7
Vs. yearVs. year--ago periodago period +1.0+1.0Vs. original planVs. original plan +0.7+0.7
Vs. yearVs. year--ago periodago period +14.9+14.9Vs. original planVs. original plan +18.9+18.9
Consolidated totalConsolidated total
Actual ActualActual
(Billions(Billionsof yen)of yen)
Originalplan
8
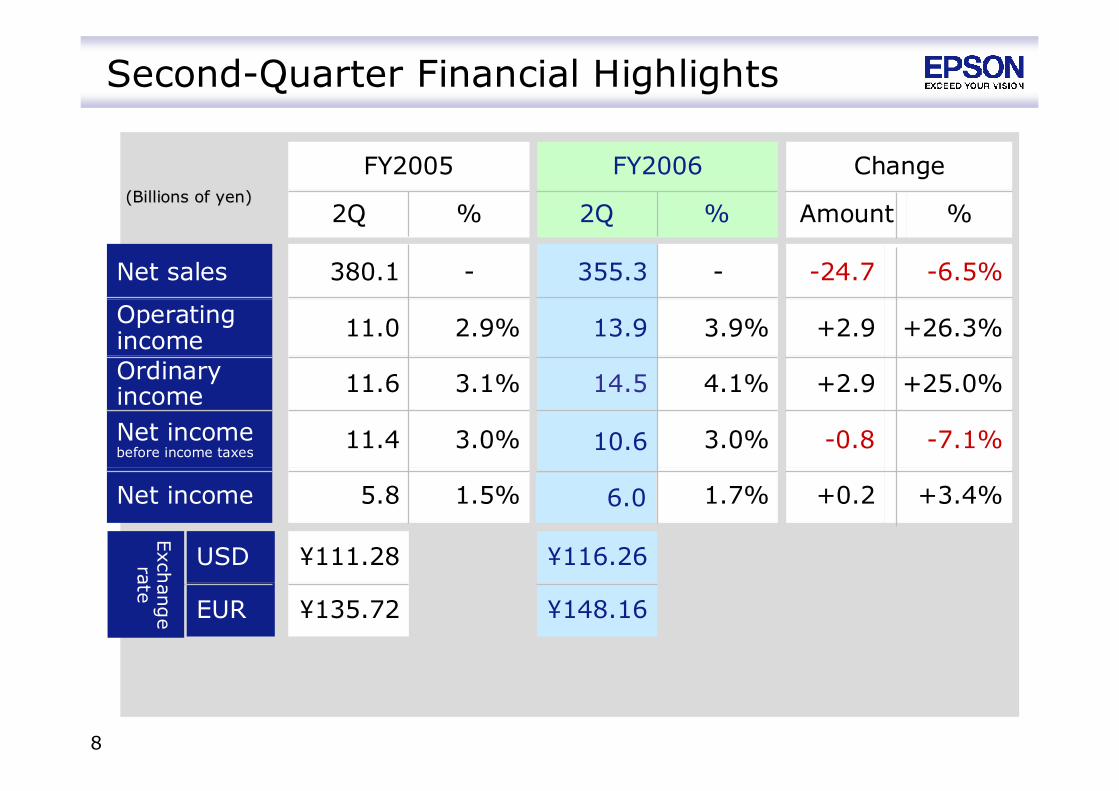
¥116.26
¥148.16
Second-Quarter Financial Highlights
Net sales
OperatingincomeOrdinaryincome
Net income
Net incomebefore income taxes
(Billions of yen)(Billions of yen)
USD
EUR
3.9%
4.1%
1.7%
+2.9
+2.9
+0.2
+26.3%
+25.0%
380.1
11.0
11.6
5.8
¥111.28
¥135.72
- -24.7 -6.5%
13.9
14.5
355.3
FY2006
%2Q
2.9%
3.1%
1.5%
-
3.0% -0.811.4 10.63.0% -7.1%
+3.4%
Change
Amount %
FY2005
2Q %
6.0
Exch
ange
rate

9
Quarterly Net SalesBy business segment
228.7297.0
238.6200.7 217.2
140.8
147.0
121.9
109.1121.8
22.5
22.9
19.8
20.026.0
8.3
7.6
9.1
8.0
7.4
-19.5 -15.3 -15.9 -17.2-20.3
-50.0
0.0
50.0
100.0
150.0
200.0
250.0
300.0
350.0
400.0
450.0
500.0
2005/2Q 2005/3Q 2005/4Q 2006/1Q 2006/2Q
(Billions(Billionsof yen)of yen) 355.3355.3355.3455.1455.1455.1
InformationInformationEquipmentEquipment
ElectronicElectronicDevicesDevices
PrecisionPrecisionProductsProducts
OtherOther
--0.80.8
EliminationsEliminations
+3.4+3.4
--18.918.9
--11.411.4
380.1380.1380.1 374.2374.2374.2 322.0322.0322.0
Versus theVersus theyearyear--ago periodago period
Versus theVersus theyearyear--ago periodago period
Versus theVersus theyearyear--agoago periodperiod
Versus theVersus theyearyear--ago periodago period

10
Quarterly Net Sales ComparisonInformation equipment
194.9 183.3
25.627.4
9.66.6
-0.2-1.5
-20.0
0.0
20.0
40.0
60.0
80.0
100.0
120.0
140.0
160.0
180.0
200.0
220.0
240.0
260.0
2005/2Q 2006/2Q
(Billions(Billionsof yen)of yen) 228.7228.7228.7 217.2217.2217.2
PrintersPrinters
Visual InstrumentsVisual Instruments
PC, OtherPC, Other
EliminationsEliminations
--3.03.0
+1.7+1.7
--11.511.5
% sales% sales‘‘05/2Q05/2Q '06/2Q'06/2Q
IJPIJP 62%62% 60%60%LPLP 15%15% 14%14%BSBS 18%18% 21%21%SCN, otherSCN, other 5%5% 5%5%
% sales% sales‘‘05/2Q05/2Q '06/2Q'06/2Q
PRJPRJ 71%71% 84%84%PTVPTV 13%13% 5%5%OtherOther 16%16% 11%11%
VVersus theersus theyearyear--ago periodago period
VVersus theersus theyearyear--ago periodago period
VVersus theersus theyearyear--ago periodago period
••Front PRJ: Sales of businessFront PRJ: Sales of business& home units remained& home units remainedstrongstrong
••IJP: Sales that emphasizeIJP: Sales that emphasizeprofitability, switch to newprofitability, switch to newmodels in the 2nd halfmodels in the 2nd half
••LP: Emphasized modelsLP: Emphasized modelswith high PV & profitabilitywith high PV & profitability
••BS: TM & SIDM remainedBS: TM & SIDM remainedstrongstrong
** IJP: Inkjet printerIJP: Inkjet printerLP: Laser printerLP: Laser printerBS: Business systemsBS: Business systemsTM: Terminal moduleTM: Terminal moduleSIDM: SerialSIDM: Serial--impactimpact
dot matrix printerdot matrix printerSCN: ScannerSCN: ScannerPRJ: ProjectorPRJ: ProjectorPTV: Projection TVPTV: Projection TV

11
Quarterly Net Sales ComparisonElectronic devices
104.5
75.2
26.9
24.9
13.7
26.2
-4.5-4.3
-20.0
0.0
20.0
40.0
60.0
80.0
100.0
120.0
140.0
160.0
2005/2Q 2006/2Q
140.8140.8140.8 121.8121.8121.8
DisplaysDisplays
SemiconductorsSemiconductors
Quartz DevicesQuartz Devices
+12.4+12.4
--1.91.9
--29.329.3
% sales% sales‘‘05/2Q05/2Q '06/2Q'06/2Q
CC--STNSTN 13%13% 16%16%MDMD--TFDTFD 29%29% 27%27%aa--TFTTFT 33%33% 34%34%LTPSLTPS 13%13% 7%7%HTPSHTPS 12%12% 16%16%
EliminationsEliminations
(Billions(Billionsof yen)of yen)
Versus theVersus theyearyear--ago periodago period
Versus theVersus theyearyear--ago periodago period
Versus theVersus theyearyear--ago periodago period
••LCDLCD--Dr: Improved modelDr: Improved modelmixmixSS--LSI: Volume downLSI: Volume down
••CC--STN/MDSTN/MD--TFD/aTFD/a--TFT:TFT:Volume up, ASPs down vs.Volume up, ASPs down vs.yearyear--agoago
••LTPS: Volume and ASPsLTPS: Volume and ASPsdowndown
••HTPS: Volume up, ASPsHTPS: Volume up, ASPsdowndown
••Sales of products for theSales of products for themobile phone, PC, and DSCmobile phone, PC, and DSCmarkets remained strongmarkets remained strong
** CC--STN: Color STNSTN: Color STNMDMD--TFD: Mobile digital thinTFD: Mobile digital thin--film diodefilm diodeaa--TFT: AmorphousTFT: Amorphous--silicon TFTsilicon TFTLTPS: LowLTPS: Low--temperature polysilicontemperature polysilicon TFTTFTHTPS: HighHTPS: High--temperature polysilicontemperature polysilicon TFTTFTLCDLCD--Dr: LCD driverDr: LCD driverSS--LSI: System LSILSI: System LSI

12
Quarterly Selling, General and Administrative Expenses
20.1 20.9 20.4 20.5 20.2
7.1 10.3 8.0 4.6 5.95.7
13.36.6
4.0 4.9
44.7
48.8
49.1
38.841.3
21.1%20.5%
22.5%
20.4%20.5%
0
20
40
60
80
100
2005/2Q 2005/3Q 2005/4Q 2006/1Q 2006/2Q
72.472.472.4
(% sales)(% sales)
77.877.877.8 93.393.393.3 84.284.284.2
Salaries & wagesSalaries & wages
Sales promotionSales promotionexpensesexpenses
AdvertisingAdvertisingexpensesexpenses
OtherOther
--3.43.4
--0.80.8
--1.11.1
+0.1+0.1
68.068.068.0(Billions(Billionsof yen)of yen)
VVs. the years. the year--ago periodago period
VVs. the years. the year--ago periodago period
VVs. the years. the year--ago periodago period
VVs. the years. the year--ago periodago period
13
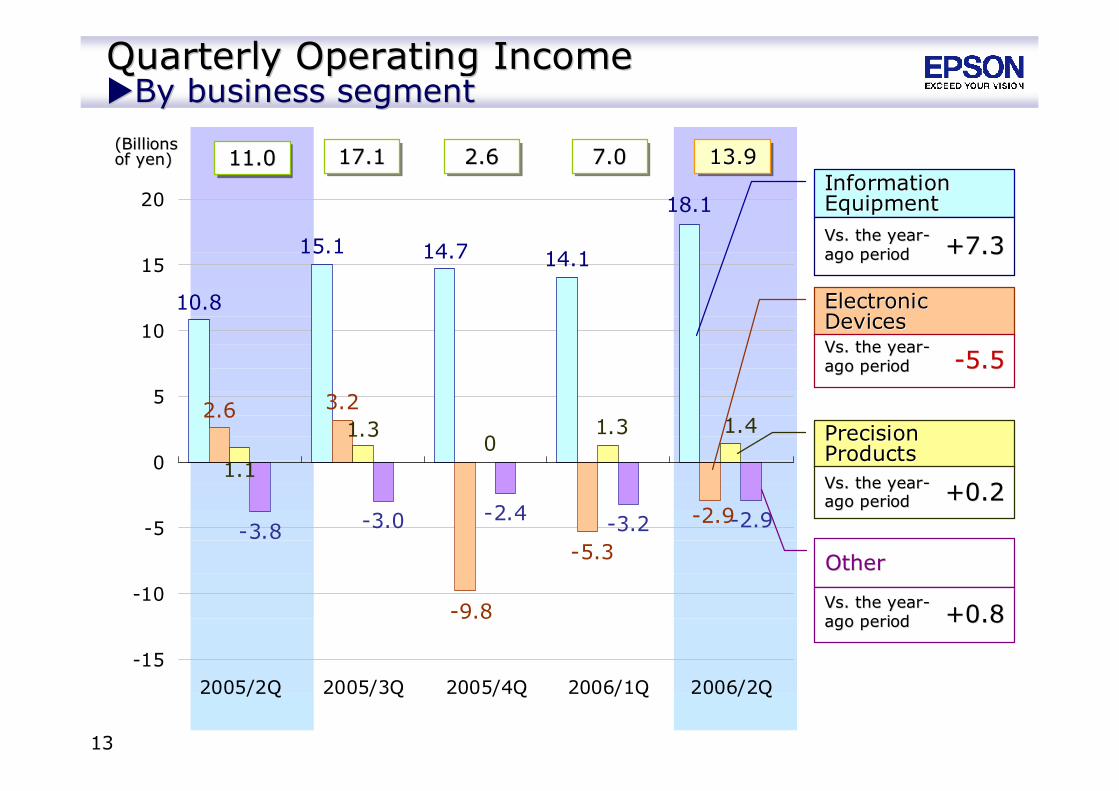
Quarterly Operating IncomeQuarterly Operating IncomeBy business segmentBy business segment
10.8
15.1 14.7 14.1
2.6 3.2
-3.8 -3.0 -2.4 -3.2 -2.9
18.1
-5.3
-9.8
-2.9
1.1
1.3 1.30
1.4
-15
-10
-5
0
5
10
15
20
2005/2Q 2005/3Q 2005/4Q 2006/1Q 2006/2Q
11.011.011.0 17.117.117.1 2.62.62.6 13.913.913.9InformationInformationEquipmentEquipment
ElectronicElectronicDevicesDevices
PrecisionPrecisionProductsProducts
OtherOther
+0.8+0.8
+0.2+0.2
--5.55.5
+7.3+7.3
7.07.07.0(Billions(Billionsof yen)of yen)
VVs. the years. the year--ago periodago period
VVs. the years. the year--ago periodago period
VVs. the years. the year--ago periodago period
VVs. the years. the year--ago periodago period
14
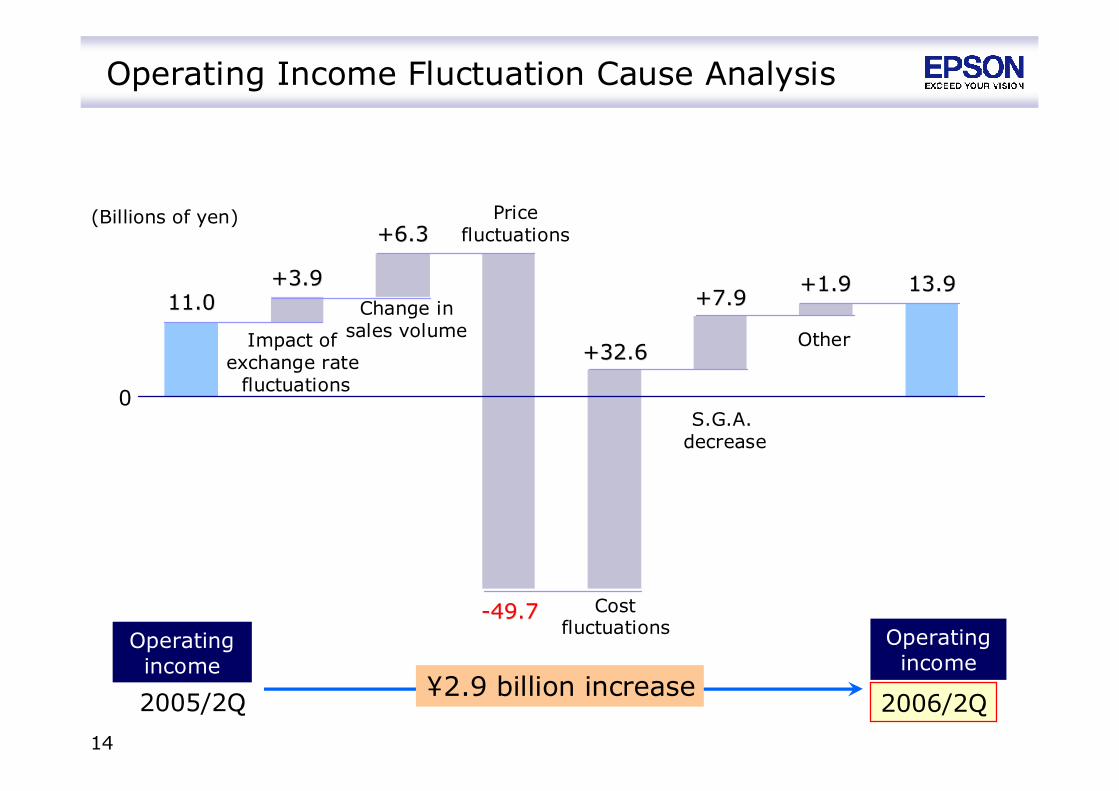
Operating Income Fluctuation Cause Analysis
0
2005/2Q
S.G.A.decrease
Other
2006/2Q¥2.9 billion increase
11.011.0+3.9+3.9
+7.9+7.9
--49.749.7
+6.3+6.3
13.913.9
+32.6+32.6
+1.9+1.9
(Billions of yen) Pricefluctuations
Costfluctuations
Change insales volumeImpact of
exchange ratefluctuations
Operatingincome
Operatingincome

15
Statistics of Balance Sheet Items
1,207.0 1,298.2 1,374.5 1,325.7 1,326.2
0
500
1,000
1,500
End of March2004
End of March2005
End of September2005
End of March2006
End of September2006
155.8 176.6 223.4 192.0 214.4
0
100
200
End of March2004
End of March2005
End of September2005
End of March2006
End of September2006
Total assets
Inventories
(Billions(Billionsof yen)of yen)
(Billions(Billionsof yen)of yen)

16
Statistics of Balance Sheet Items
281.3414.3 472.8 474.5 475.4
23.5%34.3% 35.8%36.4% 35.8%
0
200
400
600
End of March2003
End of March2004
End of March2005
End of March2006
End ofSeptember 2006
610.9 457.5 395.2 429.6 420.7
51.0%37.9%
30.4% 32.4% 31.7%
0
400
800
End of March2003
End of March2004
End of March2005
End of March2006
End ofSeptember 2006
Interest-bearing liabilities & ratio of interest-bearing liabilities
Shareholder's equity & equity ratio
The definition of shareholder equity changed due to changes in accounting standardsEnd of June 2006: Shareholder equity = total net assets - minority interests in subsidiariesShareholder equity would be ¥475.6 billion using the old calculations
(Billions(Billionsof yen)of yen)
(Billions(Billionsof yen)of yen)

17
1. FY2006 1H Financial Results1. FY2006 1H Financial Results
2. FY2006 Business Outlook2. FY2006 Business Outlook

18
¥71.30
¥114.00
¥146.00
Net Sales
OperatingIncome
OrdinaryIncome
Net Income
Net IncomeBefore income taxes
(Billions of yen)(Billions of yen)
Exch
ange
rate
FY2006
FY2006 Business Outlook
1,549.5
25.7
27.9
-17.9
%Currentoutlook
1.7%
1.8%
-1.2%
-
-20.0 -1.3%
Change(amount & %)FY2005
Actual %
EPS -¥91.24
2.8%
2.8%
-
-
- -126.0-8.1%
40.0
40.0
1,429.0
2.3%33.0 -
-
1,555.0
40.0
40.0
14.0
2.6%
2.6%
0.9%
-
33.0 2.1%
Originalplan %
¥71.30
+14.2+55.3%
+12.0+42.9%
-120.5-7.8%
+53.0-
+31.9-
YoY Vs. originalplan
USD
EUR
¥113.31
¥137.86
¥112.00
¥135.00
14.0 1.0%
* Exchange rates used in 7/26 outlook:USD: 110.00 / EUR: 139.00

19
FY2006 Business Outlook (Net Sales)By business segment
976.4
526.9 550.0462.0
32.9 39.0
30.0
-72.5 -62.0
910.0948.0
89.0
90.085.7
-72.0
-200
0
200
400
600
800
1,000
1,200
1,400
1,600
1,800
FY2005 FY2006 FY2006
(Billions(Billionsof yen)of yen)
1,549.51,549.51,549.5
YearYear--onon--yearyear --66.466.4Vs.Vs. original planoriginal plan --38.038.0
YearYear--onon--yearyear --64.964.9Vs.Vs. original planoriginal plan --88.088.0
YearYear--onon--yearyear +3.2+3.2Vs. original planVs. original plan --1.01.0
YearYear--onon--yearyear --2.92.9Vs. original planVs. original plan --9.09.0
1,555.01,555.01,555.0
Actual Originalplan
EliminationsEliminations
(Billions of yen)(Billions of yen)
1,429.01,429.01,429.0
Currentoutlook
InformationInformationEquipmentEquipment
Electronic DevicesElectronic Devices
Precision ProductsPrecision Products
OtherOther
FullFull--year net salesyear net sales HalfHalf--year net salesyear net sales
706.0706.0706.0 849.0849.0849.0
Originalplan
今回予想
今回予想
45.046.0
45.0
42.920.015.4
19.0
14.5
-39.0 -33.1 -33.0 -28.8
492.0519.0417.9429.0
230.9299.0
231.0251.0
-100
0
100
200
300
400
500
600
700
800
900
1,000
1H 1H 2H 2H
677.3677.3677.3 751.6751.6751.6
Actual Currentoutlook
Originalplan
20
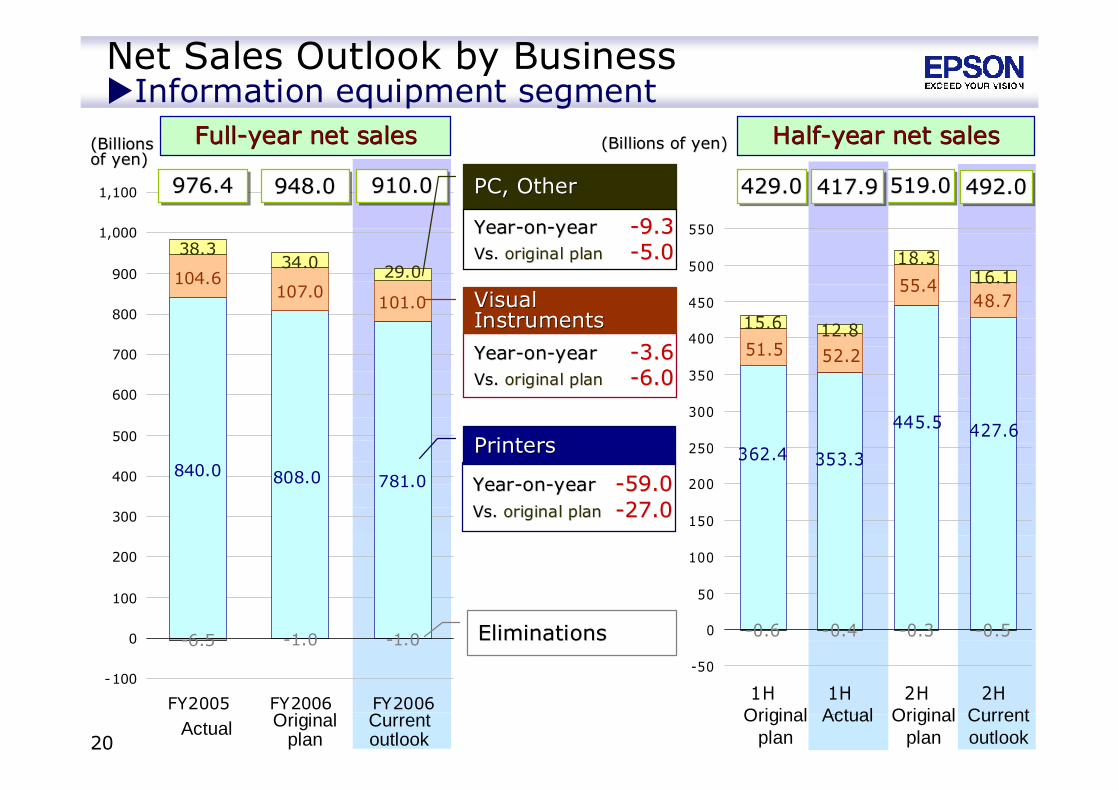
(Billions(Billionsof yen)of yen)
Net Sales Outlook by BusinessInformation equipment segment
(Billions of yen)(Billions of yen)
YearYear--onon--yearyear --59.059.0Vs.Vs. original planoriginal plan --27.027.0
YearYear--onon--yearyear --3.63.6Vs.Vs. original planoriginal plan --6.06.0
840.0
104.6107.0
101.0
-6.5 -1.0
781.0808.0
34.0 29.038.3
-1.0
-100
0
100
200
300
400
500
600
700
800
900
1,000
1,100
FY2005 FY2006 FY2006
976.4976.4976.4 948.0948.0948.0 910.0910.0910.0
FullFull--year net salesyear net sales HalfHalf--year net salesyear net sales
429.0429.0429.0 519.0519.0519.0
今回予想
今回予想
48.715.6 12.8
18.316.1
-0.6 -0.4 -0.3 -0.5
427.6445.5
353.3362.4
55.4
52.251.5
-50
0
50
100
150
200
250
300
350
400
450
500
550
1H 1H 2H 2H
417.9417.9417.9 492.0492.0492.0
PrintersPrinters
VisualVisualInstrumentsInstruments
EliminationsEliminations
PC, OtherPC, Other
YearYear--onon--yearyear --9.39.3Vs.Vs. original planoriginal plan --5.05.0
Actual Originalplan
Currentoutlook
Originalplan
Actual Currentoutlook
Originalplan
21
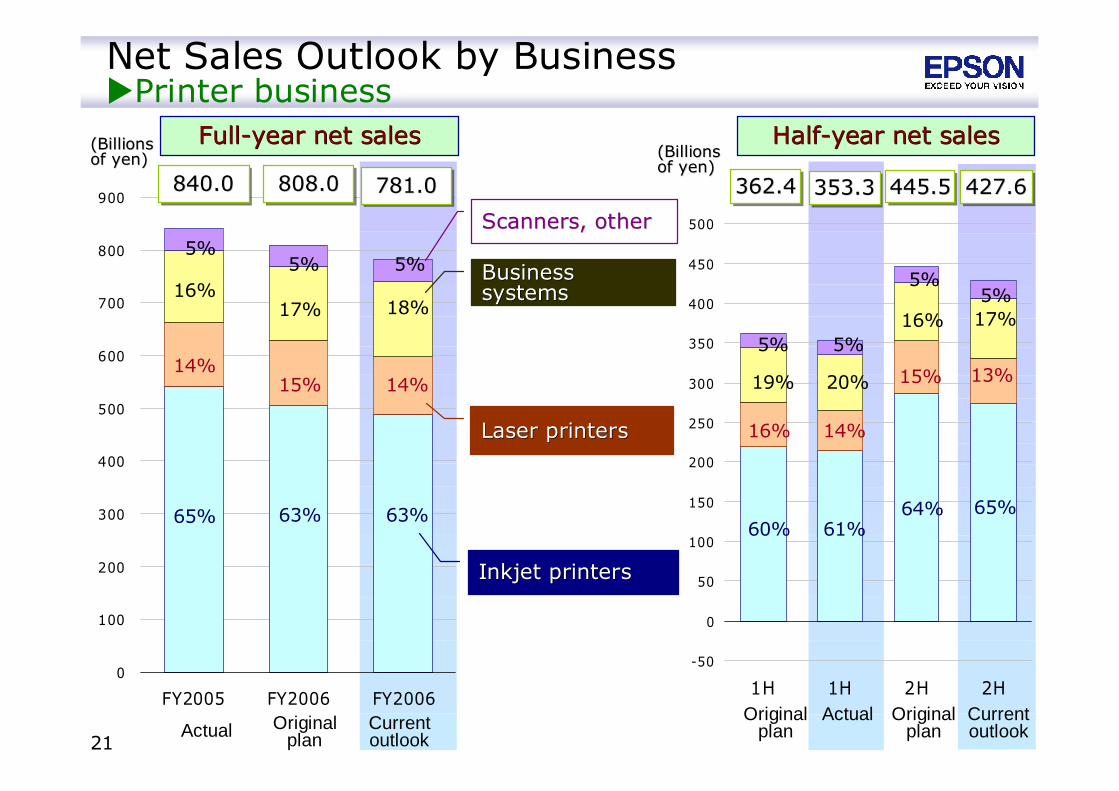
0
100
200
300
400
500
600
700
800
900
FY2005 FY2006 FY2006
840.0840.0840.0 808.0808.0808.0
Net Sales Outlook by BusinessPrinter business
Inkjet printersInkjet printers
Laser printersLaser printers
BusinessBusinesssystemssystems
Scanners, otherScanners, other
63%
15%
17%
65%
14%
16%5%
5%
63%
14%
18%
5%
781.0781.0781.0
FullFull--year net salesyear net sales HalfHalf--year net salesyear net sales
362.4362.4362.4 445.5445.5445.5
-50
0
50
100
150
200
250
300
350
400
450
500
1H 1H 2H 2H
353.3353.3353.3 427.6427.6427.6
60%64%
16%
15%19%
16%5%
5%
61%
14%
20%
5%
65%
13%
17%5%
(Billions(Billionsof yen)of yen) (Billions(Billions
of yen)of yen)
Actual Originalplan
Currentoutlook
Originalplan
Actual Currentoutlook
Originalplan
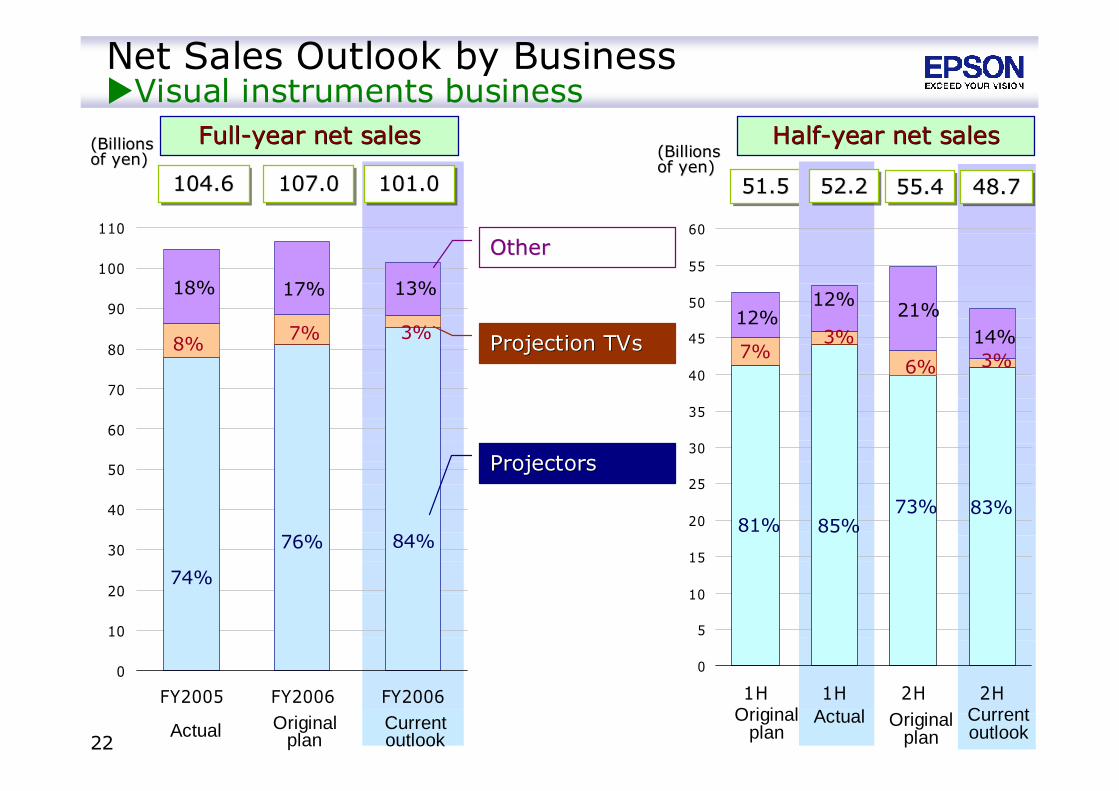
22
0
10
20
30
40
50
60
70
80
90
100
110
FY2005 FY2006 FY2006
Net Sales Outlook by BusinessVisual instruments business
74%
8%
18%
76%
7%
17%
104.6104.6104.6 107.0107.0107.0 101.0101.0101.0
FullFull--year net salesyear net sales HalfHalf--year net salesyear net sales
51.551.551.5 55.455.455.4
0
5
10
15
20
25
30
35
40
45
50
55
60
1H 1H 2H 2H
52.252.252.2 48.748.748.7
81%73%
7%6%
12% 21%
84%
3%
13%
85%
3%
12%
83%
3%14%
(Billions(Billionsof yen)of yen) (Billions(Billions
of yen)of yen)
Actual Originalplan
Currentoutlook
Originalplan
Actual Currentoutlook
Originalplan
ProjectorsProjectors
Projection TVsProjection TVs
OtherOther
23
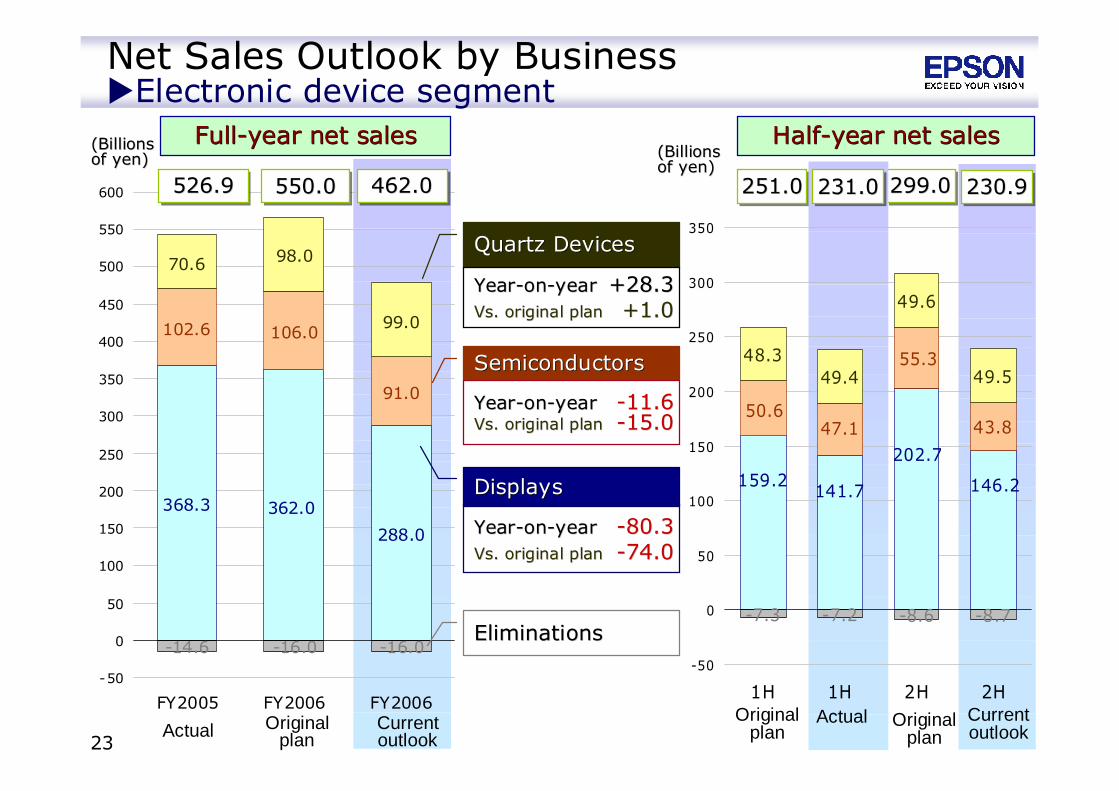
Net Sales Outlook by BusinessElectronic device segment
YearYear--onon--yearyear --80.380.3Vs. original planVs. original plan --74.074.0
YearYear--onon--yearyear --11.611.6Vs. original planVs. original plan --15.015.0
368.3
102.6 106.0
91.0
-14.6 -16.0
288.0
362.0
99.0
98.070.6
-16.0
-50
0
50
100
150
200
250
300
350
400
450
500
550
600
FY2005 FY2006 FY2006
526.9526.9526.9 550.0550.0550.0 462.0462.0462.0
FullFull--year net salesyear net sales HalfHalf--year net salesyear net sales
251.0251.0251.0 299.0299.0299.0
今回予想
今回予想
43.8
48.349.4
49.6
49.5
-7.3 -7.2 -8.6 -8.7
146.2
202.7
141.7159.2
55.3
47.150.6
-50
0
50
100
150
200
250
300
350
1H 1H 2H 2H
231.0231.0231.0 230.9230.9230.9
DisplaysDisplays
SemiconductorsSemiconductors
EliminationsEliminations
Quartz DevicesQuartz Devices
YearYear--onon--yearyear +28.3+28.3Vs. original planVs. original plan +1.0+1.0
(Billions(Billionsof yen)of yen) (Billions(Billions
of yen)of yen)
Actual Originalplan
Currentoutlook
Originalplan
Actual Currentoutlook
Originalplan
24
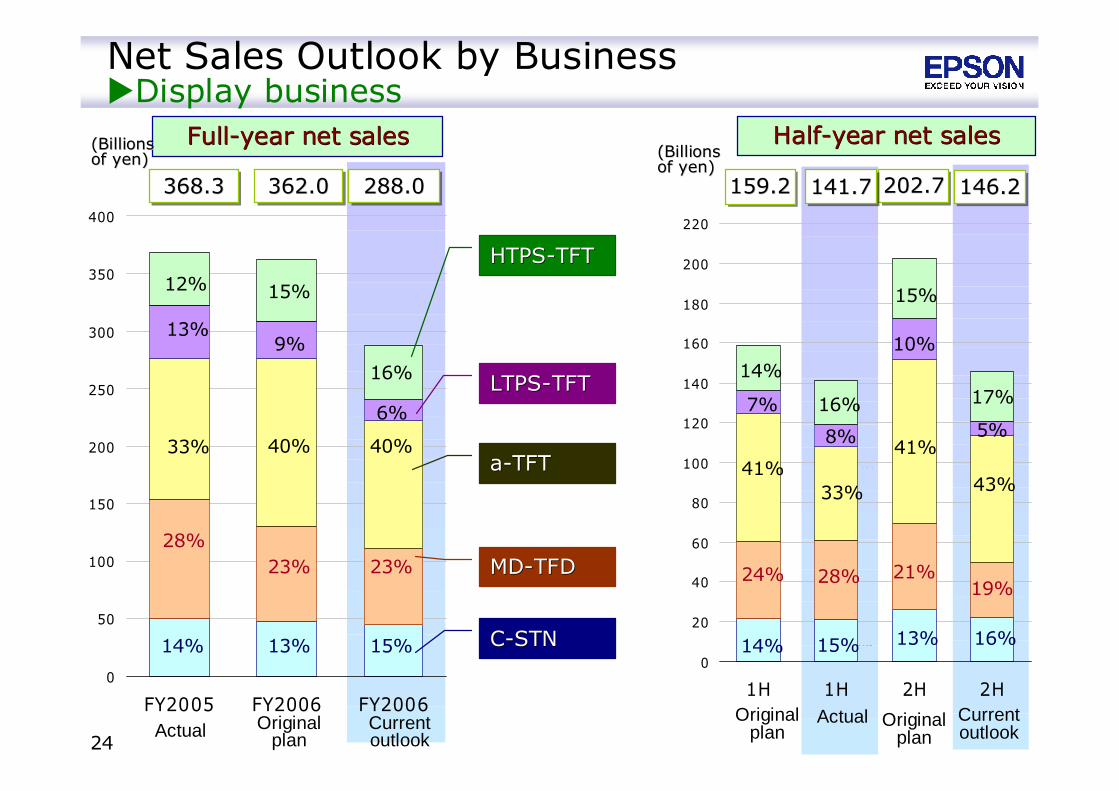
Net Sales Outlook by BusinessDisplay business
0
50
100
150
200
250
300
350
400
FY2005 FY2006 FY2006
13%
23%
40%
14%
28%
33%
13%9%
12% 15%
13%
28%
15%
32%
12%
362.0362.0362.0 288.0288.0288.0
FullFull--year net salesyear net sales
368.3368.3368.3
HalfHalf--year net salesyear net sales
159.2159.2159.2 202.7202.7202.7141.7141.7141.7 146.2146.2146.2
0
20
40
60
80
100
120
140
160
180
200
220
1H 1H 2H 2H
13%
21%
41%
14%
24%
41%
7%
10%14%
15%
15%
23%
40%
6%
16%
15%
28%
33%
8%
16%
16%
19%
43%
5%
17%
(Billions(Billionsof yen)of yen) (Billions(Billions
of yen)of yen)
Actual Originalplan
Currentoutlook
Originalplan
Actual Currentoutlook
Originalplan
CC--STNSTN
MDMD--TFDTFD
aa--TFTTFT
HTPSHTPS--TFTTFT
LTPSLTPS--TFTTFT

25
FY2006 Business Outlook (Operating Income)By business segment
45.0
-9.7
1.0
-17.0
-12.7
-17.0
-13.0
66.0
52.0
4.0
4.0
2.3
0.0
0.9
0.0
-40
-30
-20
-10
0
10
20
30
40
50
60
70
80
FY2005 FY2006 FY2006
25.725.725.7
YearYear--onon--yearyear +1.6+1.6Vs. original planVs. original plan ±±00
40.040.040.0 EliminationsEliminations40.040.040.0
YearYear--onon--yearyear +20.9+20.9Vs. original planVs. original plan +14.0+14.0
InformationInformationEquipmentEquipment
YearYear--onon--yearyear --7.27.2Vs. original planVs. original plan --18.018.0
Electronic DevicesElectronic Devices
Precision ProductsPrecision Products
YearYear--onon--yearyear --0.20.2Vs. original planVs. original plan +4.0+4.0
OtherOther
FullFull--year operating incomeyear operating income HalfHalf--year operating incomeyear operating income
2.02.02.0 38.038.038.0
今回予想
今回予想
-8.6
1.0
3.0
-7.0-10.0
33.637.0
32.3
15.0
8.0
-8.3-7.0
2.7 1.2
-6.7-6.2
-0.4
0.4
-30
-20
-10
0
10
20
30
40
50
60
70
1H 1H 2H 2H
20.920.920.9 19.019.019.0
(Billions(Billionsof yen)of yen)
(Billions(Billionsof yen)of yen)
Actual Originalplan
Currentoutlook
Originalplan
Actual Currentoutlook
Originalplan

26
Operating Income Trend and Outlook
7.7% 6.8%4.5%
5.6%
3.4%
6.0%
7.1%
3.6%
6.7%
-3.8%-3.6%-2.5%-1.2%
0.5%
16.8%13.5%
-20
-10
0
10
20
30
40
50
FY03/1H FY03/2H FY04/1H FY04/2H FY05/1H FY05/2H FY06/1H FY06/2H-15.0%
-10.0%
-5.0%
0.0%
5.0%
10.0%
15.0%
20.0%
25.0%Operating income: Information equipmentOperating income: Electronic devicesOperating margin: Information equipmentOperating margin: Electronic devices
Operating income (billions of yen) Operating margin
ActualActual CurrentCurrentoutlookoutlook

27
Achieving the Second-Half OutlookInformation equipment
Key secondKey second--half actionshalf actionsInkjet printer business
Boost sales of new productsin the year-end shopping season
Continue sales strategy thatemphasizes profitability
Improve sales of consumablesthat enhance customer convenience
Business system & laser printer businessContinue customer-engaged, high-
margin business & low-cost operationsVisual instruments business
Continue to release competitiveproducts
Photo all-in-one
Full HD home projector
Dot-matrix printer
Color laserprinter
Thermal labelprinter

28
Achieving the Second-Half OutlookElectronic devices
Key secondKey second--half actionshalf actions
Controller LSI
High-precision gyrosensor
7.1" direct-viewHD LTPS LCD
~500 ppi ultra-high-density 2.6"XGA LTPS LCD
Four-way 180-degreeultra-wide viewing angle
Display businessExpand sales by winning volume
orders for mobile phones withdifferentiated technology
Reduce costsRestructure fixed costs
Streamline workforceReview & promote site streamlining
Semiconductor businessRestructure & consolidate sites to further
improve efficiencyQuartz device business
Leverage the effects of the EpsonToyocom merger in production,development, and marketing tofurther improve profitability

29
Outlook for Capital Expenditure andDepreciation & Amortization Expenses
125.8 110.3 104.2 109.3 103.00
100
200
FY2002 FY2003 FY2004 FY2005 FY2006
74.4 68.7151.2 112.5 100.0
0
100
200
FY2002 FY2003 FY2004 FY2005 FY2006
Capital Expenditures
Depreciation and Amortization Expenses(Current outlook)
(Current outlook)
(Billionsof yen)
(Billionsof yen)

30
159.5182.6
162.4
117.4141.1
-107.9
-65.3
-99.3 -95.2-111.1
51.5
117.3
63.0
30.022.2
-300
-200
-100
0
100
200
FY2002 FY2003 FY2004 FY2005 FY2006
Cash flow from investment
Cash flow from operations
Free cash flow
Free Cash Flow Outlook
(Current outlook)
(Billions of yen)(Billions of yen)
31
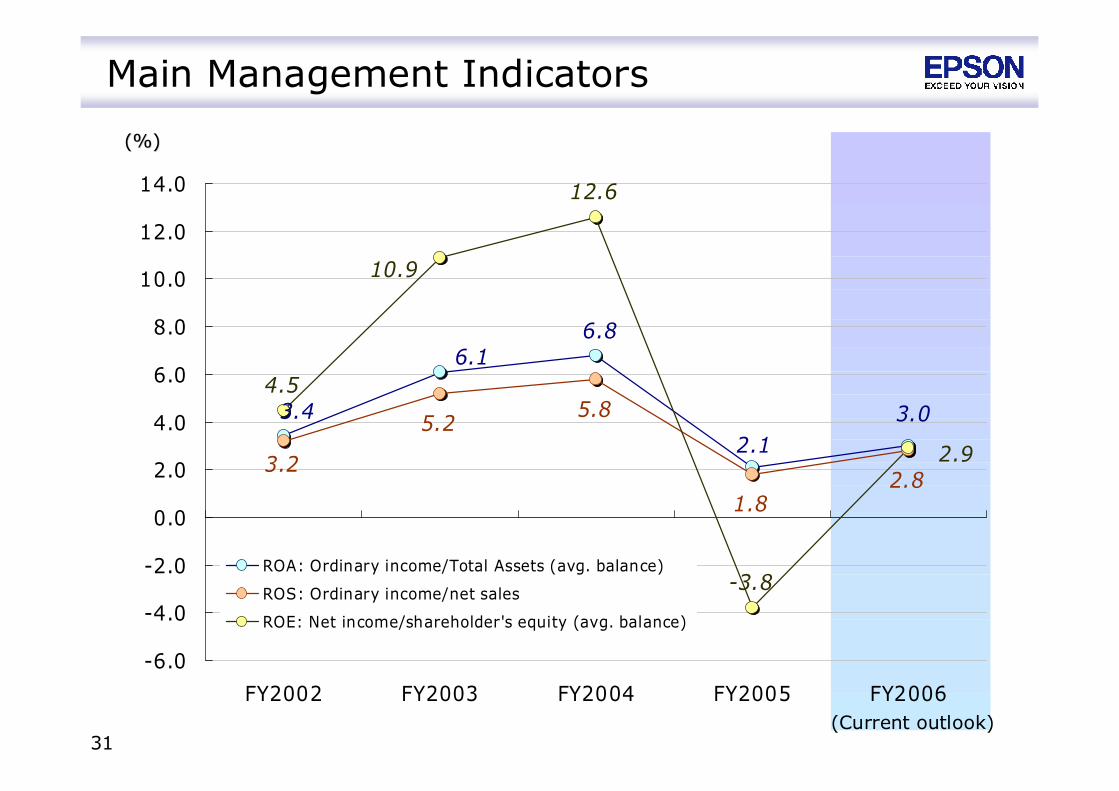
5.25.8
1.8
4.5
12.6
-3.8
2.1
6.86.1
3.4 3.0
3.22.8
10.9
2.9
-6.0
-4.0
-2.0
0.0
2.0
4.0
6.0
8.0
10.0
12.0
14.0
FY2002 FY2003 FY2004 FY2005 FY2006
ROA: Ordinary income/Total Assets (avg. balance)
ROS: Ordinary income/net sales
ROE: Net income/shareholder's equity (avg. balance)
Main Management Indicators
(%)(%)
(Current outlook)
32
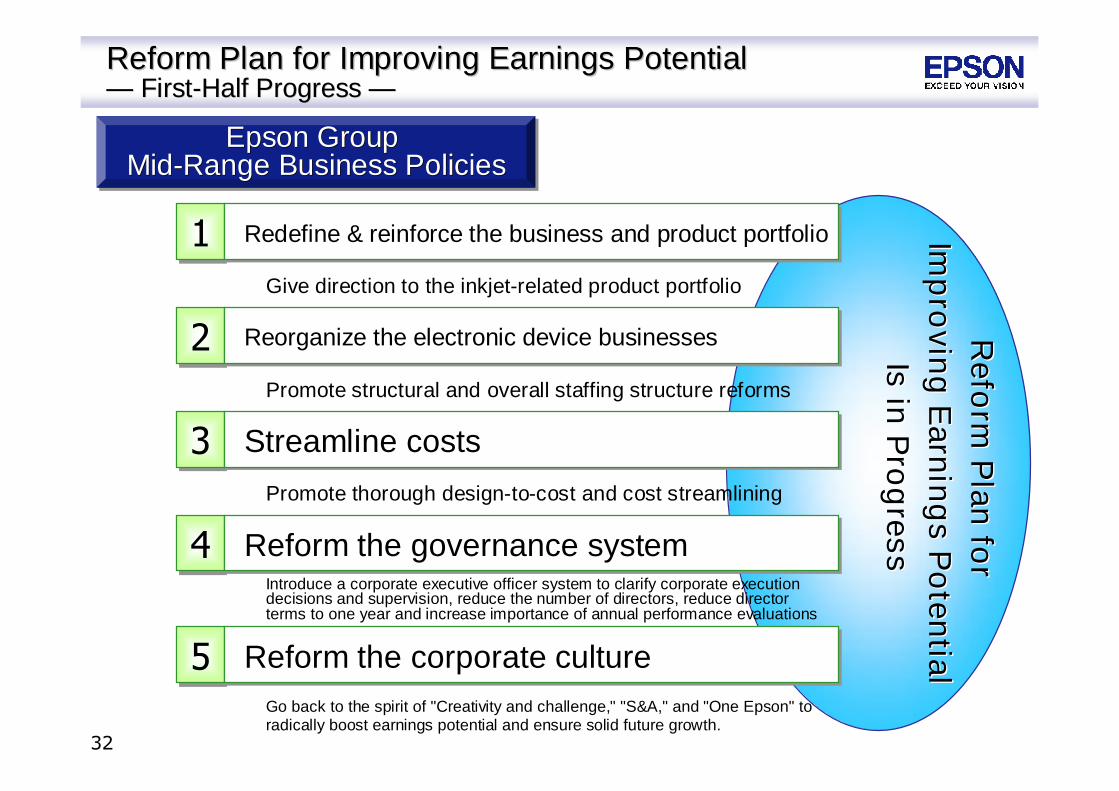
11
22
33
44
55
Give direction to the inkjet-related product portfolio
Refo
rmP
lanfo
rR
eform
Plan
for
Imp
rovin
gE
arnin
gs
Po
tential
Imp
rovin
gE
arnin
gs
Po
tential
Isin
Pro
gress
Isin
Pro
gress
Redefine & reinforce the business and product portfolioRedefine & reinforce the business and product portfolio
Reorganize the electronic device businessesReorganize the electronic device businesses
Streamline costsStreamline costs
Reform the governance systemReform the governance system
Reform the corporate cultureReform the corporate culture
Promote structural and overall staffing structure reforms
Introduce a corporate executive officer system to clarify corporate executiondecisions and supervision, reduce the number of directors, reduce directorterms to one year and increase importance of annual performance evaluations
Go back to the spirit of "Creativity and challenge," "S&A," and "One Epson" toradically boost earnings potential and ensure solid future growth.
Epson GroupMid-Range Business Policies
Epson GroupEpson GroupMidMid--Range Business PoliciesRange Business Policies
Promote thorough design-to-cost and cost streamlining
Reform Plan for Improving Earnings PotentialReform Plan for Improving Earnings Potential—— FirstFirst--Half ProgressHalf Progress ——


![[DESIGN] Piezo-Piezo to Pie](https://static.fdocuments.in/doc/165x107/5571f8bb49795991698df909/design-piezo-piezo-to-pie.jpg)

