First Annual Aquaculture Feed Survey 2016 -...
7
First Annual Aquaculture Feed Survey 2016
Transcript of First Annual Aquaculture Feed Survey 2016 -...

First Annual
Aquaculture Feed Survey
2016

Top 12 Feed Producers
Country Total Aqua 2015
(M tonnes)
Average Cost of
Finisher Diet (USD)
China 17.300 $850
Vietnam 2.800 $1,333
Norway 1.789 $1,100
Chile 1.243 $1,250
Indonesia 1.230 $700
India 1.160 $702
USA 1.002 $550
Brazil 0.940 $750
Thailand 0.930 $735
Canada 0.760 $1,000
Bangladesh 0.740 $750
Peru 0.524 $947

Most Expensive Finisher Diets*
Top 3 all in Asia Pacific:
Korea $1,800
Japan $1,700
Vietnam $1,333
*Averaged
Almost 50% survey
responses over $1,000
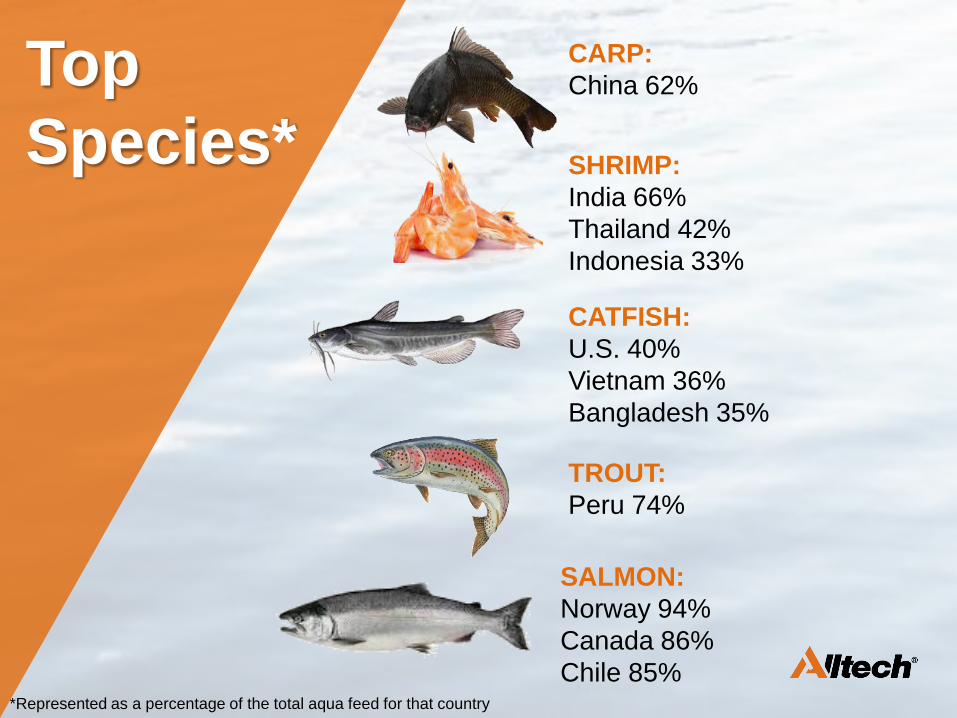
Top
Species*
TROUT:
Peru 74%
CARP:
China 62%
CATFISH:
U.S. 40%
Vietnam 36%
Bangladesh 35%
SHRIMP:
India 66%
Thailand 42%
Indonesia 33%
SALMON:
Norway 94%
Canada 86%
Chile 85% *Represented as a percentage of the total aqua feed for that country

Brazil: A country of many species!
Native Specie Projection – Feed Consumption
(Thousand Tonnes)
Tambaqui 170 Tambacu and tambatinga 56 Pintado, cachara and Hybrids 27 Pacu and patinga 15 Pirarucu 13 Matrinxã 13 Pirapitinga 9 Piau, piapara and piava 7 Curimatã 4 Traíra, Big traira 3 Lambari 1 Jatuarana, piabanha and piracanjuba 1 Tucunaré 1 Dourado 1 OTHER 79

Brazilian Species
– Deep-bodied,
Amazonian breeds
– Fruit & nut foraging
in the wild
– Larger species
considered pork-like
when cooked BBQ
style!
Courtesy of Amazon-angler.com
Pirapitinga, Tambaqui and Pacu*

Shrimp*
Vs.
Salmon
Total Aqua Feed Production:
• Shrimp accounts for 21%
– 82% is in Asia
• Salmon accounts for 11%
– At 52% Europe is No.1
*Includes freshwater and marine
Feed Production