First- and Third-Person Effects of Alcohol Advertising on ...
69
University of South Florida Scholar Commons Graduate eses and Dissertations Graduate School 10-27-2015 First- and ird-Person Effects of Alcohol Advertising on Chinese College Students Dong Xue University of South Florida, [email protected] Follow this and additional works at: hp://scholarcommons.usf.edu/etd Part of the Mass Communication Commons is esis is brought to you for free and open access by the Graduate School at Scholar Commons. It has been accepted for inclusion in Graduate eses and Dissertations by an authorized administrator of Scholar Commons. For more information, please contact [email protected]. Scholar Commons Citation Xue, Dong, "First- and ird-Person Effects of Alcohol Advertising on Chinese College Students" (2015). Graduate eses and Dissertations. hp://scholarcommons.usf.edu/etd/6054
Transcript of First- and Third-Person Effects of Alcohol Advertising on ...
University of South FloridaScholar Commons
Graduate Theses and Dissertations Graduate School
10-27-2015
First- and Third-Person Effects of AlcoholAdvertising on Chinese College StudentsDong XueUniversity of South Florida, [email protected]
Follow this and additional works at: http://scholarcommons.usf.edu/etd
Part of the Mass Communication Commons
This Thesis is brought to you for free and open access by the Graduate School at Scholar Commons. It has been accepted for inclusion in GraduateTheses and Dissertations by an authorized administrator of Scholar Commons. For more information, please contact [email protected].
Scholar Commons CitationXue, Dong, "First- and Third-Person Effects of Alcohol Advertising on Chinese College Students" (2015). Graduate Theses andDissertations.http://scholarcommons.usf.edu/etd/6054
First- and Third-Person Effects of Alcohol Advertising on Chinese College Students
by
Dong Xue
A thesis submitted in partial fulfillment of the requirements for the degree of
Master of Arts School of Mass Communications
College of Arts & Sciences University of South Florida
Major Professor: Scott Liu, Ph.D. Justin Brown, Ph.D.
Yan Shan, Ph.D.
Date of Approval: October 26, 2015
Keywords: Attitude towards alcohol advertising, third person effect, perceived influence of alcohol advertising
Copyright © 2015, Dong Xue
Dedication
To my parents
Acknowledgements
I would like to express my gratitude to all those who have helped me during the process
of writing this thesis. I gratefully acknowledge the help of my major Professor, Dr. Liu. I
appreciate his patience, encouragement, and professional instructions throughout my graduate
study. Without his gentle and continuous push, the completion of this thesis would have been
impossible. I would also like to thank my thesis committee members, Dr. Shan and Dr. Brown,
for their valuable comments and suggestions. Finally, I would like to thank my family and all my
friends for their encouragement and support

i
Table of Contents
List of Tables .................................................................................................................................. ii List of Figures ................................................................................................................................ iii Abstract .......................................................................................................................................... iv Chapter One: Introduction ...............................................................................................................1 Alcohol Advertising in China ..............................................................................................4 Purpose of the Study ............................................................................................................5 Chapter Two: Literature Review .....................................................................................................7 Attitude toward Advertising and Product ............................................................................7 The First- and Third-Person Effect ....................................................................................10 Chapter Three: Research Hypotheses ............................................................................................14 Chapter Four: Methodology ...........................................................................................................18 Design & Sample ...............................................................................................................18 Survey Instrument ..............................................................................................................20 Chapter Five: Results .....................................................................................................................23 Measurement Model Results ..............................................................................................26 Structure Model Results .....................................................................................................27 Hypotheses Testing ............................................................................................................30 Chapter Six: Discussion .................................................................................................................34 Chapter Seven: Conclusions ..........................................................................................................38 References ......................................................................................................................................41 Appendix ........................................................................................................................................49 Survey Questionnaire (English) .........................................................................................54 Survey Questionnaire (Chinese) ........................................................................................54 Letter of IRB Approval ......................................................................................................59

ii
List of Tables
Table 1: Sample Gender .................................................................................................................18 Table 2: Sample Academic Status .................................................................................................19 Table 3: Sample Age ......................................................................................................................19 Table 4: Sample Drinking Frequency ............................................................................................20 Table 5: Descriptive and Reliability Statistics ...............................................................................23 Table 6: ATTA, ATTP, ATTR: Means and Standard Deviations .................................................25 Table 7: One-Samples t-test: ATTA, ATTP, ATTR ......................................................................25 Table 8: Paired Samples t-test: Self vs. Others ..............................................................................26 Table 9: Measurement Model Results ...........................................................................................26 Table 10: Estimates of Standardized Regression Weights ............................................................28 Table 11: Summary of Hypotheses Testing ...................................................................................33
iii
List of Figures
Figure 1: Structural Equation Model .............................................................................................17 Figure 2: Structural Model Results ................................................................................................29 Figure 3: Significant Paths .............................................................................................................33 Figure 4: Relationships among Attitudes .......................................................................................34 Figure 5: Relationships among Attitudes and SELF ......................................................................35 Figure 6: Relationship among Attitudes, SELF and OTHERS ......................................................36

iv
Abstract
Alcohol consumption among Chinese college students has become a serious problem.
The present research examines the relationships among attitudes towards alcohol advertising,
attitudes towards alcohol products, the perceived influences of alcohol advertising on the self,
the perceived influences of alcohol advertising on others, and attitudes toward government
restrictions on alcohol advertising. Data were collected from 578 Chinese college students via an
online survey. The results supported the hypothesized relationships between attitude toward
alcohol products and alcohol advertising, as well as the relationship between attitude toward
alcohol advertising and perceived influence of alcohol advertising on oneself. Results also
supported the looking glass perception hypothesis whereby the perceived influence of alcohol
advertising on oneself (first-person effect) had strong influence on the perceived influence on
others (third-person effect) which in turn led to greater support for restrictions on alcohol
advertising.

1
Chapter One
Introduction
Alcohol use has become a widespread problem among Chinese adolescents and youth.
Research shows that over 50% of Chinese teenagers have experimented with drinking (Tang, Du,
& Ma, 2014) and over 29.7% of students had their first drink before they reached the age of 13
(Huang & Tao, 2012). Survey studies showed that over 80% of college students had experienced
drinking, and over 37% of male college students had participated in excessive drinking (Chen,
Guo, Liu, Miao, Miao, & Zhang, 2013). Furthermore, regardless of whether they are students of
not, nearly 30% of all college-age individuals in China excessively consume alcohol on a regular
basis (Ji, 2010). Industry data reveal that the Chinese alcohol industry produced about 48 million
tons of beer and 12 million tons of spirits in 2013. Compared to 1980 production levels, the
average annual output of alcoholic beverages in China has increased by 62 million tons (Guo &
Huang, 2015). These alarming statistics raise some serious concerns about many alcohol-related
problems, including drunk driving and a variety of health issues (Liu, Wei, Huang, & Li, 2013).
According to a recent study, over 25% of yearly traffic deaths in China are the result of drunk
driving (Wang, 2014).
It is generally known that alcohol use has many negative psychological and physiological
effects on students (Liu et al., 2013). First, drinking alcohol leads to poor academic performance.
According to one study, people who ingest excess alcohol experience distraction, poor judgment,
and memory deterioration (Tang, Du, & Ma, 2014). Second, students who drink alcohol to
excess are more often involved in interpersonal conflicts (Huang & Tao, 2012). A casual search

2
for “provoked fighting incident after getting drunk” on Baidu (a Chinese online search engine)
produces more than four million results and 18,000 plus news articles. There was even a news
report about a college student who drank two bottles of liquor, got in a fight with his friends,
killing one of them and seriously injuring two others (Wang, 2012). Third, drinking is harmful to
people’s health, especially for women (Huang & Tao, 2012). Although women can drink the
same amount of alcohol as men, higher concentrations of alcohol stay in their bodies longer
(Chen et al., 2013). A recent study shows that the influence of one bottle of wine for women is
the same as two bottles of wine for men, so women are likely to face even worse consequences
of drinking than men (Chen, 2015). Despite such knowledge, most Chinese people hold mixed
feelings about the good and evil of alcohol consumption (Zhang, 2011).
The mixed feelings for alcohol use are rooted in a number of cultural, social and legal
factors. The Chinese drinking culture has thousands of years of history. In ancient China, many
poets wrote poems chanting the praises of alcohol (Gong, 2008). Alcohol also played an
important role in Chinese imperial politics, and many historical events were related to drinking
(Zhang, 2011). In China, drinking is also a social activity (Wan, 2009). Alcohol is almost always
present at a Chinese banquet table, whether the purpose is to negotiate a business deal, to
celebrate a social event, or to enliven a gathering among strangers. For the Chinese, serving
alcohol to friends and guests is a ritualized demonstration of generosity and hospitality (Xue &
Qian, 2004). They consume alcohol to relieve stress and anxiety. They also drink to express
content and happiness. China’s exceptionally high tolerance for alcohol consumption has earned
itself the “drinking civilization” reputation among historians (Zhang, 2011).
While researchers continue to attribute the increasing tendencies toward alcohol addiction
to the pervasive drinking culture, the Chinese society at large seems to be more and more
3
confused about the difference between drinking, excessive drinking and alcohol addiction (Guo
& Huang, 2015). To exacerbate the problem, domestic and foreign liquor, wine and beer
companies, with the strong support of Chinese media and marketing industries, are successfully
promoting even higher rates of alcohol consumption (Cremeens, Usdan, Talbott-Forbes, &
Martin, 2013). In just the first half of 2013, the Chinese alcohol industry spent $3.5 billion on
alcohol advertising, of which distilled spirits received the largest share (Wang, 2013).
Among Chinese college students, drinking alcohol is a familiar and accepted part of
campus culture. Alcohol has become an indispensable part of parties or meetings that involve
food, both on and off campus (Chen et al., 2013). Research has shown that 29.3% of students
drink at school with friends or during meals by themselves, and 90% of college students think
that drinking can help promote their social acceptability at school (Xue & Qian, 2004)). Like
their seniors, many college students believe that drinking can ease their nerves and smooth over
social environments (Chen et al., 2013). Although more students are becoming aware of the
negative effects of alcohol abuse or addiction, most of them remain naive about alcohol use in
general (Zhang, 2011). Many students believe in the health benefits of moderate alcohol
consumption, and some justify their excessive drinking with the ubiquitous and uncontrollable
Chinese drinking culture (Ji, 2010). Yet far too often alcohol use results in tragedy. Deaths from
alcohol poisoning and from alcohol-related incidents have occurred on all types of campuses in
recent years. In addition, alcohol and other drug use are a factor in the majority of accidents,
injuries, vandalism, and crime on college campuses, and frequently a key factor when students
encounter problems with their course work.
In 2006, the Chinese government finally set the legal drinking age at 18 (Baidu Baike,
2012). However, very few alcohol vendors actually check the age of their customers. This makes
4
it easier for students who are under 18 to purchase and consume alcohol. Today, college students
can buy alcohol products at any supermarket or convenience store in just about every city in
China.
Alcohol Advertising in China
Alcohol products have been heavily advertised through all media platforms, including
print, broadcast, out-of-home and the Internet, with minimum legal restrictions in China. Case in
point: Over a 30-day period in August 2013, 29 different brands of alcohol ran 1704 commercial
spots on television, totalling 37800 seconds (Wang, 2013).
In 2014, the Chinese government declared some new legal restrictions on alcohol
advertising, although most of them are only applicable to broadcast media, such as limiting the
number of alcohol commercials to two per television show. (Net Ease, 2015; Baidu Baike, 2012).
There are, however, no legal restrictions on Internet advertising. Consequently, college students
who represent the heaviest Internet users are frequently exposed to online alcohol advertising
(Baidu Baike, 2012).
Many alcohol advertisements are specifically targeted at college students. Some alcohol
distributers even advertise on college campuses, and students are hired to distribute leaflets and
put up posters. A recent study found that alcohol advertising is prevalent around schools with
20% or more student drinking population (Pasch, Komro, Perry, Hearst, & Farbskhsh, 2008).
Student newspapers, campus bulletin boards and kiosks are often plastered with ads proclaiming
drink specials at nearby restaurants or bars. Some advertise drinking specials and other
promotions that encourage students to drink excessively (Belsock, 2008).

5
Unlike the United States, where more than one-fourth of universities completely prohibit
alcohol use and 23% have stated policies prohibiting alcohol advertising on campus (Wechsler,
Kelley, Weitzman, San Giovanni, & Seibring, 2000), only a handful of colleges in China have
clearly stated alcohol policies that prohibit alcohol consumption, sales, promotions and
advertising on campus. Similar to U.S. colleges, however, Chinese colleges have experienced a
variety of the negative consequences of student alcohol use, including poor academic
performance, accidental injuries and deaths, fighting, unplanned sexual activity, property
damage, and trouble with campus or local police.
Advertising studies in China have shown that alcohol advertising creates and reinforces
positive attitude toward alcohol products (e.g., Wan, 2009; Xue & Qian, 2004). Other studies
found that, compared with the general population,18-24 year-old Chinese college students were
more likely to engage in heavy drinking and binge drinking, and they are also more likely to
develop chronic drinking problems (e.g., Zhou, 2005). Consistent with studies done in western
societies (e.g., Belstock, Connolly, Carpenter, &Tucker, 2008; Radanielina-Hita, 2013), the
Chinese studies demonstrate that exposure to alcohol advertising can affect the thoughts,
attitudes and behaviors of Chinese college students.
Purpose of the Study
This study attempts to answer the following questions: What are Chinese college
students’ attitudes toward alcohol advertising and products? To what extent do Chinese college
students find themselves and others susceptible to the influence of alcohol advertising? To what
extent do Chinese college students’ attitude toward alcohol advertising and products affect their

6
perceived influence of alcohol advertising? And to what extent does the perceived influence of
alcohol advertising affect their views about restrictions of alcohol advertising?
In what follows, we will first review the relevant theoretical constructs and empirical
literature. A distinction between first-person effect and third-person effect is made to facilitate
understanding of the perceived influence of alcohol advertising. A structural equation model,
which incorporates all hypothesized relationships among the key constructs, will then be
presented, followed by a survey study designed to empirically test the hypotheses.
7
Chapter Two
Literature Review
In this chapter, we present a review of the literature pertaining to the key theoretical
constructs of the proposed study: Third-person effect, first-person effect, attitude toward
advertising, attitude toward product, and attitude toward advertising restrictions.
Attitude toward Advertising and Product
At the micro level, ads that are well liked are more likely to be attended to and
remembered than ads that are not. This implies attitude held about an ad can predict subsequent
behavior related to the advertised product. A well-liked ad creates a well-liked product (Phelps &
Hoy, 1996). Petty & Cacioppo’s (1983) study of advertising effects revealed that attitudes
toward an advertised product were influenced more by their attitude toward the ad, or ad
likeability, than thoughts about the actual product. Shen (1998) presented evidence that
well-liked ads attracted more attention and cognitive elaborations which led to stronger brand
attitude and greater attitudinal impact on long-term purchasing behavior. Shavitt, Lowrey and
Hasefner (1998) presented similar findings that ad likability could enhance attention and
exposure to advertisements, especially among the targeted audiences. Subsequent research
generally supports the role of attitude toward the ad as a measure of advertising effectiveness
(Bergkvist & Rossiter 2008), a predictor of advertising success (Yelkur, Tomkovick, Hofer, &
Dozumalski, 2013), and a correlate to sales performance (Staple, 1996).
8
Two theoretical explanations were proposed to clarify the role of attitude toward the ad in
advertising processing: The dual mediation hypothesis and the affect transfer hypothesis.
According to the dual mediation hypothesis, consumers can have a positive attitude toward an ad
either because they find it believable or because they feel good about it. The enhanced
believability or liking induced by ad exposure would then mediate the effect of attitude toward
the ad on attitude toward the brand, which in turn may affect intention to purchase the brand
(Holbrook & Batra, 1987). In addition, when brands are new or not well known, consumers’
liking of the ad can play a more significant role in their liking of the brand (Chang & Chen,
2014).
The Affect Transfer Hypothesis (ATH) is another popular account of the mediating role
of attitude toward an ad (Mitchell & Olson, 1981; Shimp, 1981). The hypothesis, according to
MacKenzie, Lutz and Belch (1986), posits a direct one-way causal relationship from attitude
toward an ad to attitude toward a brand. The reasoning is that consumers learn to like or have
positive feelings for objects associated with “good” things, and they acquire adverse feelings
toward objects associated with “bad” things. For example, the use of attractive (unattractive)
sources could enhance (lessen) the likability of an advertising message. After repeated exposure
to an ad, the positive or negative feelings induced by an ad would eventually “transfer” from the
ad to the advertised brand.
At the macro level, public attitudes toward advertising in general also have been of
interest to researchers for years. Advertising researchers have been interested in the impact of
overall attitudes toward advertising on consumer behavior variables. Studies have suggested, for
example, that consumers' attitudes toward individual advertisements are influenced by their
attitudes toward advertising in general. People with more favorable feelings about advertising in

9
general found specific advertisements more acceptable, informative, and enjoyable (Bartos &
Dunn, 1974; Bauer & Greyser, 1968; Lutz, 1985). Consumers' overall positive attitude toward all
advertising is also related positively to involvement with specific advertisements (James &
Kover, 1992). From a public policy perspective, concerns have been voiced that criticisms of
advertising (i.e., it presents false and misleading information, it promotes undesirable values, it
persuades people to buy things they do not need, etc.) may undermine its effectiveness or even
lead to pleas for greater regulation (Calfee & Ringold, 1988; Pollay & Mittal, 1993).
Within the context of alcohol advertising, studies have found that adolescents and youth
exposed to a greater amount of alcohol advertising were more likely to use or intend to use
alcohol products than those who were less exposed (e.g., Garfield et al., 2003; Kelly & Edwards,
1998). Furthermore, several studies have shown that young people tend to view alcohol
advertising as fun, youthful, and exciting, and they desire to be in situations similar to those
depicted in the ads (David et al., 2004; Wyllie, 1997). Such positive attitude presumably would
affect young people’s perception of the influence of alcohol advertising on their attitude toward
alcohol products (ATTP) as well as their views toward restrictions of alcohol advertising
(ATTR).
It should be further noted that some researchers have argued that the paths of influence
between attitude toward advertising and attitude toward the product may work both ways (i.e.,
ATTA à ATTP and ATTP à ATTA). The reversed path (ATTP à ATTA) was observed most
often in studies of controversial products such as alcoholic beverages. Wyllie (1997), for
example, found a reverse path of influence between attitude toward the alcohol advertising and
attitude toward alcohol products, where attitude toward the product category as a whole
predicted subsequent attitude toward alcohol advertising, but not the other way around.
10
Researchers also found that students who were already frequent drinkers (with established
ATTP) rated alcohol advertising as more effective, identified better with their portrayals of
alcohol use, and regarded those portrayals as more desirable compared with students who were
less frequent drinkers (Agostinelli & Grube, 2002). A higher drinking frequency also foretold
less approval of anti-alcohol abuse public-service announcements (David et al., 2004).
First-Person and Third-Person Effect
Studies in mass communication and public opinion point to the need to distinguish
between the perceived influence of media on oneself (first-person effect) and the perceived
influence on others (third-person effect). The same distinction is made in the present study
between college students’ perceived influence of alcohol advertising on themselves and on
others.
The third-person effect perceptual hypothesis, first proposed by Davison (1983), predicts
that individuals will perceive media messages to have a greater impact on other people than on
themselves. The hypothesis has generated numerous studies in an effort to explain this
phenomenon. Some researchers have argued that the third-person effect, at its heart, reflects a
self-serving bias (Gunther & Mundy, 1993; Gunther & Thorson, 1992). In their meta-analysis,
Paul, Salwen and Dupagne (2000) discussed varying sociological and psychological theories that
have been used to explain the third-person effect and its consequences, including ego
involvement, the elaboration likelihood model, the social categorization theory, attribution
theory, and biased optimism.
The comparison between self and others constitutes a form of unrealistic and biased
optimism that is motivated by the need for ego enhancement (Brown & Stayman, 1992). The
11
same motivation also may lead people to think that others are more likely to be harmed by the
media; if by comparison, it enhances their view of themselves (McLeod et al., 1999). The more
negative a message is perceived, the wider the gap between its perceived influence on self and
others (Eveland & McLeod 1999).
Perloff (1996) notes that the third-person effect is likely to manifest itself when media
message advocates behavior that will not be beneficial for the self, or gives rise to the perception
that it is not smart to be influenced by the message. The end result is that people surmise others
to fall victim to media’s influence while they do not. White (1997) also suggests that people are
likely to consider themselves smarter and more resistant to a message when they feel the topic is
one that has little benefit, or even potentially harmful consequences, for its audience. Similarly,
Eveland et al. (1999) argue that the magnitude of the third-person effect perception is influenced
by the social desirability of the message—the lower the social desirability of the message, the
stronger the third-person effect.
Many researchers see the behavioral aspect of the third-person effect as the most socially
relevant phenomenon. The behavioral aspect suggests that people will favor restricting messages
that may negatively affect others. McLeod et al. (2001) showed that support for censorship
stemmed from subjects’ experiencing third-person perception. Salwen and Dupagne (1999)
found that willingness to support censorship was attributable to the perception that others were
not wholesome enough to resist immoral influences. In some instances, the support for limiting
access to media found its justification from a paternalistic attitude and the need to protect others
from harmful media effects (McLeod, 2000).
In contrast to the third-person effect, the first-person effect has been found to occur when
the potential benefit from a message is high. That is, when media messages are positive and

12
advocate beneficial outcomes, people tend to consider themselves just as influenced as others;
and in some cases, they may anticipate even stronger effect on themselves. Gunther and Mundy
(1993) point out that as interest in the messages increases, so does the perceive influence on
ourselves. Eveland and McLeod (1999) argue that ego enhancement is responsible for the
observed first-person effect where people view themselves as more persuaded by the desirable
media content.
Gunther and Thorson (1992) made the distinction between message that are intended to
inform, such as news, and those that are intended to persuade, such as advertising. They argued
that people will perceive the two domains of messages accordingly and will show
domain-specific processing patterns. Specifically, exposure to news is both sought-after and
socially desirable, while advertising is usually an event to avoid. Being persuaded by
advertising is often viewed as detrimental, the general sphere of advertising would thus likely to
exhibit third-person effect.
However, Gunther and Thorson (1992) also noted that some advertising might induce a
first-person effect. They examined estimates of influence on self and others in relation to ads that
contained an emotional appeal and found that although the self and others were equally affected
by the positively-emotional message, subjects tended to recognize and admit more of an impact
on themselves than others. Given young audience often characterize alcohol advertising as fun,
youthful, exciting, and thus emotional (David et al., 2004; Wyllie, 1997), one would expect such
advertising to induce the first-person effect as well.
It should also be noted that the first- and the third-person effect are often related.
Specifically, the perceived influence of alcohol advertising on self may constitute the basis for
the assessment of the influence on others. The reasoning is consistent with the hypothesis of

13
looking glass perception which finds individuals to project their own thoughts and feelings onto
others: “what I think must be what others think” (Fields & Schuman, 1976). The looking glass
perception is assumed to operate quite apart from the actual distribution of opinion. Relative to
the current study, the hypothesis suggest that if college students experience the first-person effect
of alcohol advertising, they would project the perceived influence onto others in the form of the
third-person effect.

14
Chapter Three
Research Hypotheses
We have so far reviewed two separate lines of research that are closely related to the
current study of alcohol advertising in China. Attitudes toward alcohol products and alcohol
advertising, as discussed earlier, are indispensable concepts in studying alcohol advertising
effects. The first- and third-person hypotheses provide additional insights to the underlying
mechanisms of the effect processes as well as their behavioral consequences. The general
question that emerges from the review is: What are the relationships among attitude toward
alcohol advertising, attitude toward alcohol products, and the perceived influence of alcohol
advertising on self and others?
In a rare attempt to bring these two lines of research together, Begin and Liu (2006)
examined attitude toward alcohol advertising, attitude toward alcohol products, first- and
third-person effects on college students’ attitude toward placing greater restrictions on alcohol
advertising. Through a survey among 488 American college students, the study found support for
the hypothesized direct effect of advertising and product attitudes on attitude toward restrictions.
Also supported was the indirect effect of advertising and product attitudes via such mediators as
perceived influence on self (first-person effect) and others (third-person effect).
Begin and Liu’s (2006) study thus serves as an excellent model for the present study. It
would be interesting to see if their findings are replicated in the context of China, a country with
lax alcohol purchasing, consumption and advertising regulations and known for its drinking
culture. In what follows, we will present the research hypotheses and a structural model which
15
allows for the testing of the hypotheses. To facilitate clarity, the following acronyms will be used
to represent the variables under study.
ATTA: Attitude toward alcohol advertising.
ATTP: Attitude toward alcohol products.
ATTR: Attitude toward government restrictions on alcohol advertising.
SELF: Perceived influence of alcohol advertising on oneself.
OTHERS: Perceived influence of alcohol advertising on others.
The first set of hypotheses deals with the relationships among the attitude variables
(ATTA, ATTP and ATTR):
H1: There is a positive relationship between an attitude toward alcohol advertising
(ATTA) and attitude towards alcohol products (ATTP). (ATTA ßà ATTP)
H2: There is a negative relationship between attitude toward alcohol advertising (ATTA)
and attitude toward government restrictions on alcohol advertising (ATTR). (ATTA à ATTR)
H3: There is a negative relationship between attitude toward alcohol products (ATTP)
and attitude toward government restrictions on alcohol advertising (ATTR). (ATTP à ATTR)
The second set of hypotheses is derived from the first- and third-effects hypotheses:
H4: There is a positive relationship between perceived influence of alcohol advertising
on oneself (SELF) and attitude toward government restrictions on alcohol advertising (ATTR).
(SELF à ATTR)
H5: There is a positive relationship between perceived influence of alcohol advertising
on others (OTHERS) and attitude toward government restrictions on alcohol advertising
(ATTR). (OTHERS à ATTR)

16
The third set of hypotheses brings together all five variables in the study: ATTA, ATTP,
SELF, OTHERS and ATTR.
H6: Perceived influence of alcohol advertising on oneself (SELF) will mediate the
relationship between attitude toward alcohol advertising (ATTA) and attitude toward
government restrictions on alcohol advertising (ATTR). (ATTA à SELF à ATTR)
H7: Perceived influence of alcohol advertising on oneself (SELF) will mediate the
relationship between attitude toward alcohol products (ATTP) and attitude toward government
restrictions on alcohol advertising (ATTR). (ATTP à SELF à ATTR)
H8: Perceived influence of alcohol advertising on others (OTHERS) will mediate the
relationship between attitude toward alcohol advertising (ATTA) and attitude toward
government restrictions on alcohol advertising (ATTR). (ATTA à OTHERS à ATTR)
H9: Perceived influence of alcohol advertising on others (OTHERS) will mediate the
relationship between attitude toward alcohol products (ATTP) and attitude toward government
restrictions on alcohol advertising (ATTR). (ATTP à OTHERS à ATTR)
H10: there is a positive relationship between perceived influence of alcohol advertising
on oneself (SELF) and perceived influence of alcohol advertising on others (OTHERS). (SELF
à OTHERS)
The structural equation model (see Figure 1) incorporates all hypotheses stated above.
The five variables are treated as latent variables with multiple measured indicators.

17
Figure 1. Structural Equation Model
18
Chapter Four
Methodology
This chapter explains the research design and methods that were used in the study.
Design & Sample
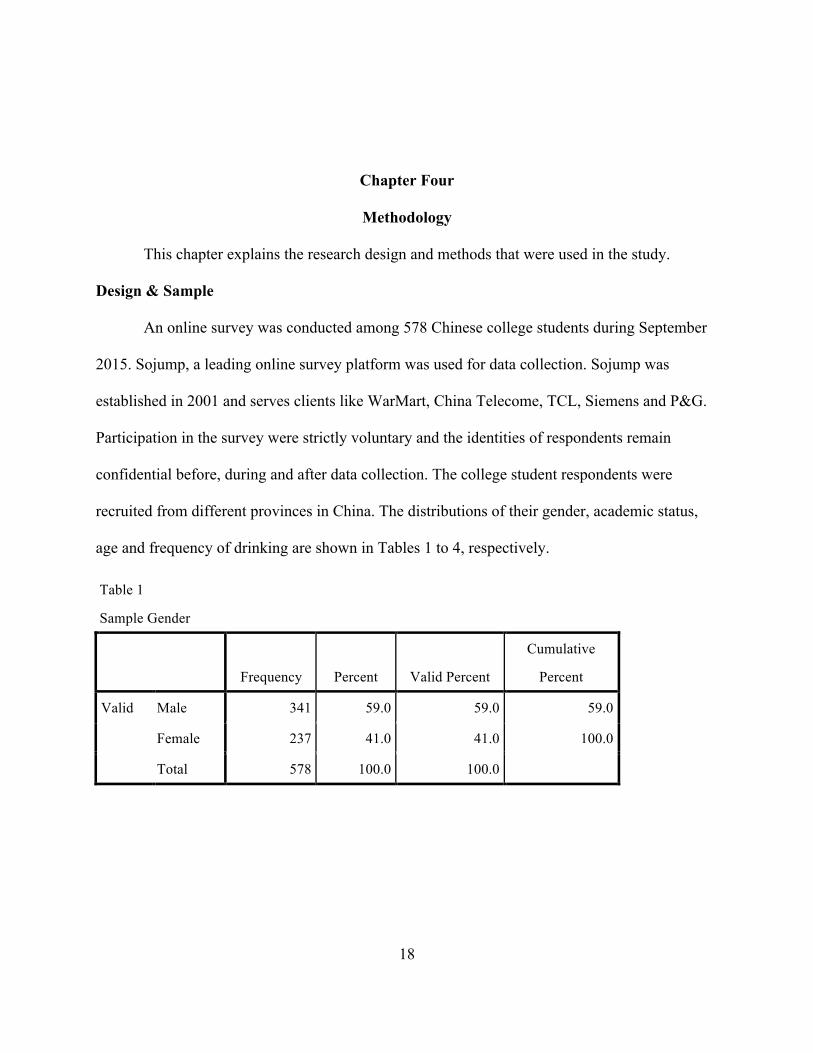
An online survey was conducted among 578 Chinese college students during September
2015. Sojump, a leading online survey platform was used for data collection. Sojump was
established in 2001 and serves clients like WarMart, China Telecome, TCL, Siemens and P&G.
Participation in the survey were strictly voluntary and the identities of respondents remain
confidential before, during and after data collection. The college student respondents were
recruited from different provinces in China. The distributions of their gender, academic status,
age and frequency of drinking are shown in Tables 1 to 4, respectively.
Table 1
Sample Gender
Frequency Percent Valid Percent
Cumulative
Percent
Valid Male 341 59.0 59.0 59.0
Female 237 41.0 41.0 100.0
Total 578 100.0 100.0
19
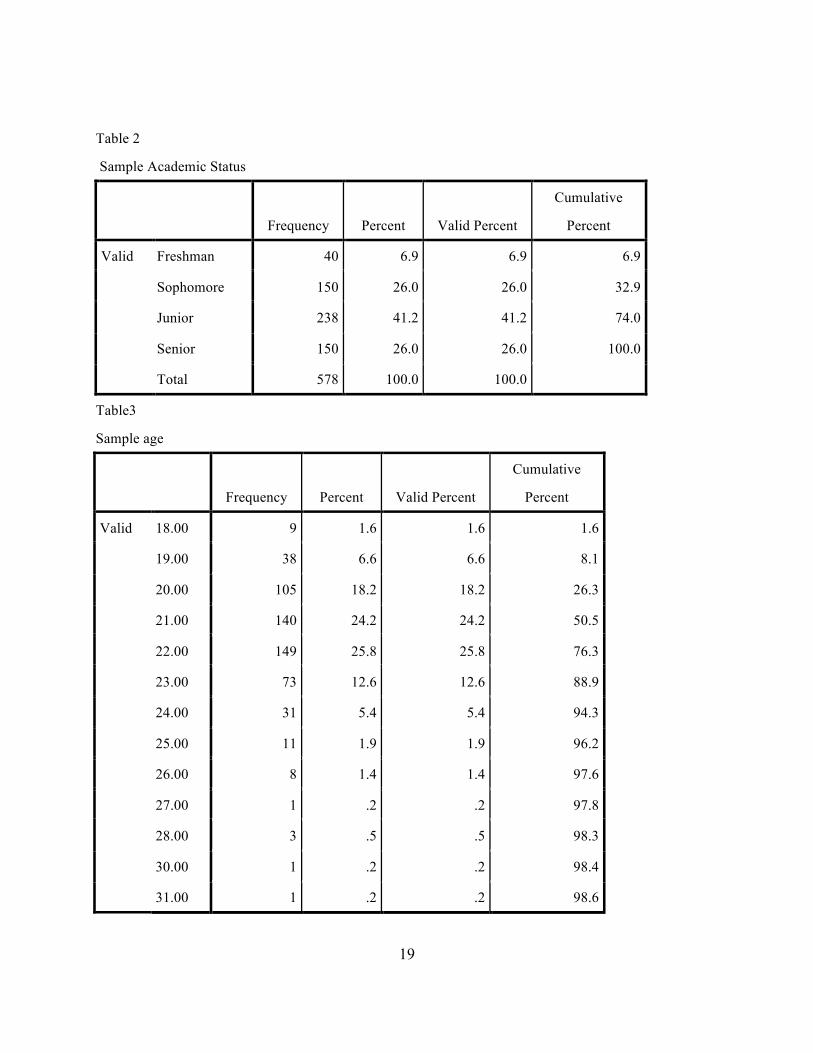
Table 2
Sample Academic Status
Frequency Percent Valid Percent
Cumulative
Percent
Valid Freshman 40 6.9 6.9 6.9
Sophomore 150 26.0 26.0 32.9
Junior 238 41.2 41.2 74.0
Senior 150 26.0 26.0 100.0
Total 578 100.0 100.0
Table3
Sample age
Frequency Percent Valid Percent
Cumulative
Percent
Valid 18.00 9 1.6 1.6 1.6
19.00 38 6.6 6.6 8.1
20.00 105 18.2 18.2 26.3
21.00 140 24.2 24.2 50.5
22.00 149 25.8 25.8 76.3
23.00 73 12.6 12.6 88.9
24.00 31 5.4 5.4 94.3
25.00 11 1.9 1.9 96.2
26.00 8 1.4 1.4 97.6
27.00 1 .2 .2 97.8
28.00 3 .5 .5 98.3
30.00 1 .2 .2 98.4
31.00 1 .2 .2 98.6

20
Table3 (continued)
Sample age
Frequency Percent Valid Percent
Cumulative
Percent
Valid 34.00 1 .2 .2 98.8
35.00 4 .7 .7 99.5
41.00 1 .2 .2 99.7
44.00 1 .2 .2 99.8
54.00 1 .2 .2 100.0
Total 578 100.0 100.0
Table 4
Sample Drinking Frequency
Frequency Percent Valid Percent
Cumulative
Percent
Valid Never 30 5.2 5.2 5.2
Rarely 147 25.4 25.4 30.6
Sometimes 298 51.6 51.6 82.2
Often 103 17.8 17.8 100.0
Total 578 100.0 100.0
Survey Instrument
The survey questionnaire was designed in English first and then translated to Chinese in
order to be more convenient for respondents. Instructions were presented before the questions,
including a confidentiality statement. The questionnaire had twenty-six questions, and it took

21
approximately 10 minutes to complete. The Appendix provides the English and Chinese versions
of the questionnaire.
The measures of the variables in this study are modified from Begin and Liu (2006).
Attitudes towards alcohol advertising (ATTA) was measured by five Likert-scale (5= strongly
agree; 1= strongly disagree) questions:
1. I like alcohol advertising.
2. I don’t have any problem with alcohol advertising.
3. I enjoy watching alcohol advertising on mass media.
4. I identify with the characters and situations portrayed in alcohol advertising.
5. Alcohol adverting adds more fun to drinking.
Attitudes towards alcohol products (ATTP) was measured by five Likert-scale (5=
strongly agree; 1= strongly disagree) questions:
1. I hold a positive opinion for most alcoholic beverages.
2. I like liquoring, beer or wining products.
3. I like to drink alcoholic beverages.
4. I know how much drinking is too much.
5. I don’t think drinking alcohol has harmful effects.
The perceived influence of alcohol adverting on oneself (SELF) was measured by 4-point
scales (4=a great deal of influence, 1=no influence at all) as follows:
1. To what extent do you think alcohol advertising influences your purchase of alcohol
products?
2. To what extent do you think alcohol adverting influences your consumption of alcohol
products?

22
3. To what extent do you think alcohol adverting influences your attitude towards alcohol
products?
Three 4-point (4=a great deal of influence, 3= some influence, 2= very little influence, 1=
no influence at all) items were used to measure the perceived effect of alcohol advertising on
others (OTHERS).
1. To what extent do you think alcohol advertising has an influence on other students’
purchase of alcohol products?
2. To what extent do you think alcohol adverting has an influence on other students’
consumption of alcohol products?
3. To what extent do you think alcohol advertising has an influence on other students’
attitudes toward alcohol products?
Attitude toward restrictions on alcohol advertising (ATTR)will be measured by five
Likert scale (5= strongly agree; 1= strongly disagree) questions:
1. Students under the age of 18 shouldn’t be exposed to Alcohol adverting
2. Alcohol companies shouldn’t advertise to college students.
3. Government should be planning more restrictions on alcohol advertising.
4. I support the idea of prohibiting alcohol ads from some media forms
5. I support the idea of banning alcohol ads from all forms of media.
The final part of the questionnaire contained three measures of sample demographics
(age, gender, education Level) and one measure on respondents’ drinking frequency.

23
Chapter Five
Results
Table 5 displays the means and standards deviations of individual items used to measure
ATTA, ATTG, SELF, OTHERS and ATTR. Also presented are the means, standard deviations
of the averaged composite measures of these constructs. All Cronbach’s alphas were greater than
.70, indicating the measures achieved acceptable levels of internal consistency.
Table 5
Descriptive and Reliability Statistics
N Mean Std. Deviation Cronbach’s α
ATTA 578 3.5388 .70653 .842
ATTA1 578 3.4498 .86231
ATTA2 578 3.7716 .87509
ATTA3 578 3.4170 .92577
ATTA4 578 3.5934 .84239
ATTA5 578 3.4619 .99884
ATTP 578 3.4394 .70578 .739
ATTP1 578 3.8737 .77636
ATTP2 578 3.3287 1.03621
ATTP3 578 3.3028 1.06952
ATTP4 578 3.7612 .99483
ATTP5 578 2.9308 1.13189

24
Table 5 (continued)
Descriptive and Reliability Statistics
N Mean Std. Deviation Cronbach’s α
SELF 578 2.6188 .74795 .778
Self1 578 2.7958 .85308
Self2 578 2.3962 .96765
Self3 578 2.6644 .87214
OTHERS 578 2.7976 .68881 .785
Other1 578 2.8547 .78746
Other2 578 2.7249 .85648
Other3 578 2.8131 .82615
ATTR 578 3.3716 .74034 .791
ATTR1 578 3.6315 .96427
ATTR2 578 3.5554 .99281
ATTR3 578 3.5000 .98031
ATTR4 578 3.5121 .95878
ATTR5 578 2.6592 1.11229
Valid N
(listwise) 578
Table 6 shows that respondents in the present study exhibited, on the average, a favorable
attitude toward alcohol products (mean ATTP = 3.44, SD =.71), a favorable attitude toward
alcohol advertising (mean ATTA = 3.54, SD=.71) as well as a favorable attitude toward more
restrictions on such advertising (mean ATTR = 3.37, SD = .74). One-sample t-test results (Table
7) showed that all three attitude means were significantly different the neutral point of 3 on the

25
scale (tATTA = 18.33, df = 578, p < 0.001; tATTP = 14.97, df = 578, p < 0.001, tATTR = 18.07, df =
578, p < 0.001 ).
Table 6
ATTA, ATTP, ATTR: Means and Standard Deviations
N Mean Std. Deviation Std. Error Mean
ATTA 578 3.5388 .70653 .02939
ATTP 578 3.4394 .70578 .02936
ATTR 578 3.3716 .74034 .03079
Table 7
One-Sample t-tests: ATTA, ATTP, ATTR
Test Value = 3
t df Sig. (2-tailed)
Mean
Difference
95% Confidence Interval of the
Difference
Lower Upper
ATTA 18.333 577 .000 .53875 .4810 .5965
ATTP 14.969 577 .000 .43945 .3818 .4971
ATTR 12.068 577 .000 .37163 .3111 .4321
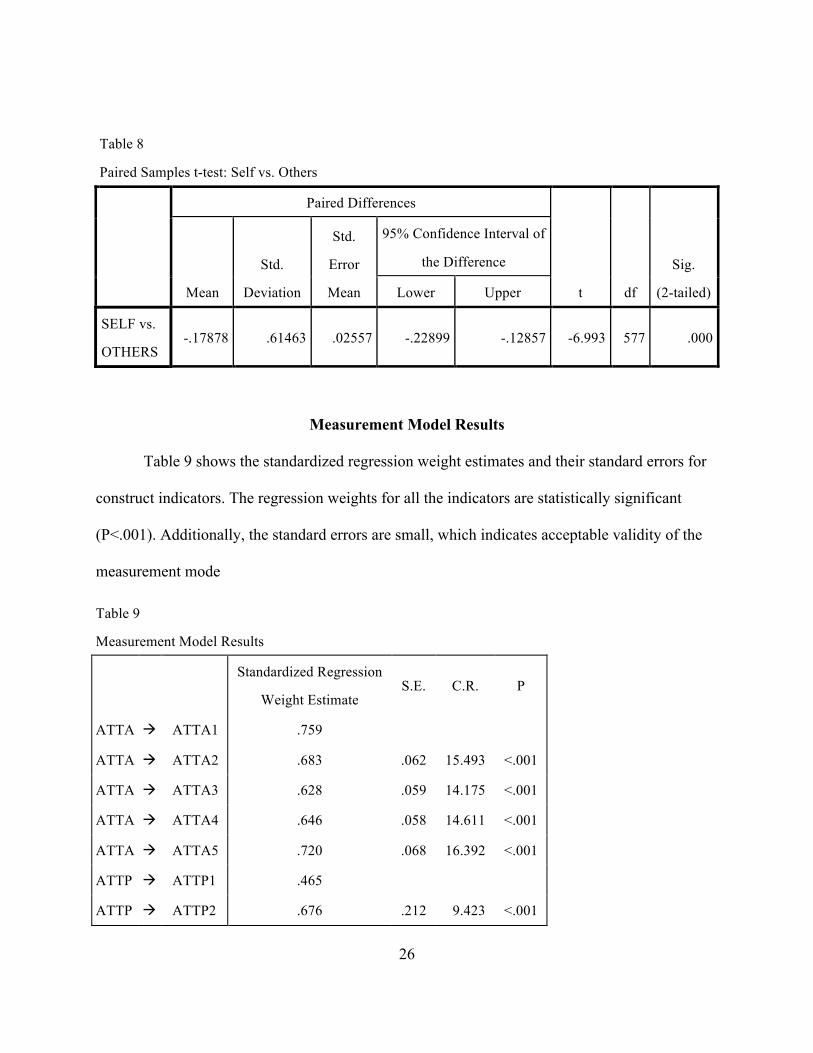
Table 8 shows a paired samples t-test that compared respondents’ perceived influence of
alcohol advertising on themselves and on other college students. Test results indicated that
respondents tended to perceive greater influence of alcohol advertising on other college students
(Mean OTHERS = 2.80, SD =.69) than on themselves (Mean SELF = 2.62, SD =.75) (t = -
6.993, df = 577, p < 0.001).
26
Table 8
Paired Samples t-test: Self vs. Others
Paired Differences
t df
Sig.
(2-tailed) Mean
Std.
Deviation
Std.
Error
Mean
95% Confidence Interval of
the Difference
Lower Upper
SELF vs.
OTHERS -.17878 .61463 .02557 -.22899 -.12857 -6.993 577 .000
Measurement Model Results
Table 9 shows the standardized regression weight estimates and their standard errors for
construct indicators. The regression weights for all the indicators are statistically significant
(P<.001). Additionally, the standard errors are small, which indicates acceptable validity of the
measurement mode
Table 9
Measurement Model Results
Standardized Regression
Weight Estimate S.E. C.R. P
ATTA à ATTA1 .759
ATTA à ATTA2 .683 .062 15.493 <.001
ATTA à ATTA3 .628 .059 14.175 <.001
ATTA à ATTA4 .646 .058 14.611 <.001
ATTA à ATTA5 .720 .068 16.392 <.001
ATTP à ATTP1 .465
ATTP à ATTP2 .676 .212 9.423 <.001

27
ATTP à ATTP3 .711 .223 9.609 <.001
Table 9 (continued)
Measurement Model Results
Standardized Regression
Weight Estimate S.E. C.R. P
ATTP à ATTP4 .404 .160 7.069 <.001
ATTP à ATTP5 .593 .232 8.400 <.001
ATTR à ATTR1 .644
ATTR à ATTR2 .556 .078 11.272 <.001
ATTR à ATTR3 .893 .093 15.322 <.001
ATTR à ATTR4 .745 .081 14.294 <.001
ATTR à ATTR5 .475 .087 9.824 <.001
SELF à Self1 .676
SELF à Self2 .733 .089 14.484 <.001
SELF à Self3 .710 .078 14.118 <.001
OTHERS à Other1 .701
OTHERS à Other2 .735 .076 14.685 <.001
OTHERS à Other3 .755 .079 14.990 <.001
Structure Model Results
Table 10 shows the results of the structural model obtained through SPSS AMOS. An
initial question is whether the structural equation analysis estimates for the model provide
adequate fit to the data. Although the Chi-square test indicates lack of model fit (X2 = 362.495,
df = 179, p = .000), it should be noted that the Chi-square test is sensitive to large sample sizes,
like the one employed in the present study. Assessment of the model’s fit thus relied on other

28
goodness-of-fit indices. Bryne (2001) suggests that models with GFI, AGFI, and CFI values
greater than .90, and a RMSEA less than or equal to .10 be judged as providing a reasonable fit
to the data. Similarly, Hu and Bentler (1999) recommend RMSEA values below .06. In this
study, all these goodness-of-fit measures (GFI = .94; AGFI = .91; CFI = .95, TLI = .93, RMSEA
=.049) indicate that the model provides acceptable fit to the data. Figure 2 is a pictorial display
of the structural model results.
Table 10
Estimates of Standardized Regression Weights
Standardized Regression
Weight Estimate S.E. C.R. P
ATTA à SELF .804 .122 5.693 ***
ATTP à SELF -.035 .217 -.258 .796
ATTA à OTHERS .043 .139 .265 .791
ATTP à OTHERS -.113 .206 -.881 .379
SELF à OTHERS .909 .115 7.931 ***
ATTA à ATTR -.274 .194 -1.400 .161
ATTP à ATTR .116 .299 .716 .474
SELF à ATTR -.470 .277 -1.753 .043
OTHERS à ATTR .614 .224 3.156 .002
ATTP ßà ATTA . 861 .022 8.318 ***
*** p<.001, X2 = 362.495, df = 179, p = .000; GFI = .941; AGFI = .912;
NFI = .918; CFI = .951; TLI = .933, RMSEA = .049

29
Figure 2. Structural Equation Model Results
(*p<.05, **p<.01)

30
Hypotheses Testing
This section presents hypotheses testing results, starting with the hypothesized
relationships among the attitude variables (ATTA, ATTP and ATTR). H1 states that there is a
positive relationship between an attitude toward alcohol advertising (ATTA) and attitude
towards alcohol products (ATTP). The hypothesis was supported by the positive correlation
between ATTA and ATTP (r = .861, p < .001): As college students’ attitude towards alcohol
advertising becomes more favorable, so is their attitude toward alcohol products, and vice versa.
However, results failed to support H2 which states that there is a negative relationship
between attitude toward alcohol advertising (ATTA) and attitude toward restrictions on alcohol
advertising (ATTR) (β ATTA→ATTR = -.294, p = .161). Similarly, results failed to support H3
which states that there is a negative relationship between attitude toward alcohol products
(ATTP) and attitude toward government restrictions on alcohol advertising (ATTR) (β
ATTP→ATTR= .116, p = .474). Both H2 and H3 were thus rejected.
In line with the first-person effect, H4 states that there is a positive relationship between
perceived influence of alcohol advertising on oneself (SELF) and attitude toward restrictions on
alcohol advertising (ATTR). Results of the SEM analysis showed that the relationship was
significant but negative (β SELF→ATTR = -.470, p = .043). That is, contrary to the first-person
effect, the stronger the perceived influence of alcohol influence on oneself is, the less favorable
the attitude toward restrictions on alcohol advertising would be. Thus, hypothesis H4 was not
supported.
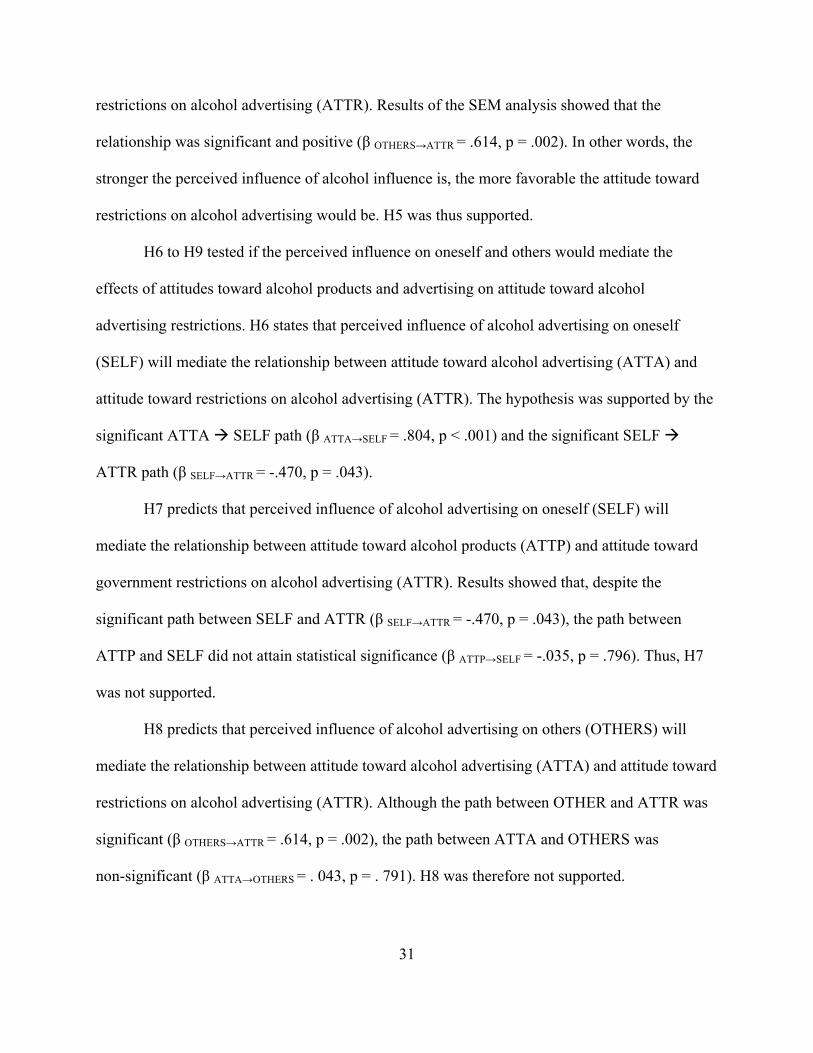
Consistent with the third-person effect, H5 states that there is a positive relationship
between perceived influence of alcohol advertising on others (OTHERS) and attitude toward
31
restrictions on alcohol advertising (ATTR). Results of the SEM analysis showed that the
relationship was significant and positive (β OTHERS→ATTR = .614, p = .002). In other words, the
stronger the perceived influence of alcohol influence is, the more favorable the attitude toward
restrictions on alcohol advertising would be. H5 was thus supported.
H6 to H9 tested if the perceived influence on oneself and others would mediate the
effects of attitudes toward alcohol products and advertising on attitude toward alcohol
advertising restrictions. H6 states that perceived influence of alcohol advertising on oneself
(SELF) will mediate the relationship between attitude toward alcohol advertising (ATTA) and
attitude toward restrictions on alcohol advertising (ATTR). The hypothesis was supported by the
significant ATTA à SELF path (β ATTA→SELF = .804, p < .001) and the significant SELF à
ATTR path (β SELF→ATTR = -.470, p = .043).
H7 predicts that perceived influence of alcohol advertising on oneself (SELF) will
mediate the relationship between attitude toward alcohol products (ATTP) and attitude toward
government restrictions on alcohol advertising (ATTR). Results showed that, despite the
significant path between SELF and ATTR (β SELF→ATTR = -.470, p = .043), the path between
ATTP and SELF did not attain statistical significance (β ATTP→SELF = -.035, p = .796). Thus, H7
was not supported.
H8 predicts that perceived influence of alcohol advertising on others (OTHERS) will
mediate the relationship between attitude toward alcohol advertising (ATTA) and attitude toward
restrictions on alcohol advertising (ATTR). Although the path between OTHER and ATTR was
significant (β OTHERS→ATTR = .614, p = .002), the path between ATTA and OTHERS was
non-significant (β ATTA→OTHERS = . 043, p = . 791). H8 was therefore not supported.
32
H9 prescribes that perceived influence of alcohol advertising on others (OTHERS) will
mediate the relationship between attitude toward alcohol products (ATTP) and attitude toward
government restrictions on alcohol advertising (ATTR). The ATTPàOTHERS path was not
significant (β ATTP→OTHERS = -.113, p = . 379), although the path between OTHERS and ATTR
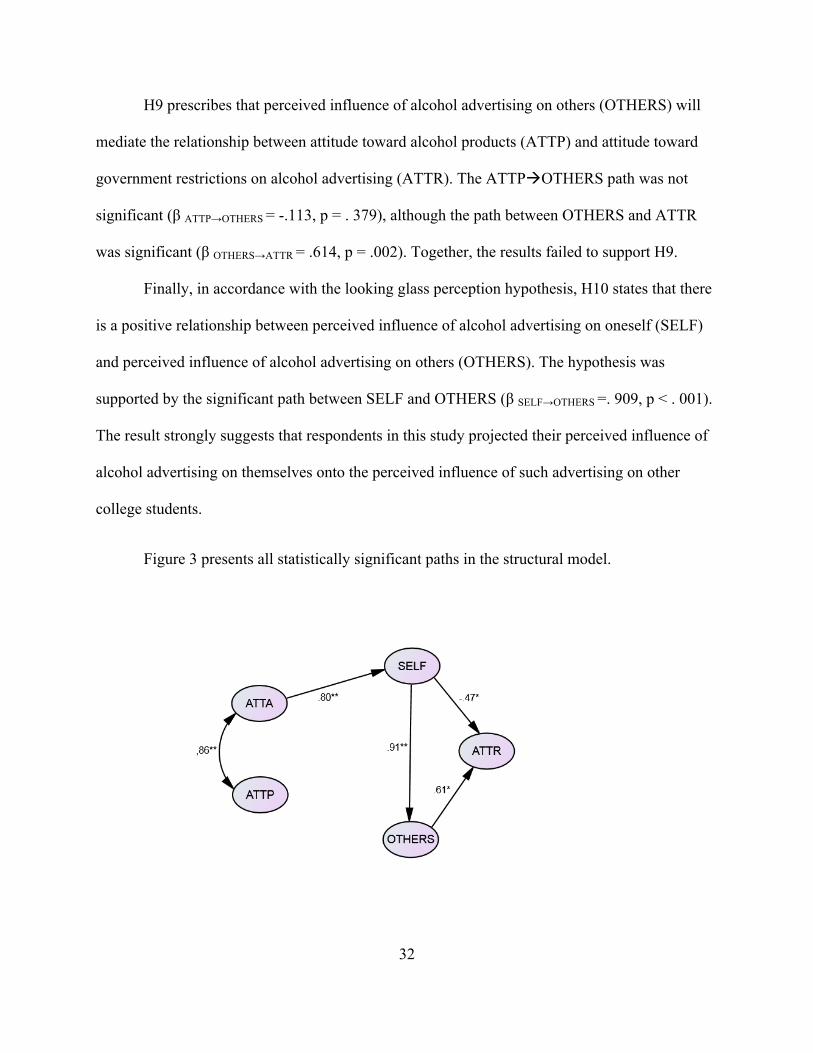
was significant (β OTHERS→ATTR = .614, p = .002). Together, the results failed to support H9.
Finally, in accordance with the looking glass perception hypothesis, H10 states that there
is a positive relationship between perceived influence of alcohol advertising on oneself (SELF)
and perceived influence of alcohol advertising on others (OTHERS). The hypothesis was
supported by the significant path between SELF and OTHERS (β SELF→OTHERS =. 909, p < . 001).
The result strongly suggests that respondents in this study projected their perceived influence of
alcohol advertising on themselves onto the perceived influence of such advertising on other
college students.
Figure 3 presents all statistically significant paths in the structural model.

33
Figure 3. Significant Paths
** p<.001, * p<.05
Chapter Six Discussion
The purpose of this study was to explore the relationships among Chinese college
students’ attitudes toward alcohol products and alcohol advertising, their perceived influence of
alcohol advertising on themselves and others, and their attitude toward restrictions on alcohol
advertising. A series of hypotheses were proposed and tested, and the results are summarized in
Table 11.
Table 11
Summary of Hypotheses Testing
Hypothesis Relationship Rationale Result
H1 ATTA ßà ATTP Correlation Supported
H2 ATTA à ATTR Direct effect Not supported
H3 ATTP à ATTR Direct effect Not supported
H4 SELF à ATTR First-person effect Not supported
H5 OTHERS à ATTR Third-person effect Supported
H6 ATTA à SELF à ATTR Indirect (mediated) effect Supported
H7 ATTP à SELF à ATTR Indirect (mediated) effect Not supported
H8 ATTA à OTHERS à ATTR Indirect (mediated) effect Not supported
H9 ATTP à OTHERS à ATTR Indirect (mediated) effect Not supported
H10 SELF à OTHERS Looking glass perception Supported
34
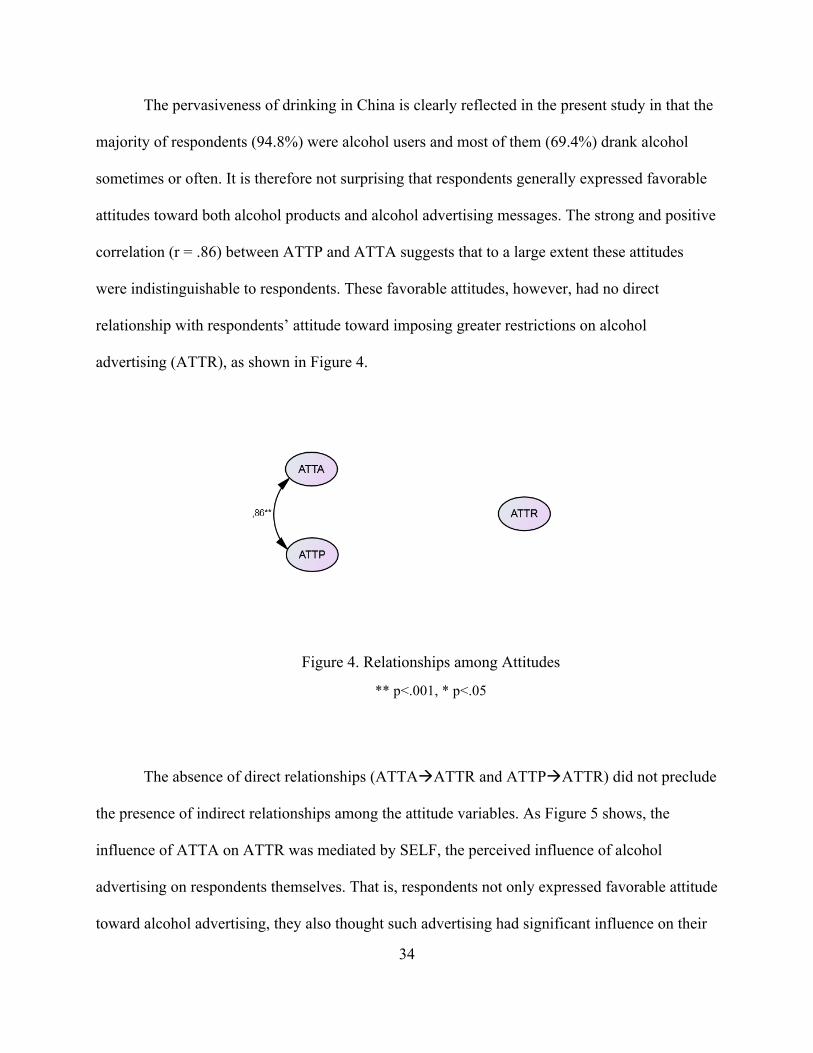
The pervasiveness of drinking in China is clearly reflected in the present study in that the
majority of respondents (94.8%) were alcohol users and most of them (69.4%) drank alcohol
sometimes or often. It is therefore not surprising that respondents generally expressed favorable
attitudes toward both alcohol products and alcohol advertising messages. The strong and positive
correlation (r = .86) between ATTP and ATTA suggests that to a large extent these attitudes
were indistinguishable to respondents. These favorable attitudes, however, had no direct
relationship with respondents’ attitude toward imposing greater restrictions on alcohol
advertising (ATTR), as shown in Figure 4.
Figure 4. Relationships among Attitudes
** p<.001, * p<.05
The absence of direct relationships (ATTAàATTR and ATTPàATTR) did not preclude
the presence of indirect relationships among the attitude variables. As Figure 5 shows, the
influence of ATTA on ATTR was mediated by SELF, the perceived influence of alcohol
advertising on respondents themselves. That is, respondents not only expressed favorable attitude
toward alcohol advertising, they also thought such advertising had significant influence on their

35
attitude toward drinking and drinking behavior. However, results also indicated that the
perceived influence of alcohol advertising actually led to less favorable attitude toward more
restrictions on alcohol advertising. The seemingly contracting views of respondents appear to be
in agreement with Gunther and Thorson’s (1992) explication of the first-person effect of
advertising. These authors argue that advertising messages, due to their positively-emotional
content (through, for example, associating product consumption with fun and happiness), may
actually be perceived by consumers as beneficial to their well-being, thus greater perceived
first-person effect. Similarly, Eveland and McLeod (1999) argue that the first-person effect is
often observed when people are exposed to desirable media content. Consistent with this line
reasoning, the ATTAàSELFàATTR mediating process suggests that respondents in this study
were saying, “We like alcohol advertising because it has a positive impact on me, so do not
restrict alcohol advertising for my sake.”
Figure 5. Relationships among Attitudes and SELF
** p<.001, * p<.05

36
Perhaps the most intriguing finding of the present study is the presence of the ATTAà
SELFàOTHERSàATTR mediating process shown in Figure 6. First, as indicated above, the
positive ATTAàSELF link revealed respondents’ admission to the persuasive power of alcohol
advertising on themselves. Second, the positive SELFàOTHERS path lent strong support for
the presence of look glass perception through which respondents projected the perceived
influence on themselves to that on other college students -- if alcohol advertising has an impact
on me, it must also has an impact on others (Fields & Schuman 1976; Chan & Lee, 2009). To
conclude the mediating process, the positive OHTERSàATTR path suggests that respondents
would be in favor of greater restrictions on alcohol advertising because of their perceived
influence of such advertising on other college students.
The results thus points to the existence of opposing third-person and first-person effects
of alcohol advertising. One the one hand, the perceived influence of alcohol advertising on others
(third-person effect) leads to more favorable attitude toward advertising restrictions. On the other
hand, the perceived influence of alcohol advertising on oneself (first-person effect) leads to less
favorable attitude toward advertising restrictions. The opposing results also suggest that while
respondents perceive alcohol advertising to have detrimental effects on others, they perceive the
same advertising to have beneficial effects on themselves.

37
Figure 6. Relationships among Attitudes, SELF and OTHERS
** p<.001, * p<.05 Together, the first-person effect, third-person effect, and the highly pronounced looking
glass perception observed in this study point to a complex and conflicting views of alcohol
advertising. The strong tendency for respondents to project their own views onto others is
consistent with the transition of values observed in several studies of the Chinese society.
Several recent studies (Ren, 2012; Wang, 2011; Zhang, 2012), for instance, have noted that the
generation that grew up in the 1990s might best be characterized as the “me” generation known
for its egocentrism. Feng (2014) further attributes the rise of egocentrism among Chinese college
students to the nation’s rapidly growing economic prosperity, and Cao (2009) asserts that
economic prosperity has made the entire Chinese society more individualistic. According to Liao
(2012), the one-child policy in China further contributes to the increasingly noticeable
self-centered thoughts and behaviors among Chinese youth.

38
If the looking glass perception observed in this study points to the self-centered
tendency among Chinese college students, then the presence of the third-person effect suggests
that traditional Chinese values remain very much alive in their minds. Rooted in Confucianism,
the collectivistic culture in China values others more than self. An individual’s role is to
contribute to the great good of the society, even at the expense of one’s own interests (Kolstad &
Gjesvik, 2014; Armstrong & Swartzman, 2001). Moral codes such as “Do not do to others as one
would not like to have it done to oneself” (Confucius Analects, 1938) appeared to be powerful
source of influence in this study. After all, it is the perceived influence of alcohol advertising on
other college students that prompted respondents to express their support for restrictions on
alcohol advertising. Essentially the respondents were saying no to restrictions of alcohol
advertising for their sake, but yes to restrictions for others’ sake.
39
Chapter Seven
Conclusions
This thesis represents perhaps the first empirical study of the first-person and third-person
effects of alcohol advertising in China. The general results showed that the perceived influence
of alcohol advertising on oneself and others had opposing mediating the effects of attitudes
toward alcohol advertising on college students’ attitude toward restrictions of alcohol
advertising. Unlike previous studies that often investigated the effects of advertising in a social
vacuum, this study provides some initial evidence that advertising works, to a significant extent,
by affecting how consumers think about its influence on others as well as themselves. Indeed, a
more complex picture emerges when other people are involved. In contrast to prior studies that
assumed direct influence of advertising on the individual, this study took into account of the
social context and find advertising to have indirect third-person effects as well.
Findings of the present study also provided the theoretical foundation for studying
attitudinal antecedents to the first- and third-person effect in advertising. They suggest that the
effect that advertising achieves is not only due to any direct persuasive influence of the message
itself, but also to the behavior of those persons who anticipate, or think they perceive, some
reaction on the part of others, and behave differently as a result. People react to advertising
depending on how they think other people understand the communication. In other words, peer
and reference group pressure can be a powerful determinant in whether a person is likely to deny
that a communication has had a persuasive impact on them.
40
This study also extended previous studies by showing the intricate relationship between
the first- and the third-person effect. By projecting one’s one views to others through looking
glass perception, the first-person effect may actually gave impetus to the third-person effect in
evaluating advertising influence. The extent to which looking glass perception serves as a
theoretically valid interpretation of the relationship is largely determined by the cultural and
economic environment. Results of the present study suggests that the coexistence of self- and
other-centered values in modern China facilitated looking glass perception as a psychological
conduit between first- and third-person effects.
The present study also suggests that effective interventions to mitigate the potentially
harmful effects of alcohol advertising may require simultaneously addressing the two faces of
advertising effects: Decrease the perceived positive, first-person effect of alcohol advertising,
and increase its perceived negative, third-person effect. Communication designed to counter
alcohol advertising should (1) weaken the subjectively experienced positive feelings and
emotions induced by alcohol advertising, while at the same time (2) strengthen and channel the
objectively experienced negative influence of alcohol advertising on significant others,
The message to alcohol marketers and advertisers in China is that consumers are willing
to accept more restrictions on alcohol advertising because they are concerned about its
potentially harmful effects on others. The attitude in favor of restrictions is likely to become
stronger as alcohol consumption and advertising become more pervasive and popular. To
Chinese government agencies or legislative bodies, this study sends a clear signal that more
stringent regulations on alcohol advertising are needed to better serve the public interest.

41
Notwithstanding its contributions, the current study bears several limitations. First, the
study was based on a survey among Chinese college students, and consequently its results have
limited generalizability. More research based on different populations is therefore needed.
Second, the survey data and structural equation modeling (SEM) analysis used in this study dealt
with correlation, not causation (Everitt and Dunn 1991). It is also likely that this study merely
illuminated one of several theoretically viable models of the relationships among the variables.
Future research should thus attempt to the test alternative models to better determine the validity
of different theoretical explanations and predictions.

42
References
Agostinelli, G., & Grube, J. W. (2002). Alcohol Counter-Advertising and the Media: A Review
of Recent Research. Alcohol Research and Health, 26(1), 15-23.
Armstrong, T. L., & Swartzman, L. C. (2001). Cross-cultural differences in illness models and
expectations for the health care provider-client/patient interaction. Handbook of cultural
health psychology, 63-8
Badanielina-Hita, M. (2013). The effects of alcohol advertising on college students' behaviors:
Using family communication as a protective factor against heavy drinking and risky sexual
behaviors. Retrieved from http://hdl.handle.net/2376/4101
Baidu baike. (2012, January 18), Chinese Alcohol advertising management approach. Baidu
baike Retrieved from http://baike.baidu.com/link?url=
KBdsQe8BRrxuKtpwZclWnLcDQAxjRz-
5ByzwnvwthnBHso9KY0sYwosub-eq8ZNUoUKDIaLYEy-cY2r2yb_8ja.
Bartos, R. & Dunn, T. (1974). Advertising and Consumers: New Perspectives. New York:
American Association of Advertising Agencies.
Batra, R., & Ray, M. (1986). Affective responses mediating acceptance of advertising. Journal of
Consumer Research, 13(2), 234-249
Bauer, R. A., & Greyser, S.A. (1968). Advertising in America: The Consumer View. Boston:
Harvard University, Graduate School of Business Administration.

43
Begin, G. & Liu, S. (2006). Attitudinal antecedents of the first- and third-person effects of
alcohol advertising on college students. Proceedings of the Annual Conference of the
American Academy of Advertising, 64-71.
Belstock, S. A., Connolly, G. N., Carpenter, C. M., & Tucker, L. (2008). Using alcohol to sell
cigarettes to young adults: A content analysis of cigarette advertisements. Journal of
American College Health, 56(4), 383-389.
Bergkvist, L., & Rossiter, J. R. (2008). The role of ad likability in predicting an ad's campaign
performance. Journal of advertising, 37(2), 85-98.
Brown, S., & Stayman, D. (1992). Antecedents and Consequences of Attitude Toward the Ad: A
Meta-Analysis. Journal of Consumer Research, 19(June).
Byrne, B. (2001), Structural equation modeling with AMOS: Basic concepts, applications, and
programming, Mahwah, NJ: Erlbaum.
Calfee, J. E., & Ringold, D. J. (1988). Consumer skepticism and advertising regulation: What do
the polls show? Advances in Consumer Research, 15(1), 244-248.
Cao. J. X. (2009). The analysis of tendency of transition from collectivism to individualism in
China. Cross-Cultural Communication, 5(4), 42-50
Chan, J., & Lee, F. (2009). Media use, looking-glass perception, and majority rule principle: A
study of perceived public opinion. Retrieved from
http://www.allacedemic.com/meta/p12697_index.html
Chang, C. W., & Chen, G. M. (2014). College students’ disclosure of location-related
information on Facebook. Computers in Human Behavior, 35, 33-38.

44
Chen, Y., Guo, Y., Liu, J., Miao, S., Miao, H., & Zhang. Z.T. (2013). The survey report about
drinking issues of college students. Retrieved from http://wenku.baidu.com/link?url
=334pEtzeHHZ0oK_Qzs8ImcpdbytYgNDsHLUbXGWuk_k3xkbz268_5mdn9FHASP-QjL
4-xi2LFwzVZF7PkThKE3II3y8OT-cee1GcbjEgndO.
Cheng, H.P. (2015, August 26). Is drinking a good habit for women? 17 harms that may bring
forward to women having drinking habits. Yang sheng zhi dao website. Retrieved from
http://www.ys137.com/ysrq/148893.html
Confucius, & Waley, A. (1938). The Analects of Confucius. New York: Random House.
Cremeens, J. L., Usdan, S. L., Talbott-Forbes, L., & Martin, R. J. (2013). Assessment of campus
alcohol policies: Implications for college administrators. American Journal of Health
Studies, 28(1), 1-7.
David, P., Liu, K., & Myser, M. (2004). Methodological artifact or persistent bias? testing the
robustness of the third-person and reverse third-person effects for alcohol messages.
Communication Research, (2), 206-233.
Davison, W. P. (1983). The third-person effect in communication. Public Opinion Quarterly,
47(1), 1-15.
Dupagne, M., & Salwen, M.B. (1999). The third-person effect: perceptions of the media’s
influence and immoral consequences. Communication Research, 26(5), 523-549.
Eveland, J.,William P., & McLeod, D. M. (1999). The effect of social desirability on perceived
media impact: Implications for third-person perceptions. International Journal of Public
Opinion Research, 11(4), 315-333.
Eveland, J.,William P., Nathanson, A. I., Detenber, B. H., & McLeod, D. M. (1999). Rethinking
he social distance corollary. Communication Research, 26(3), 275.

45
Everitt, B., & Dunn, G. (1991), Applied multivariate data analysis, London: Edward Arnold.
Fields, J. M. & H. Schuman (1976). Public Beliefs about Beliefs of the Public. Public Opinion
Quarterly, 40, 427-448.
Feng, J. (2014) The post-modern tendency of post-90s: university students and its
countermeasures study (unpublished master thesis). Retrieved from CMFD 2015 (in
Chinese)
Garfield, C.F., Chung, P.J., & Rathouz, P.J. (2003). Alcohol advertising in magazines and
adolescent readership. Journal American Medical Association, 289 (18), 2424-2429.
Gong, Y. (2008). Jiuxian temperament and Jiushen spirit. Journal of Kangding Nationaltiy
Teachers College, 17(2), 42-45.
Guo, X., & Huang, Y. G. (2015). The development of alcohol policy in contemporary china.
Journal of Food & Drug Analysis, 23(1), 19-29. doi:10.1016/j.jfda.2014.05.002
Gunther, A.C., & Mundy, P. (1993). Biased Optimism and the Third-Person Effect. Journalism
Quarterly, 70, 58-67.
Gunther, A.C., & Thorson, E. (1992). Perceived Persuasive Effects of Product Commercials and
Service Announcements. Communication Research, 19(5), 574- 596.
Holbrook, M., & Batra, R. (1987). Assessing the role of emotions as mediators of consumer
responses to advertising, Journal of consumer Research, 14(3),404-420.
Huang, Y., & Tao, F. (2012). The interaction influence of high school students drinking behavior
and harm health behavior. Aihui Journal of Preventive Medicine, 17(5).
Kelly, K.J., & Edwards, R.W. (1998, Spring,). Image Advertisements for Alcohol Products: Is
There Appeal Associated With Adolescents’ Intention to Consume Alcohol. Adolescence,
33(129), 47-59.

46
Kolstad, A., & Gjesvik, N. (2014). Collectivism, individualism, and pragmatism in China:
Implications for perceptions of mental health. Transcultural psychiatry,51(2), 264-285
James, W. L., & Kover, A. J. (1992). Observations: Do overall attitudes toward advertising affect
involvement with specific advertisements? Journal of Advertising Research, 32, 78-83.
Ji, C.Y. (2010). Prevalence of binge drink in Chinese college students. Chin J Sch
Health, 31(10), 1157-1158.
Liao. J. M. (2012). The analysis of ideological and behavioral characteristics on post-90s-take
college and university in Chengdu province for example (unpublished master thesis).
Retrieved from CMFD 2013 (in Chinese)
Liu, Z., Wei, P., Huang, M., & Li, X. (2013). Analysis Nanjing college students drinking and
excess drinking behavior. Chin J Sch Health, 34(8), 983-984.
Lutz, R.J. (1985). Affective and Cognitive Antecedents of Attitude towards the Ad: A conceptual
framework. In L. Allowed, & A. Mitchell (Ed.), Psychological Processes and Advertising
Effects: Theory, Research, and Applications (pp.45-63). Hillsdale, NJ: Erlbaum.
MacKenzie, S., Lutz, R., & Belch, G. (1986). The role of attitude toward the ad as a mediator of
advertising effectiveness: A test of competing explanations. Journal of Marketing Research,
23(May), 130-143.
McLeod, D. M., Detenber, B.H. & Eveland, Jr., W.P. (2001, December). Behind the
Third-Person Effect: Differentiating Perceptual Processes for Self and Other. Journal of
Communication, 678-694.
Mitchell, A., & Olson, J. (1981). Are product attribute beliefs the only mediator of advertising
effects on brand attitude? Journal of Marketing Research, 18(3), 318-332.

47
Net Ease, (2015, May 5). What’s content of 2015 Chinese advertising laws? Net Ease, Retrieved
from http://hebei.news.163.com/15/0505/09/AORFBVFI02790QPS_all.html.
Paul, B., Salwen, M. B., & Dupagne, M. (2000). The third-person effect: A meta-analysis of the
perceptual hypothesis. Mass Communication and Society, (1), 57.
Pasch, K. E., Komro, K. A., Perry, C. L., Hearst, M. O., & Farbakhsh, K. (2009). Does outdoor
alcohol advertising around elementary schools vary by the ethnicity of students in the
school?. Ethnicity & Health, 14(2), 225-236. doi:10.1080/13557850802307809
Perloff, R.M. (1996). Perceptions and Conceptions of Political Media Impact: the Third-Person
effect and Beyond. Psychology of Political Communication, 177-179.
Petty, R.E., Wegener, D.T., Fabrigar, L.R. (1997). Attitudes and attitude change. Annual Review
of Psychology, 48, 609-647.
Petty, C. E. &. Cacioppo, J.T. (1983). Central and Peripheral Routes to Persuasion: Application
to Advertising. In L. Percy & A. Woodside (Eds.), Advertising and Consumer Psychology
(3-23). Lexington, MA: Lexington Books.
Phelps, J. E., & Hoy, M. G. (1996). The Aad-‐Ab-‐PI relationship in children: The impact of brand
familiarity and measurement timing. Psychology & Marketing, 13(1), 77-105.
Pollay, R.W., & Mittal, B. (1993, July). Here's the Beef., Factors, Determinants, and Segments in
Consumer Criticism of Advertising. Journal of Marketing, 57, 99- 114.
Ren, Y. (2012). Introduction to the social environment and background of "after 90's" college
students. Journal of Chifeng University, 33(12), 236-237.
Shavitt, S., Lowrey, P., & Haefner, J. (1998). Public attitudes toward advertising: More favorable
than you might think Authors. Journal of Advertising Research, 38(4), 7-22.
48
Shen, F. (1998). Assessing advertising effectiveness: a comparison of two real-time measures of
ad liking. Paper presented at the annual AEJMC conference, Baltimore, MD, August 1998.
Shimp, T. (1981). Attitude toward the ad as a mediator of consumer brand choice. Journal of
Advertising, 10(2), 9-48.
Staple, G.C. (1996) ‘The New Demand for Telecoms Traffic Data: From MiTT to Maps’,
Telecommunications Policy 20(8): 623–631.
Tang, Z., Du, S., & Ma, G. (2014). The current situation and harmful of teenager drinking. Chin
J Sch Health, 35(12), 1918-1920.
Wan, X. (2009). Interpretation from the perspective of cross-cultural communication between
Chinese and western wine culture. Gan Su Ke Ji Zhong Heng, 38(3), 160-161.
Wang, J.F. (2012, December 06) Drunken singing the wrong room causing fights and a people
were killed. Net Ease. Retrieved from http://news.163.com/12/1206/03/
8I0RH5K700014AED.html
Wang, S. (2011). After 90 s "college students growing up environment. Reform and
Opening, 174-175.
Wang, Y. J. (2014, December 03). China’s 60000 people die each year from traffic accidents.
China news. Retrieved from http://www.chinanews.com/fz/2014/12-03/6838512.shtml.
Wang, Z.X. (2013, February 28). Rumors that 29 brands of white wine removed from CCTV in
one-day causes chaos among wine industry. Jiu.sohu. Retrieved from
http://jiu.sohu.com/news-909.html.
Wechsler, H., Kelley, K., Weitzman, E. R., San Giovanni, J. P., & Seibring, M. (2000). What
colleges are doing about student binge drinking a survey of college administrators. Journal
of American College Health, 48(5), 219-226.
49
White, H. A. (1997). Considering interacting factors in the third-person effect: Argument
strength and social distance. Journalism & Mass Communication Quarterly, 74(3), 557-564.
Wyllie, A. H. (1997). Considering Interacting Factors in the Third-Person Effect: Argument
Strength and Social Distance. Journal and Mass Communications Quarterly, 74(3),
557-564.
Xue, J., & Qian, L. (2004) Survey on drinking issue of college students: necessity of regulating
the surveyed issue. Chinese Journal of Drug Abuse Prevention of Treatment, 10(5),
272-.275.
Yelkur, R., Tomkovick, C., Hofer, A., & Rozumalski, D. (2013). Super Bowl ad likeability:
Enduring and emerging predictors. Journal of Marketing Communications, 19(1), 58-80.
Zhang, G. (2011). Discussion on Wine Culture and Wine Civilization. Liquor-Making Science &
Technology, 6(204), 113-115.
Zhang, Q. (2012). Study on the Value of 90’s Students-take college and universities in
Qinghai Province for example (unpublished master thesis). Retrieved from CMFD 2013 (in
Chinese).
Zhou, R.T. (2005). The study about present situation and countermeasure of college students risk
behaviors. Youth & Juvenile Study, 49(3), 33-34.
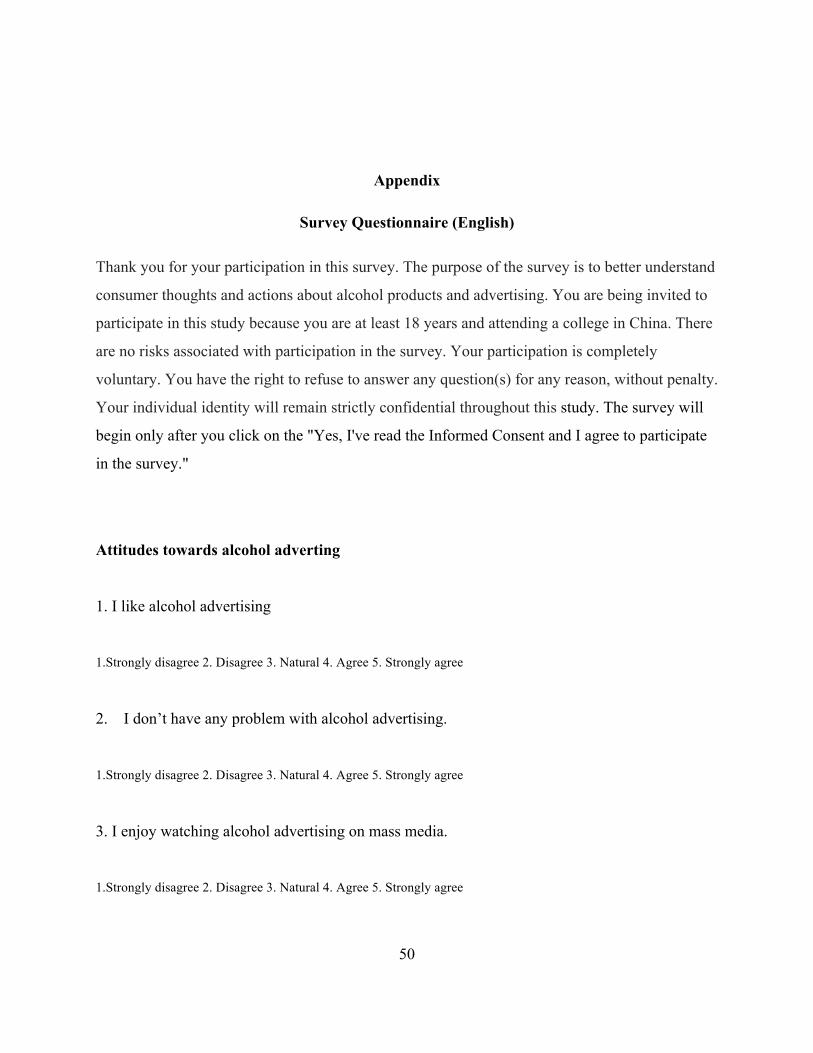
50
Appendix
Survey Questionnaire (English)
Thank you for your participation in this survey. The purpose of the survey is to better understand
consumer thoughts and actions about alcohol products and advertising. You are being invited to
participate in this study because you are at least 18 years and attending a college in China. There
are no risks associated with participation in the survey. Your participation is completely
voluntary. You have the right to refuse to answer any question(s) for any reason, without penalty.
Your individual identity will remain strictly confidential throughout this study. The survey will
begin only after you click on the "Yes, I've read the Informed Consent and I agree to participate
in the survey."
Attitudes towards alcohol adverting
1. I like alcohol advertising
1.Strongly disagree 2. Disagree 3. Natural 4. Agree 5. Strongly agree
2. I don’t have any problem with alcohol advertising.
1.Strongly disagree 2. Disagree 3. Natural 4. Agree 5. Strongly agree
3. I enjoy watching alcohol advertising on mass media.
1.Strongly disagree 2. Disagree 3. Natural 4. Agree 5. Strongly agree
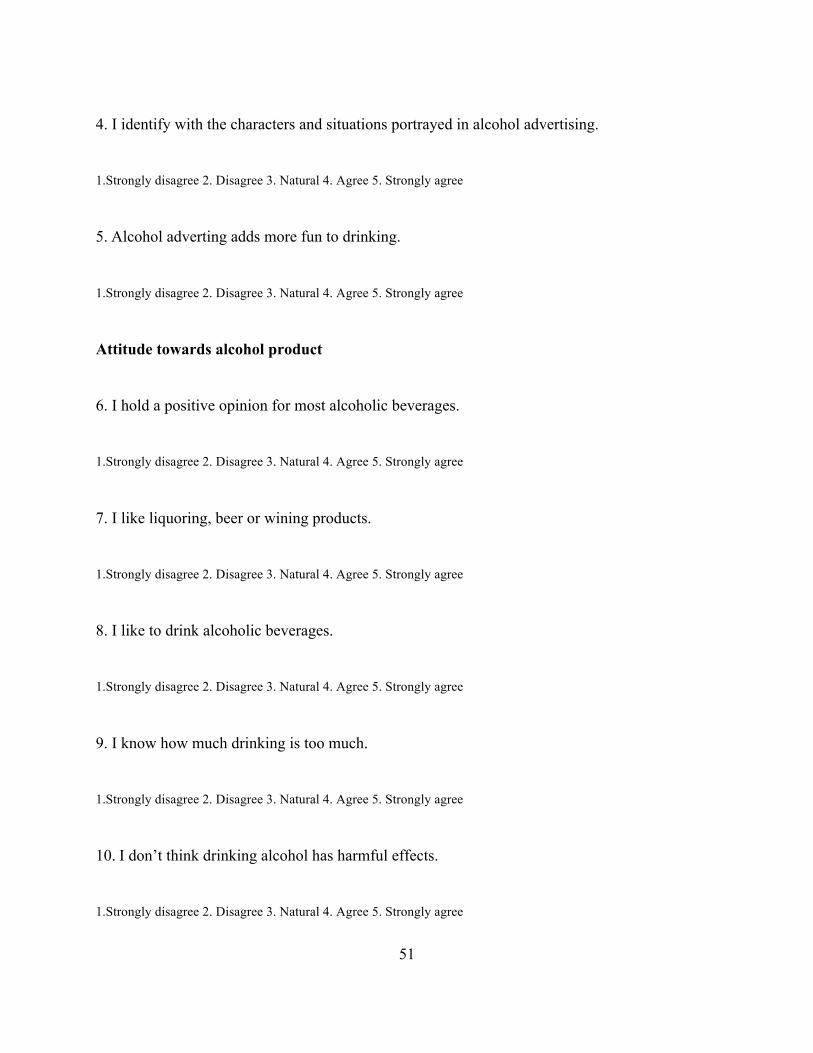
51
4. I identify with the characters and situations portrayed in alcohol advertising.
1.Strongly disagree 2. Disagree 3. Natural 4. Agree 5. Strongly agree
5. Alcohol adverting adds more fun to drinking.
1.Strongly disagree 2. Disagree 3. Natural 4. Agree 5. Strongly agree
Attitude towards alcohol product
6. I hold a positive opinion for most alcoholic beverages.
1.Strongly disagree 2. Disagree 3. Natural 4. Agree 5. Strongly agree
7. I like liquoring, beer or wining products.
1.Strongly disagree 2. Disagree 3. Natural 4. Agree 5. Strongly agree
8. I like to drink alcoholic beverages.
1.Strongly disagree 2. Disagree 3. Natural 4. Agree 5. Strongly agree
9. I know how much drinking is too much.
1.Strongly disagree 2. Disagree 3. Natural 4. Agree 5. Strongly agree
10. I don’t think drinking alcohol has harmful effects.
1.Strongly disagree 2. Disagree 3. Natural 4. Agree 5. Strongly agree

52
Perceived influence of alcohol advertising on oneself (SELF)
11. To what extent do you think alcohol-advertising influences your purchase of alcohol
products?
1. No influence at all 2. Very little influence 3. Some influence 4. A great deal of influence
12. To what extent do you think alcohol adverting influences your consumption of alcohol
products?
1. No influence at all 2. Very little influence 3. Some influence 4. A great deal of influence
13. To what extent do you think alcohol adverting influences your attitude towards alcohol
products?
1. No influence at all 2. Very little influence 3. Some influence 4. A great deal of influence
Perceived influence of alcohol advertising on others (OTHERS)
14. To what extent do you think alcohol advertising has an influence on other students’ purchase
of alcohol products?
1. No influence at all 2. Very little influence 3. Some influence 4. A great deal of influence

53
15. To what extent do you think alcohol adverting has an influence on other students’
consumption of alcohol products?
1. No influence at all 2. Very little influence 3. Some influence 4. A great deal of influence
16. To what extent do you think alcohol advertising has an influence on other students’ attitudes
toward alcohol products?
1. No influence at all 2. Very little influence 3. Some influence 4. A great deal of influence
Attitude toward restrictions on alcohol advertising (ATTR)
17. Students of under the age of 18 shouldn’t be exposed to alcohol advertising.
1.Strongly disagree 2. Disagree 3. Natural 4. Agree 5. Strongly agree
18. Alcohol companies shouldn’t advertise to college students.
1.Strongly disagree 2. Disagree 3. Natural 4. Agree 5. Strongly agree
19. Government should be planning more restriction on alcohol advertising.
1.Strongly disagree 2. Disagree 3. Natural 4. Agree 5. Strongly agree
20. I support the idea of prohibiting alcohol ads from some media forms.
1.Strongly disagree 2. Disagree 3. Natural 4. Agree 5. Strongly agree

54
21. I support the idea of banning alcohol ads from all forms of media.
1.Strongly disagree 2. Disagree 3. Natural 4. Agree 5. Strongly agree
Personal Information
22. How often do you drink liquor, wine, beer or any alcohol drinking?
1. Never 2.rarely 3. Sometimes 4. Often
23. What is your age: _____________
24. What is your current status?
1. Not a college students 2. A college student 3. A college graduate.
25. What year are you in university?
1. Freshman 2. Sophomore 3. Junior 4. Senior 5. Graduate 6. Other (please specify) _________
26. What is your gender?
1.Female 2.Male
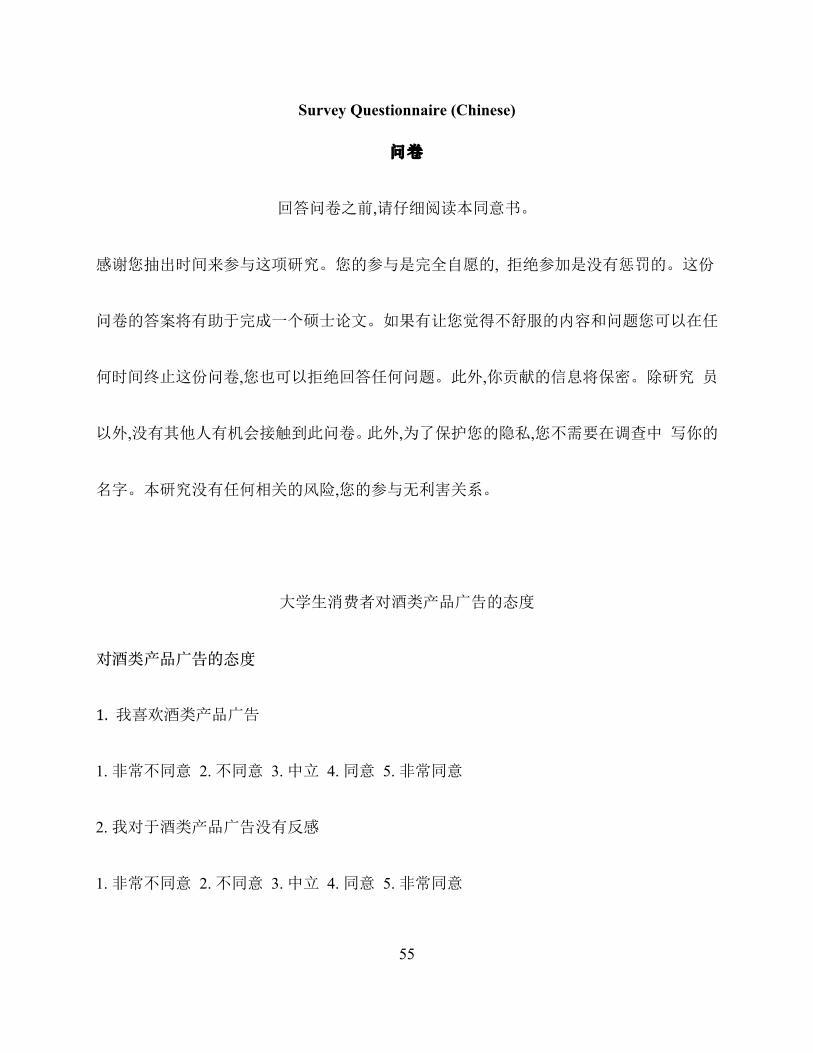
55
Survey Questionnaire (Chinese)
问卷
回答问卷之前,请仔细阅读本同意书。
感谢您抽出时间来参与这项研究。您的参与是完全自愿的, 拒绝参加是没有惩罚的。这份
问卷的答案将有助于完成一个硕士论文。如果有让您觉得不舒服的内容和问题您可以在任
何时间终止这份问卷,您也可以拒绝回答任何问题。此外,你贡献的信息将保密。除研究 员
以外,没有其他人有机会接触到此问卷。此外,为了保护您的隐私,您不需要在调查中 写你的
名字。本研究没有任何相关的风险,您的参与无利害关系。
大学生消费者对酒类产品广告的态度
对酒类产品⼴广告的态度
1. 我喜欢酒类产品广告
1.非常不同意 2.不同意 3.中立 4.同意 5.非常同意
2.我对于酒类产品广告没有反感
1.非常不同意 2.不同意 3.中立 4.同意 5.非常同意
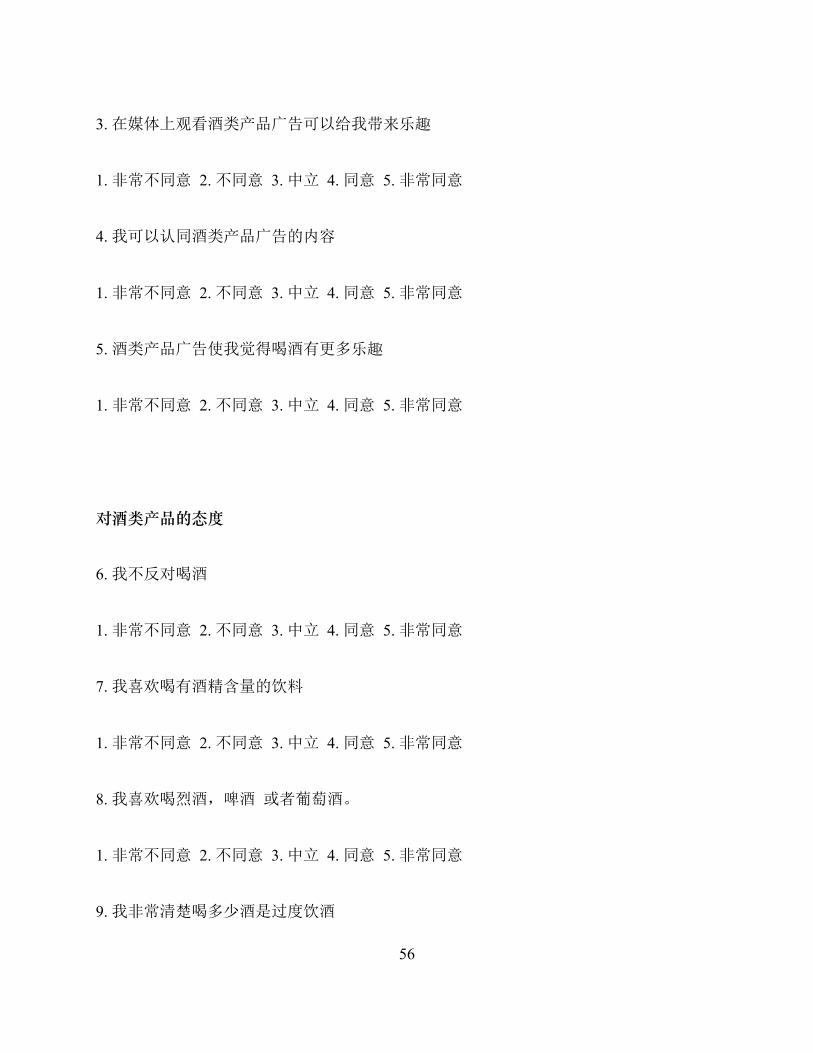
56
3.在媒体上观看酒类产品广告可以给我带来乐趣
1.非常不同意 2.不同意 3.中立 4.同意 5.非常同意
4.我可以认同酒类产品广告的内容
1.非常不同意 2.不同意 3.中立 4.同意 5.非常同意
5.酒类产品广告使我觉得喝酒有更多乐趣
1.非常不同意 2.不同意 3.中立 4.同意 5.非常同意
对酒类产品的态度
6.我不反对喝酒
1.非常不同意 2.不同意 3.中立 4.同意 5.非常同意
7.我喜欢喝有酒精含量的饮料
1.非常不同意 2.不同意 3.中立 4.同意 5.非常同意
8.我喜欢喝烈酒,啤酒 或者葡萄酒。
1.非常不同意 2.不同意 3.中立 4.同意 5.非常同意
9.我非常清楚喝多少酒是过度饮酒
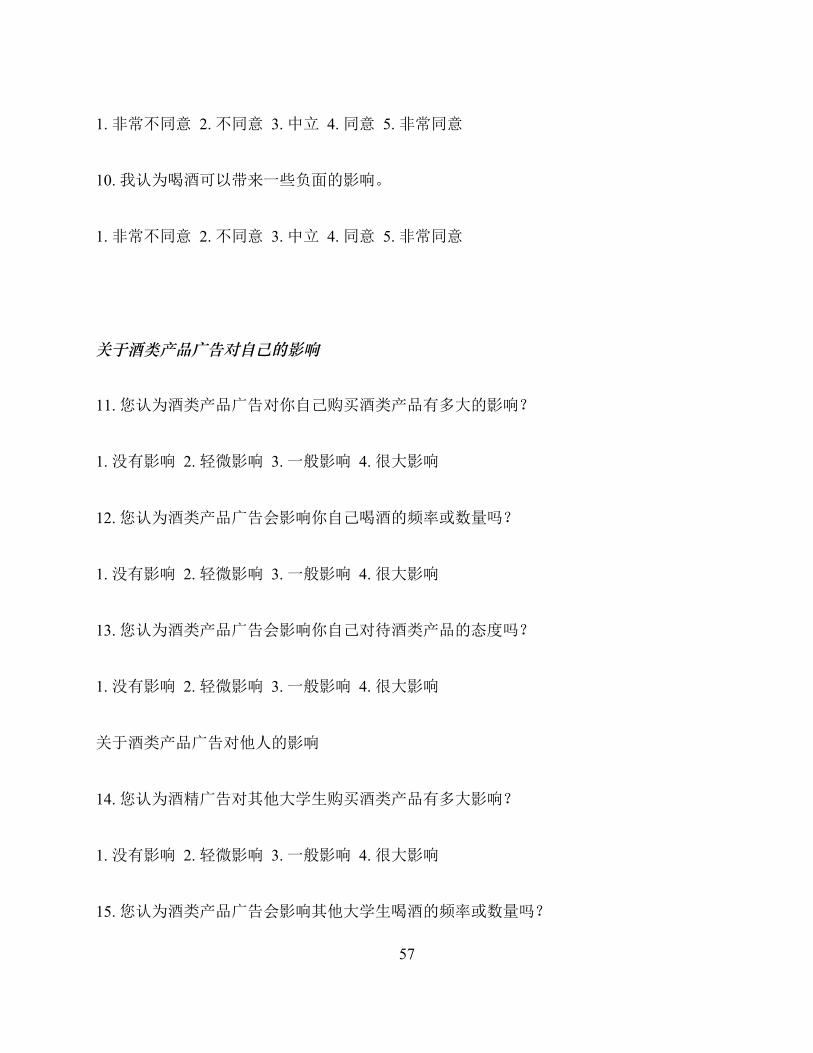
57
1.非常不同意 2.不同意 3.中立 4.同意 5.非常同意
10.我认为喝酒可以带来一些负面的影响。
1.非常不同意 2.不同意 3.中立 4.同意 5.非常同意
关于酒类产品⼴广告对⾃自⼰己的影响
11.您认为酒类产品广告对你自己购买酒类产品有多大的影响?
1.没有影响 2.轻微影响 3.一般影响 4.很大影响
12.您认为酒类产品广告会影响你自己喝酒的频率或数量吗?
1.没有影响 2.轻微影响 3.一般影响 4.很大影响
13.您认为酒类产品广告会影响你自己对待酒类产品的态度吗?
1.没有影响 2.轻微影响 3.一般影响 4.很大影响
关于酒类产品广告对他人的影响
14.您认为酒精广告对其他大学生购买酒类产品有多大影响?
1.没有影响 2.轻微影响 3.一般影响 4.很大影响
15.您认为酒类产品广告会影响其他大学生喝酒的频率或数量吗?

58
1.没有影响 2.轻微影响 3.一般影响 4.很大影响
16.您认为酒类产品广告会影响其他大学生看待酒类产品的态度吗?
1.没有影响 2.轻微影响 3.一般影响 4.很大影响
关于限制酒类产品⼴广告的态度
17.法律对酒类产品广告收视者年龄应该有所限制
1.非常不同意 2.不同意 3.中立 4.同意 5.非常同意
18.酒类产品广告不应该以大学生为目标市场
1.非常不同意 2.不同意 3.中立 4.同意 5.非常同意
19.政府应该制定更多限制酒类产品广告的条例
1.非常不同意 2.不同意 3.中立 4.同意 5.非常同意
20.政府或有关部门应该限制在某些媒体上出现的酒类产品广告
1.非常不同意 2.不同意 3.中立 4.同意 5.非常同意
21.政府应该禁止所有媒体上出现的酒类产品广告
1.非常不同意 2.不同意 3.中立 4.同意 5.非常同意
22.你经常饮酒吗?

59
1.从不 2.很少 3.偶尔 4.经常
23.您的年龄是 ______
24.您目前是
1.尚未进入大学 2.在校大学生 3.已经大学毕业
25.您目前所在的年级?
1.大一 2.大二 3.大三 4.大四 5.研究生
26.您的性别
1.男 2.女
60
Letter of IRB Approval

61