First Alpha Energy Fund LP - spe-london.org · Oil Price (WTI, $/bbl) Oil rigs. Monthly prodn/rig...
27
SPE London Introduction to E&P 21 st November 2017 13 th Annual Seminar Global Context Miles Cudmore First Alpha Energy Capital LLP
Transcript of First Alpha Energy Fund LP - spe-london.org · Oil Price (WTI, $/bbl) Oil rigs. Monthly prodn/rig...

SPE London Introduction to E&P 21st November 201713th Annual Seminar
Global Context
Miles Cudmore
First Alpha Energy Capital LLP

Global Context
Industry structure• what is E&P, who is involved
Global energy trends• demand and supply by energy source• oil and gas resources and production• what is happening today
Key challenges• renewing exploration in the UK North Sea• making unconventionals work in the UK• resetting project delivery• improving UK operational performance
November 2017 2
What is “Exploration and Production” ?
November 2017 3
Upstream – “E&P”
- exploration
- development
- production
- transport to sales point
Downstream
- refining
- petrochemical plants
- liquid product distribution
- natural gas distribution
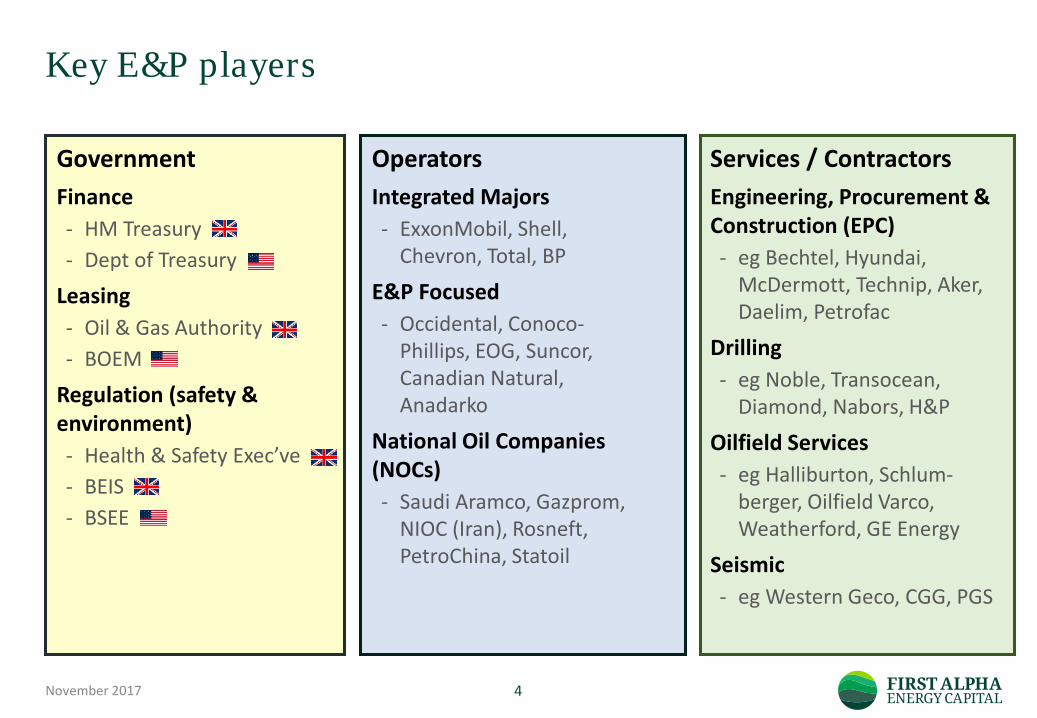
Key E&P players
November 2017 4
GovernmentFinance - HM Treasury- Dept of Treasury
Leasing - Oil & Gas Authority- BOEM
Regulation (safety & environment)- Health & Safety Exec’ve- BEIS- BSEE
OperatorsIntegrated Majors- ExxonMobil, Shell,
Chevron, Total, BP
E&P Focused- Occidental, Conoco-
Phillips, EOG, Suncor, Canadian Natural, Anadarko
National Oil Companies (NOCs)- Saudi Aramco, Gazprom,
NIOC (Iran), Rosneft, PetroChina, Statoil
Services / ContractorsEngineering, Procurement & Construction (EPC)- eg Bechtel, Hyundai,
McDermott, Technip, Aker, Daelim, Petrofac
Drilling- eg Noble, Transocean,
Diamond, Nabors, H&P
Oilfield Services- eg Halliburton, Schlum-
berger, Oilfield Varco, Weatherford, GE Energy
Seismic- eg Western Geco, CGG, PGS

2014 production, largest 21 companies
November 2017 5
0
2
4
6
8
10
12
14
Mill
ion
Barr
els O
il Eq
uiva
lent
per
day
Oil & liquids Gas
International Oil Companies
Data from Forbes magazine / WoodMackenzie
National Oil Companies

Energy Growth below GDP Growth
November 2017 6

Primary Energy Consumption
November 2017 7
-
1
2
3
4
5
6
7
8
1990 1995 2000 2005 2010 2015
Non OECD Driving Energy Growth• China consumes 23% of global primary
energy use• India at 5% and growing at > 5% pa• Pace of China energy growth has
slowed with reduced GDP growth and falling energy intensity
OECD Energy Demand Flat• Slow GDP growth matched by pace of
falling energy intensity• N America consumption 21% of global
primary energy use, EU 12%
Billion TonnesOil Equivalent
OECD
Non OECD
ChinaN America
EU
Data from BP Statistical Review of World Energy

Energy Sources
November 2017 8
2016 Points• Oil and grew by 1.8% boosted by GDP
growth and price falls• Coal fell 1.4%• Non fossil fuels hit high of 15% share
Macro picture• Renewables are fastest growing source
(16% pa average growth since 2006), but are only 3.8% of total
• Strongest growth in solar, 50% pa growth since 2006 (has slowed, 30% pa 2015 – 16); wind next highest (22% pa since 2006)
• Overall demand for oil and gas set to grow
• Reducing emissions requires coal to gas switch in addition to non fossil growth0%
10%
20%
30%
40%
50%
1965 1970 1975 1980 1985 1990 1995 2000 2005 2010 2015
Oil
Coal
Gas
Hydro
NuclearRen*
Shares of global primary energy
Data from BP Statistical Review of World Energy 2017
* Renewables plus biofuels

Oil and Gas Production
November 2017 9
0%
20%
40%
60%
80%
100%
0
10
20
30
40
50
60
70
80
90
100
1965 1970 1975 1980 1985 1990 1995 2000 2005 2010 2015
N America S & C AmericaEurope & Eurasia Mid EastAfrica Asia Pacific% Opec % OECD
0%
20%
40%
60%
80%
100%
0
1000
2000
3000
4000
5000
1970 1975 1980 1985 1990 1995 2000 2005 2010 2015
N America S & C AmericaEurope & Eurasia Mid EastAfrica Asia Pacific% OECD
Million bpd Oil Production Billion Cubic Meters pa Gas Production(scaled to oil graph by equivalent energy)
Data from BP Statistical Review of World Energy

Oil and Gas Proved Reserves
November 2017 10
Thousand Million bbl Trillion Cubic Meters (scaled to oil graph by equivalent energy)
0%
20%
40%
60%
80%
100%
0
200
400
600
800
1000
1200
1400
1600
1800
1980 1985 1990 1995 2000 2005 2010 2015
N America S & C AmericaEurope & Eurasia Mid EastAfrica Asia Pacific% OPEC % OECD
0%
20%
40%
60%
80%
100%
0
30
60
90
120
150
180
210
240
270
1980 1985 1990 1995 2000 2005 2010 2015
N America S & C AmericaEurope & Eurasia Mid EastAfrica Asia Pacific% OECD
Data from BP Statistical Review of World Energy
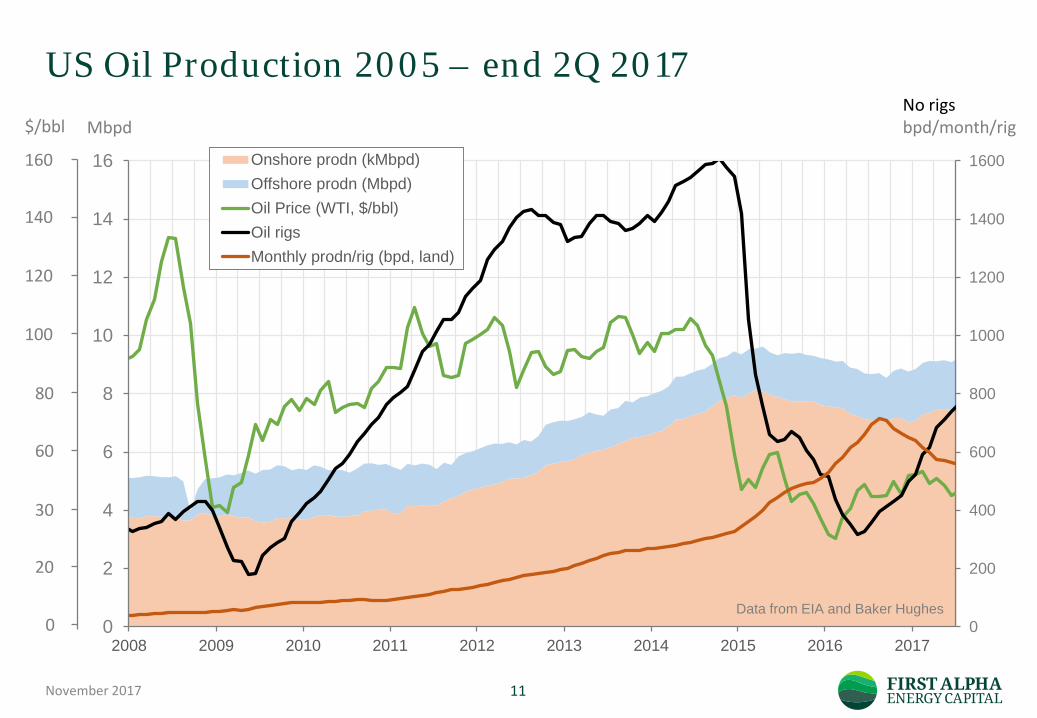
US Oil Production 2005 – end 2Q 2017
November 2017 11
$/bbl
160
140
120
100
80
20
30
60
0 0
200
400
600
800
1000
1200
1400
1600
0
2
4
6
8
10
12
14
16
2008 2009 2010 2011 2012 2013 2014 2015 2016 2017
Onshore prodn (kMbpd)Offshore prodn (Mbpd)Oil Price (WTI, $/bbl)Oil rigsMonthly prodn/rig (bpd, land)
MbpdNo rigsbpd/month/rig
Data from EIA and Baker Hughes
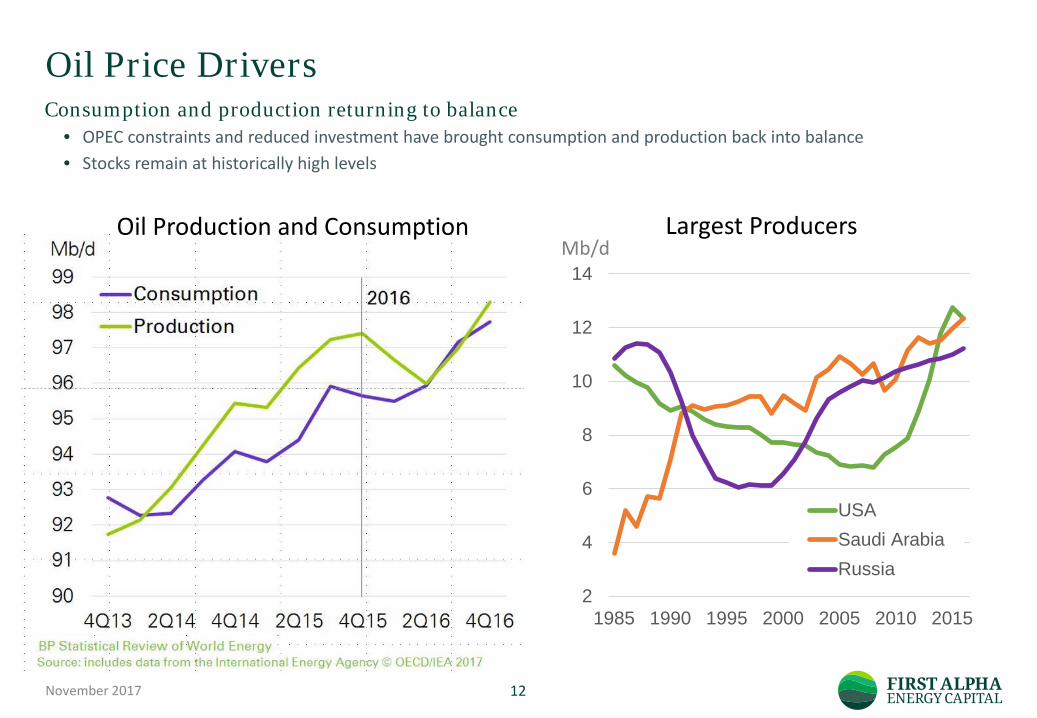
Oil Price Drivers
November 2017 12
2
4
6
8
10
12
14
1985 1990 1995 2000 2005 2010 2015
USASaudi ArabiaRussia
Mb/dLargest ProducersOil Production and Consumption
Consumption and production returning to balance• OPEC constraints and reduced investment have brought consumption and production back into balance• Stocks remain at historically high levels

Gas Market – recent trends
November 2017 13
0
2
4
6
8
10
12
14
16
18
2000 2002 2004 2006 2008 2010 2012 2014 2016
US Henry HubUK NBPAverage German import cifJapan cif
0
50
100
150
200
250
300
350
400
450
2000 2002 2004 2006 2008 2010 2012 2014 2016
AntrimBakkenWoodfordBarnettFayettevilleEagle FordHaynesvilleMarcellusUticaRest of US
US Shale Production – 50% world gas growth
Data from EIA
Gas Prices ($/million btu)bcm pa
Data from BP Statistical Review of World Energy

Global gas outlook
November 2017 14
0
20
40
60
80
100
120
1990 2000 2010 2020 2030 2040
OE
non-OECD
EIA World natural gas consumption Forecastquadrillion Btu bcf/d
Global LNG capacity additions, 2015 - 2019
Gas consumption expected to grow strongly. Over next 5 years, spot price weakness likely as new LNG capacity comes on line and US starts exports
Overall Production and Reserves Status
November 2017 15
0
2000
4000
6000
8000
10000
2010 2011 2012 2013 2014 2015 2016
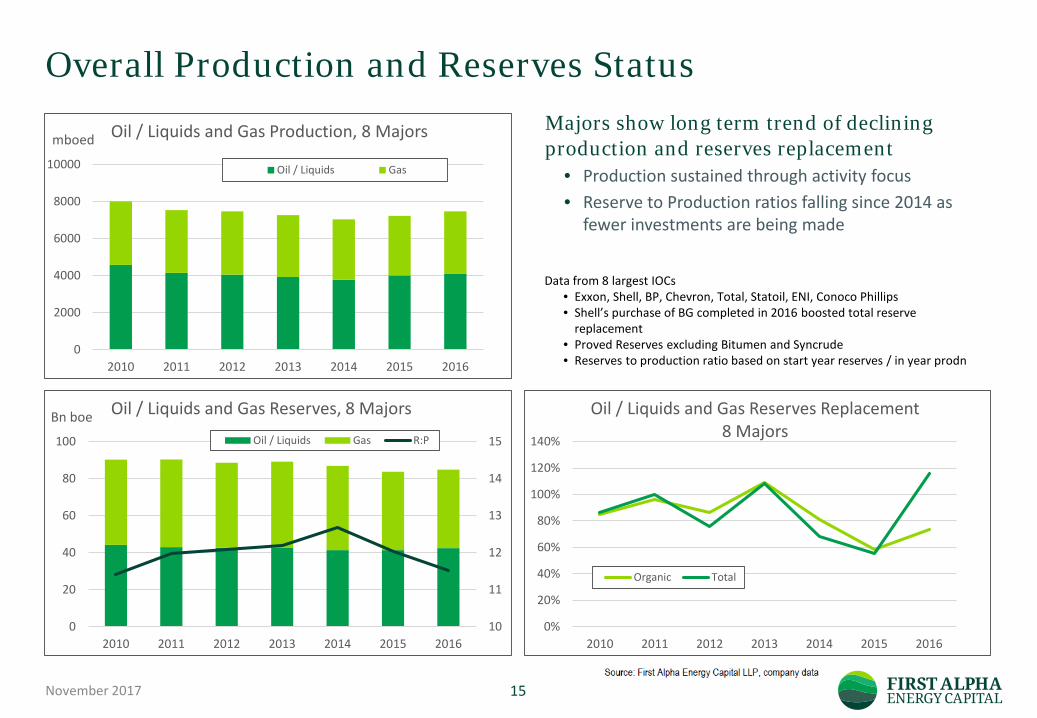
Oil / Liquids and Gas Production, 8 Majors
Oil / Liquids Gas
mboed
Data from 8 largest IOCs• Exxon, Shell, BP, Chevron, Total, Statoil, ENI, Conoco Phillips• Shell’s purchase of BG completed in 2016 boosted total reserve
replacement• Proved Reserves excluding Bitumen and Syncrude• Reserves to production ratio based on start year reserves / in year prodn
10
11
12
13
14
15
0
20
40
60
80
100
2010 2011 2012 2013 2014 2015 2016
Oil / Liquids and Gas Reserves, 8 Majors
Oil / Liquids Gas R:P
Bn boe
0%
20%
40%
60%
80%
100%
120%
140%
2010 2011 2012 2013 2014 2015 2016
Oil / Liquids and Gas Reserves Replacement8 Majors
Organic Total
Majors show long term trend of declining production and reserves replacement
• Production sustained through activity focus• Reserve to Production ratios falling since 2014 as
fewer investments are being made
Global spend & activity
November 2017 16
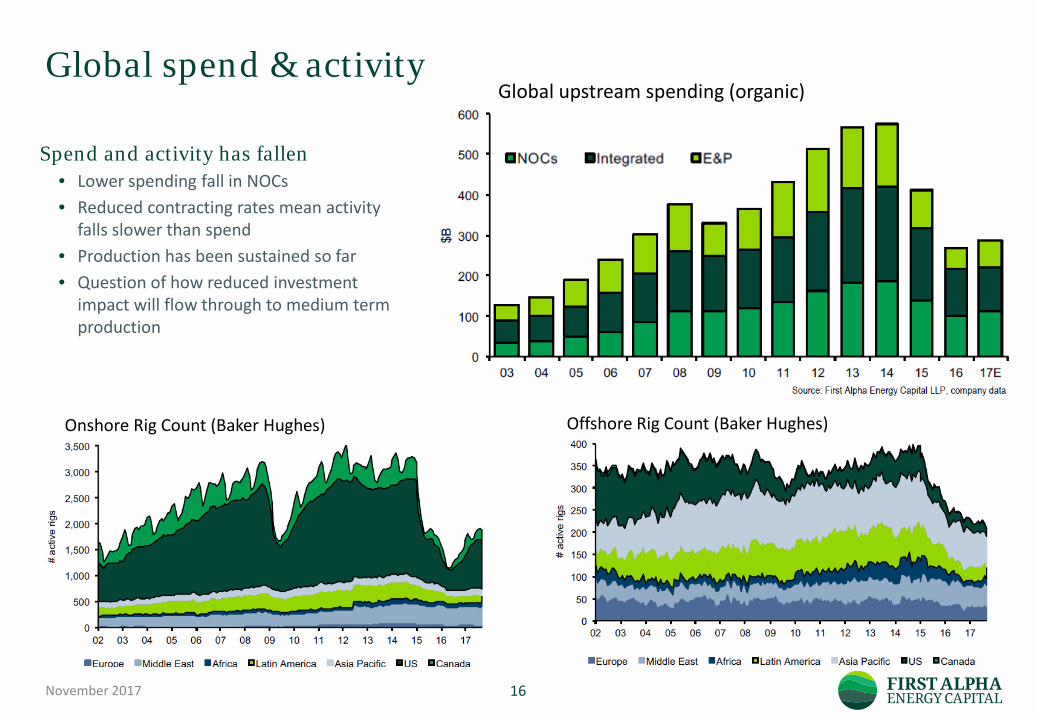
Global upstream spending (organic)
Onshore Rig Count (Baker Hughes) Offshore Rig Count (Baker Hughes)
Spend and activity has fallen• Lower spending fall in NOCs• Reduced contracting rates mean activity
falls slower than spend• Production has been sustained so far• Question of how reduced investment
impact will flow through to medium term production

E&P Major Project Delivery (global)
November 2017 17
“Average”E&P
“Average” non E&P
70% of E&P developments delivered less value than planned; average loss of 35%
• average of 78% planned production delivered in first 4 years
• average cost overrun of 20% in real terms
In order of importance due to:-• scoping decisions based on incomplete reservoir
data • capital cost growth (supply chain / integration)• prioritising schedule over value
E&P Mega Project outcomes vs plan are also poorer than other sectors and E&P capital productivity has fallen
• Front End Loading (FEL) in E&P projects at “middle fair” level on average vs “upper good” for non E&P projects
• circa 60% of E&P projects are schedule driven than non E&P vs circa 30% of non E&P Projects
Majors need to materially improve project performance to remain competitive and replace reserves
Analysis: IPA
Cost Growth vs Front End Loading
Global Picture – key points
Oil and gas demand will continue to grow but at slower pace than GDP• falling energy intensity per unit GDP• continued growth in renewables, particularly for power
Remaining oil and gas reserves continue to grow, more is being found than produced• no shortage of resources globally, shale technology adding new volumes• value driven by portfolio and development efficiency• question is using resources in efficient and sustainable way
US shale production driving changes in both oil and gas• 2015 was first time a country has added 1 million bpd capacity for 3 years in a row• circa half of new global gas supply from US shale, becoming exporter• Shale creates new dynamic; elasticity of supply constraining prices
Industry facing big challenges and changes• material new technology driven supplies at time of slowing energy demand growth• lower prices and volatility possibly a “return to normal” • high cost / high tax areas are severely challenged• no room for poor project or operating performance
November 2017 18
Stages of Field Life
November 2017 19
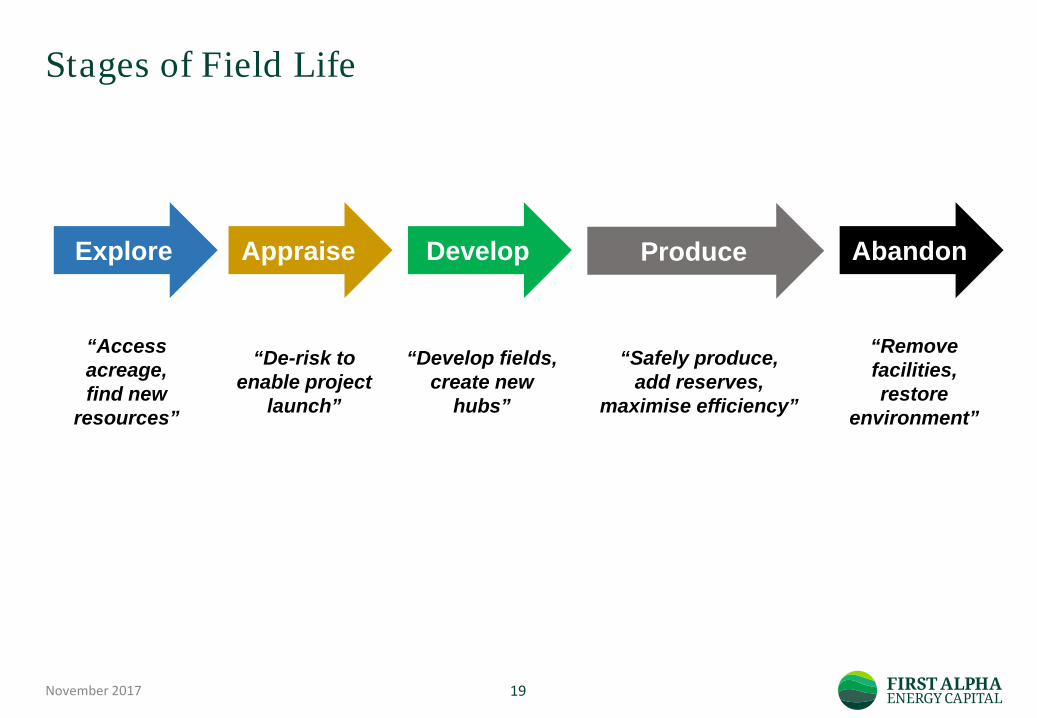
Explore Appraise ProduceDevelop Abandon
“Access acreage, find new
resources”
“De-risk to enable project
launch”
“Develop fields, create new
hubs”
“Safely produce,add reserves,
maximise efficiency”
“Removefacilities, restore
environment”
Historic UK Reserves and Production
November 2017 20
0
10
20
30
40
50
60
70
1975 1980 1985 1990 1995 2000 2005 2010 2015
Mid caseProducedProvedHigh case
10
20
30
40
50
60
70
Produced Remainingreserves
Resourcesproducing
fields
Resourcesproposeddevelop-ments
Resourcesother
discoveries
Explorationpotential
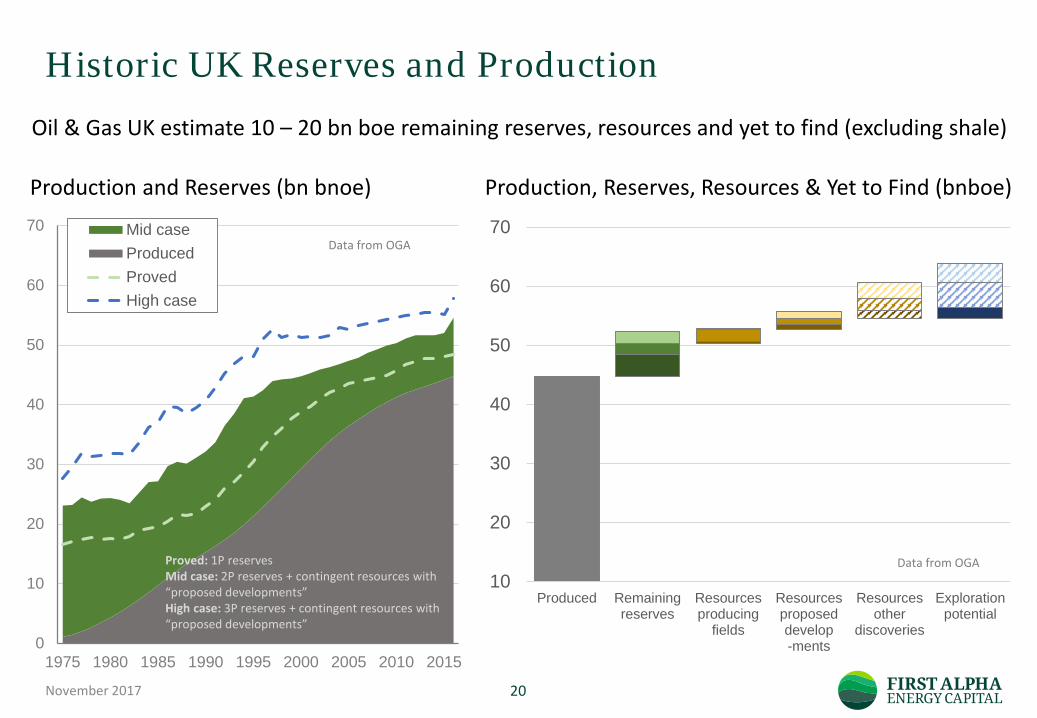
Production and Reserves (bn bnoe) Production, Reserves, Resources & Yet to Find (bnboe)
Oil & Gas UK estimate 10 – 20 bn boe remaining reserves, resources and yet to find (excluding shale)
Proved: 1P reservesMid case: 2P reserves + contingent resources with “proposed developments”High case: 3P reserves + contingent resources with “proposed developments”
Data from OGA
Data from OGA
UK Drilling Activity
November 2017 21
0
20
40
60
80
100
120
140
2005 2007 2009 2011 2013 2015 2017Q1-Q3
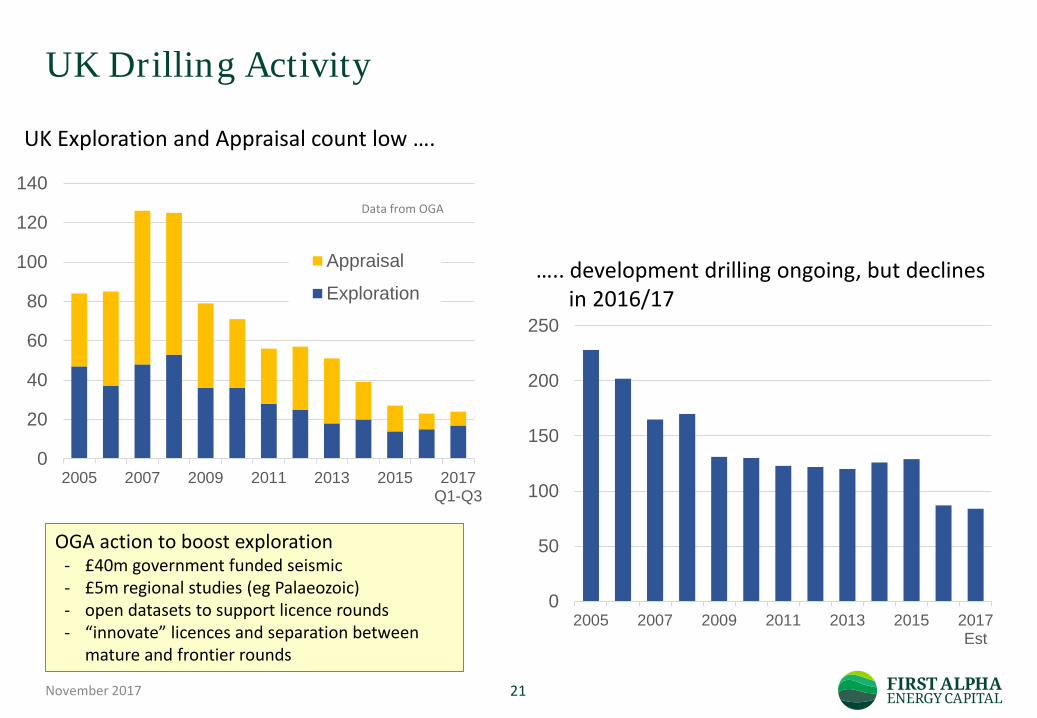
Appraisal
Exploration
Data from OGA
….. development drilling ongoing, but declinesin 2016/17
UK Exploration and Appraisal count low ….
OGA action to boost exploration- £40m government funded seismic- £5m regional studies (eg Palaeozoic)- open datasets to support licence rounds- “innovate” licences and separation between
mature and frontier rounds
0
50
100
150
200
250
2005 2007 2009 2011 2013 2015 2017Est
Unconventionals in the UK
November 2017 22
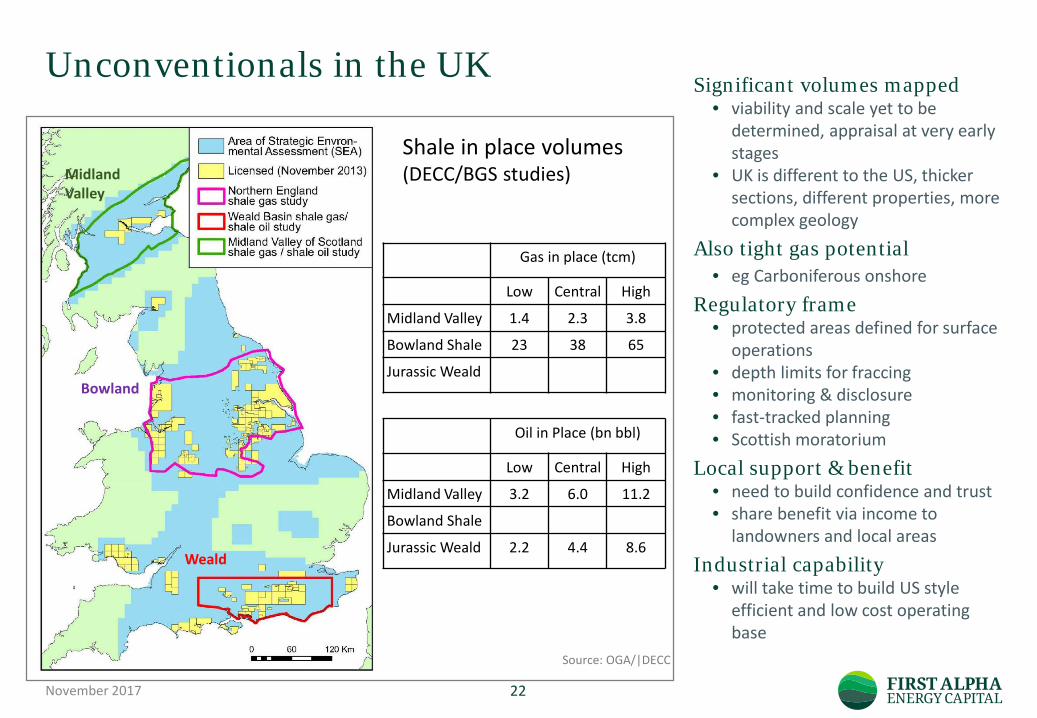
Gas in place (tcm)
Low Central High
Midland Valley 1.4 2.3 3.8
Bowland Shale 23 38 65
Jurassic Weald
Weald
Bowland
MidlandValley
Oil in Place (bn bbl)
Low Central High
Midland Valley 3.2 6.0 11.2
Bowland Shale
Jurassic Weald 2.2 4.4 8.6
Shale in place volumes(DECC/BGS studies)
Source: OGA/|DECC
Significant volumes mapped• viability and scale yet to be
determined, appraisal at very early stages
• UK is different to the US, thicker sections, different properties, more complex geology
Also tight gas potential • eg Carboniferous onshore
Regulatory frame• protected areas defined for surface
operations• depth limits for fraccing• monitoring & disclosure• fast-tracked planning• Scottish moratorium
Local support & benefit • need to build confidence and trust• share benefit via income to
landowners and local areas
Industrial capability• will take time to build US style
efficient and low cost operating base

UKCS Capital Investment
November 2017 23
Declining capital investment as operators seek to manage cash flow; falling unit development costs expected to stimulate activity (eg increased Private Equity fund activity)
Growing role of mid sized Operators in the UK North Sea
November 2017 24
0
100
200
300
400
500
< 0.1 0.1 - 0.25 0.25 - 0.5 0.5 - 1.5 1.5 - 2.5 > 2.5
Parent Global Production (million boed, 2014)
0
5
10
15
20
25
30
35
40
1975 1980 1985 1990 1995 2000 2005 2010 2015
Mid & Smaller
Large IOCs
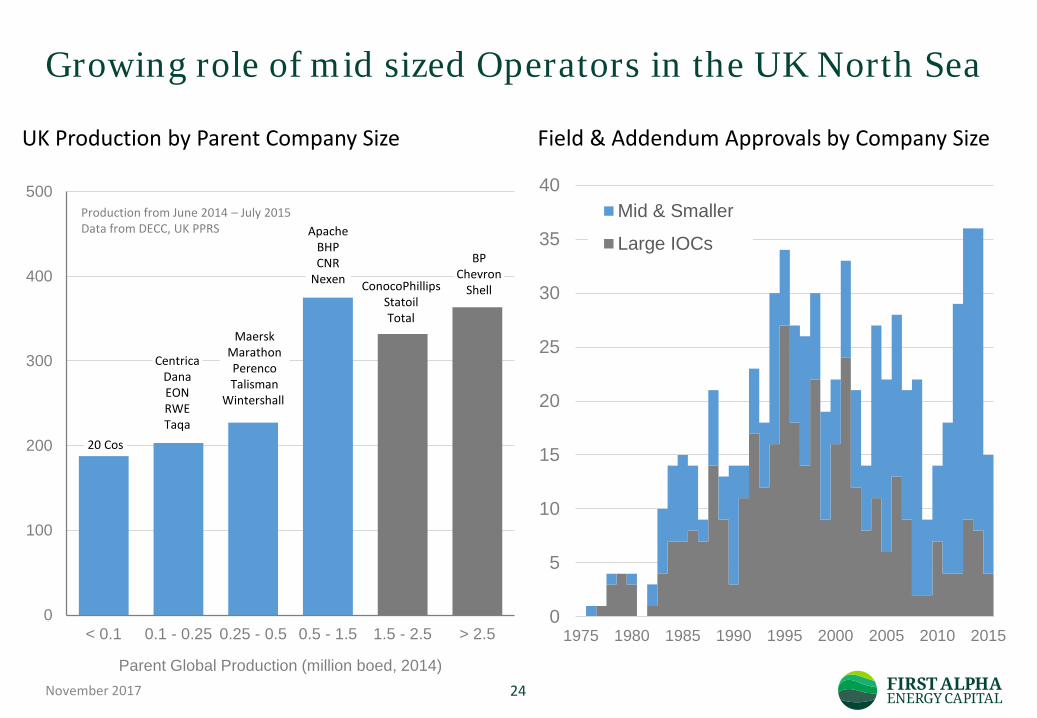
Production from June 2014 – July 2015Data from DECC, UK PPRS
ConocoPhillipsStatoilTotal
ApacheBHPCNR
Nexen
MaerskMarathonPerencoTalisman
Wintershall
CentricaDanaEONRWETaqa
20 Cos
BPChevron
Shell
UK Production by Parent Company Size Field & Addendum Approvals by Company Size
UK Operating Performance
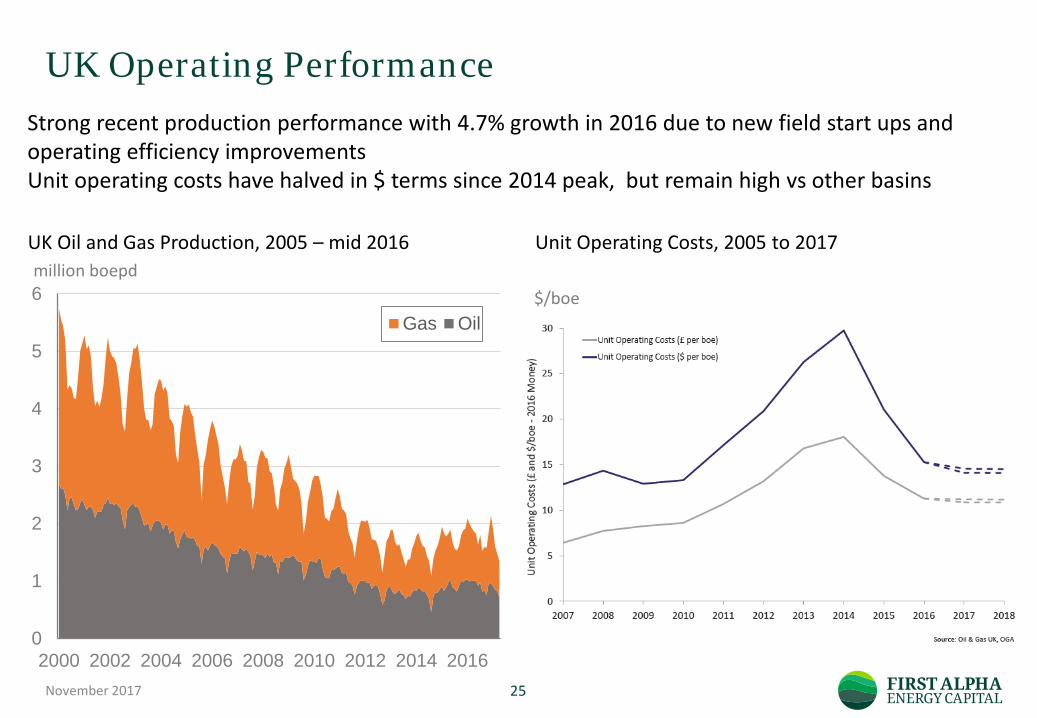
November 2017 25
0
1
2
3
4
5
6
2000 2002 2004 2006 2008 2010 2012 2014 2016
Gas Oil$/boe
Unit Operating Costs, 2005 to 2017UK Oil and Gas Production, 2005 – mid 2016million boepd
Strong recent production performance with 4.7% growth in 2016 due to new field start ups and operating efficiency improvementsUnit operating costs have halved in $ terms since 2014 peak, but remain high vs other basins

UK Decommissioning
November 2017 26
Decommissioning activity growing, 14 fields ceased production in 2016, similar number expected in 2017 with ca 30 to 40 fields expected in 2018 and 2019
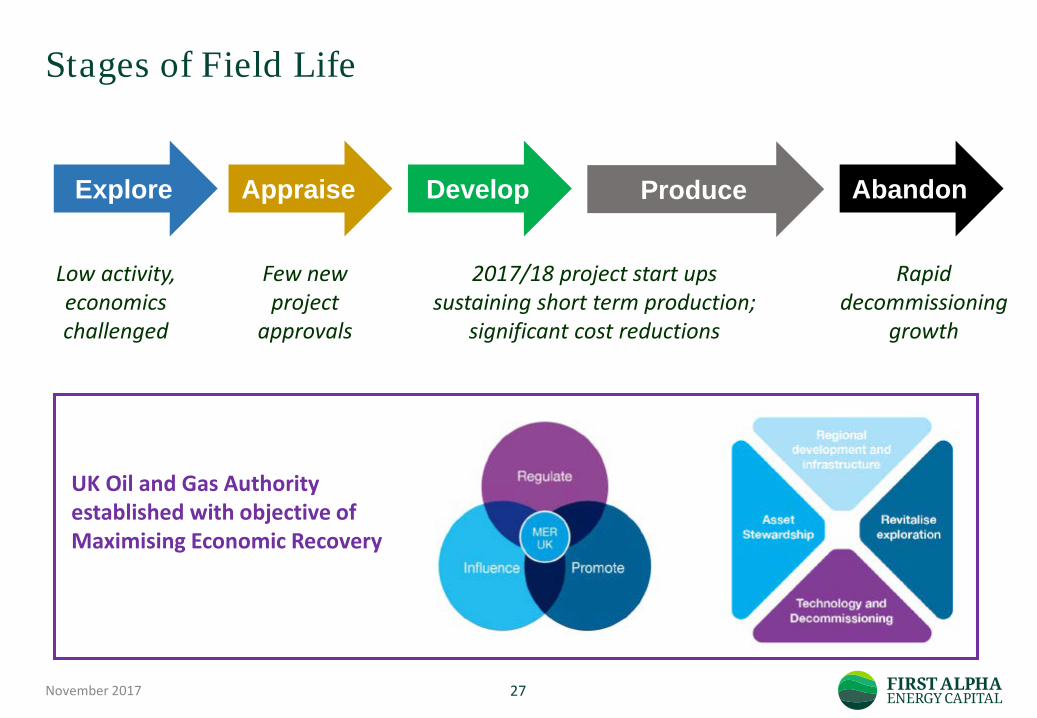
Stages of Field Life
November 2017 27
Explore Appraise ProduceDevelop Abandon
UK Oil and Gas Authority established with objective of Maximising Economic Recovery
Low activity, economics challenged
Few new project
approvals
2017/18 project start ups sustaining short term production;
significant cost reductions
Rapid decommissioning
growth