FIRMS, CONTRACTS, AND TRADE STRUCTURE · FIRMS, CONTRACTS, AND TRADE STRUCTURE* ... The model pins...
44
FIRMS, CONTRACTS, AND TRADE STRUCTURE* POL ANTR ` AS Roughly one-third of world trade is intra rm trade. This paper starts by unveiling two systematic patterns in the volume of intra rm trade. In a panel of industries, the share of intra rm imports in total U. S. imports is signi cantly higher, the higher the capital intensity of the exporting industry. In a cross section of countries the share of intra rm imports in total U. S. imports is signi cantly higher, the higher the capital-labor ratio of the exporting country. I then show that these patterns can be rationalized in a theoretical framework that combines a Grossman-Hart-Moore view of the rm with a Helpman-Krugman view of international trade. In particular, I develop an incomplete-contracting, property-rights model of the boundaries of the rm, which I then incorporate into a standard trade model with imperfect competition and product differentiation. The model pins down the boundaries of multinational rms as well as the inter- national location of production, and it is shown to predict the patterns of intra rm trade identi ed above. Econometric evidence reveals that the model is consistent with other qualitative and quantitative features of the data. I. INTRODUCTION Roughly one-third of world trade is intra rm trade. In 1994, 42.7 percent of the total volume of U. S. imports of goods took place within the boundaries of multinational rms, with the share being 36.3 percent for U. S. exports of goods [Zeile 1997]. Not only is intra rm trade a large fraction of world trade, but it also shows some distinctive patterns. Relative to the total volume of trade, intra rm trade (i) is heavily concentrated in capital- intensive industries and (ii) ows mostly between capital-abun- dant countries. Figure I provides a striking illustration of the rst fact. In a cross section of 23 manufacturing industries, the share of intra rm imports in total U. S. imports is signi cantly higher, the higher the capital intensity of the exporting industry. Firms * I am grateful to Daron Acemoglu, George-Marios Angeletos, Gene Gross- man, and Jaume Ventura for invaluable guidance, and to Manuel Amador, Lucia Breierova, Francesco Caselli, Fritz Foley, Gino Gancia, Andrew Hertzberg, El- hanan Helpman, Bengt Holmstro ¨m, Ben Jones, Oscar Landerretche, Alexis Leo ´n, Gerard Padro ´-i-Miquel, Thomas Philippon, Diego Puga, Jeremy Stein, Joachim Voth, two anonymous referees, and the editor (Edward Glaeser) for very helpful comments. I have also bene ted from suggestions by seminar participants at the University of California at Berkeley, Graduate School of Business of the Univer- sity of Chicago, Columbia University, Harvard University, the London School of Economics, the Massachusetts Institute of Technology, the National Bureau of Economic Research, Northwestern University, New York University, Princeton University, the University of California at San Diego, Stanford University, and Yale University. Financial support from the Bank of Spain is gratefully acknowl- edged. All remaining errors are my own. © 2003 by the President and Fellows of Harvard College and the Massachusetts Institute of Technology. The Quarterly Journal of Economics, November 2003 1375
Transcript of FIRMS, CONTRACTS, AND TRADE STRUCTURE · FIRMS, CONTRACTS, AND TRADE STRUCTURE* ... The model pins...

FIRMS CONTRACTS AND TRADE STRUCTURE
POL ANTRAS
Roughly one-third of world trade is intrarm trade This paper starts byunveiling two systematic patterns in the volume of intrarm trade In a panel ofindustries the share of intrarm imports in total U S imports is signicantlyhigher the higher the capital intensity of the exporting industry In a crosssection of countries the share of intrarm imports in total U S imports issignicantly higher the higher the capital-labor ratio of the exporting country Ithen show that these patterns can be rationalized in a theoretical framework thatcombines a Grossman-Hart-Moore view of the rm with a Helpman-Krugmanview of international trade In particular I develop an incomplete-contractingproperty-rights model of the boundaries of the rm which I then incorporate intoa standard trade model with imperfect competition and product differentiationThe model pins down the boundaries of multinational rms as well as the inter-national location of production and it is shown to predict the patterns of intrarmtrade identied above Econometric evidence reveals that the model is consistentwith other qualitative and quantitative features of the data
I INTRODUCTION
Roughly one-third of world trade is intrarm trade In 1994427 percent of the total volume of U S imports of goods tookplace within the boundaries of multinational rms with theshare being 363 percent for U S exports of goods [Zeile 1997]Not only is intrarm trade a large fraction of world trade but italso shows some distinctive patterns Relative to the total volumeof trade intrarm trade (i) is heavily concentrated in capital-intensive industries and (ii) ows mostly between capital-abun-dant countries Figure I provides a striking illustration of the rstfact In a cross section of 23 manufacturing industries the shareof intrarm imports in total U S imports is signicantly higherthe higher the capital intensity of the exporting industry Firms
I am grateful to Daron Acemoglu George-Marios Angeletos Gene Gross-man and Jaume Ventura for invaluable guidance and to Manuel Amador LuciaBreierova Francesco Caselli Fritz Foley Gino Gancia Andrew Hertzberg El-hanan Helpman Bengt Holmstrom Ben Jones Oscar Landerretche Alexis LeonGerard Padro-i-Miquel Thomas Philippon Diego Puga Jeremy Stein JoachimVoth two anonymous referees and the editor (Edward Glaeser) for very helpfulcomments I have also beneted from suggestions by seminar participants at theUniversity of California at Berkeley Graduate School of Business of the Univer-sity of Chicago Columbia University Harvard University the London School ofEconomics the Massachusetts Institute of Technology the National Bureau ofEconomic Research Northwestern University New York University PrincetonUniversity the University of California at San Diego Stanford University andYale University Financial support from the Bank of Spain is gratefully acknowl-edged All remaining errors are my own
copy 2003 by the President and Fellows of Harvard College and the Massachusetts Institute ofTechnologyThe Quarterly Journal of Economics November 2003
1375
Pantras
Text Box
Reprinted from the QUARTERLY JOURNAL OF ECONOMICS published by the MIT Press copyright copy 2003 by the President and Fellows of Harvard College and the Massachusetts Institute of Technology All rights reserved
in the United States tend to import capital-intensive goods suchas chemical products within the boundaries of their rms whilethey tend to import labor-intensive goods such as textile prod-ucts from unafliated parties Figure II unveils a second strongpattern in the share of intrarm imports In a cross section of 28countries the share of intrarm imports in total U S imports issignicantly higher the higher the capital-labor ratio of the ex-porting country U S imports from capital-abundant countriessuch as Switzerland tend to take place between afliated units ofmultinational rms while U S imports from capital-scarce coun-tries such as Egypt occur mostly at armrsquos length This secondfact indicates that the well-known predominance of North-Northtrade in total world trade is even more pronounced within theintrarm component of trade1
1 This is consistent with comparisons based on foreign direct investment(FDI) data In the year 2000 more than 85 percent of FDI ows occurred betweendeveloped countries [UNCTAD 2001] while the share of North-North trade intotal world trade was roughly 70 percent [World Trade Organization 2001]
FIGURE IShare of Intrarm U S Imports and Relative Factor Intensities
The Y-axis corresponds to the logarithm of the share of intrarm imports intotal U S imports for 23 manufacturing industries averaged over four years1987 1989 1992 1994 The X-axis measures the average log of that industryrsquosratio of capital stock to total employment using U S data See Appendix 4 forindustry codes and Appendix 3 for data sources
1376 QUARTERLY JOURNAL OF ECONOMICS
Why are capital-intensive goods transacted within theboundaries of multinational rms while labor-intensive goodsare traded at armrsquos length2 Indeed in a hypothetical world inwhich rm boundaries had no bearing on the pattern of interna-tional trade one would expect only random differences betweenthe behavior of the volume of intrarm trade and that of the totalvolume of trade In particular the share of intrarm trade in totaltrade would not be expected to correlate signicantly with any ofthe classical determinants of international trade including capi-tal intensity To answer this question I build on the theory of therm initially exposited in Coase [1937] and later developed byWilliamson [1985] and Grossman and Hart [1986] by whichactivities take place wherever transaction costs are minimized Inparticular I develop a property-rights model of the boundaries ofthe rm in which in equilibrium transaction costs of using the
2 At this point a natural question is whether capital intensity and capitalabundance are truly the crucial factors behind the correlations in Figures I and IISection IV will present econometric evidence indicating that these patterns arenot driven by omitted factors
FIGURE IIShare of Intrarm U S Imports and Relative Factor Endowments
The Y-axis corresponds to the logarithm of the share of intrarm imports intotal U S imports for 28 exporting countries in 1992 The X-axis measures the logof the exporting countryrsquos physical capital stock divided by its total number ofworkers See Appendix 5 for country codes and Appendix 3 for details on datasources
1377FIRMS CONTRACTS AND TRADE STRUCTURE
market are increasing in the capital intensity of the importedgood To explain the cross-country pattern in Figure II I thenembed this partial-equilibrium framework in a general-equilib-rium factor-proportions model of international trade with im-perfect competition and product differentiation along the lines ofHelpman and Krugman [1985] Capital-intensive goods aretransacted within rm boundaries while labor-intensive goodsare traded at armrsquos length The model pins down the boundariesof multinational rms as well as the international location ofproduction Bilateral trade ows between any two countries areuniquely determined with capital-abundant countries capturingrelatively large shares of a countryrsquos imports of capital-intensivegoods The interaction of transaction-cost minimization and com-parative advantage is shown to naturally give rise to the rela-tionship between intrarm trade and relative factor endowmentsin Figure II3
In drawing rm boundaries I build on the seminal work ofGrossman and Hart [1986] I consider a world of incompletecontracts in which nal-good producers need to obtain specializedintermediate inputs from their suppliers Production of theseintermediate inputs requires a combination of noncontractibleand relationship-specic investments in capital and labor Fol-lowing the property-rights approach of Grossman and Hart own-ership of their suppliers entitles nal-good producers to someresidual rights of control thus improving their ex post bargainingposition but reducing the suppliersrsquo ex ante incentives to makerelationship-specic investments When all investments in pro-duction are incurred by suppliers efciency dictates that nal-good producers always give up these residual rights of control andengage in armrsquos length transactions
To explain the higher propensity to integrate in capital-intensive industries I extend the framework of Grossman andHart [1986] by allowing the transferability of capital investmentdecisions In particular I show that in situations in which thebargaining power of suppliers is low giving up these residualrights of control may not sufce to induce suppliers to undertakeadequate levels of investment In such situations nal-good pro-ducers will nd it optimal to alleviate the holdup problem faced
3 This second part of the argument is based on the premise that capital-abundant countries tend to export mostly capital-intensive commodities Romalis[2002] has recently shown that the empirical evidence is indeed consistent withfactor proportions being a key determinant of the structure of international trade
1378 QUARTERLY JOURNAL OF ECONOMICS
by suppliers by contributing to their relationship-specic invest-ments in capital Investment-sharing reduces the holdup faced bysuppliers but naturally increases the exposure of nal-good pro-ducers to opportunistic behavior with the exposure being anincreasing function of the contribution to investment costs Ifcapital cost sharing is large enough as it will naturally be thecase in capital-intensive processes ex ante efciency is shown tocommand that residual rights of control and thus ownership beassigned to the nal-good producer thus giving rise to verticalintegration In general the attractiveness of vertical integrationis shown to be increasing in the capital intensity of intermediateinput production4
The argument is based on the premise that investmentsrelated to the labor input are harder to share than investments inphysical capital This may be the result of suppliers having su-perior local knowledge in hiring workers or it may be explainedby the fact that managing workers requires a physical presence inthe production plant Business practices indeed suggest that costsharing is more prevalent in capital investments Dunning [1993pp 455ndash 456] describes several cost-sharing practices of multina-tional rms in their relations with independent subcontractorsAmong others these include provision of used machinery andspecialized tools and equipment prenancing of machinery andtools and procurement assistance in obtaining capital equip-ment There is no reference to cost sharing in labor costs otherthan in labor training Milgrom and Roberts [1993] discuss theparticular example of General Motors which pays for rm- andproduct-specic capital equipment needed by their supplierseven when this equipment is located in the suppliersrsquo facilitiesSimilarly in his review article on Japanese rms Aoki [1990 p25] describes the close connections between manufacturers andtheir suppliers but writes that ldquosuppliers have considerable au-tonomy in other respects for example in personnel administra-tionrdquo Even within rm boundaries cost sharing seems to mostlytake place when capital investments are involved In particularTable I indicates that British afliates of U S-based multina-
4 Although in this paper I show that a Grossman-Hart-Moore view of therm is consistent with the facts in Figures I and II neither my theoretical modelnor the available empirical evidence is rich enough to test this view of the rmagainst alternative ones This would be a major undertaking on its own See Bakerand Hubbard [2002] and Whinston [2002] for more formal treatments of theseissues
1379FIRMS CONTRACTS AND TRADE STRUCTURE
tionals tend to have much more independence in their employ-ment decisions (eg in hiring of workers) than in their nancialdecisions (eg in their choice of capital investment projects)
This paper is related to previous theoretical studies of themultinational rm in general-equilibrium models of internationaltrade This literature has developed models rationalizing theemergence of multinational rms in the presence of internationalfactor-price differentials (eg Helpman [1984]) whenever trans-port costs are high and whenever rm-specic economies of scaleare high relative to plant-specic economies of scale (egMarkusen [1984] and Brainard [1997]) These different ap-proaches to the multinational rm share a common failure toproperly model the crucial issue of internalization These modelscan explain why a domestic rm might have an incentive toundertake part of its production process abroad but they fail toexplain why this foreign production will occur within rm bound-aries rather than through armrsquos length subcontracting or licens-ing In the same way that a theory of the rm based purely ontechnological considerations does not constitute a satisfactorytheory of the rm (cf Tirole [1988] and Hart [1995]) a theory ofthe multinational rm based solely on economies of scale andtransport costs cannot be satisfactory either As described aboveI will instead set forth a purely organizational property-rightsmodel of the multinational rm My model will make no distinc-tion between rm-specic and plant-specic economies of scaleFurthermore trade will be costless and factor prices will notdiffer across countries Yet multinationals will emerge in equilib-
TABLE IDECISION-MAKING IN U S BASED MULTINATIONALS
of British afliates in which parent inuence on decision is strong or decisive
Financial decisions Employmentpersonnel decisionsSetting of nancial targets 51 Union recognition 4Preparation of yearly budget 20 Collective bargaining 1Acquisition of funds for working capital 44 Wage increases 8Choice of capital investment projects 33 Numbers employed 13Financing of investment projects 46 Layoffsredundancies 10Target rate of return on investment 68 Hiring of workers 10Sale of xed assets 30 Recruitment of executives 16Dividend policy 82 Recruitment of seniorRoyalty payments to parent company 82 managers 13
Source Dunning [1993 p 227] Originally from Young Hood and Hamill [1985]
1380 QUARTERLY JOURNAL OF ECONOMICS
rium and their implied intrarm trade ows will match thestrong patterns identied above5
The rest of the paper is organized as follows Section IIdescribes the closed-economy version of the model and studies therole of factor intensity in determining the equilibrium mode oforganization Section III describes the multicountry version of themodel and discusses the international location of production aswell as the implied patterns of intrarm trade Section IV pre-sents econometric evidence supporting the view that both capitalintensity and capital abundance are signicant factors in explain-ing the volume of U S intrarm imports Section V concludesThe proofs of the main results are relegated to Appendixes 1 and 2
II THE CLOSED-ECONOMY MODEL OWNERSHIP
AND CAPITAL INTENSITY
This section develops an incomplete-contracting property-rights model of the boundaries of the rm that rationalizes ahigher motive of integration in capital-intensive sectors
IIA Setup
Consider a closed economy that employs two factors of pro-duction capital and labor to produce a continuum of varieties intwo sectors Y and Z Capital and labor are inelastically suppliedand freely mobile across sectors The economy is inhabited by aunit measure of identical consumers who view the varieties ineach industry as differentiated In particular letting y(i) and z(i)be consumption of variety i in sectors Y and Z preferences of therepresentative consumer are of the form
(1) U 5 S E0
nY
y~ia diD maS E0
nZ
z~ia diD ~12ma
5 This paper is also related to previous attempts to model the internalizationdecision of multinational rms Following the insights from the seminal work ofCasson [1979] Rugman [1981] and others this literature has constructed modelsstudying the role of informational asymmetries and knowledge nonexcludabilityin determining the choice between direct investment and licensing (eg Ethier[1986] and Ethier and Markusen [1996]) This paper differs from this literature instressing the importance of capital intensity and the allocation of residual rightsin the internalization decision and perhaps more importantly in describing andtesting the implications of such a decision for the pattern of intrarm trade Mytheoretical framework also shares some features with recent contributions to anemerging literature on general-equilibrium models of industry structure (egMcLaren [2000] and Grossman and Helpman [2002a 2002b])
1381FIRMS CONTRACTS AND TRADE STRUCTURE
where nY (nZ) is the endogenously determined measure of vari-eties in industry Y (Z) Consumers allocate a constant share m [(01) of their spending in sector Y and a share 1 2 m in sector ZThe elasticity of substitution between any two varieties in a givensector 1(1 2 a) is assumed to be greater than one
Goods are also differentiated in the eyes of producers Inparticular each variety y(i) requires a special and distinct inter-mediate input which I denote by xY (i) Similarly each variety z(i)requires a distinct component xZ(i) The specialized intermediateinput must be of high quality otherwise the output of the nalgood is zero If the input is of high quality production of the nalgood requires no further costs and y(i) 5 xY (i) z(i) 5 xZ(i)
Production of a high-quality intermediate input requirescapital and labor For simplicity technology is assumed to beCobb-Douglas
(2) xk~i 5 S Kxk~ibk
D bkS Lxk~i1 2 bk
D 12bk
k [ $YZ
where Kx k(i) and Lx k(i) denote the amount of capital and laboremployed in production of variety i in industry k [ YZ Iassume that industry Y is more capital-intensive than industryZ ie 1 $ bY bZ $ 0 Low-quality intermediate inputs can beproduced at a negligible cost in both sectors
There are also xed costs associated with the production ofan intermediate input To simplify matters it is assumed thatxed costs in each industry have the same factor intensity asvariable costs so that the total cost functions are homothetic Inparticular xed costs for each variety in industry k [ YZ arefrb kw12 b k where r is the rental rate of capital and w the wagerate
There are two types of producers nal-good producers andsuppliers of intermediate inputs Before any investment is madea nal-good producer decides whether it wants to enter a givenmarket and if so whether to obtain the component from a ver-tically integrated supplier or from a stand-alone supplier Anintegrated supplier is just a division of the nal-good producerand thus has no control rights over the amount of input producedFiguratively at any point in time the parent rm could selec-tively re the manager of the supplying division and seize pro-duction Conversely a stand-alone supplier does indeed havethese residual rights of control In Hart and Moorersquos [1990] wordsin such a case the nal-good producer could only ldquorerdquo the entire
1382 QUARTERLY JOURNAL OF ECONOMICS
supplying rm including its production Integrated and noninte-grated suppliers differ only in the residual rights they are enti-tled to and in particular both have access to the same technologyas specied in equation (2)6
As discussed in the Introduction a premise of this paper isthat investments in physical capital are easier to share thaninvestments in labor input To capture this idea I assume thatwhile the labor input is necessarily provided by the suppliercapital expenditures rKx k(i) are instead transferable in thesense that the nal-good producer can decide whether to let thesupplier incur this factor cost too or rather rent the capital itselfand hand it to the supplier at no charge7 Irrespective of whobears their cost the investments in capital and labor are chosensimultaneously and noncooperatively8 Once a nal-good pro-ducer and its supplier enter the market they are locked into therelationship the investments rKx k(i) and wLx k(i) are incurredupon entry and are useless outside the relationship In William-sonrsquos [1985] words the initially competitive environment is fun-damentally transformed into one of bilateral monopoly Regard-less of rm structure and the choice of cost sharing xed costsassociated with production of the component are divided as fol-lows fFrb kw12 b k for the nal-good producer and fSrbkw12 bk forthe supplier with fF 1 fS 5 f9
Free entry into each sector ensures zero expected prots fora potential entrant To simplify the description of the industryequilibrium I assume that upon entry the supplier makes alump-sum transfer Tk(i) to the nal-good producer which canvary by industry and variety Ex ante there are a large numberof identical potential suppliers for each variety in each industryso that competition among these suppliers will make Tk(i) adjustso as to make them break even The nal-good producer chooses
6 This is in contrast with the transaction-cost literature that usually as-sumes that integration leads to an exogenous increase in variable costs (egWilliamson [1985] and Grossman and Helpman [2002a])
7 Alternatively one could assume that labor costs are also transferable butthat their transfer leads to a signicant fall in productivity This fall in produc-tivity could be explained in an international context by the inability of multina-tional rms to cope with idiosyncratic labor markets (cf Caves [1996 p 123])
8 The assumption that the nal-good producer decides between bearing allor none of the capital expenditures can be relaxed to a case of partial transfer-ability (see Antras [2003])
9 Henceforth I associate a subscript F with the nal-good producer and asubscript S with the supplier
1383FIRMS CONTRACTS AND TRADE STRUCTURE
the mode of organization so as to maximize its ex ante protswhich include the transfer
The setting is one of incomplete contracts It is assumed thatan outside party cannot distinguish between a high-quality and alow-quality intermediate input Hence input suppliers and nal-good producers cannot sign enforceable contracts specifying thepurchase of a certain type of intermediate input for a certainprice If they did input suppliers would have an incentive toproduce a low-quality input at the lower cost and still cash thesame revenues I take the existence of contract incompleteness asa fact of life and will not complicate the model to relax theinformational assumptions needed for this incompleteness to ex-ist10 It is equally assumed that no outside party can verify theamount of ex ante investments rKx k(i) and wLx k(i) If thesewere veriable then nal-good producers and suppliers couldcontract on them and the cost-reducing benet of producing alow-quality input would disappear For the same reason it isassumed that the parties cannot write contracts contingent onsale revenues Following Grossman and Hart [1986] the onlycontractibles ex ante are the allocation of residual rights and theex ante transfer Tk(i)11
If the supplier incurs all variable costs the contract incom-pleteness gives rise to a standard holdup problem The nal-goodproducer will want to renegotiate the price after xk(i) has beenproduced since at this point the intermediate input is uselessoutside the relationship Foreseeing this renegotiation the sup-plier will undertake suboptimal investments in both capital andlabor If the nal-good producer shares capital expenditures withthe supplier the holdup problem becomes two-sided Because theinvestment in capital is also specic to the pair the nal-good
10 From the work of Aghion Dewatripont and Rey [1994] Noldeke andSchmidt [1995] and others it is well-known that allowing for specic-perfor-mance contracts can lead under certain circumstances to efcient ex ante rela-tionship-specic investments Che and Hausch [1997] have shown however thatwhen ex ante investments are cooperative (in the sense that one partyrsquos invest-ment benets the other party) specic-performance contracts may not lead torst-best investment levels and may actually have no value
11 The assumption of noncontractibility of ex ante investments could berelaxed to a case of partial contractibility I have investigated an extension of themodel in which production requires both contractible and noncontractible invest-ments If the marginal cost of noncontractible investments is increasing in theamount of contractible investments the ability to set the contractible investmentsin the ex ante contract is not sufcient to solve the underinvestment problemdiscussed below and the model delivers results analogous to the ones discussed inthe main text
1384 QUARTERLY JOURNAL OF ECONOMICS
producer is equally locked in the relationship and its investmentin capital will also tend to be suboptimal In either case theextent of the underinvestment by each party will be inverselyrelated to the share of surplus they obtain in the bargaining Asis standard in the literature I model the ex post bargaining as aGeneralized Nash Bargaining which leaves the nal-good pro-ducer with a fraction f [ (01) of the ex post gains from trade
As discussed in the Introduction cost sharing will emerge inequilibrium whenever the bargaining power of suppliers is low Ihereafter assume the following
ASSUMPTION 1 f 12
Following the work of Grossman and Hart [1986] and Hartand Moore [1990] and contrary to the older transaction-costliterature integration of the supplier does not eliminate the op-portunistic behavior at the heart of the holdup problem Bargain-ing will therefore occur even when the nal-good producer andthe supplier are integrated The ex post distribution of surpluswill however be sensitive to ownership structure When thesupplier is a stand-alone rm the amount xk(i) is owned by thesupplier and thus if the two parties fail to agree on a division ofthe surplus the nal-good producer is left with nothing Con-versely under integration the manager of the nal-good pro-ducer can always re the manager of the supplying division andseize the amount of input already produced The outside optionfor the nal-good producer will therefore be higher under inte-gration than under outsourcing If the nal-good producer couldfully appropriate xk(i) under integration there would be no sur-plus to bargain over after production and the supplier wouldoptimally set Lx k(i) 5 0 (which of course would imply thatxk(i) 5 0) In that case integration would never be chosen Tomake things more interesting I assume that by integrating thesupplier the nal-good producer obtains the residual rights overonly a fraction d [ (01) of the amount of xk(i) produced so thatthe surplus of the relationship remains positive even under inte-gration12 On the other hand and because the component iscompletely specic to the nal-good producer the outside optionfor the intermediate input producer is zero regardless of owner-ship structure
12 I take the fact that d is strictly less than one as given but this assumptioncould be rationalized in a richer framework (see Antras [2003] for a rationale)
1385FIRMS CONTRACTS AND TRADE STRUCTURE
Figure III summarizes the timing of events At t0 the nal-good producer decides whether it wants to enter a given marketresidual rights are assigned the extent of cost sharing is decidedand the supplier makes a lump-sum transfer to the nal-goodproducer At t1 rms choose their investments in capital andlabor and also incur their xed costs At t2 the nal-good pro-ducer hands the specications of the component (and perhaps thecapital stock Kx k) to its partner and this latter produces theintermediate input which can be of high or low quality At t3 thequality of the component becomes observable and the two partiesbargain over the division of the surplus Finally at t4 the nalgood is produced and sold For simplicity I assume that agents donot discount the future between t0 and t4
IIB Firm Behavior
The model is solved by starting at t4 and moving backwardsI will assume throughout the main text that nal-good producersalways choose to engage in capital cost sharing and thus incur thevariable costs rKx k(i) In Appendix 1 I formally show that As-sumption 1 is in fact sufcient to ensure that this is the case inequilibrium
The unit elasticity of substitution between varieties in indus-tries Y and Z implies that we can analyze rm behavior in eachindustry independently Consider industry Y and suppose thatat t4 nY V pairs of integrated rms and nY O pairs of stand-alonerms are producing13 Let pY V(i) be the price charged for varietyi by an integrating nal-good producer and let pY O(i) be the
13 Henceforth a subscript V will be associated with nal-good producersthat vertically integrate their suppliers A subscript O will be used for those thatoutsource the production of the input
FIGURE IIITiming of Events
1386 QUARTERLY JOURNAL OF ECONOMICS
corresponding price charged by a nonintegrating nal-good pro-ducer From equation (1) demand for any variety i in industry Yis given by
(3) y~i 5 AYpY~i21~12a
where
(4) AY 5mE
0nYV pYV~ j2a~12a dj 1 0
nYO pYO~ j2a~12a dj
and E denotes total spending in the economy I treat the numberof rms as a continuum implying that rms take AY as given
Integrated pairs Consider rst the problem faced by anal-good producer and its integrated supplier If the latter pro-duces a high-quality intermediate input and the rms agree inthe bargaining the potential revenues from the sale of the nalgood are RY (i) 5 pY (i) y(i) On the other hand if the parties failto agree in the bargaining the nal-good producer will only beable to sell an amount dy(i) of output which using (3) willtranslate into sale revenues equal to a fraction da of sale revenuesin the case of an agreement The ex post opportunity cost for thesupplier is zero implying that the ex post gains from trade are(1 2 da) RY (i) Because of the contract incompleteness the sur-plus is divided among the parties at t3 Generalized Nash Bar-gaining leaves the nal-good division with its default optiondaRY (i) plus a fraction f of the quasi rents while the integratedsupplier receives the remaining fraction 1 2 f of the quasi rentsSince both f and d are assumed to be strictly less than one thesupplierrsquos ex post revenues from producing a high-quality inputare strictly positive Low-quality inputs will therefore never beproduced at t2 Rolling back to t1 the nal-good producer sets itsinvestment in capital Kx Y (i) to maximize f RY (i) 2 rKx Y (i)where
f 5 da 1 f~1 2 da f
The program yields a best-response capital investment Kx Y (i) interms of factor prices the level of demand as captured by AY andthe investment in labor Lx Y (i) On the other hand the integratedsupplier simultaneously sets Lx Y (i) to maximize (1 2 f ) RY (i) 2wLx Y (i) from which an analogous reaction function for Lx Y (i) is
1387FIRMS CONTRACTS AND TRADE STRUCTURE
obtained14 Solving for the intersection of these two best-responsefunctions and plugging the equilibrium ex ante investments into(2) and (3) yields the optimal price for all varieties in industry Y
(5) pYV 5rbYw12bY
af bY~1 2 f 12bY
Facing a constant elasticity of demand the nal-good producercharges a constant markup over marginal cost The distortionaryeffect of incomplete contracting takes the form of a markup thatis 1f b Y(1 2 f )12 b Y times higher than the one that would becharged if contracts were complete15
At t0 the supplier makes a lump-sum transfer TY V to thenal-good producer As discussed above this ex ante transferexactly equals the supplierrsquos prots so that ex ante prots for anintegrating nal-good producer can be expressed as
(6) pFVY 5 ~1 2 a~1 2 bY 1 af ~1 2 2bYAYpYV2a~12a 2 frbYw12bY
where pY V is given in (5)Nonintegrated pairs Consider next a pair of stand-alone
rms In this case the supplier is entitled to the residual rights ofcontrol over the amount of input produced at t2 The ex postopportunity cost for the nal-good producer is therefore zero inthis case As for the supplier since the component is specic tothe nal-good producer the value of xY (i) outside the relationshipis also zero It follows that if the intermediate-input producerhands a component with the correct specication the potentialsale revenues RY (i) will be entirely quasi rents In the bargain-ing the nal-good producer will obtain a fraction f of these expost gains and at t1 it will choose Kx Y (i) to maximize fRY (i) 2rKx Y (i) On the other hand the supplier will set Lx Y (i) tomaximize (1 2 f) RY (i) 2 wLx Y (i) It is clear that the solutionto the problem is completely analogous to that for pairs of inte-grated rms with f replacing f in equations (5) and (6) In partic-ular prots for a nal-good producer that chooses to outsource the
14 The supplier could in principle nd it optimal to complement the capitalinvestment of the nal-good division with some extra investment of its ownNevertheless if the two investments in capital are perfect substitutes in produc-tion Assumption 1 is sufcient to ensure that the optimal capital investment ofthe supplier is zero (see Antras [2003])
15 At t1 the two parties also choose how much capital and labor to rent inincurring the xed costs The particular values of these factor demands can beobtained by applying Shepardrsquos lemma (eg Lf F Y 5 (1 2 bY ) fF (wr)2 b Y)
1388 QUARTERLY JOURNAL OF ECONOMICS
production of the intermediate input are
(7) pFYO 5 ~1 2 a~1 2 bY 1 af~1 2 2bYAYpYO2a~12a 2 frbYw12bY
where pY O 5 rbYw12 bY(afbY(1 2 f)12 b Y)It is useful to compare the present setup to one in which the
quality of the component was veriable so that quality-contin-gent contracts could be enforced In such a case the two partieswould bargain over the division of the surplus upon entry and thecontract would not be renegotiated ex post The investments incapital and labor would be set to maximize the total surplus of therelationship which is given by pY (i) y(i) 2 rKx Y (i) 2 wLx Y (i) 2frb Yw12 b Y It is straightforward to check that the impossibility ofwriting enforceable contracts leads to underinvestment in bothKx Y and Lx Y Underinvestment stems from the fact that withincomplete contracts producers receive only a fraction of themarginal return to their ex ante investments The inefciency isdepicted in Figure IV The curves F and S represent the reac-tion functions Kx Y (Lx Y ) and Lx Y (Kx Y ) under complete con-tracts with the corresponding equilibrium in point A SimilarlyB and C depict the incomplete-contract equilibria correspondingto integration and outsourcing respectively Crucially the under-investment in labor relative to that in capital tends to be greater
1389FIRMS CONTRACTS AND TRADE STRUCTURE
under integration that under outsourcing16 This follows from thefact that under integration the supplier has a relatively weakerbargaining power and thus receives a smaller fraction of themarginal return to its ex ante investment By a similar argumentthe investment in capital tends to be relatively more inefcientunder outsourcing than under integration
IIC Factor Intensity and Ownership Structure
At t0 the nal-good producer chooses the ownership struc-ture that maximizes its ex ante prots Let Q(bk) denote the ratioof operating prots under vertical integration to those underoutsourcing Using equations (6) (7) and f 5 da 1 f(1 2 da) thisratio can be expressed as
(8) Q~bk 5 S 1 1a~1 2 fda~1 2 2bk
1 2 a~1 2 bk 1 af~1 2 2bkD
3 S 1 1da
f~1 2 daDabk~12a
~1 2 daa~12a
As I prove in Appendix 2 the attractiveness of integration asmeasured by Q(bk) is increasing in the capital intensity of in-termediate input production ie Q9(bk) 0 Intuitively therelatively higher underinvestment in capital associated with out-sourcing is more value-reducing the higher the capital intensityin production Furthermore it can be shown that for low enoughcapital intensities outsourcing yields higher prots than integra-tion (Q(0) 1) while for high enough capital intensities theconverse is true (Q(1) 1)17 It thus follows
PROPOSITION 1 There exists a unique threshold capital intensityb [ (01) such that all rms with bk b choose to outsourceproduction of the intermediate input (ie Q(bk) 1) while
16 By this I mean that (Lx Y Lx Y V )(Kx Y Kx Y V ) (Lx Y Lx Y O )(Kx Y Kx Y O ) Note that this also implies that controlling for industry characteristicsintegrated suppliers should be using a higher capital-labor ratio in productionthan nonintegrated ones This is consistent with the results of some empiricalstudies discussed in Caves [1996 pp 230ndash231] and Dunning [1993 p 296] thatcompare capital intensity in overseas subsidiariesof multinationalrms with thatof independent domestic rms in the host country
17 An important point to notice here is that Q(bk) is not a function of factorprices This follows directly from the assumption of Cobb-Douglas technology andisolates the partial-equilibrium decision to integrate or outsource from any po-tential general-equilibrium feedbacks This implied block-recursiveness is a use-ful property for solving the model sequentially but the main results should berobust to more general specications for technology
1390 QUARTERLY JOURNAL OF ECONOMICS
all rms with bk b choose to integrate their suppliers (ieQ(bk) 1) Only rms with capital intensity b are indiffer-ent between these two options
Proof See Appendix 2
The logic of this result lies at the heart of Grossman andHartrsquos [1986] seminal contribution In a world of incomplete con-tracts ex ante efciency dictates that residual rights should becontrolled by the party undertaking a relatively more importantinvestment If production of the intermediate input requiresmostly labor the investment made by the nal-good producer willbe relatively small and thus it will be optimal to assign theresidual rights of control to the supplier in order to alleviate theunderinvestment in the labor input (see Figure IV) Converselywhen the capital investment is important the nal-good producerwill optimally choose to tilt the bargaining power in its favorby obtaining these residual rights thus giving rise to verticalintegration18
Proposition 1 advances a rationale for the rst fact identiedin the introduction To the extent that vertical integration ofsuppliers occurs mostly in capital-intensive industries one wouldexpect the share of intrarm trade to be relatively higher in thoseindustries Nevertheless Proposition 1 cannot by itself justify thetrade pattern in Figure I An explanation of this fact requires aproper modeling of international trade ows which I carry out inSection III
IID Industry Equilibrium
Without loss of generality consider next the industry equi-librium in sector Y In equilibrium free entry implies that no rmmakes positive expected prots In principle three equilibriummodes of organization are possible (i) a mixed equilibrium withsome varieties being produced by integrated pairs and others bynonintegrated pairs (ii) an equilibrium with pervasive integra-
18 Equation (8) lends itself to other comparative static exercises For in-stance it is possible to show that Q(bk) is a decreasing function of f which by theimplicit function theorem implies that the cutoff b is an increasing function of fTo understand this result notice that an increase in f shifts bargaining powerfrom the supplier to the nal-good producer regardless of ownership structure(since f increases with f) It thus follows that increasing f necessarily worsensthe incentives for the supplier To compensate for this the nal-good producer willnow nd it protable to outsource in a larger measure of capital intensities Thepartial derivative of Q(bk) with respect to a and d is in general ambiguous (seeAntras [2003] for details)
1391FIRMS CONTRACTS AND TRADE STRUCTURE
tion in which no nal-good producer nds it protable to out-source the production of the intermediate input and (iii) anequilibrium with pervasive outsourcing in which no nal-goodproducer chooses to vertically integrate its supplier The assump-tion that all rms in a given industry share the same capitalintensity greatly simplies the analysis In particular a mixedequilibrium in industry Y can only exist in a knife-edge casenamely when bY 5 b The equilibrium in industry Y is either onewith pervasive integration when bY b or one with pervasiveoutsourcing when bY b
Because a mixed equilibrium does not generically exist wecan focus on a characterization of the two other types of equilib-ria Consider rst an equilibrium in which only integrating nal-good producers enter the market As discussed above the ex antetransfer TY V ensures that suppliers always break even If nonal-good producer outsources the production of xY all rms willcharge a price for y(i) given by equation (5) Since nY O 5 0equation (4) simplies to AY V 5 mEpY V
a (12 a )nY V Plugging thisexpression into equation (6) and setting pF V to 0 as dictated byfree entry yields the following expression for the equilibriumnumber of vertically integrated pairs
(9) nYV 51 2 a~1 2 bY 1 af ~1 2 2bY
frbYw12bYmE
Naturally the equilibrium number of varieties in industry Ydepends positively on total spending in the industry and nega-tively on xed costs
Consider next an equilibrium with pervasive outsourcing Insuch an equilibrium every rm charges a price given by pY O
which makes equation (4) simplify to AY O 5 mEpY Oa (12 a )nY O
Imposing again free entry on equation (7) yields the equilibriumnumber of pairs undertaking outsourcing
(10) nYO 51 2 a~1 2 bY 1 af~1 2 2bY
frbYw12bYmE
IIE General Equilibrium
Having described the equilibrium in a particular industrywe can now move to the general equilibrium of the closed econ-omy in which income equals spending
(11) E 5 rK 1 wL
1392 QUARTERLY JOURNAL OF ECONOMICS
and the capital and labor markets clear By Walrasrsquo law we canfocus on the equilibrium in the labor market Letting LY and LZ
denote total labor demand by each pair in industries Y and Zlabor market clearing requires nYLY 1 nZLZ 5 L We candecompose LY into three components depending on the equilib-rium mode of organization In an equilibrium with pervasiveintegration
(12) LY 5 LxYV 1 L fFY 1 L fSY
The rst term is the total amount of labor hired by integratedsuppliers for the manufacturing of intermediate inputs The re-maining terms are the amounts of labor hired to cover xed costsby nal-good producers and suppliers Plugging the equilibriumvalues for labor demands into equation (12) and using (11) andthe equilibrium value of nY V to simplify results in
(13) wnYVLY 5 ~1 2 bY~1 2 abY~2f 2 1m~rK 1 wL
Similarly in an equilibrium with pervasive outsourcing
(14) wnYOLY 5 ~1 2 bY~1 2 abY~2f 2 1m~rK 1 wL
Equations (13) and (14) imply that the share of income thatlabor receives is sensitive to the equilibrium mode of organiza-tion Given the assumption of Cobb-Douglas technology in aworld of complete contracts the share of income accruing to laborin industry Y would be m(1 2 bY ) With incomplete contracts theshare received by labor will be larger or smaller than m(1 2 bY )depending on whether f or f are smaller or greater than 12
To set the stage for an analysis of the share of intrarm tradein total trade I make the following assumption
ASSUMPTION 2 bY b bZ
In words I assume that the equilibrium in industry Y is onewith pervasive integration while that in industry Z is one ofpervasive outsourcing It is useful to dene the shares of incomethat accrue to capital in each sector which using equations (13)and (14) are given by bY 5 bY(1 1 a(1 2 bY) (2f 2 1)) and bZ 5bZ(1 1 a(1 2 bZ)(2f 2 1))19 Denoting the average labor sharein the economy by sL [ m(1 2 bY) 1 (1 2 m)(1 2 bZ) and impos-
19 Notice that bY bZ implies that bY bZ and incomplete contractingdoes not create factor intensity reversals
1393FIRMS CONTRACTS AND TRADE STRUCTURE
ing the condition nY VLY 1 nZ OLZ 5 L the equilibrium wage-rental ratio in the economy can be expressed as
(15)wr
5sL
1 2 sL
KL
Because of the unit elasticity of substitution in production theequilibrium wage-rental ratio is a linear function of the aggregatecapital-labor ratio The factor of proportionality is equal to theaverage labor share in the economy divided by the average capitalshare Under Assumption 1 the average labor share and theequilibrium wage-rental ratio are depressed relative to their val-ues in a world with complete contracts20
III THE MULTICOUNTRY MODELCAPITAL ABUNDANCE AND INTRAFIRM TRADE
Suppose now that the closed economy described above is splitinto J $ 2 countries with each country receiving an endowmentK j of capital and an endowment L j of labor Factors of productionare internationally immobile Countries differ only in their factorendowments In particular individuals in all J countries haveidentical preferences as specied in equation (1) and share accessto the same technology in equation (2) The parameters f and dare also assumed to be identical everywhere Countries are al-lowed to trade intermediate inputs at zero cost while nal goodsare instead assumed to be nontradable so that each nal-goodproducer has a (costless) plant in each of the J countries21 Va-rieties of intermediate inputs will instead be produced in only onelocation in order to exploit economies of scale I assume that forall j [ J the capital-labor ratio K jL j is not too different fromKL so that factor price equalization (FPE) holds and the equi-librium prices and aggregate allocations are those of the inte-grated economy described above Below I derive both necessaryand sufcient conditions for FPE to be achieved
20 Intuitively with f 12 the underinvestment in labor is relatively moresevere than the underinvestment in capital Because factors are supplied inelas-tically the relatively lower demand for labor tends to push down its price and itsshare in total income
21 Because nal goods are costlessly produced the model cannot en-dogenously pin down where their production is located Assuming that they arenot traded resolves this indeterminacy In Antras [2003] I showed that the mainresult goes through under alternative setups that equally resolve the indetermi-nacy (see footnote 27 for more on this)
1394 QUARTERLY JOURNAL OF ECONOMICS
This section is in two parts I rst study the internationallocation of production of intermediate inputs and show how thecross-country differences in factor endowments naturally giverise to cross-country differences in industry structure I thenanalyze the implied patterns of international trade and discussthe determinants of its intrarm component
IIIA Pattern of Production
Because countries differ only in their factor endowments thecutoff capital intensity b will be identical in all countries and byAssumption 2 suppliers in industry Y will be vertically inte-grated while those in industry Z will remain nonintegrated Thefactor market clearing conditions in country j [ J can be writtenas
(16) nYj ~KxY
j 1 K fFYj 1 KfSY
j 1 nZj ~KxZ
j 1 K fFZj 1 K fSZ
j 5 Kj
(17) nYj ~LxY
j 1 L fFYj 1 L fSY
j 1 nZj ~LxZ
j 1 LfFZj 1 L fSZ
j 5 L j
where nkj refers now to the number of industry k varieties of
intermediate inputs produced in country j22 It is straightforwardto check that factor demands for each variety depend only onworldwide identical parameters and on aggregate prices whichbecause of FPE are also common in all countries This impliesthat differences in the pattern of production between countrieswill be channelled through the number of industry varieties pro-duced in each country Plugging the equilibrium factor demandsinto (16) and (17) and combining these two expressions yields thenumber of varieties of intermediate inputs produced in country j
(18) nYj 5 S ~1 2 b Z ~1 2 sL
K j
K2 b Z sL
L j
L D nY
~b Y 2 bZ m
(19) nZj 5 S b Y sL
L j
L2 ~1 2 b Y ~1 2 sL
K j
K D nZ
~bY 2 bZ ~1 2 m
where nY is given by equation (9) and nZ by equation (10) with bZ
replacing bY Equation (18) states that a given country j [ J willproduce a larger measure of intermediate-input varieties in in-dustry Y the larger its capital-labor ratio Conversely from equa-
22 To simplify notation I drop all subscripts associated with the equilibriummode of organization For instance I denote the equilibrium number of varietiesproduced in industry Y (Z) and country j by nY
j (nZj ) instead of nY V
j (nZ Oj )
1395FIRMS CONTRACTS AND TRADE STRUCTURE
tion (19) the measure of industry Z varieties it produces is adecreasing function of its capital-labor ratio Note also that for agiven KjLj both nY
j and nZj are increasing in the size of country j
as measured by its share in world GDP s j [ (rK j 1 wLj)(rK 1wL) In fact it is easy to check that nY
j s jnY if and only ifK jLj KL and nZ
j sjnZ if and only if K jL j KL In wordscapital- (labor)-abundant countries tend to capture a fraction ofthe world production of input varieties in the capital (labor)-intensive industry that exceeds their share in world income
For the above allocation to be consistent with FPE it isnecessary and sufcient that nY
j 0 and nZj 0 for all j [ J ie
that no country fully specializes in any one sector23 Using equa-tions (18) and (19) this condition can be written as
ASSUMPTION 3
k 5bYsL
~1 2 bY~1 2 sL
KjLj
KL
bZsL
~1 2 bZ~1 2 sL5 k for all j [ J24
Figure V provides a graphical representation of the produc-tion pattern for the case of two countries the North (N) and theSouth (S) The graph should be familiar to readers of Helpmanand Krugman [1985] ON and OS represent the origins for theNorth and the South respectively The vectors ONY and ONZrepresent world employment of capital and labor in industries Yand Z in the equilibrium of the integrated economy The set offactor endowments consistent with FPE corresponds to the set ofpoints inside the parallelogram ONYOSZ Point E denes thedistribution of factor endowments Line BB9 goes through point Eand has a slope of wr The relative income of each country is thusheld xed for all points along this line and inside the FPE set Tomap this gure to the pattern of production described above Ifollow Helpman and Krugman [1985] in choosing units of mea-surement so that iONYi 5 nYy iONZi 5 nZz and iONOSi 5E 5 rK 1 wL With the rst two normalizations we can graphi-
23 To understand necessity notice that when factor prices depend only onworld factor endowments the capital-labor ratio in production is xed and iden-tical for all countries Therefore a given country cannot employ all its factors byproducing in only one industry except in the knife-edge case in which its endow-ment of K j and Lj exactly match that industryrsquos factor intensity For a discussionof sufciency see Helpman and Krugman [1985 pp 13ndash14]
24 The upper bound k is greater than one while the lower bound k is smallerthan one Assumption 3 thus requires the capital-labor ratio KjLj to be suf-ciently similar to KL
1396 QUARTERLY JOURNAL OF ECONOMICS
cally determine the number of varieties of intermediate inputsproduced in each country Moreover with the last normalizationwe can write sN 5 iON C i iONOS i Basic geometry then impliesthat nY
N sNnY and nZN sNnZ which is what we expected given
that in the graph the North is capital-abundant relative to theSouth
So far I have assumed that factors of production are inter-nationally immobile I therefore have not allowed nal-good pro-ducers to rent the capital stock in their home country and exportit to the country where intermediates are produced Allowing forsuch international factor movements would not invalidate theequilibrium described above In fact by equalizing factor priceseverywhere international trade in intermediate inputs elimi-nates the incentives for capital to ow across countries25
25 More generally I only require that the costs of capital mobility are higherthan the costs of trading goods so that international differences in rates of returnare arbitraged away through trade ows rather than through capital ows (cfMundell [1957])
1397FIRMS CONTRACTS AND TRADE STRUCTURE
IIIB Pattern of Trade
Having described the international location of production ofintermediate inputs we can nally move to the study of tradepatterns Since the nal good is nontradable the entire volume ofworld trade will be in intermediate inputs Before describingthese ows in more detail we must rst confront the problem ofhow to value them The fact that contracts are incomplete impliesthat there is no explicit price for these varieties Because allvariable costs are incurred in the country where the input isproduced a plausible assumption is to value these intermediatesat average cost And because the nal good is produced at no costthe implicit price of an intermediate input is simply pY V inindustry Y and pZ O in industry Z26
Without loss of generality consider now a given country N rsquosimports from another country S Country N will host nY 1 nZ
plants producing nal-good varieties Of the nY plants in industryY a measure nY
S will be importing the intermediate input fromtheir integrated suppliers in country S This volume of trade willthus be intrarm trade On the other hand of the nZ plants inindustry Z a measure nZ
S will be importing the input from inde-pendent suppliers in country j THORN N These transactions will thusoccur at armrsquos length Furthermore because preferences are ho-mothetic and identical everywhere consumers in country N willincur a fraction sN of world spending on each variety It thusfollows that the total volume of N imports from S will besN (nY
SpYy 1 nZSpZz) or simply
(20) MNS 5 sNsS~rK 1 wL
Similarly the total volume of country N exports to country S issSsN (rK 1 wL) implying that trade is balanced Since bothindustries produce differentiated goods for a given sN 1 sS thevolume of bilateral trade is maximized when both countries are ofequal size (cf Helpman and Krugman [1985])
Consider next the composition of imports Because only inindustry Y will intermediate inputs ow within rm boundariesthe volume of country N intrarm imports from S is given by
26 As suggested by a referee intermediates could alternatively be valuedaccording to the supplierrsquos average revenues In such case the implicit priceswould be (1 2 f ) pY V and (1 2 f) pZ O This would reduce the value of tradeows with a disproportionate reduction in industry Y As a result the linkbetween factor endowments and the volume of trade established in Proposition 2below would be attenuated
1398 QUARTERLY JOURNAL OF ECONOMICS
Mi2 fN S 5 sNnY
SpYy Plugging the equilibrium value for nYS and
rearranging it is possible to express intrarm imports as
(21) Mi2fNS 5 sNsS~rK 1 wL
~1 2 bZ~1 2 sL~KSLS 2 bZsL~KL
~bY 2 bZ~~1 2 sL~KSLS 1 sL~KL
Intrarm imports are increasing in the size of both the importingand exporting countries and from simple differentiation of (21)are also increasing in the capital-labor ratio of the exportingcountry
LEMMA 1 For any pair of countries N S [ J with S THORN N thevolume of N rsquos intrarm imports from S M i2 f
N S is for a givensize sN of the importing country an increasing function of thecapital-labor ratio KS LS and the size sS of the exportingcountry Furthermore for a given KS LS and sS Si2 f
N S is alsoincreasing in the size sN of the importing country
Figure VI depicts combinations of factor endowments thatyield the same volume of intrarm imports M i2 f
N S for the case in
1399FIRMS CONTRACTS AND TRADE STRUCTURE
which there are only two countries N and S The arrows in thegraph point in the direction of increasing intrarm imports PointC is such that iONC i 5 iCOS i implying that the line BB9contains all points for which sN 5 sS The graph shows how for agiven capital-labor ratio of the exporting South Mi2 f
N S is maxi-mized when the two countries are of equal size On the otherhand for a given relative size of the two countries Mi2 f
N S isincreasing in the capital-labor ratio of the exporting country
Next let Si2 fN S denote the share of intrarm imports in total
imports ie Si2 fN S [ M i2 f
N S MN S Dividing equation (21) by (20)yields
(22) Si2fNS 5
~1 2 b Z ~1 2 sL~KSLS 2 bZsL~KL
~b Y 2 bZ ~~1 2 sL~KSLS 1 sL~KL
Notice that Assumption 3 ensures that Si2 fN S [ (01) When
KS LS goes to k z KL the South only produces varieties ofintermediates in industry Z and thus Si2 f
N S goes to 0 Similarlywhen KS LS goes to k z KL the South fully specializes in indus-try Y and thus Si2 f
N S goes to 1 Furthermore simple differentia-tion of (22) reveals the following
PROPOSITION 2 For any pair of countries N S [ J with S THORN Nthe share Si2 f
N S of intrarm imports in total N rsquos imports fromS is an increasing function of the capital-labor ratio KS LS ofthe exporting country Furthermore for a given KS LS Si2 f
N S
is unaffected by the relative size of each country
The rst statement is one of the key results of the paper Ina world of international trade and specialization the pattern ofFigure II in the Introduction is a direct implication of the patternin Figure I Figure VII provides a graphical illustration of Propo-sition 2 for the case of two countries Since Si2 f
N S is uniquelydetermined by KS LS the sets of points for which Si2 f
N S is constantare simple straight lines from the origin of the South The arrowsindicate that for any relative size of each country Si2 f
N S is increas-ing in KS LS 27
27 In Antras [2003] I study the robustness of the results to alternativeassumptions on the tradability of nal goods For example I consider the case ofa probabilistic location of nal-good production Final-good varieties can betraded but each variety is produced in only one randomly chosen location If theprobability that a given nal-good variety is produced in a certain country isproportional to the size of the country but is independent of the specic variety
1400 QUARTERLY JOURNAL OF ECONOMICS
IV ECONOMETRIC EVIDENCE
In this section I use data on intrarm and total U S importsto test more formally the empirical validity of the main results ofthe paper I rst study the relationship between factor intensityand the share of intrarm imports in total imports and show thatthe clear correlation in Figure I is not driven by other omittedvariables Next I move on to the relationship between relativefactor endowments and the share of intrarm imports The linkpredicted by Proposition 2 is conrmed even when controlling forother factors that could reasonably be expected to affect thisshare Finally I analyze the determinants of the total volume ofintrarm imports and show that consistently with Lemma 1
its industry and the location of intermediate-input production the share ofintrarm imports is again given by equation (22) up to a constant factor ofproportionality
1401FIRMS CONTRACTS AND TRADE STRUCTURE
total intrarm imports are signicantly affected by both the capi-tal-labor ratio and the size of the exporting country
IVA Specication
The rst hypothesis to test is that the share of intrarmimports is higher the higher the capital intensity of the exportingindustry The model presented above actually has the stark pre-diction that the share should be 0 for industries with capitalintensity bk below a certain threshold b and 1 for industries withbk b As I illustrate in Antras [2003] however if the statisti-cian disaggregates the data into M industries following a crite-rion different from the one dictated by preferences or technologythe model can be shown to predict a smooth positive associationbetween the recorded share of intrarm imports in a given indus-try and the recorded average capital intensity in the industry28
In the econometric results below I report estimates from regres-sions of the form
(23) ln ~Si2fUSROWm 5 u1 1 u2 ln ~KLm 1 W9mu3 1 em
where (Si2 fU S R O W )m is industry m rsquos share of intrarm imports in
total U S imports from the rest of the world (KL)m is theaverage capital-labor ratio in the industry Wm is a vector ofcontrols and em is an orthogonal error term The vector Wm isincluded to control for other possible industry-specic determi-nants of the integration decision Since I observe the share(Si2 f)m in four different years I also include industry effects inthe regressions below In light of Proposition 1 I hypothesize thatu2 0
The second hypothesis that I test is that in the cross sectionof countries the share of intrarm imports in total imports ishigher the higher the capital-labor ratio of the exporting countryEquation (22) actually provides a closed-form solution for thisrelationship Denoting the importing country by US and theexporting country by j and applying a log-linear approximationto (22) leads to the following specication29
28 As pointed out by a referee the smooth pattern in Figure I could also bethe result of idiosyncratic preferences by rms concerning the outsourcing deci-sion An explicit modeling of such rm-level heterogeneity would howevergreatly complicate the general-equilibrium analysis
29 In particular I log-linearize (22) around K jLj 5 KL and obtain
ln Si2fUS juKjLj5KL ln ~m 1
~1 2 sLsL
1 2 sL 2 bZSln
K j
Lj 2 lnKLD
1402 QUARTERLY JOURNAL OF ECONOMICS
(24) ln ~Si2fUS j 5 g1 1 g2 ln ~KjLj 1 g3 ln ~Lj 1 W9jg4 1 ej
where Si2 fU S j is the share of intrarm imports in total U S
imports from country j K jL j is the capital-labor ratio of countryj L j is population in country j W j is a vector of controls and e j isan orthogonal error term The theory predicts that g2 should bepositive In fact from the log-linearization we can derive a muchmore precise prediction ie g2 5 ~1 2 sLsL~1 2 sL 2 bZThis implies that the elasticity of the share of intrarm imports tothe capital-labor ratio should not be lower than the labor share inthe economy Furthermore from the last statement in Proposi-tion 2 we should not expect g3 to be signicantly different fromzero
The third test I conduct consists of running a regressionanalogous to (24) but with the log of total intrarm imports(instead of its share in total imports) on the left-hand side Inparticular I consider the specication
(25) ln ~Mi2fUS j 5 v1 1 v2 ln ~KjLj 1 v3 ln ~Lj 1 W9jv4 1 ej
In view of Lemma 1 both v2 and v3 should be positive Further-more it is easy to show that the model imposes the restrictionsv2 g2 and v3 5 130 In words the total volume of intrarmimports should be more responsive to the capital-labor ratio of theexporting country than its share in total imports while its elas-ticity with respect to the size of the exporting country should beone
IVB Data
The left-hand-side variables are constructed combining dataon intrarm U S imports and overall U S imports IntrarmU S imports include (i) imports shipped by overseas afliates totheir U S parents and (ii) imports shipped to U S afliates bytheir foreign parent group The series were obtained from thedirect investment data set available from the Bureau of EconomicAnalysis (BEA) website For reasons discussed in Appendix 3 Iam restricted to running equation (23) for a panel consisting of 23manufacturing industries and four years of data 1987 19891992 and 1994 As for equations (24) and (25) data availabilitylimits the analysis to a cross section of 28 countries in 1992 (see
30 A log-linear approximation of equation (21) around Kj Lj 5 KL yieldsv2 5 (1 2 sL) (1 2 bZ)(1 2 sL 2 bZ) g2 and v3 5 1 See Antras [2003] for details
1403FIRMS CONTRACTS AND TRADE STRUCTURE
Appendixes 4 and 5 for a complete list of industries and coun-tries) In the panel of industries the share of intrarm imports intotal U S imports ranges from a value slightly below 1 percentfor textiles in 1987 to around 82 percent for drugs in 1994 for anoverall average of 212 percent In the cross section of countriesthe share ranges from an almost negligible 01 percent for Egyptup to 641 percent for Switzerland for an overall average of 224percent (see Table II)
Most right-hand-side variables in the cross-industry regres-sions are taken from the NBER Manufacturing Industry Produc-tivity Database31 Capital intensity is measured as the ratio ofthe total capital stock to total employment in the correspondingexporting industry32 To control for other potential determinantsof internalization I run equation (23) including other industrycharacteristics one at a time First I allow for the possibility thatthe integration decision might be determined by the human-
31 The SIC classication used in the NBER Manufacturing Database wasconverted to BEA industry categories using a concordance table available from theBEA and is reproduced in Appendix 4
32 This presupposes that U S industry capital intensities are similar tothose in the rest of the world In a world with factor price equalization this wouldnaturally be the case In a more general setup the much weaker assumption of nofactor intensity reversals is sufcient to ensure that the same qualitative resultswould be obtained by using factor intensity data from the exporting country
TABLE IISHARE OF INTRAFIRM IMPORTS IN TOTAL U S IMPORTS (PERCENT)
by Industry (avg 1987ndash1994) by Country (1992)
DRU 655 FOO 139 CHE 641 ESP 155OCH 409 PAP 127 SGP 554 AUS 155VEH 398 FME 126 IRL 537 JPN 142ELE 373 STO 118 CAN 451 ISR 124COM 367 INS 111 NDL 422 HKG 112CHE 359 TRA 107 MEX 417 PHL 84CLE 357 PLA 91 PAN 358 ITA 81RUB 239 PRI 61 GBR 332 ARG 51AUD 238 LUM 41 DEU 319 COL 46OEL 189 OMA 26 MYS 301 OAN 46IMA 173 TEX 23 BEL 273 VEN 14BEV 151 BRA 259 CHL 13
FRA 216 IDN 13SWE 168 EGY 01
See Appendixes 4 and 5 for a list of industries and countries
1404 QUARTERLY JOURNAL OF ECONOMICS
capital intensity of the production process To the extent thatnal-good producers also contribute to their suppliersrsquo costs re-lated to the acquisition of human capital (eg by nancing train-ing programs) a model along the lines of the one developed abovewould indeed predict an effect of human-capital intensity I mea-sure human-capital intensity as the ratio of nonproduction work-ers to production workers in a given industry as reported in theNBER Manufacturing data set A similar argument could be usedto defend the inclusion of some measure of the importance of RampDand advertising in the production process RampD intensity andadvertising intensity are dened respectively as the ratio ofRampD expenditures to sales and advertising expenditures to salesand are obtained from a 1977 FTC survey33 I also control for thepossibility that the integration decision may be driven by the sizeof scale economies at the plant level as measured by averagecapital stock per establishment34 Finally the decision to inte-grate could also be related to the importance of suppliersrsquo produc-tion in the overall value chain A rough way of proxying for this isto control for the share of value added in total industry salesagain from the NBER manufacturing data set
The main right-hand-side variables in equations (24) and(25) including the capital-labor ratio of the exporting country andits total population are taken from the cross section of countryvariables for the year 1988 constructed by Hall and Jones [1999]In the present paper I have adopted the view that capital abun-dance is a crucial determinant of the amount of multinationalactivity in a given country Zhang and Markusen [2001] developa model in which the volume of foreign direct investment in agiven country is instead crucially affected by its skilled-laborabundance To control for these possible effects I include themeasure of human capital abundance reported in Hall and Jones[1999] Other authors have stressed the importance of scal andinstitutional factors in determining the attractiveness of foreigndirect investment in a given country Countries with relativelylower corporate taxes and relatively better institutional environ-ments should in principle be more prone to hosting afliates ofU S rms In the regressions below I use data on average
33 This measure has been widely used in the literature (eg Cohen andKlepper [1992] and Brainard [1997])
34 This variable was constructed combining the capital stock gures fromthe NBER data set with data on the number of establishments published by theU S Census Bureau in its County Business Patterns series
1405FIRMS CONTRACTS AND TRADE STRUCTURE
corporate tax rates from a Price Waterhouse survey as well asthe index of institutional quality for the year 1990 reported inGwartney et al [2002] Within the institutional factors I alsoattempt to distinguish between the effect of a countryrsquos degree ofopenness to FDI and that of its degree of openness to interna-tional trade Indices of openness to FDI and to trade are obtainedfrom survey data reported in the World Competitiveness Report[1992] Table III reports descriptive statistics for all variablesincluded in the regressions
IVC Results
The top panel of Table IV presents random effects estimatesof equation (23) Column I includes no controls in the regressionand is therefore the econometric analog to Figure I The coef-cient on ln (KL)m is positive and signicantly different from zeroat the 1 percent signicance level The estimated elasticity of theshare of intrarm imports with respect to the capital-labor ratioin production implies that a 1 percent increase in KL increasesthe share of intrarm imports by around 095 percent Column IIincludes human-capital intensity in the regression This leads toa reduction of the estimate of u2 which however remains highlysignicant The coefcient on ln (HL)m is positive but not sta-
TABLE IIIDESCRIPTIVE STATISTICS
Obs Mean St dev Min Max
ln (Si2 fU S R OW )m 92 2190 092 2474 2019
ln (KL)m 92 426 057 321 573ln (HL)m 92 2069 060 2178 060ln (RampDSales)m 92 2420 100 2607 2247ln (ADVSales)m 92 2427 110 2663 2224ln (Scale)m 92 163 092 006 348ln (VADSales)m 92 2066 018 2113 2032ln (Si2 f
U S j) 28 2208 144 2667 2045ln (KL)j 28 1054 086 813 1159ln (L)j 28 1603 120 1363 1816ln (HL)j 28 082 019 047 110CorpTax j 28 032 008 015 044EconFreedomj 28 636 122 419 824OpFDI 26 783 123 473 957OpTrade 26 670 122 352 867ln (Mi2 f
U S j) 28 636 264 2139 1049
1406 QUARTERLY JOURNAL OF ECONOMICS
tistically signicant In column III the ratio of RampD expendituresto sales is also included in the regression and is found to have avery signicant effect on the share of intrarm imports Theestimate of u2 in column III is lower than that implied by FigureI but it still implies that a 1 percent increase in KL should leadto a 078 percent increase in the share of intrarm imports Theinclusions of advertising intensity in column IV of the size ofeconomies of scale in column V and of value-added intensity incolumn VI do not overturn any of the qualitative results None ofthese variables seems to affect signicantly the share of intrarmimports while capital intensity and RampD intensity remain sig-nicant at the 1 percent level
Consistency of the random effects estimates requires theindustry effects to be uncorrelated with the other explanatoryvariables One might worry that the omission of some relevantindustry variables might lead to biases in the random effects
TABLE IVFACTOR INTENSITY AND THE SHARE Si2 f
US R O W
Dep var isln (Si2f
US ROW)m
Random effects regressions
I II III IV V VI
ln (KL)m 0947 0861 0780 0776 0703 0723(0187) (0190) (0160) (0162) (0249) (0253)
ln (HL)m 0369 20002 20038 20037 20081(0213) (0188) (0200) (0206) (0221)
ln (RampDSales)m 0451 0470 0452 0421(0107) (0114) (0128) (0140)
ln (ADVSales)m 0055 0059 0035(0094) (0097) (0107)
ln (Scale)m 0068 0100(0179) (0190)
ln (VADSales)m 0403(0657)
R2 050 055 072 073 073 073No of obs 92 92 92 92 92 92
Fixed effects regressions
I II III IV V VI
ln (KL)m 0599 0610 0610 0610 0943 1058(0299) (0300) (0300) (0300) (0412) (0410)
p-valueWu-Hausmantest 014 027 062 064 052 019
Standard errors in parentheses ( and ) are 10 5 and 1 percent signicance levels
1407FIRMS CONTRACTS AND TRADE STRUCTURE
estimates As a robustness check the bottom panel of Table IVreports the xed effects estimates of u2 together with the p-valueof a Wu-Hausman test for exogeneity of the industry effects35
The xed effects estimates of u2 are all signicantly different fromzero at the 5 percent signicance level Furthermore the pointestimates are not too different from their random effects counter-parts and the null hypothesis of exogeneity of the industry effectscannot be rejected at reasonable signicance levels
Table V reports OLS estimates of equation (24) for the crosssection of 28 countries The estimates in column I correspond tothe simple correlation depicted in Figure II The elasticity of theshare of intrarm imports with respect to the capital-labor ratioof the exporting country is signicantly different from zero andas predicted by the theory the point estimate of the elasticity isnecessarily higher than any plausible labor share in the worldColumn II conrms the claim in Proposition 2 that for a givenK jLj the size of the exporting country should not affect the shareSi2 f
U S j The coefcient of ln (L)j is actually negative but statisti-
35 The RampD and advertising intensity variables are purely cross-sectionaland are thus dropped in the estimation This explains that the estimates incolumns II III and IV are all identical
TABLE VFACTOR ENDOWMENTS AND THE SHARE Si2 f
US j
Dep var isln (Si2 f
U S j) I II III IV V VI
ln (K L)j 1141 1110 1244 1239 1097 1119(0289) (0299) (0427) (0415) (0501) (0399)
ln (L) j 20133 20159 20158 20142 0017(0168) (0164) (0167) (0170) (0220)
ln (HL)j 21024 20890 21273 20822(1647) (1491) (1367) (1389)
CorpTax j 20601 0068 1856(3158) (3823) (2932)
EconFreedom j 0214(0213)
OpFDI j 20384(0218)
OpTrade j 0292(0273)
R2 046 047 048 050 050 043No of obs 28 28 28 28 28 26
Robust standard errors in parentheses ( and ) are 10 5 and 1 percent signicance levels
1408 QUARTERLY JOURNAL OF ECONOMICS
cally indistinguishable from zero Column III introduces the mea-sure of human-capital abundance in the regression Contrary towhat might have been expected (cf Zhang and Markusen [2001])the estimated coefcient on ln (HL)j is negative although againinsignicantly different from zero Conversely the effect of physi-cal-capital abundance remains signicantly positive at the 1 per-cent level As shown in column IV and V controlling for theaverage corporate tax rate and the index of institutional qualitydoes not overturn the results The coefcients on both CorpTax j
and on EconFreedomj are not signicantly different from zerowhile the estimate of g2 remains signicantly positive at the 5percent level Finally column VI suggests that the insignicanceof the institutional variable in column V might be due to thecounterbalancing effects of different policies In particular theshare of intrarm trade is negatively affected by the degree ofopenness to FDI but positively (although insignicantly) affectedby the degree of openness to trade36 Overall the signicant effectof the capital-labor ratio of the exporting country on the share ofintrarm imports appears to be very robust
Table VI presents the OLS estimates of equation (25) Col-umns I and II conrm that the theoretical predictions in Lemma1 are borne out by the data Both the capital-labor ratio of theexporting country and its size seem to have a signicant positiveeffect on the volume of U S intrarm imports Consistently withthe theory the elasticity of M i2 f
U S j with respect to K jL j is esti-mated to be higher than the elasticity of Si2 f
U S j with respect toK jLj Furthermore the elasticity of Mi2 f
U S j with respect to Lj isas predicted not signicantly different from one As reported incolumns III and IV controlling for human capital abundance andfor the average corporate tax rate has a negligible effect on thecoefcients The inclusion of the institutional index in column Vleads to a substantial fall in the estimated elasticity of intrarmimports to the capital-labor ratio but the effect remains signi-cant at the 5 percent level Finally column VI includes separatemeasures of openness to FDI and openness to trade The resultsindicate that controlling for the capital-labor ratio of the export-ing country intrarm imports are negatively affected by its open-
36 Including OpFDI and OpTrade reduces the number of observation to 26since no data on these variables are available for Egypt and Panama I reran theregressions in columns I through V without these two countries and obtained verysimilar results
1409FIRMS CONTRACTS AND TRADE STRUCTURE
ness to FDI37 More importantly the effect of the capital-laborratio continues to be signicant at the 1 percent level while theeffect of size is only marginally insignicant at the 10 percentlevel
V CONCLUSIONS
This paper began by unveiling two systematic patterns in theintrarm component of international trade Traditional tradetheory is silent on the boundaries of rms Existing contributionsto the theory of the rm tend to be partial-equilibrium in scopeand have ignored the international dimensions of certain in-trarm transactions Building on two workhorse models in inter-national trade and the theory of the rm I have developed asimple model that can account for the novel facts identied in theintroduction By combining a Grossman-Hart-Moore view of the
37 This may seem puzzling but the model can shed light on this ndingRecall from footnote 18 that the attractiveness of integration is decreasing in theshare f of ex post surplus accruing to nal-good producers If a higher opennessto FDI corresponds to a larger bargaining power for foreign nal-good producersthen on this account the model is consistent with the coefcient on OpFDI beingsignicantly negative
TABLE VIFACTOR ENDOWMENTS AND THE VOLUME Mi2 f
US j
Dep var isln (Mi2 f
U S j) I II III IV V VI
ln (K L)j 2048 2192 2188 2154 1650 2096(0480) (0458) (0716) (0663) (0762) (0695)
ln (L) j 0607 0608 0614 0670 0700(0229) (0268) (0271) (0243) (0419)
ln (HL)j 0031 0953 20406 0708(3289) (3316) (2992) (3052)
CorpTax j 24135 21763 20647(5294) (5955) (5295)
EconFreedom j 0795(0443)
OpFDI j 21006(0474)
OpTrade j 0674(0560)
R2 044 052 052 053 060 049No of obs 28 28 28 28 28 26
Robust standard errors in parentheses ( and ) are 10 5 and 1 percent signicance levels
1410 QUARTERLY JOURNAL OF ECONOMICS
rm with a Helpman-Krugman view of international trade Ihave constructed a model that determines both the pattern ofinternational trade and the boundaries of rms in a uniedframework
Nevertheless much remains to be done Future empiricalinvestigations are likely to unveil new distinct features of thevolume of intrarm trade that cannot be accounted for by thesimple model developed here On the one hand the Grossman-Hart-Moore theory enhances our understanding of only a subsetof the determinants of ownership structure Holmstrom and Mil-grom [1994] have emphasized that in many situations issuesrelated to job design and the cost of measuring performance aremore relevant when choosing between inside or outside procure-ment It would be interesting to investigate the implications ofsuch a view of the rm for the volume of intrarm trade On theother hand in determining trade patterns I have resorted to avery simple trade model Future work should help us to under-stand potential channels by which technological differencestransport costs or international factor-price differences can affectthe organization and location of international production
APPENDIX 1 THE RATIONALE FOR COST SHARING
In Appendix 1 I show that Assumption 1 is sufcient toensure that nal-good producers always choose to contribute totheir suppliersrsquo capital expenditures
Consider the problem faced by an independent supplier whenthe nal-good producer decides not to contribute to variable costsIn such a case the supplier chooses Kx Y (i) and Lx Y (i) to maxi-mize (1 2 f) RY (i) 2 rKx Y (i) 2 wLx Y (i) and the nal-goodproducer simply receives fRY (i) ex post Following similar stepsas in the main text it is easy to show that ex ante prots for anal-good producer can now be expressed as
(26) pFYO 5 ~f 1 ~1 2 a~1 2 fAYS rbYw12bY
a~1 2 fD2a~12a
2 frbYw12bY
The case of an integrated supplier is completely analogous Inparticular the same expression (26) applies with f replacing fComparing equation (26) with (6) and (7) one can show thefollowing
1411FIRMS CONTRACTS AND TRADE STRUCTURE
LEMMA 2 Under Assumption 1 (ie if f 12) nal-good produc-ers will always decide to bear the cost of renting the capitalrequired to produce the intermediate input
Proof Combining equations (7) and (26) it follows that re-gardless of the level of demand AY the nal-good producer in apair of stand-alone rms will decide to incur the capital expendi-tures itself whenever
~1 2 a~1 2 bY 1 af~1 2 2bYS f
1 2 fD ab~12a
f 1 ~1 2 a~1 2 f
which holds whenever f 12 To see this dene the function
H~f 5 ~1 2 a~1 2 b 1 af~1 2 2bS f
1 2 fD abY~12a
2 f 2 ~1 2 a~1 2 f
and notice rst that H(1 2) 5 0 Next note that
H9~f 5 aS S f
1 2 fD ab~12a
2 1D 1 abS f
1 2 fD ab~12a
3 S 1 2 a~1 2 b 1 af~1 2 2b
~1 2 a~1 2 ff2 2D
The rst term is clearly positive when f 12 Furthermore since[(1 2 a(1 2 b) 1 af(1 2 2b))][(1 2 a)(1 2 f)f] increases with ait follows that [(1 2 a(1 2 b) 1 af(1 2 2b))][(1 2 a)(1 2 f)f] 22 $ 1((1 2 f)f) 2 2 0 and the second term is also positiveHence H(f) 0 for all f 12 Since f f as long as f 12 nal-good producers in integrated pairs will also decide to rentthe capital stock and hand it to the supplier QED
The intuition for this result is that the higher is f thesmaller is the fraction of the marginal return to its ex anteinvestments that the supplier receives and thus the less it willinvest in Kx Y This underinvestment will have a negative effecton the value of the relationship which is what the nal-goodproducer maximizes ex ante For a large enough f (in this case12) the detrimental effect of the underinvestment in capital islarge enough so as to make it worthwhile for the nal-goodproducer to bear the cost of renting Kx Y itself even if by doing so
1412 QUARTERLY JOURNAL OF ECONOMICS
it now exposes itself to a holdup by the supplier In other wordsfor f 12 a supplier incurring all variable costs faces a toosevere holdup problem which the nal-good producer nds opti-mal to alleviate by sharing part of the required ex anteinvestments
APPENDIX 2 PROOF OF PROPOSITION 1
The rst step of the proof consists in showing that Q9(bk) 0 for all bk [ [01]
LEMMA 3 The attractiveness of integration as measured byQ(bk) increases with the capital intensity of intermediateinput production bk Q9(bk) 0 for all bk [ [01]
Proof From simple differentiation of (8) it follows thatQ9(bk) 0 if and only if
V~bk ln S1 1da
f~1 2 daD ~2 2 a~1 2 a~1 2 fda
where V(bk) 5 (1 2 a(1 2 f ) 1 abk(1 2 2f ))(1 2 a(1 2 f) 1abk(1 2 2f)) and remember that f 5 da 1 f(1 2 da) Now noticethat if f f $ 12 then V9(bk) 0 bk [ [01] and if f f 12 then V9(bk) 0 bk [ [01] Furthermore if f 12 fthen V0(bk) 0 bk [ [01] It thus follows that V(bk) $ minV(0) V(1) Without loss of generality assume that V(1) 5 (1 2af)(1 2 a(f 1 (1 2 f)da) V(0) (the case V(1) V(0) is entirelysymmetric) We need to show that q(d) 0 for all d [ (0 1) where
q~d 5 ln S1 1da
f~1 2 daD 2~2 2 a~1 2 a~1 2 fda
~1 2 af~1 2 a~f 1 ~1 2 fda
From simple differentiation of this expression it follows thatq9(d) 0 if and only if (1 2 ar)2 2 (2 2 a)(1 2 a)(1 2 r)r 0 forsome r [ (01) But it is simple to check that this is in fact truefor all a r [ (01) and therefore q(d) q(0) 5 0 Notice thatAssumption 1 is not necessary for this result QED
Next notice that from equation (8) and the denition of f wecan write
1413FIRMS CONTRACTS AND TRADE STRUCTURE
Q~0 51 2 a~1 2 f
1 2 a~1 2 f S 1 2 f
1 2 fD a~12a
1
and Q~1 51 2 af
1 2 af Sf
fDa~12a
1
The inequalities follow from f f and the fact that (1 2 ax)xa (12 a ) is an increasing function of x for a [ (01) and x [ (01)Given Lemma 3 it thus follows that there exists a unique b [ (01)such that Q(bk) 1 for bk b Q(bk) 1 for bk b and Q(bk) 5 1for bk 5 b QED
APPENDIX 3 DATA
Appendix 3 discusses in more detail the construction of theshare of intrarm imports in total U S imports Intrarm im-ports were obtained from the ldquoFinancial and Operating Datardquo onmultinational rms downloadable from the BEA website Since inthe model ownership is associated with control I restricted thesample to majority-owned afliates As discussed in the maintext the BEA suppresses data cells in order to avoid disclosure ofindividual rm data The unsuppressed data are only available toresearchers afliated with the BEA Unfortunately one of therequirements for afliation is being a U S citizen (which I am not)
To construct intrarm imports by industry I combine datafrom foreign afliates of U S rms and U S afliates of foreignrms Intrarm imports comprise (i) imports shipped by overseasafliates to their U S parents by industry of afliate and (ii)imports shipped to U S afliates by their foreign parent groupby industry of afliate38 The sum of these two elements wasconstructed at the nest level of disaggregation available focus-ing on manufacturing industries and excluding natural-resource
38 The BEA denes a foreign parent group as consisting of (1) the foreignparent (2) any foreign person proceeding up the foreign parentrsquos ownershipchain that owns more than 50 percent of the person below it up to and includingthe ultimate benecial owner and (3) any foreign person proceeding down theownership chain(s) of each of these members that is owned more than 50 percentby the person above it
The conceptually correct disaggregation for case (ii) would have been by theindustry of the exporter (ie of the foreign parent group) Unfortunately theseseries are not available Intrarm imports of type (i) however constitute morethan two-thirds of all intrarm imports More importantly a pattern similar tothat in Figure I emerges when the analysis is restricted to intrarm imports oftype (i)
1414 QUARTERLY JOURNAL OF ECONOMICS
industries (in particular petroleum ferrous metals and nonfer-rous metals)39 I also restricted the sample to years in whichbenchmark surveys were conducted Overall I end up with 23industries and four years 1987 1989 1992 and 1994
To construct intrarm imports by country I add up (i) im-ports shipped by overseas afliates to their U S parents bycountry of origin and (ii) imports shipped to U S afliates bytheir foreign parent group by country of origin In both cases Irestrict the analysis to manufacturing industries although inthis case it was impossible to remove those transactions involvingnatural resources (this might explain why intrarm imports fromChile and Venezuela are lower than predicted in Figure II) TheBEA performs two types of manipulations to the data Apart fromsuppressing cells to avoid disclosure of data of individual compa-nies it also assigns a unique symbol to trade ows below$500000 I assign a value of $250000 to these cells40 Overall Iend up with a single cross section with 28 countries in 1992 Allthe other benchmark survey years lack at least one of the com-ponents of intrarm imports
Finally in order to compute the share of intrarm imports Iconstruct total U S imports by industry and year and then bycountry of origin using data put together by Robert Feenstra andavailable from the NBER website Import gures correspond totheir cif values Feenstrarsquos four-digit industry classication wasmatched to the 23 BEA industries using a conversion table avail-able from BEA and reproduced in Appendix 4
As pointed out by a referee a signicant portion of intrarmtrade involves nal goods that are shipped from a manufacturingplant to an overseas wholesale afliate which then distributes thegood in the foreign country Unfortunately the BEA data set doesnot distinguish between imports of intermediate inputs and im-ports of nal goods so that the latter cannot be subtracted fromintrarm imports As pointed out by the same referee howeverthis is not necessarily a problem for the empirical work as ananalogous theoretical model can also be interpreted in the contextof a supplier-distributor relationship
39 Patterns of ownership in natural-resource sectors are likely to be deter-mined by factors such as national sovereignty from which I abstract in the model
40 This is only done for two observations The results are robust to imputingalternative values between 0 and $500000
1415FIRMS CONTRACTS AND TRADE STRUCTURE
APPENDIX 4 INDUSTRY DESCRIPTION AND CLASSIFICATION
Code DescriptionCorresponding industry
SIC classication
BEV Beverages 208FOO Other food and kindred products 201ndash207 209CHE Industrial chemicals and synthetics 281 282 286DRU Drugs 283CLE Soap cleaners and toilet goods 284OCH Other chemical products 285 287 289FME Fabricated metal products 341ndash349COM Computer and ofce equipment 357IMA Other industrial machinery and
equipment351ndash356 358 359
AUD Audio video and communicationsequipment
365 366
ELE Electronic components and accessories 367OEL Other electronic and electrical
machinery361ndash364 369
TEX Textile products and apparel 221ndash229 231ndash39LUM Lumber wood furniture and xtures 241ndash49 251ndash59PAP Paper and allied products 261ndash263 265 267PRI Printing and publishing 271ndash279RUB Rubber products 301 302 305 306PLA Miscellaneous plastics products 308STO Stone clay and glass products 321ndash29VEH Motor vehicles and equipment 371TRA Other transportation equipment 372ndash376 379INS Instruments and related products 381 382 384ndash387OMA Other manufacturing 211ndash19 311ndash19 391ndash99
APPENDIX 5 COUNTRY CODES
Code Country Code Country
ARG Argentina IDN IndonesiaAUS Australia IRL IrelandBEL Belgium ISR IsraelBRA Brazil ITA ItalyCAN Canada JPN JapanCHE Switzerland OAN TaiwanCHL Chile PAN PanamaCOL Colombia PHL PhilippinesDEU Germany MEX MexicoEGY Egypt MYS MalaysiaESP Spain NDL NetherlandsFRA France SGP SingaporeGBR United Kingdom SWE SwedenHKG Hong Kong VEN Venezuela
HARVARD UNIVERSITY
1416 QUARTERLY JOURNAL OF ECONOMICS
REFERENCES
Aghion Philippe Mathias Dewatripont and Patrick Rey ldquoRenegotiation Designwith Unveriable Informationrdquo Econometrica LXII (1994) 257ndash282
Antras Pol ldquoFirms Contracts and Trade Structurerdquo PhD Thesis Massachu-setts Institute of Technology 2003
Aoki Masahiko ldquoToward an Economic Model of the Japanese Firmrdquo Journal ofEconomic Literature XXVIII (1990) 1ndash27
Baker P George and Thomas N Hubbard ldquoMake or Buy in Trucking AssetOwnership Job Design and Informationrdquo American Economic Review XCIII(2003) 551ndash572
Brainard S Lael ldquoAn Empirical Assessment of the Proximity-ConcentrationTrade-off between Multinational Sales and Traderdquo American Economic Re-view LXXXVII (1997) 520ndash544
Casson Mark Alternatives to the Multinational Enterprise (London Macmillan1979)
Caves Richard E Multinational Enterprise and Economic Analysis SecondEdition (Cambridge UK Cambridge University Press 1996)
Che Yeon-Koo and Donald B Hausch ldquoCooperative Investments and the Valueof Contractingrdquo American Economic Review LXXXIX (1999) 125ndash147
Coase Ronald H ldquoThe Nature of the Firmrdquo Economica IV (1937) 386ndash405Cohen Wesley M and Steven Klepper ldquoThe Anatomy of Industry RampD Intensity
Distributionsrdquo American Economic Review LXXXII (1992) 773ndash799Dunning John H Multinational Enterprises and the Global Economy (Cam-
bridge UK Addison Wesley Longman Inc 1993)Ethier Wilfred J ldquoThe Multinational Firmrdquo Quarterly Journal of Economics CI
(1986) 805ndash833Ethier Wilfred J and James R Markusen ldquoMultinational Firms Technology
Diffusion and Traderdquo Journal of International Economics XLI (1996) 1ndash28Grossman Sanford J and Oliver D Hart ldquoThe Costs and Benets of Ownership
A Theory of Vertical and Lateral Integrationrdquo Journal of Political EconomyXCIV (1986) 691ndash719
Grossman Gene M and Elhanan Helpman ldquoIntegration versus Outsourcing inIndustry Equilibriumrdquo Quarterly Journal of Economics CXVII (2002a) 85ndash120
Grossman Gene M and Elhanan Helpman ldquoOutsourcing in a Global EconomyrdquoNBER Working Paper No 8728 2002b
Gwartney James D with Chris Edwards Robert Lawson Walter Park andVeronique De Rugy Economic Freedom of the World 2002 Annual Report(Vancouver Canada Fraser Institute 2002)
Hall Robert E and Charles I Jones ldquoWhy Do Some Countries Produce So MuchMore Output per Worker than Othersrdquo Quarterly Journal of EconomicsCXIV (1999) 83ndash116
Hart Oliver Firms Contracts and Financial Structure (Oxford UK ClarendonPress 1995)
Hart Oliver and John Moore ldquoProperty Rights and the Nature of the FirmrdquoJournal of Political Economy XCVIII (1990) 1119ndash1158
Helpman Elhanan ldquoA Simple Theory of International Trade with MultinationalCorporationsrdquo Journal of Political Economy XCII (1984) 451ndash 471
Helpman Elhanan and Paul R Krugman Market Structure and Foreign Trade(Cambridge MA MIT Press 1985)
Holmstrom Bengt and Paul Milgrom ldquoThe Firm as an Incentive SystemrdquoAmerican Economic Review LXXXIV (1994) 972ndash991
McLaren John ldquoGlobalization and Vertical Structurerdquo American Economic Re-view XC (2000) 1239ndash1254
Markusen James R ldquoMultinationals Multi-Plant Economies and the Gainsfrom Traderdquo Journal of International Economics XVI (1984) 205ndash226
Milgrom Paul and John Roberts ldquoJohnson Controls Inc Automotive SystemsGroup The Georgetown Kentucky Plantrdquo Stanford Graduate School of Busi-ness Case S-BE-9 1993
Mundell Robert A ldquoInternational Trade and Factor Mobilityrdquo American Eco-nomic Review XLVII (1957) 321ndash335
Noldeke Georg and Klaus M Schmidt ldquoOption Contracts and Renegotiation A
1417FIRMS CONTRACTS AND TRADE STRUCTURE
Solution to the Hold-up Problemrdquo RAND Journal of Economics XXVI (1995)163ndash179
Romalis John ldquoFactor Proportions and the Structure of Commodity Traderdquomimeo Chicago Graduate School of Business 2002
Rugman Alan M Inside the Multinationals The Economics of Internal Markets(New York Columbia University Press 1981)
Tirole Jean The Theory of Industrial Organization (Cambridge MA MIT Press1988)
UNCTAD World Investment Report Promoting Linkages (New York UnitedNations 2001)
Whinston Michael D ldquoOn the Transaction Cost Determinants of Vertical Inte-grationrdquo mimeo Northwestern University 2002
Williamson Oliver E The Economic Institutions of Capitalism (New York NYFree Press 1985)
World Competitiveness Report World Economic Forum and International Insti-tute for Management Development 1992
World Trade Organization International Trade Statistics (Geneva 2001)Young S N Hood and J Hamill ldquoDecision-Making in Foreign Owned Multina-
tional Subsidiaries in the U Krdquo ILO Working Paper No 35 Geneva Inter-national Labor Ofce 1985
Zeile William J ldquoU S Intrarm Trade in Goodsrdquo Survey of Current BusinessLXXVII (1997) 23ndash38
Zhang Kevin H and James R Markusen ldquoVertical Multinationals and Host-Country Characteristicsrdquo Journal of Development Economics LIX (2001)233ndash252
1418 QUARTERLY JOURNAL OF ECONOMICS
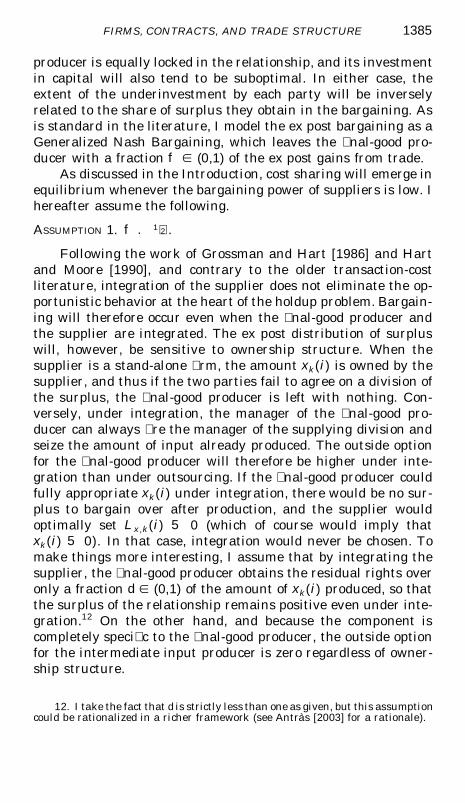
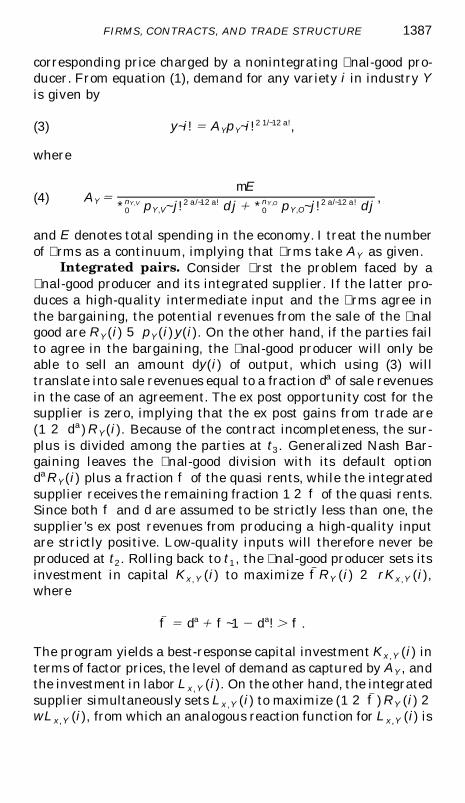
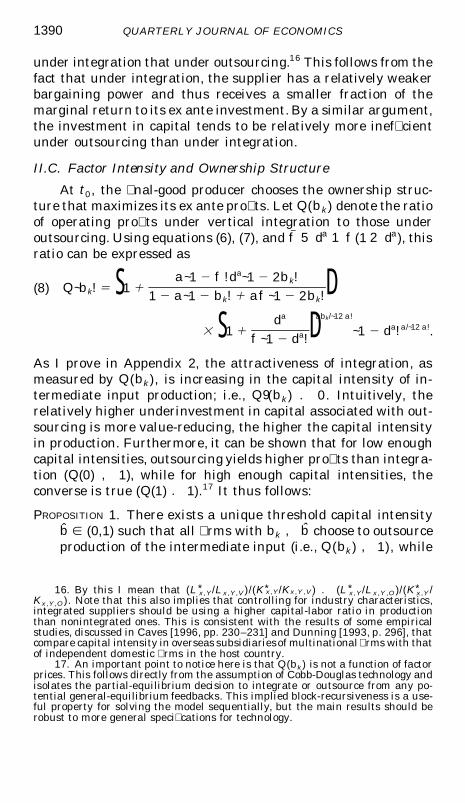
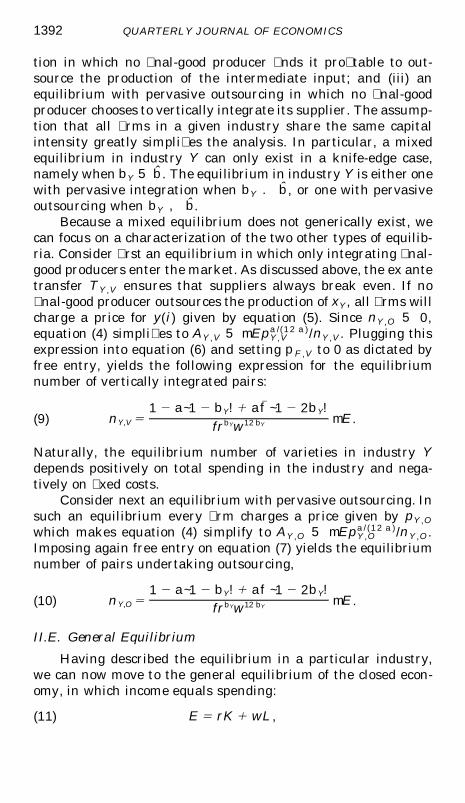
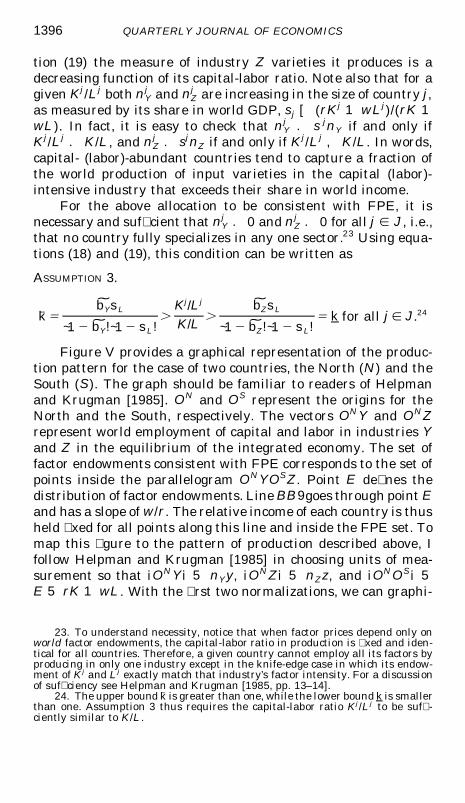
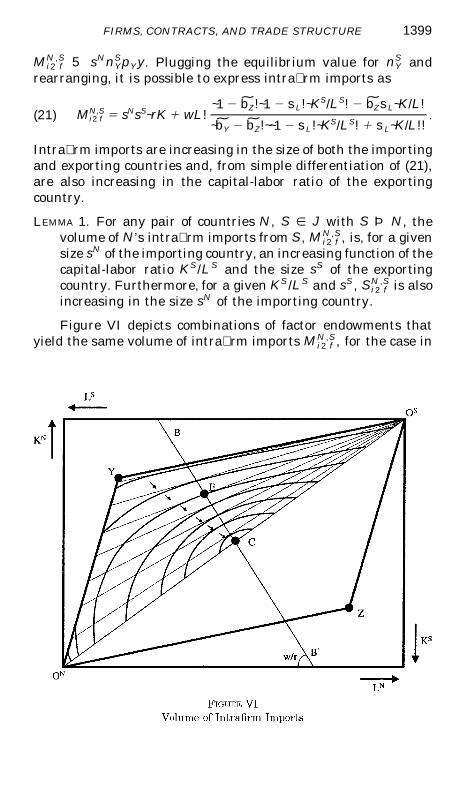