Firms as Liquidity Providers: Evidence from the 2007 … · 2 Firms as liquidity providers:...
43
1 Firms as Liquidity Providers: Evidence from the 2007-2008 Financial Crisis by Emilia Garcia-Appendini Judit Montoriol-Garriga n. 5/11 Milan, June 2011 Copyright Carefin, Università Bocconi Further research materials can be downloaded at www.carefin.unibocconi.eu
Transcript of Firms as Liquidity Providers: Evidence from the 2007 … · 2 Firms as liquidity providers:...

1
Firms as Liquidity Providers: Evidence from the 2007-2008 Financial Crisis
by Emilia Garcia-Appendini Judit Montoriol-Garriga
n. 5/11 Milan, June 2011
Copyright Carefin, Università Bocconi
Further research materials can be downloaded at
www.carefin.unibocconi.eu

2
Firms as liquidity providers: Evidence from the 2007-2008 financial crisis
Emilia Garcia-Appendinia Judit Montoriol-Garrigab
First draft: November 30, 2010 This draft: May 16, 2011
Abstract We study the effect of the 2007-2008 financial crisis on between-firm liquidity provision. Consistent with a causal effect of a negative shock to bank credit, we find that firms with high pre-crisis liquidity levels increased the trade credit extended to other corporations, while more ex-ante cash-poor firms decreased the trade credit provided. Trade credit taken by constrained firms increased during this period. These findings are consistent with firms providing liquidity insurance to their clients when bank credit is scarce and provide an important precautionary savings motive for accumulating cash reserves. JEL Classification: G01 G30 G32 Keywords: Trade credit, corporate liquidity, crisis, financial constraints, cash, lines of credit.
a Bocconi University, E-mail: [email protected] b Universitat Autònoma de Barcelona. E-mail: [email protected] Many thanks to Isaac Weingram for excellent research assistance and to CAREFIN – Bocconi Centre for Applied Research in Finance for financial support.

3
1. Introduction
In this paper we analyze how shocks to the banking sector and more broadly to
financial markets affect the intra-firm provision of trade credit, a substitute form of credit.
The hypotheses we take to the data are based on trade credit theories according to which
suppliers may provide liquidity to customers whenever they experience a liquidity shock
(Wilner (2000), Cuñat (2007)). Accordingly, when liquidity in the financial markets is
scarce firms with more financial slack are in a better position to provide liquidity
insurance through an increased amount of trade credit provided to their clients.
The supply-driven nature of the 2007-2008 crisis provides a unique opportunity to
study the role of alternative sources of financing in compensating for unavailable credit
from banks and financial markets.1 Contrary to other financial disruptions which have
their roots in the real sector, the 2007-2008 crisis is largely attributed to a reversal in the
real estate market together with a perceived lack of transparency of the investment
portfolios of financial institutions, leading to severe balance sheet problems in the
financial sector, and consequently to a lending contraction.2 The effects of this lending
contraction on demand for credit were contained prior to the bankruptcy of Lehman
Brothers in September 2008 (Almeida et al. (2010), Duchin, Ozbas, and Sensoy (2010)).
This situation allows us to test whether an exogenous and unexpected shock to the supply
of bank credit causes an increase in the amount of trade credit extended by firms, as a
function of their access to liquidity.
We explore these ideas using a differences-in-differences approach in which we
compare the trade credit supplied before and after the beginning of the crisis as a function
1 Evidence of a supply shock to credit markets abounds. Ivashina and Scharfstein (2010) document that new bank loans to large borrowers fell by 79% from Q2:2007 to Q4:2008. Similarly, the responses to the Federal Reserve’s Senior Loan Officer Opinion Survey on Bank Lending Practices indicate that banks significantly tightened credit standards on Commercial and Industrial loans in ten consecutive quarters (2007:Q3 to 2009:Q4). In addition, credit spreads widened to unprecedented levels at the onset of the crisis and remained quite elevated for an extended period of time. For example, Almeida et al. (2010) report a dramatic increase in spreads on long-term corporate bonds starting in August 2007, both for investment-grade and junk-rated high yield bonds. Similarly, the spread over the fed funds rate on commercial paper increased significantly during the recession according to data from the Federal Reserve. The drop in bank lending and the rise in spreads are indications of the credit supply shock and the tighter credit conditions faced by non-financial firms. 2 See, for example, Gorton (2009) and Acharya et al. (2009) for discussions on the causes of the crisis.

4
of firms’ liquidity positions. Our main interest is to estimate whether firms support their
clients’ needs for credit in times when other sources of external finance are scarce.
Inferences may be confounded, however, if the variation in firms’ liquidity positions as
the crisis unfolds is endogenous to unobserved motives, unrelated to inter-firm liquidity
provision, leading firms to change the proportion of trade credit offered to their clients.
We design our empirical specifications in a way that addresses this fundamental
issue. We eliminate the potential endogenous variation in the firms’ liquidity positions by
measuring these variables a year before the start of the crisis. We then regress firm-level
quarterly measures of trade credit offered by firms on an indicator variable for whether
the quarter in question is after the onset of the crisis, and on the interaction of this crisis
indicator with the firm’s liquidity position as measured the year previous to the start of
the crisis. We control for firm fixed effects and time-varying firm characteristics that
affect the supply for trade credit. To further address endogeneity concerns, we measure
firms’ financial positions as much as three years prior to the onset of the crisis, and
confirm that similar results do not follow the negative demand shock caused by
September 11, 2001. Thus, our framework is similar to an instrumental variables
approach in which the identifying assumption is that the financial positions previous to
the crisis are not positively correlated with unobserved firm-specific demand shocks
following the onset of the crisis. To further strengthen identification, we focus our
empirical analysis on the first stage of the financial crisis (roughly from July 2007 to June
2008), where the supply effects dominate.
Our main measure of a firm’s liquidity position is cash reserves scaled by total
assets. We also take into consideration cash in excess of the optimal holdings, as in Opler
et al. (1999) and Dittmar and Mahrt-Smith (2007). For a subsample of firms we use
additional measures of liquidity based on a firm’s access to bank lines of credit as
reported in the 10-k statements filed by the SEC. Lines of credit are used by a vast
majority of publicly traded firms (Sufi (2009), Demiroglu et al. (2009)) and are
instrumental for corporate liquidity (Shockley and Thakor (1997), Flannery and Lockhart
(2009), Lins et al. (2010)). Because cash and lines of credit are imperfect substitutes we
construct a liquidity measure which adds the unused portion on all lines of credit to the
cash stock available (Ippolito and Perez (2011)).
5
Consistent with an overall credit contraction, we document a decline in trade
credit provision by non-financial firms during the financial crisis. However, firms with
high liquidity holdings before the crisis increase the amount of trade credit offered to
their clients during the crisis. On the other hand, firms that had low cash reserves and
were more exposed to the financial crisis reduced considerably the trade credit provided.
The increase in accounts receivable by the most liquid firms is consistent with a supply-
side effect in which suppliers that are able use their extra liquidity to support their clients
during the credit crunch. These findings provide support for the aforementioned theories
proposing suppliers as liquidity providers (Cuñat (2007), Wilner (2000)). Empirically,
Petersen and Rajan (1997) and Burkart, Ellingsen and Giannetti (2010) have found
evidence consistent with these theories. Our findings complement theirs with two
important contributions. First, we provide a clean identification of the causal link
between the unexpected negative credit supply shock and the increase in trade credit
provided by suppliers with more liquidity slack before the crisis. Second, we analyze a
period of aggregate liquidity shortage instead of idiosyncratic liquidity shocks. In this
sense, our paper is closely related to Love, Preve and Sarria-Allende (2007) who focus on
the impact of financial crises on trade credit flows using firm-level data from several
currency crises in emerging economies.
We extend our analysis in several directions. First, we explore which types of
firms are better positioned to provide liquidity to their clients. Through a subsample
analysis we find that firms that are less constrained, as well as firms that are growing the
most, are more likely to offer trade credit to their clients. These results are consistent with
theories claiming that trade credit is often used as a tool to boost sales (Fisman and Raturi
(2004), Fabbri and Klapper (2008)).
We next follow Rajan and Zingales (1998) and construct industry-level measures
of dependence on external finance to explore whether there are heterogeneous industry
effects. Results show that only firms in industries with low dependence on external
finance are able to provide additional liquidity to their clients. This finding suggests that
firms that rely strongly on the affected financial sector for liquidity are unable to pass on
their scarce liquidity to their clients, and supports our interpretation of a causal effect of
the supply shock. We analyze this idea further by exploring whether firms used their lines

6
of credit to increase the trade credit provided to their clients. For this, we collect
information about the use of lines of credit from the 10-k reports filed to the SEC for a
subsample of firms. We find that internal resources are a more important determinant of
trade credit provision during the financial crisis than external liquidity available in lines
of credit. As a final extension of our results, we examine which types of firms receive
more trade credit during the crisis. We find that financially constrained firms benefited
the most from the increased supply of trade credit by the most liquid firms.
Our findings support the redistribution theory of trade credit, which posits that
firms with better access to capital will redistribute the credit they receive to less
advantaged firms via trade credit (Meltzer (1960), Petersen and Rajan (1997)). Research
by Calomiris, Himmelberg and Wachtel (1996) and Nilsen (2002) showed that during
downturns, liquidity in the form of trade credit flows from firms having access to the
markets for commercial paper or long-term debt to firms without access to these financial
instruments. Our results show how in an extreme scenario of scarce bank credit and
illiquidity in financial markets, firms with internal resources are better able to provide
trade credit to their clients. This finding is fully consistent with Love, Preve and Sarria-
Allende (2007) who show that during severe crisis there is little redistribution. Our results
also indicate that firms with better access to bank credit through pre-existing
commitments do not seem to be using their lines of credit to increase the amount of trade
credit provided.
Our results also contribute to the large and growing literature on the causes and
effects of the 2007-2008 financial crises (see for example Gorton (2009), Acharya et al.
(2009), or Brunnermeier (2009)). Our paper fits within a smaller set of papers which
study the effects of the crisis on financial policies of non-financial corporations. The
general result of this literature is that the credit supply shock has an economically
significant impact on corporations. Tong and Wei (2008), for example, find that stock
price declines were steeper for firms that were more constrained. Similarly, Campello,
Graham, and Harvey (2010) and Almeida et al. (2010) find that constrained firms, or
firms vulnerable to refinancing at the peak of the financial crisis, reduce investment
spending and bypass attractive investment opportunities. Ivashina and Sharfstein (2010)
show that firms draw down credit lines during the crisis, and face difficulties in renewing

7
the lines. Kahle and Stultz (2010) find that firms change their financial policies
significantly following the onset of the crisis. Our paper complements this literature by
identifying another, to our knowledge still unexplored channel through which firms may
partially offset the negative effects of the credit crunch. It highlights the importance to
look at other debt instruments, even if informal and not institutionalized like trade credit,
to obtain a complete picture of the potential effects of a credit crunch for the real
economy. Our results are consistent with Duchin et al. (2010) who find firms with high
liquidity holdings do not seem to reduce investment. We show that more liquid firms do
not reduce trade credit provision to their clients.
Finally, our paper is also related to research on corporate cash holdings. Under the
precautionary saving theory introduced by Keynes (1936), firms hold cash to protect
themselves against adverse shocks.3 Our paper provides further evidence on the
precautionary benefits of holding cash when credit tightens and firms are financially
constrained or highly dependent on external finance.
The remainder of the paper is organized as follows: In Section 2 we discuss the
data collection process. In Section 3 we explain our empirical strategy. Section 4 presents
the baseline findings and some robustness checks. Finally, we conclude in Section 5.
2. Data
The data are from Standard and Poor’s Compustat quarterly database of publicly
traded firms between the third quarter of year 2005 and the second quarter of 2009. We
use all observations except for firms with negative total assets (atq), negative sales
(saleq), negative cash and marketable securities (cheq), cash and marketable securities
greater than total assets, and firms not incorporated in the U.S. We also eliminate all
financial firms (firms with SIC codes between 6000 and 6999), utilities (firms with SIC
codes between 4900 and 4949), and not-for-profit organizations and government
enterprises (SIC codes greater than 8000).
3 There is a large literature consistent with this theory. See for example Opler, Pinkowitz, Stulz and Williamson (1999), Almeida, Campello and Weisback (2004), Faulkender and Wang (2006) and Acharya, Almeida and Campello (2007).
8
As is the standard practice in recent related literature, our data selection criteria
approach follows that of Almeida, Campello, and Weisbach (2004). We exclude from the
raw data those firms with market capitalization less than $50 million or whose book value
of assets is less than $10 million, and those displaying asset or sales growth exceeding
100%. These filters eliminate the smallest firms which have volatile accounting data and
firms that have undergone mergers or other significant restructuring. Finally, as we are
interested in studying the effects of firm liquidity on amounts of trade credit offered, we
limit the sample to firms with non-missing values of accounts receivable (rectq). The
resulting sample consists of 31,919 firm-quarters, corresponding to information on 2,249
firms. Table A.1 of the appendix shows summary statistics for some of the key variables
in our analysis.
We define the beginning of the financial crisis as July 1, 2007, which is
conservative as most studies date the beginning of the crisis during August 2007 (see
Duchin et al. 2010). In order to average out any seasonal effects of the data, in our
analyses we consider full years of information; thus, our sample starts in the quarter
starting on July 1, 2005 and ends in June 30, 2008. As validity checks of the sensitivity of
our results to the choice of our sample, in Section 4.6 we repeat the main estimations on
two more samples: from July 1, 2004 to June 30, 2008 and from July 1, 2006 to June 30,
2008. We center most of our analysis on the first year of the crisis (July 1, 2007– June 30,
2008), when the crisis was mainly financial, because we are interested in studying the
effects of the lower supply of credit. As an extension, we examine in Section 4.7 how the
inter-firm financing dynamics change when we consider the following crisis year (from
July 1, 2008 to June 30, 2009) with a caveat. During this later period, the financial crisis
spilled over to the real sector and our results could be contaminated by the consequent
demand effects.
We manually gather data on the use of lines of credit from the Securities and
Exchange Commissions’s 10-k annual filings for a sub-sample of the above firms. We
closely follow Sufi (2009) for the construction of this sub-sample. We first limit the data
to firms that have no missing values for the following core financial variables: cash
(cheq), total assets (atq), property, plant and equipment (ppentq), long-term debt (dlltq),

9
preferred stock liquidating value (pstklq), total sales (saleq), EBITDA (oibdpq), common
shares outstanding (cshoq), short-term debt (dlcq), deferred taxes (txdcy),4 retained
earnings (req), cost of goods sold (cogsq), convertible debt (dcvtq), total liabilities (ltq),
and notes payable (npq). We also restrict our sampling framework to those firms with a
book leverage ratio between 0 and 1 ((dlcq+dlltq)/(atq-ltq-pstklq+txdcq)). Finally,
because of our interest in trade credit, additionally to the above restrictions imposed by
Sufi (2009), we also limit the data to firms having non-missing values for the following
ratios: accounts receivable (recq) divided by sales, and accounts payable (apq) divided by
the cost of goods sold. We select 100 firms of the resulting sample by first determining
the firms that are both in our dataset and Sufi’s dataset (2009) of which there are 121.5
We randomly select 80 of these firms for inclusion in the sub-sample. By extending
Sufi’s dataset, we can construct an even longer panel for those firms with line of credit
data. This allows us to compare results from the Great Recession with results from the
2001 demand shock. However, this creates a selection bias towards older firms. To
compensate for this selection bias, we randomly select 20 additional firms from our full
sample that did not appear in the Compustat database until 2000. We perform parametric
and non-parametric tests of difference in means for the full Compustat universe vs the
augmented sub-sample containing information on the use of lines of credit (untabulated
due to space constraints), and find that our augmented sample is more similar to the
Compustat universe than the sample based only on Sufi’s original data.
For the small sub-sample of firms we collect data from the ‘‘Liquidity and capital
resources’’ sections of firms’ annual 10-k reports on the number of lines of credit, the
credit limits of each of those lines, and any outstanding balances.6 We winsorize all
variables (both for the whole sample and for the smaller sub-sample of firms with 10-k
data) at the 1 and 99% levels.
4 We convert all year-to-date variables as txdcy to quarterly data, by subtracting the previous values in quarters 2, 3, and 4. 5 We thank Amir Sufi for making these data available in his website. 6 We match the annual data on lines of credit to our quarterly dataset from Compustat assuming that the data is constant throughout the quarters of the fiscal year.

10
3. Empirical strategy
To analyze the impact of the financial crisis on the inter-firm provision of
liquidity, we employ a differences-in-differences approach in which we compare the
trade credit supplied by firms before and after the start of the crisis as a function of their
liquidity positions. Specifically, we regress the ratio of accounts receivable to sales on
measures of internal liquidity. We control in all regressions for firm fixed effects and for
several time-varying observable firm characteristics that may affect the amounts of trade
credit offered.
Our main interest is to estimate whether firms are ready to support their clients’
needs for credit in times when other sources of external finance are scarce. Inferences
may be confounded, however, if the variation in firms’ liquidity positions as the crisis
unfolds is endogenous to unobserved motives, unrelated to inter-firm liquidity provision,
leading firms to change the proportion of trade credit offered to their clients.
We design our basic specifications in a way that addresses this fundamental issue.
We eliminate the potential endogenous variation in the firms’ liquidity positions by
measuring these variables during the year previous to the start of the crisis. We then
regress firm-level quarterly measures of trade credit offered by firms on an indicator
variable for whether the quarter in question is after the onset of the crisis, and on the
interaction of this indicator variable with the firm’s financial position as measured the
year previous to the start of the crisis. We control for firm fixed effects and time- varying
firm characteristics such as investment opportunities. The firm fixed effects subsume the
level effect of the financial position of the firms (because the financial position is only
measured once per firm), and control for all sources, observed and unobserved, of time-
invariant cross-sectional differences in firm behavior.
Thus, our framework is similar to an instrumental variables approach in which the
identifying assumption is that the financial positions previous to the crisis are not
positively correlated with unobserved firm-specific demand shocks following the onset of
the crisis. Our identification strategy is similar to Duchin et al. (2010). More specifically,
our identification condition requires that the ex-ante liquidity position of a given firm is
11
uncorrelated with changes in demand for credit experienced by its clients during the
crisis.
Our basic specification can be written as follows:
ititttitiit XCRISISLIQCRISISAR 13*,21 (1)
In the above equation, itAR refers to the total amount of accounts receivable
divided by sales. By scaling this measure by the flow variable sales, we control for the
reduction in economic activity that is commonly associated with crises.
Consistent with our interest in the effect of the drop in the supply of corporate
credit, the indicator variable tCRISIS takes the value of one during the financial phase of
the crisis, specifically from July 1, 2007 to June 30, 2008. We also consider how our
results extend through June 2009, by including in equation (1) an additional indicator
variable taking a one from July 1, 2008 through June 30, 2009, and its interaction with
*itLIQ . During the latter period the demand-side effects of the crisis increased
considerably, making identification much less clear-cut. Hence, our focus shall lie on the
coefficients for tCRISIS and its interaction with the liquidity position of the firm, *itLIQ .
Our main measure for access to liquidity before the crisis, *itLIQ , is given by the
firms’ cash reserves, scaled by total assets. Because firms hold cash to support the day-to-
day operations, we also consider the excess cash holdings of the firms, defined as the
difference between the actual cash holdings and the “optimal” cash holdings. We follow
research by Opler et al. (1999) and Dittmar and Mahr-Smith (2007) and define excess
cash as the difference between actual and predicted cash in the following model:
it
itit
itititititoit
DummiesYear
DummyDIVVolatilityCFDEBT
CAPXCFNWCSIZEBMcash
_
__
)/()ln(
876
54321
(2)
To complement our results, we also consider the access that firms have to lines of credit
(LOC), using the sub-sample of firms for which we gathered this information from the
10-k SEC filings. For this analysis, we consider access to LOC, amount of LOC, and
undrawn balances on LOC as additional measures of liquidity. Because cash and lines of
12
credit are imperfect substitutes (Sufi (2009), Flannery and Lockhart (2009), Lins et al.
(2010)), we also construct a liquidity measure that adds to the unused portion on all lines
of credit to a given firm the cash stock available before the crisis. We measure all
liquidity variables at *t the end of the second quarter of year 2006, i.e. one year
previous to the financial crisis to reduce concerns that the variation in firms’ liquidity
positions as the crisis unfolds is endogenous to unobserved motives, unrelated to inter-
firm liquidity provision, that also lead to changes in the ratio of accounts receivable to
sales.
In our models we include controls accounting for the supply of trade credit, 1itX .
Vector itX includes size, age, sales growth, net profit margin, total debt, tangible assets
and net worth (see Petersen and Rajan (1997), Burkart, Ellingsen and Giannetti (2010)).
We scale our liquidity measures, tangible assets, net worth, and cash flow, tangible
assets, current assets, and total debt by total assets.
We perform several robustness checks for our base results. These include (i)
scaling our right-hand side variables by assets net of account receivables and by assets
net of cash, instead of by total assets, to eliminate a mechanical correlation existing
between the numerator of the dependent variable and the denominator of the independent
variables; (ii) showing that our results continue to hold when we measure liquidity up to
12 quarters before the crisis; (iii) using several different estimation samples; and (iv)
showing that we do not obtain similar results as a consequence of the demand shock
spurred by the events of September 11, 2001.
4. Results
4.1. Baseline results
Table 1 presents the first set of estimates from our base specifications described in
equation (1) above. In order to establish the basic patterns in the data, in columns 1 and 2
we estimate two modified versions of our basic specification which include only the crisis
dummy (column 1), or the crisis dummy and all firm controls except for the liquidity
13
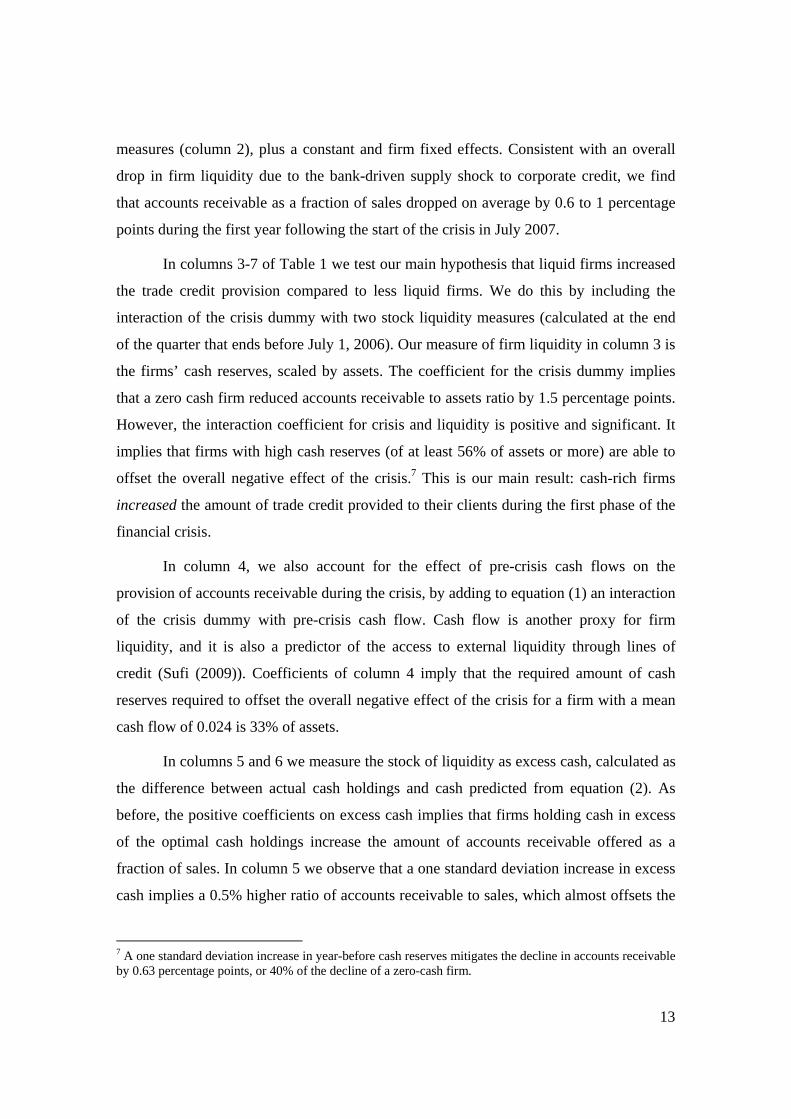
measures (column 2), plus a constant and firm fixed effects. Consistent with an overall
drop in firm liquidity due to the bank-driven supply shock to corporate credit, we find
that accounts receivable as a fraction of sales dropped on average by 0.6 to 1 percentage
points during the first year following the start of the crisis in July 2007.
In columns 3-7 of Table 1 we test our main hypothesis that liquid firms increased
the trade credit provision compared to less liquid firms. We do this by including the
interaction of the crisis dummy with two stock liquidity measures (calculated at the end
of the quarter that ends before July 1, 2006). Our measure of firm liquidity in column 3 is
the firms’ cash reserves, scaled by assets. The coefficient for the crisis dummy implies
that a zero cash firm reduced accounts receivable to assets ratio by 1.5 percentage points.
However, the interaction coefficient for crisis and liquidity is positive and significant. It
implies that firms with high cash reserves (of at least 56% of assets or more) are able to
offset the overall negative effect of the crisis.7 This is our main result: cash-rich firms
increased the amount of trade credit provided to their clients during the first phase of the
financial crisis.
In column 4, we also account for the effect of pre-crisis cash flows on the
provision of accounts receivable during the crisis, by adding to equation (1) an interaction
of the crisis dummy with pre-crisis cash flow. Cash flow is another proxy for firm
liquidity, and it is also a predictor of the access to external liquidity through lines of
credit (Sufi (2009)). Coefficients of column 4 imply that the required amount of cash
reserves required to offset the overall negative effect of the crisis for a firm with a mean
cash flow of 0.024 is 33% of assets.
In columns 5 and 6 we measure the stock of liquidity as excess cash, calculated as
the difference between actual cash holdings and cash predicted from equation (2). As
before, the positive coefficients on excess cash implies that firms holding cash in excess
of the optimal cash holdings increase the amount of accounts receivable offered as a
fraction of sales. In column 5 we observe that a one standard deviation increase in excess
cash implies a 0.5% higher ratio of accounts receivable to sales, which almost offsets the
7 A one standard deviation increase in year-before cash reserves mitigates the decline in accounts receivable by 0.63 percentage points, or 40% of the decline of a zero-cash firm.
14
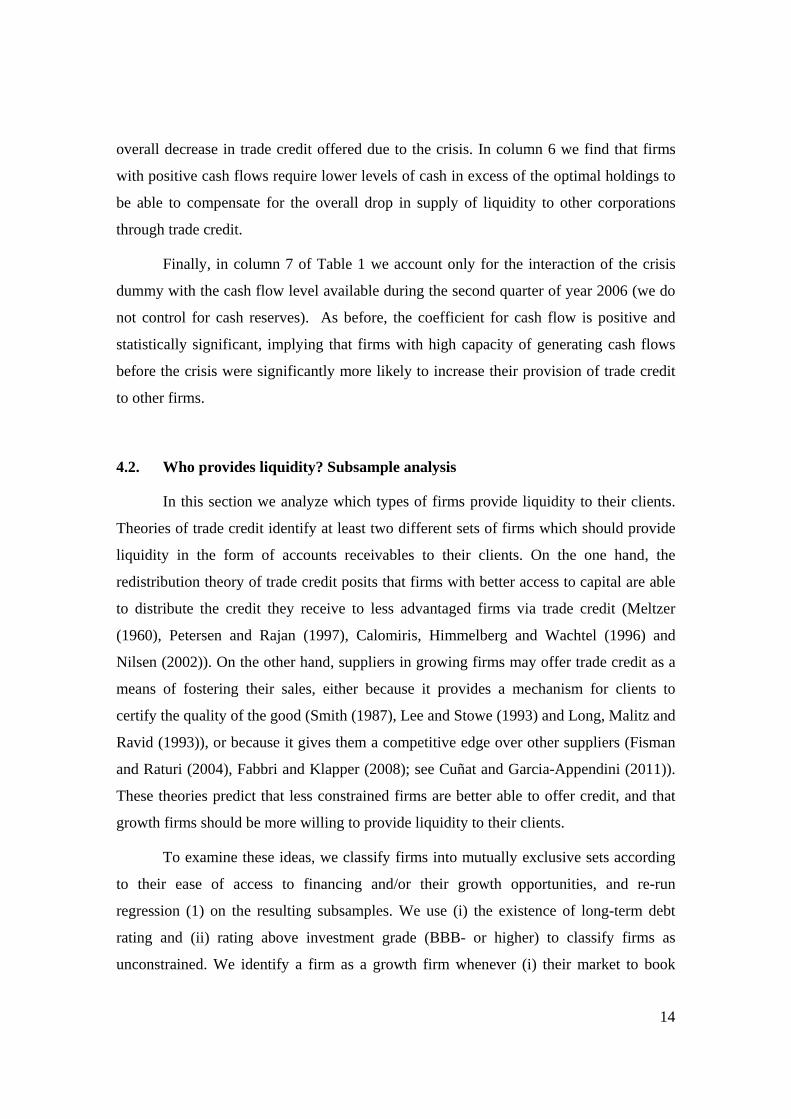
overall decrease in trade credit offered due to the crisis. In column 6 we find that firms
with positive cash flows require lower levels of cash in excess of the optimal holdings to
be able to compensate for the overall drop in supply of liquidity to other corporations
through trade credit.
Finally, in column 7 of Table 1 we account only for the interaction of the crisis
dummy with the cash flow level available during the second quarter of year 2006 (we do
not control for cash reserves). As before, the coefficient for cash flow is positive and
statistically significant, implying that firms with high capacity of generating cash flows
before the crisis were significantly more likely to increase their provision of trade credit
to other firms.
4.2. Who provides liquidity? Subsample analysis
In this section we analyze which types of firms provide liquidity to their clients.
Theories of trade credit identify at least two different sets of firms which should provide
liquidity in the form of accounts receivables to their clients. On the one hand, the
redistribution theory of trade credit posits that firms with better access to capital are able
to distribute the credit they receive to less advantaged firms via trade credit (Meltzer
(1960), Petersen and Rajan (1997), Calomiris, Himmelberg and Wachtel (1996) and
Nilsen (2002)). On the other hand, suppliers in growing firms may offer trade credit as a
means of fostering their sales, either because it provides a mechanism for clients to
certify the quality of the good (Smith (1987), Lee and Stowe (1993) and Long, Malitz and
Ravid (1993)), or because it gives them a competitive edge over other suppliers (Fisman
and Raturi (2004), Fabbri and Klapper (2008); see Cuñat and Garcia-Appendini (2011)).
These theories predict that less constrained firms are better able to offer credit, and that
growth firms should be more willing to provide liquidity to their clients.
To examine these ideas, we classify firms into mutually exclusive sets according
to their ease of access to financing and/or their growth opportunities, and re-run
regression (1) on the resulting subsamples. We use (i) the existence of long-term debt
rating and (ii) rating above investment grade (BBB- or higher) to classify firms as
unconstrained. We identify a firm as a growth firm whenever (i) their market to book

15
ratio is higher than the median, (ii) their assets grow more than the median, or (iii) they
have non-negative income before extraordinary items (ibcy0).8,9
Results of regressing equation (1) on subsamples of firms classified according to
their access to external financing or growth opportunities are in Table 2. The first four
columns contain coefficients estimated for firms with different degrees of credit
constraints. Consistently with the redistribution theory of trade credit, we find that less
constrained firms are more likely to increase their supply of trade credit during the crisis.
The coefficients for the interaction of cash with the crisis dummies are more than five
times as large (and statistically significant) for the rated or investment grade firms than
for firms that do not have a credit rating for debt, or are rated below BBB-. Similarly, in
untabulated results where we also control for pre-crisis cash flows, we find that only the
less constrained firms are likely to provide liquidity out of their cash flows. These results
suggest that less constrained firms are better suited to provide liquidity to their clients.
We next analyze whether growth firms provide more liquidity out of their cash
reserves to their clients. Columns 6 to 10 of Table 2 contain regressions of equation (1)
estimated on subsamples according to the growth opportunities of the firms. We find that
firms with higher pre-crisis growth opportunities are more likely to use their cash
reserves to provide liquidity to their clients: the interaction coefficient for cash with the
crisis dummy is either negative or not significantly different from zero on the subsample
of firms with lower growth rates, but is positive and highly significant for growth firms
for our three measures of growth. This is consistent with trade credit being used as a tool
to foster sales.
4.3. External finance dependence
In Table 3 we analyze inter-firm liquidity provision as a function of the need for
external finance. We follow Rajan and Zingales (1998) and Cetorelli and Strahan (2006) 8 To classify firms according to the medians of their market to book value, sales growth, and profitability, we consider the distributions of these variables as of the second quarter of year 2006. 9 Other usual proxies for the ease of access to finance are size, age, or indices of constraints such as the Kaplan-Zingales or the Whited-Wu indices. We exclude these from the subsample analysis as all these variables also proxy for growth opportunities, and consequently their effect on trade credit offered is ambiguous.

16
and define external finance dependence according to the industrial sector of the firm.
External financial dependence (EFD from now on) is defined as the proportion of capital
expenditures in excess of cash flows.10 A positive EFD means that the cash flow
generated by the firm is not sufficient to cover the capital expenditures, and therefore, the
firm has to issue debt or equity to finance investments. A negative EFD value indicates
that firms have free cash, and therefore less need for external financing. The main
advantage of using EFD measure is that it is defined at the industry sector level as
opposed to the firm level, which is less endogenous. Rajan and Zingales (1998) point out
to technological reasons for why some industries depend more on external finance than
others: “To the extent that the initial project scale, the gestation period, the cash harvest
period, and the requirement for continuing investment differ substantially between
industries, this is indeed plausible.”
In column 1, we interact the resulting continuous EFD measure with the indicator
variable for the crisis, to explore whether inter-firm liquidity provision is smaller among
firms that have higher external financial dependence. Consistent with the crisis being
rooted in the financial sector, we find that firms with more need of external financing
decreased trade credit liquidity provision significantly more than the firms that depend
less on external finance. For ease of interpretation, we construct two dummy variables
from this continuous measure of external dependence. Industries with low (high) external
financial dependence are industries with negative (positive) EFD. In column 2, we
interact the High EFD dummy with the crisis variable, and find a negative and significant
coefficient. During the financial crisis, firms in industries with high EFD decreased the
provision of trade credit by an additional 1.1 percentage point compared to firms in low
EFD industries.
In Columns 3 and 4, we further interact our liquidity measures (cash and excess
cash, respectively) with the dummies for high and low external finance dependence, and
the dummy for the crisis period. This is a triple-difference methodology that allows us to 10 We use Compustat firms between the years 1980 and 1996 and use firms that have been on Compustat for at least 10 years. The reason for this choice is to capture firms’ demand for credit and not the amount of credit supplied to them. We sum across all years each firm’s total capital expenditures minus cash flows from operations and then divide it by total capital expenditures. Next, we aggregate the firm-level ratios of external financial dependence using the median value for all firms in each two-digit Standard Industrial Classification (SIC) category. The EDF measure is assumed to be constant over time.
17
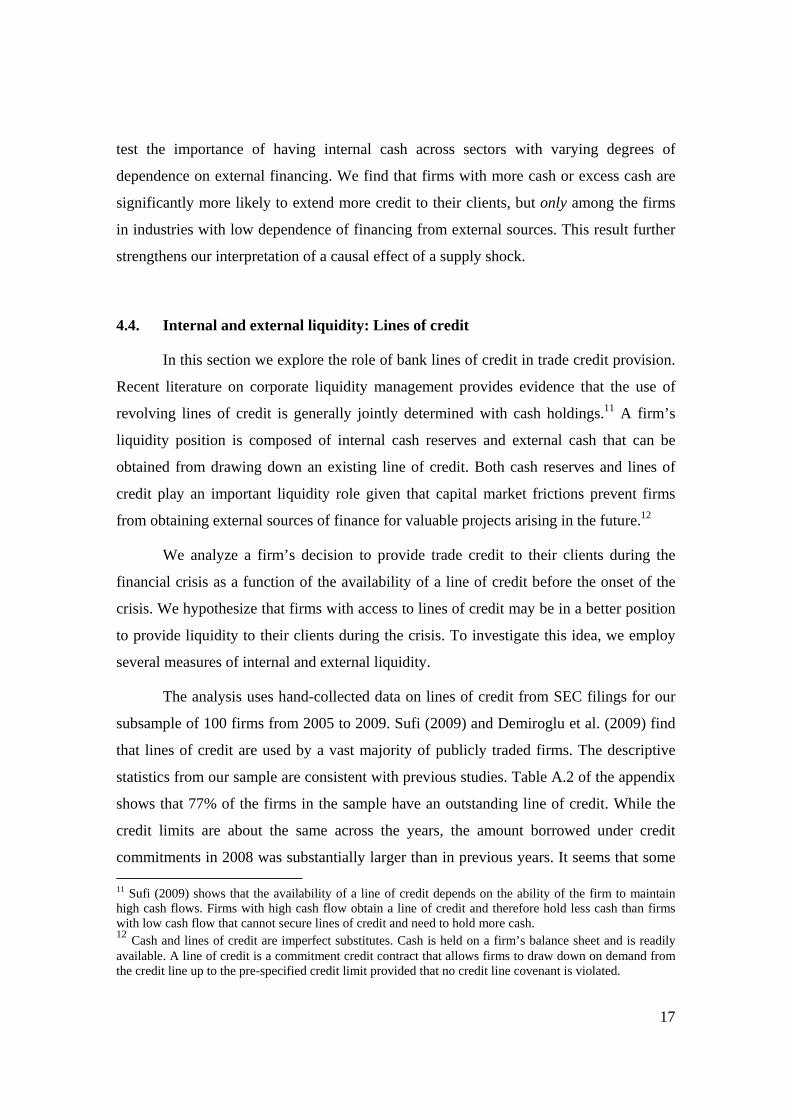
test the importance of having internal cash across sectors with varying degrees of
dependence on external financing. We find that firms with more cash or excess cash are
significantly more likely to extend more credit to their clients, but only among the firms
in industries with low dependence of financing from external sources. This result further
strengthens our interpretation of a causal effect of a supply shock.
4.4. Internal and external liquidity: Lines of credit
In this section we explore the role of bank lines of credit in trade credit provision.
Recent literature on corporate liquidity management provides evidence that the use of
revolving lines of credit is generally jointly determined with cash holdings.11 A firm’s
liquidity position is composed of internal cash reserves and external cash that can be
obtained from drawing down an existing line of credit. Both cash reserves and lines of
credit play an important liquidity role given that capital market frictions prevent firms
from obtaining external sources of finance for valuable projects arising in the future.12
We analyze a firm’s decision to provide trade credit to their clients during the
financial crisis as a function of the availability of a line of credit before the onset of the
crisis. We hypothesize that firms with access to lines of credit may be in a better position
to provide liquidity to their clients during the crisis. To investigate this idea, we employ
several measures of internal and external liquidity.
The analysis uses hand-collected data on lines of credit from SEC filings for our
subsample of 100 firms from 2005 to 2009. Sufi (2009) and Demiroglu et al. (2009) find
that lines of credit are used by a vast majority of publicly traded firms. The descriptive
statistics from our sample are consistent with previous studies. Table A.2 of the appendix
shows that 77% of the firms in the sample have an outstanding line of credit. While the
credit limits are about the same across the years, the amount borrowed under credit
commitments in 2008 was substantially larger than in previous years. It seems that some 11 Sufi (2009) shows that the availability of a line of credit depends on the ability of the firm to maintain high cash flows. Firms with high cash flow obtain a line of credit and therefore hold less cash than firms with low cash flow that cannot secure lines of credit and need to hold more cash. 12 Cash and lines of credit are imperfect substitutes. Cash is held on a firm’s balance sheet and is readily available. A line of credit is a commitment credit contract that allows firms to draw down on demand from the credit line up to the pre-specified credit limit provided that no credit line covenant is violated.

18
of the cash drawn-down under the lines of credit in 2008 is being returned to the banks by
the end of 2009.
We explore whether firms used their existing credit lines to increase the trade
credit provided to their clients. Given the substitutability of lines of credit and cash, we
use measures of internal and external liquidity in our specifications. We employ the same
empirical strategy described above, that is, we measure a firm’s internal and external
liquidity position a year before the onset of the crisis in order to avoid concerns of
potential endogeneity. We use three measures of external liquidity: (1) LOC dummy
which is equal to one for firms with a line of credit and zero otherwise, (2) LOC limit
which is equal to the sum of the limit in any existing lines of credit scaled by total assets,
or zero for firms with no line of credit, and (3) Unused LOC which is equal to the ratio of
the sum of all unused balances in any existing lines of credit to total assets, or zero for
firms with no line of credit. The results are presented in Table 4.
In column 1 we replicate the results of column 3 in Table 1 using internal cash
reserves to predict the provision of accounts receivable during the crisis for the
subsample of 100 firms for which we have information on lines of credit. Once again, we
find positive and significant coefficients for the interaction term of the crisis dummy and
the measures of internal liquidity, confirming the baseline results for this reduced sample.
Columns 2 to 4 report the estimation of the model using the three measures of
external liquidity: dummy for LOC, limit over assets and unused amount over assets,
respectively. We find that the coefficients of the three external liquidity measures
interacted with the crisis dummy are positive but not significantly different from zero.
Next, we assess the relative importance of internal resources and external
resources from lines of credit in trade credit provision. Columns 5 to 7 report the
estimation of the model that includes two interaction terms: a measure of internal
liquidity and an external liquidity measure, both interacted with the crisis dummy. We
use cash reserves as internal liquidity measure in the three specifications. In each
specification we use one of the three measures of external liquidity: dummy for LOC,
limit over assets and unused amount over assets, respectively.
19
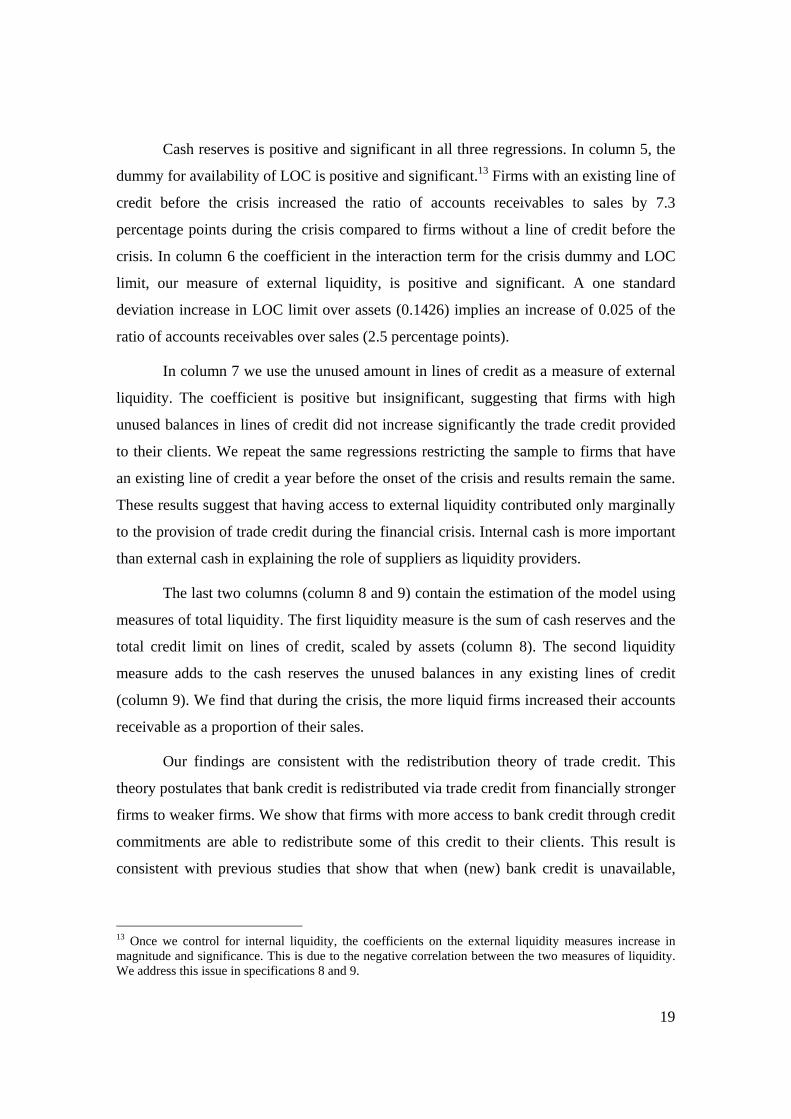
Cash reserves is positive and significant in all three regressions. In column 5, the
dummy for availability of LOC is positive and significant.13 Firms with an existing line of
credit before the crisis increased the ratio of accounts receivables to sales by 7.3
percentage points during the crisis compared to firms without a line of credit before the
crisis. In column 6 the coefficient in the interaction term for the crisis dummy and LOC
limit, our measure of external liquidity, is positive and significant. A one standard
deviation increase in LOC limit over assets (0.1426) implies an increase of 0.025 of the
ratio of accounts receivables over sales (2.5 percentage points).
In column 7 we use the unused amount in lines of credit as a measure of external
liquidity. The coefficient is positive but insignificant, suggesting that firms with high
unused balances in lines of credit did not increase significantly the trade credit provided
to their clients. We repeat the same regressions restricting the sample to firms that have
an existing line of credit a year before the onset of the crisis and results remain the same.
These results suggest that having access to external liquidity contributed only marginally
to the provision of trade credit during the financial crisis. Internal cash is more important
than external cash in explaining the role of suppliers as liquidity providers.
The last two columns (column 8 and 9) contain the estimation of the model using
measures of total liquidity. The first liquidity measure is the sum of cash reserves and the
total credit limit on lines of credit, scaled by assets (column 8). The second liquidity
measure adds to the cash reserves the unused balances in any existing lines of credit
(column 9). We find that during the crisis, the more liquid firms increased their accounts
receivable as a proportion of their sales.
Our findings are consistent with the redistribution theory of trade credit. This
theory postulates that bank credit is redistributed via trade credit from financially stronger
firms to weaker firms. We show that firms with more access to bank credit through credit
commitments are able to redistribute some of this credit to their clients. This result is
consistent with previous studies that show that when (new) bank credit is unavailable,
13 Once we control for internal liquidity, the coefficients on the external liquidity measures increase in magnitude and significance. This is due to the negative correlation between the two measures of liquidity. We address this issue in specifications 8 and 9.
20
trade credit becomes more important as a substitute source of finance (e.g., Petersen and
Rajan, 1997; Nilsen, 2002; and Wilner, 2000).
We also find that internal resources are more important to determine the extent of
trade credit provision during a financial crisis than external liquidity. This finding is
consistent with Love et al. (2007) who show that in severe financial crisis trade credit
collapses in response to an aggregate contraction in bank credit. Their interpretation of
the redistribution theory of trade credit is that during a financial crisis, when bank credit
and all the potential sources of funds dry up, there may be nothing left to redistribute
through trade credit. Our finding that internal resources are more important to explain
trade credit provision is consistent with this interpretation of the theory, which implies
that in the event of a credit crunch there is very little redistribution. Only firms with
internal resources and to some extent firms with pre-existing credit commitments can
help their clients. This result also speaks to the degree of substitutability between lines of
credit and cash in a context of a severe bank credit contraction.
Our findings are also consistent with the interpretation of Ivashina and Scharfstein
(2010) that firms drew down their existing credit lines during the financial crisis with a
precautionary motive. Firms mainly hold the funds as cash on their balance sheets and
only a small fraction of those funds is passed on to their clients in the form of accounts
receivable. This is also consistent with results by Campello, Giambona, Graham and
Harvey (2010), who find that firms do not use their credit lines when they have enough
internal funds, due to the cost differential between these two sources of liquidity. Firms
that find more valuable to support their clients whenever they experience a liquidity
shock should rely more on internal cash than external cash that can be obtained from
drawing down existing lines of credit.
4.5. The demand shock of 2001
One possible concern of our previous results is that they may reflect susceptibility
to a demand shock, rather than a supply shock. If the first year of the crisis entails an
economy-wide demand shock, our inferences may be confounded for two reasons. First,
year-before cash reserves could serve as a proxy for the susceptibility to a demand shock.

21
Second, accounts receivable during the 2007 crisis could grow because clients are not
being able to pay their debts to suppliers, rather than because suppliers are providing
liquidity to their clients.
To address this concern, we repeat our base specification for the negative demand
shock caused by the events of September 11, 2001. Tong and Wei (2008) explain that
9/11 had both a significant and almost entirely demand-side effect on the economy. If our
results are caused by demand, rather than supply effects of the crisis, then we would
expect to find results similar to our main results following this significant economy-wide
negative demand shock.
We report several estimations for equation (1) following the 9/11 shock in Table
5. We estimate the specifications both in the whole sample and in the smaller sub-sample
for which we have 10-k information about the use of lines of credit. Consistently with a
negative demand shock, overall accounts receivable fall (or stay constant) after 9/11.
However, unlike our main results, we find that year-before cash reserves, if anything, are
negatively related to accounts receivable. Similarly, the availability of a LOC before the
crisis does not lead to a higher provision of credit through accounts receivable. These
results suggest that the positive relationship that we found in the 2007-2008 financial
crisis between inter-firm credit provision following the supply shock and the pre-crisis
liquidity reserves should be stronger in the absence of demand effects.
4.6. Robustness checks
In all our previous estimations, we have scaled our measures of cash by total
assets. This raises the concern that our results are driven by a mechanical correlation
between the numerator of the dependent variable, accounts receivable, and the
denominator of our measure of cash, which includes accounts receivables and cash. We
address this concern by repeating the previous estimations using as a denominator for
cash (as well as for the other RHS variables) the following two measures: (i) assets net of
cash, and (ii) assets net of accounts receivable. Results of these estimations are
contained, respectively, in columns 1 and 2 of Table 6. In Panel A we estimate the
coefficients on the whole sample of firms and report estimations corresponding to model
22
(3) of Table 1 using the re-scaled variables. In Panel B, we estimate the coefficients for
the sub-sample of firms for which we gathered information on the use of lines of credit,
and we report estimations corresponding to model (5) of Table 4.
The first two columns of Table 6 show a positive and statistically significant
coefficient for the interaction of the crisis dummy with our re-scaled measures of cash, in
both the whole sample (Panel A) and in the subsample with information on LOC.
Similarly, in Panel B we find that the positive coefficient of the interaction of the crisis
with the LOC dummy is positive regardless of the denominator used for the independent
variables. These results show that our results are not driven by a mechanical correlation
between our dependent and independent variables.
We also analyze whether our results are sensitive to the choice of the sample
period used in the estimations, and to the year where we measure our cash variable. We
change the estimation sample by adding or deleting four quarters from the starting point
of our base sample (currently from the third quarter of 2005 to the second quarter of
2008). In columns 3 to 6 we add four quarters of data, and perform the estimations from
the third quarter of 2004 to the second quarter of 2008, and in columns 9 to 11 we delete
four quarters and perform the estimations from the third quarter of 2006 to the second
quarter of 2008. We also change the identification year (currently at the second quarter of
year 2006) and measure cash up to 12 quarters before the start of the quarter, to mitigate
concerns that firms could have foreseen the crisis and adjusted their cash reserves
accordingly. Columns 3, 6 and 9 contain our base case, i.e. identification performed at the
second quarter of 2006; in columns 4, 7 and 10 we measure cash reserves 8 quarters
before the start of the crisis, and in columns 5, 8 and 11 we measure cash reserves 12
quarters before the start of the crisis. The coefficient for the interaction of cash and the
dummy for the crisis is positive in all cases, albeit with a slightly lower statistical
significance. These results show that our findings do not depend on the choice of the
sample period or the year chosen to achieve identification.

23
4.7. Extending the crisis sample: Trade credit after the events of September 2008
We now analyze how our results change when we consider the complete crisis
episode and include quarterly data up to the second quarter of 2009. Considering the
whole crisis period has one advantage and several caveats for our analysis. On the one
hand, as the financial crisis lengthened and became deeper, we have stronger supply
effects, which peaked after the failure of Lehman Brothers in September 2008. With a
steeper shortage of institutional credit in this period, inter-firm financing through trade
credit could have become more relevant, and our previous results could be reinforced.
However, the lengthened crisis period had also strong effects on the demand side. If the
demand for credit fell in such a way that the lack of external finance was not binding any
more, we would also observe a systematic fall in trade credit financing and consequently
in the equilibrium amount of credit provided by suppliers (accounts receivable),
independently of how large their cash reserves are. By the same token, the credit crunch
made it difficult for many firms to obtain the liquidity needed to pay their debts to
suppliers, which would have caused ratios of accounts receivables to sales to increase
systematically. Once again, the latter effect should also be uncorrelated with the level of
cash reserves of suppliers. Because all of these forces came into play within the extended
crisis episode, the overall effect of the second phase of the crisis on the relationship
between available liquidity and inter-firm liquidity provision is ambiguous, and the
results must be interpreted cautiously.
To analyze how our results change when we consider the whole crisis episode, we
run estimations of equation (1) over an estimation sample running from the third quarter
of 2005 to the second quarter of 2009. We separate the effects of the mostly financial
phase of the crisis running from the third quarter of 2007 to the second quarter of 2008
(Crisis 2007) by adding to the specification a dummy containing a one for the period
going from the third quarter of 2008 to the second quarter of 2009 (Crisis 2008), and its
interaction with several measures of cash. Results of this estimation are contained in
Table 7.
Table 7 confirms overall our previous findings, i.e., there is a positive and
significant effect of cash on the accounts receivables to sales ratio for the financial stage

24
of the crisis (Crisis 2007 * Cash), which mitigates the negative overall drop in trade
credit during this period. However, this positive relationship does not continue to hold
during the second part of the crisis. In Column 1 the effect of cash reserves is positive but
not significant (Crisis 2008 * Cash). In fact, when we consider excess cash (column 3)
the relationship between cash and the accounts receivable to sales ratio reverses to
negative, although it is again not significant.
We use information gathered from the 10-k filings about the use of lines of credit
to analyze the relative roles of internal versus external liquidity in the inter-firm provision
of credit. Using this smaller sample, we do find a positive relationship between cash
reserves and the accounts receivable to sales ratio which extends to the second phase of
the financial crisis (columns 2 and 4). However, when we add information about the use
of lines of credit (columns 5 to 7) we find a negative coefficient (although not statistically
significant) for the interaction of access to lines of credit with the 2008 crisis (Crisis 2008
* LOC). This result suggests that, if anything, firms with access to lines of credit reduced
their liquidity provision to their clients after September 2008.
During the financial crisis there has been a heightened policy debate around the
bank credit contraction and the use of lines of credit by firms. 14 Ivashina and Scharfstein
(2010) show that new loans to large borrowers fell significantly during the financial
crisis. They show that the spike in commercial and industrial loans reported in bank
balance sheets at the end of 2008 is due to borrowers drawing down their existing credit
lines.15 Our results show that firms with lines of credit did not give away the scarce
liquidity obtained through a previously existing commitment. This finding is consistent
with the current consensus that that the primary motivation behind the drawn-downs at
the end of 2008 was cash hoarding.
14 While commercial and industrial loans in bank balance sheets increased, evidence suggested that banks were reducing the availability of bank credit to firms. See Chari, Christiano and Kehoe (2008) and Cohen-Cole et al. (2008). 15 Under a line of credit a bank commits to lend under pre-specified terms. During a financial crisis a bank may desire to shrink their balance sheet and reduce lending. However, the bank is contractually obligated to deliver the loan under the lending commitment provided that covenants are met by the borrower.

25
4.8. Who receives trade credit? Analysis of accounts payable
Despite that the main focus of this paper is the role of suppliers as liquidity
providers, and thus, accounts receivable, for completeness we examine which types of
firms receive the benefits of an increased supply of trade credit by their suppliers, i.e., an
analysis of debt in accounts payable. The ability of a firm to take up more trade credit
from its suppliers is a function, on the one hand, of a higher willingness of customers to
take on more trade credit (demand effect). On the other hand, the amount taken is also a
function of the supplier’s ability to provide such credit (supply effect), which according
to our findings will be determined by the suppliers’ liquidity position. While we are able
to construct indirect measures of how much a firm would like to demand of trade credit,
our database does not allow us to observe the liquidity positions of the firms’ suppliers
(we cannot identify the suppliers of our firms). We shall therefore focus on the demand
effects, and analyze whether more constrained firms are more likely to increase their
trade credit debt during the crisis.
We follow a similar approach to the previous analysis of accounts receivable.
Given that we are interested in estimating the demand for trade credit, we shall use
measures of financial constraints (instead of cash) in our difference-in-difference
estimations. The resulting model for accounts payable is the following:
ititttitiit ZCRISISCONSTCRISISAP 13*,21 , (3)
where itAP refers to the total amount of accounts payable divided by the cost of goods
sold. When multiplied by 360, this ratio is often interpreted as the number of days a firm
takes to pay off their debts to suppliers. As was the case for the receivables ratio, by
scaling accounts payable by a flow variable we control for the reduction in economic
activity that is commonly associated with crises.
As before, the indicator variable tCRISIS takes the value of one from July 1, 2007
to June 30, 2008. We interact this variable with the following measures of financial
constraints: Kaplan-Zingales (1997) index ( *itKZind ), the Whited-Wu (2006) index
( *itWWind ), the dividend payout ratio (an inverse measure of financial constraints), and a

26
dummy containing a one if the firm does not have a rating for their long term debt. We
calculate the indices according to the following formulas:
ititit
ititit
itititititit
grSalesSalesgrIndustrySIZE
DEBTLTDummyDIVCFWWind
CASHDIVDEBTQCFKZind
_035.0_102.0)log(044.0
_021.0_062.0091.0
315.1368.39319.3283.0002.1
Additionally, for the sub-sample of firms for which we gathered information on
the use of LOC from the 10-k SEC filings, we also consider access to LOC, amount of
LOC, and undrawn balances on LOC as additional (inverse) measures of constraints. Sufi
(2009) argues that these measures may be superior to the previous ones proposed in the
literature to identify financially constrained firms. Similarly than the empirical
methodology for accounts receivables, we measure all constraint variables at *t the end
of the second quarter of year 2006, i.e. one year previous to the financial crisis to reduce
concerns that the variation in firms’ constraints as the crisis unfolds is endogenous to
unobserved motives that lead to changes in the ratio of accounts payable to the cost of
goods sold.
In our models we include controls accounting for the demand of trade credit,
1itZ , which includes size, age, sales growth, net profit margin, total debt, current assets
and Q (see Petersen and Rajan (1997), Burkart, Ellingsen and Giannetti (2010)). We scale
our constraint measures, current assets, and total debt by total assets. In all specifications
we include firm fixed effects.
Table 8 contains the coefficients for equation (3) estimated on the whole sample
(columns 1-6) and on the subsample of firms for which we have information on lines of
credit (columns 7-13). In order to establish the basic patterns in the data, in columns 1
and 2 we estimate a basic model that includes only the crisis dummy (column 1), or the
crisis dummy and all firm controls except for the credit constrained measures (column 2),
plus a constant and firm fixed effects. We find that accounts payable as a fraction of cost
of goods sold dropped on average by 0.6 to 1.5 percentage points during the first year
following the start of the crisis in July 2007. The decrease in demand for trade credit is
consistent with the overall fall in economic activity caused by the crisis.

27
In the remaining columns of Table 8 we test the hypothesis that financially
constrained firms increased the trade credit demanded compared to less constrained
firms. The effect of the crisis on constrained firms is consistent throughout all the
specifications: More constrained firms increased their demand for trade credit during the
crisis. This is shown by the positive coefficients for the interaction of the crisis dummy
with our measures of constraints (negative for our inverse measures of constraints: the
dividend payout ratio, LOC dummy, LOC limit, and undrawn balances on LOC). These
coefficients in fact are statistically significant in columns 8, 9, and 11-13, and imply that
firms which were in most need of external finance demanded for higher levels of trade
credit debt to compensate for the relatively scarce bank credit. By the same token, firms
that had access to external liquidity through a LOC did not demand more trade credit
from their suppliers. For example, the coefficients of column 11 imply that during this
first stage of the crisis, firms with a LOC could perfectly cover their financing needs for
inventories and working capital with their lines of credit, and did not require extra
financing from their suppliers. These results highlight the importance of having a lending
commitment to mitigate the negative effects of a credit crunch.
5. Conclusions
We study the effect of the financial crisis that began on August 2007 on the inter-
firm provision of credit. The crisis represents an unexpected negative shock to the supply
of external finance for non-financial corporations, which makes it an ideal scenario to
analyze the role of alternative sources of financing when bank credit is scarce. We focus
on the financial phase of the crisis, running from the third quarter of 2007 to the second
quarter of 2008, where supply effects dominate. We find that trade credit given to other
corporations increases (or falls more slowly) for the firms holding more liquidity.
Consistent with a causal effect of the supply shock, our results are stronger when we
divide firms by industries according their degree of external finance dependence. We do
not find similar results following the demand shock caused by the events of September
11, 2001.
28
We also analyze the role of external liquidity by including information on their
lines of credit, and find that internal liquidity is more important to determine the extent of
trade credit provision during the financial crisis than external liquidity. We also find that
trade credit taken by constrained firms increases during this period to compensate for the
scarce institutional credit. Our results provide evidence supporting theories of suppliers
as liquidity providers of last resort. Our results are also consistent with the redistribution
theory of credit, which show how in an extreme scenario of scarce institutional and
market liquidity, only firms with internal resources are able to distribute credit in the
form of accounts receivable to their clients. Our findings provide an important
precautionary savings motive for accumulating cash reserves.
As we emerge from the most severe recession since the Great Depression, many
are blaming the anemic economic recovery to the lack of bank lending. Economic
policies have been directed to restore the solvency of financial institutions in order to
reestablish the flow of lending to firms and individuals. The findings of this paper
highlight the importance of non-financial firms in offering substitute credit in times of
financial stress and points out that policies aimed at enhancing this credit source, like
trade credit insurance or guarantees, could prove more effective to foster economic
growth.
29
References
Acharya, Viral, Thomas Philippon, Matthew Richardson, and Nouriel Roubini, 2009, “The Financial Crisis of 2007–2009: Causes and Remedies,” in Acharya, V. and M. Richardson (eds.), Restoring Financial Stability: How to Repair a Failed System. Wiley, New Jersey.
Almeida, Heitor, Murillo Campello, Bruno Laranjeira and Scott Weisbenner, 2010, “Corporate Debt Maturity and the Real Effects of the Panic of August 2007”, Unpublished manuscript, University of Illinois.
Almeida, Heitor, Murillo Campello, and Michael S. Weisbach, 2004, “The cash flow sensitivity of cash”, Journal of Finance 59 (4), pp. 1777-1804.
Brunnermeier, Markus K., 2009, “Deciphering the Liquidity and Credit Crunch 2007–2008,” Journal of Economic Perspectives 23 (1) pp. 77-100.
Burkart, Mike, Tore Ellingsen, and Mariassunta Giannetti, 2010, “What you sell is what you lend? Explaining trade credit contracts,” Review of Financial Studies, forthcoming.
Calomiris, Charles W., Charles P. Himmelberg, and Paul Wachtel, 1995, Commercial paper, corporate finance, and the business cycle: A microeconomic perspective, Carnegie Rochester Conference Series on Public Policy, 42, 203- 250.
Campello, Murillo, John H. Graham and Campbell R. Harvey, “The real effects of financial constraints: Evidence from a financial crisis,” Journal of Financial Economics 97 (3), pp. 470-487.
Chari, V.V., Christiano, Lawrence and Kehoe, Patrick J., (2008), Facts and myths about the financial crisis of 2008, No 666, Working Papers, Federal Reserve Bank of Minneapolis.
Cohen-Cole, Ethan, Duygan-Bump, Burcu, Fillat, Jose L. and Montoriol-Garriga, Judit, Looking Behind the Aggregates: A Reply to 'Facts and Myths About the Financial Crisis of 2008' (November 3, 2008). FRB of Boston Quantitative Analysis Unit Working Paper No. 08-5.
Cuñat, Vicente, 2007, “Trade Credit: Suppliers as Debt Collectors and Insurance Providers,” Review of Financial Studies 20(2):, pp. 491-527.

30
Cuñat, Vicente, and Emilia Garcia-Appendini, 2011, “Trade credit and its role in entrepreneurial finance”, in “Handbook of Entrepreneurial Finance”, edited by Douglas Cumming, Oxford University Press, forthcoming.
Demiroglu, Cem, Christopher M. James and Atay Kizilaslan, 2009, “Credit Market Conditions and the Determinants and Value of Bank Lines of Credit for Private Firms”, Unpublished Manuscript.
Dittmar, Amy and Jan Mahrt-Smith, 2007, “Corporate Governance and the Value of Cash Holdings,” Journal of Financial Economics 83 (3), pp. 599-634.
Duchin, Ran, Oguzhan Ozbas, and Berk A. Sensoy, 2010, “Costly external finance, corporate investment, and the subprime mortgage crisis,” Journal of Financial Economics 97, pp. 418-435.
Fabbri, Daniela and Leora Klapper, 2008, “Market Power and the Matching of Trade Credit Terms,” World Bank Policy Research Paper 4754.
Fisman, Raymond and Mayank Raturi, 2004. “Does Competition Encourage Credit Provision? Evidence from African Trade Credit Relationships.” Review of Economics and Statistics 86, 345-352.
Flannery, Mark J. and Lockhart, G. Brandon, 2009, “Credit Lines and the Substitutability of Cash and Debt,” Unpublished manuscript.
Gorton, Gary, 2009, “The Panic of 2007,” in Maintaining Stability in a Changing Financial System, Proceedings of the 2008 Jackson Hole Conference, Federal Reserve Bank of Kansas City.
Ippolito and Perez (2011). “Corporate Liquidity”, Unpublished manuscript.
Ivashina, Victoria, and David S. Scharfstein, 2010, "Bank Lending During the Financial Crisis of 2008." Journal of Financial Economics 97 (3) pp. 319-338.
Kahle, Kathleen M. and René M. Stultz, 2010, “ Financial Policies and the Financial Crisis: How Important Was the Systemic Credit Contraction for Industrial Corporations?”, NBER Working Paper No. 16310.
Kaplan, Steven, and Luigi Zingales. 1997. “Do investment cash flow sensitivities provide useful measures of financing constraints?”. Quarterly Journal of Economics: 112, 169-215.

31
Keynes, J., 1936, “The general theory of employment, interest and money,” Harcourt Brace, London.
Lee, Yul W. and John D. Stowe, 1993, “Product risk, asymmetric information, and trade credit,” Journal of Financial and Quantitative Analysis 28 (2), 285-300.
Lins, Karl, Henry Servaes, and Peter Tufano, 2010, “What drives corporate liquidity? An international survey of cash holdings and lines of credit,” Journal of Financial Economics 98 (1), 160-176.
Long, Michael S., Ileen B. Malitz, and S. Abraham Ravid, 1993, “Trade credit, quality guarantees, and product marketability,” Financial Management 22:4. 117-127.
Love, Inessa, Lorenzo A. Preve and Virginia Sarria-Allende, 2007, Trade credit and bank credit: Evidence from recent financial crises. Journal of Financial Economics 83, pp. 453-469.
Meltzer, Allan H., 1960, “Mercantile Credit, Monetary Policy, and Size of Firms,” Review of Economics and Statistics 42 (4), pp. 429-437.
Nilsen, Jeffrey H, 2002, ‘‘Trade Credit and the Bank Lending Channel,’’ Journal of Money, Credit, and Banking 34:1, 226–253.
Opler, Tim, Lee Pinkowitz, René Stultz and Rohan Williamson, 1999, “The Determinants and Implications of Corporate Cash Holdings,” Journal of Financial Economics 52, pp. 3-46.
Petersen, Mitchell A., and Raghuram G. Rajan, 1997, Trade credit: Theories and evidence, Review of Financial Studies 10, pp. 661–691.
Rajan, Raghuram, and Luigi Zingales, 1998, “Financial dependence and growth,” American Economic Review 88, 559-587.
Shockley, Richard L. and Anjan V. Thakor, 1997, “Bank loan commitment contracts: Data, theory, and tests,” Journal of Money, Credit, and Banking 29 (4), 517-534.
Smith, Janet K., 1987. “Trade credit and informational asymmetry.” Journal of Finance 42 (4), 863-872.
Sufi, Amir, 2009, “Bank lines of credit in corporate finance: An empirical analysis,” Review of Financial Studies 22, pp. 1057-1088.

32
Tong, Hui and Shang-Jin Wei, 2008, “Real Effects of the Subprime Mortgage Crisis: Is it a Demand or a Finance Shock?”, NBER Working Paper No. 14205.
Wilner, Benjamin S., 2000, “The exploitation of relationships in financial distress: The case of trade credit”, Journal of Finance 55 (1), pp. 153-178.
Whited, Toni and Guojun Wu, 2006, “Financial Constraints Risk,” Review of Financial Studies 19 (2), pp. 531-559.

Table 1. Cash and trade credit provision during the credit crisis.
Cash Flow
(1) (2) (3) (4) (5) (6) (7)
Crisis 2007 -0.00592** -0.0104*** -0.0157*** -0.0242*** -0.00771** -0.0174*** -0.0111***[0.00282] [0.00308] [0.00394] [0.00489] [0.00378] [0.00454] [0.00345]
Crisis 2007 * Cash 0.0281** 0.0543*** 0.0239* 0.0459***[0.0129] [0.0143] [0.0128] [0.0140]
Crisis 2007 * Cash flow 0.259*** 0.272*** 0.150**[0.0674] [0.0702] [0.0611]
Log of total assets 0.0695*** 0.0694*** 0.0550*** 0.0521*** 0.0486*** 0.0567***[0.00678] [0.00678] [0.00681] [0.00725] [0.00730] [0.00680]
Log of age -0.0384*** -0.0396*** -0.0402*** -0.0542*** -0.0533*** -0.0381***[0.0119] [0.0119] [0.0117] [0.0144] [0.0144] [0.0117]
PPE over assets -0.166*** -0.170*** -0.214*** -0.212*** -0.219*** -0.206***[0.0383] [0.0383] [0.0379] [0.0403] [0.0403] [0.0379]
Net profit margin -0.0380*** -0.0383*** -0.0371*** -0.0371*** -0.0363*** -0.0369***[0.00241] [0.00241] [0.00248] [0.00252] [0.00253] [0.00248]
Sales growth -0.176*** -0.176*** -0.169*** -0.171*** -0.170*** -0.169***[0.00534] [0.00534] [0.00538] [0.00580] [0.00580] [0.00538]
None Cash Reserves Excess Cash
[0.00534] [0.00534] [0.00538] [0.00580] [0.00580] [0.00538]Net worth over assets -0.123*** -0.121*** -0.153*** -0.143*** -0.149*** -0.153***
[0.0195] [0.0195] [0.0195] [0.0208] [0.0209] [0.0195]Debt over assets -0.250*** -0.249*** -0.220*** -0.230*** -0.231*** -0.221***
[0.0263] [0.0263] [0.0263] [0.0283] [0.0283] [0.0263]Constant 0.614*** 0.422*** 0.426*** 0.533*** 0.595*** 0.618*** 0.514***
[0.00156] [0.0515] [0.0515] [0.0515] [0.0563] [0.0566] [0.0513]
Firm Fixed Effects Yes Yes Yes Yes Yes Yes Yes
R-squared 0.000 0.062 0.062 0.059 0.059 0.060 0.059Observations 24,652 24,652 24,652 23,688 20,417 20,417 23,688Number of Firms 2,247 2,247 2,247 2,157 1,821 1,821 2,157
This table presents estimates from panel regressions explaining firm-level quarterly trade credit provided for quarters with an end date from July 1, 2005 to June 30,2008. The dependent variable is accounts receivable over sales. The top row indicates the cash measure (Cash) that is interacted with the crisis dummy: CashReserves in columns 3 and 4, Excess Cash in columns 5 and 6, Cash Flow in column 7. Cash reserves is the ratio of cash to total assets. Excess Cash is theresidual cash to total assets and is defined relative to the model of optimal cash holdings as presented in Dittmar and Mahrt-Smith (2007), estimated over the period1995-2004. Cash Flow is the ratio of operating income before depreciation to assets. Cash Reserves, Excess Cash, and Cash Flow are measured at the end of thelast fiscal quarter ending before July 1, 2006. Crisis 2007 is an indicator that equals to one from the third quarter of 2007 to the second quarter of 2008. Allspecifications control for firms’ characteristics which include: size, age, tangibility, net profit margin, sales growth, net worth, and total debt. All specifications includefirm fixed effects. ***, **, or * indicates significance at the 1%, 5%, or 10% level, respectively.
32

Table 2. Trade credit provision, credit constraints, and growth.
(1) (2) (3) (4) (5) (6) (7) (8) (9) (10)Unrated Rated Junk Inv. Grade Low M/B High M/B Low growth High growth Unprofitable Profitable
Crisis 2007 -0.0140** -0.0223*** -0.0165*** -0.0201*** -0.00679 -0.0177*** -0.0112* -0.0187*** -0.0563*** -0.00367[0.00591] [0.00435] [0.00580] [0.00440] [0.00447] [0.00689] [0.00589] [0.00523] [0.0139] [0.00312]
Crisis 2007 * Cash 0.0232 0.125*** 0.0241 0.132*** -0.0893*** 0.0471*** 0.00446 0.0562*** 0.0548 0.0392***[0.0164] [0.0293] [0.0163] [0.0288] [0.0255] [0.0179] [0.0192] [0.0171] [0.0342] [0.0118]
Log of total assets 0.0692*** 0.0682*** 0.0685*** 0.0662*** 0.0357*** 0.0832*** 0.0917*** 0.0465*** 0.134*** 0.0144**[0.00894] [0.00880] [0.00883] [0.00888] [0.00932] [0.00974] [0.0113] [0.00854] [0.0177] [0.00613]
Log of age -0.0489*** -0.0446*** -0.0368** -0.0506*** -0.0253* -0.0568*** -0.0386** -0.0334* -0.0464 -0.00463[0.0173] [0.0132] [0.0148] [0.0189] [0.0137] [0.0192] [0.0160] [0.0188] [0.0287] [0.0111]
PPE over assets -0.250*** -0.0106 -0.232*** -0.0375 -0.241*** -0.117** -0.261*** -0.0916* -0.311*** -0.101***[0.0522] [0.0457] [0.0515] [0.0459] [0.0478] [0.0574] [0.0605] [0.0480] [0.0991] [0.0337]
Net profit margin -0.0377*** -0.0886*** -0.0377*** -0.101*** -0.0229*** -0.0400*** -0.0459*** -0.00245 -0.0429*** -0.0426***[0.00275] [0.0171] [0.00274] [0.0177] [0.00665] [0.00289] [0.00288] [0.00538] [0.00409] [0.00756]
Sales growth -0.180*** -0.164*** -0.183*** -0.153*** -0.181*** -0.173*** -0.187*** -0.162*** -0.224*** -0.139***[0.00678] [0.00778] [0.00675] [0.00770] [0.00689] [0.00779] [0.00789] [0.00713] [0.0126] [0.00505]
Net worth over assets -0.108*** -0.237*** -0.105*** -0.271*** -0.190*** -0.0984*** -0.209*** -0.0439* -0.314*** 0.0200[0.0242] [0.0327] [0.0239] [0.0346] [0.0283] [0.0270] [0.0299] [0.0252] [0.0459] [0.0186]
Debt over assets -0.276*** -0.232*** -0.266*** -0.269*** -0.253*** -0.245*** -0.430*** -0.0522 -0.546*** -0.00841[0.0340] [0.0371] [0.0335] [0.0382] [0.0367] [0.0366] [0.0396] [0.0345] [0.0649] [0.0242]
Constant 0.534*** 0.310*** 0.498*** 0.377*** 0.628*** 0.389*** 0.351*** 0.479*** 0.384*** 0.535***[0.0631] [0.0808] [0.0591] [0.0887] [0.0724] [0.0726] [0.0825] [0.0682] [0.120] [0.0471]
Firm fixed efffects Yes Yes Yes Yes Yes Yes Yes Yes Yes YesR-squared 0.061 0.078 0.062 0.076 0.078 0.057 0.078 0.050 0.088 0.047Observations 16,487 8,165 16,686 7,966 11,295 13,357 12,200 12,452 5,949 18,703Number of id 1,510 737 1,530 717 1,027 1,220 1,121 1,126 557 1,690
Credit constraints Growth opportunities
This table presents subsample estimates from panel regressions explaining firm-level quarterly trade credit provided for quarters with an end date from July 1, 2005 to June 30, 2008. The dependent variableis accounts receivable over sales. Cash is measured as total cash reserves, scaled by total assets. Each pair of columns contain coefficients estimated over mutually exclusive subsamples, constructedaccording to the following criteria: Firms have no long term debt rating vs. firms are rated (col. 1 and 2); firm LT debt is unrated or rated below BBB- vs. firms have a rating of BBB- or higher (col. 3 and 4);firms have lower/higher than median M/B value (col. 5 and 6), firms have lower/higher than median asset growth (col 7 and 8); firms have negative/non-negative income before extraordinary items (col. 9 and10). Cash is measured at the end of the last fiscal quarter ending before July 1, 2006. Crisis 2007 is an indicator that equals to one from the third quarter of 2007 to the second quarter of 2008. Allspecifications control for firms’ characteristics which include: size, age, tangibility, net profit margin, sales growth, net worth, and total debt. All specifications include firm fixed effects. ***, **, or * indicatesthat the coefficient is significant at the 1%, 5%, or 10% level, respectively.
33
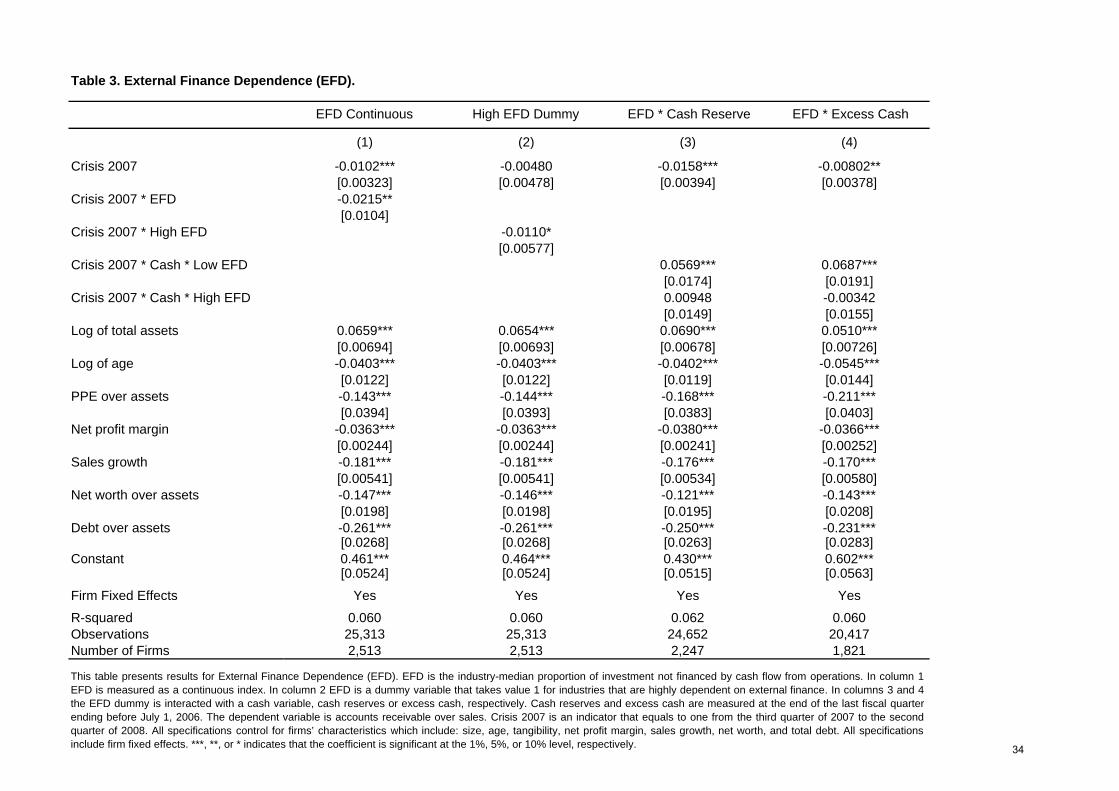
Table 3. External Finance Dependence (EFD).
EFD Continuous High EFD Dummy EFD * Cash Reserve EFD * Excess Cash
(1) (2) (3) (4)
Crisis 2007 -0.0102*** -0.00480 -0.0158*** -0.00802**[0.00323] [0.00478] [0.00394] [0.00378]
Crisis 2007 * EFD -0.0215**[0.0104]
Crisis 2007 * High EFD -0.0110*[0.00577]
Crisis 2007 * Cash * Low EFD 0.0569*** 0.0687***[0.0174] [0.0191]
Crisis 2007 * Cash * High EFD 0.00948 -0.00342[0.0149] [0.0155]
Log of total assets 0.0659*** 0.0654*** 0.0690*** 0.0510***[0.00694] [0.00693] [0.00678] [0.00726]
Log of age -0.0403*** -0.0403*** -0.0402*** -0.0545***[0.0122] [0.0122] [0.0119] [0.0144]
PPE over assets -0.143*** -0.144*** -0.168*** -0.211***[0.0394] [0.0393] [0.0383] [0.0403]
Net profit margin -0.0363*** -0.0363*** -0.0380*** -0.0366***[0.00244] [0.00244] [0.00241] [0.00252]
Sales growth -0.181*** -0.181*** -0.176*** -0.170***[0.00541] [0.00541] [0.00534] [0.00580]
Net worth over assets -0.147*** -0.146*** -0.121*** -0.143***[0.0198] [0.0198] [0.0195] [0.0208]
Debt over assets -0.261*** -0.261*** -0.250*** -0.231***[0.0268] [0.0268] [0.0263] [0.0283]
Constant 0.461*** 0.464*** 0.430*** 0.602***[0.0524] [0.0524] [0.0515] [0.0563]
Firm Fixed Effects Yes Yes Yes Yes
R-squared 0.060 0.060 0.062 0.060Observations 25,313 25,313 24,652 20,417Number of Firms 2,513 2,513 2,247 1,821
This table presents results for External Finance Dependence (EFD). EFD is the industry-median proportion of investment not financed by cash flow from operations. In column 1EFD is measured as a continuous index. In column 2 EFD is a dummy variable that takes value 1 for industries that are highly dependent on external finance. In columns 3 and 4the EFD dummy is interacted with a cash variable, cash reserves or excess cash, respectively. Cash reserves and excess cash are measured at the end of the last fiscal quarterending before July 1, 2006. The dependent variable is accounts receivable over sales. Crisis 2007 is an indicator that equals to one from the third quarter of 2007 to the secondquarter of 2008. All specifications control for firms’ characteristics which include: size, age, tangibility, net profit margin, sales growth, net worth, and total debt. All specificationsinclude firm fixed effects. ***, **, or * indicates that the coefficient is significant at the 1%, 5%, or 10% level, respectively. 34

Table 4. Subsample with information on lines of credit (LOC)
Cash Reserves
LOC Dummy
LOC Limit
Unused LOC
Cash Reserves,
LOC Dummy
Cash Reserves, LOC Limit
Cash Reserves,
Unused LOC
Liquidity 1 (Cash + LOC
Limit)
Liquidity 2 (Cash +
Unused LOC)
(1) (2) (3) (4) (5) (6) (7) (8) (9)
Crisis 2007 -0.0249* -0.0132 -0.0124 -0.0125 -0.100** -0.0596** -0.0585** -0.0535*** -0.0443**[0.0147] [0.0251] [0.0173] [0.0178] [0.0402] [0.0255] [0.0257] [0.0202] [0.0197]
Crisis 2007 * Cash 0.0887* 0.175*** 0.143** 0.138**[0.0466] [0.0634] [0.0570] [0.0561]
Crisis 2007 * LOC 0.00497 0.0230 0.0290 0.0733** 0.180* 0.214[0.0268] [0.0888] [0.112] [0.0364] [0.108] [0.135]
Crisis 2007 * Liquidity 0.127*** 0.120**[0.0465] [0.0532]
Log of total assets 0.0940*** 0.0930*** 0.0927*** 0.0927*** 0.0909*** 0.0899*** 0.0904*** 0.0856*** 0.0881***[0.0255] [0.0256] [0.0257] [0.0257] [0.0255] [0.0256] [0.0256] [0.0256] [0.0256]
Log of age -0.0674 -0.0580 -0.0589 -0.0587 -0.0615 -0.0722 -0.0697 -0.0704 -0.0685[0.0439] [0.0441] [0.0438] [0.0438] [0.0440] [0.0440] [0.0439] [0.0438] [0.0439]
PPE over assets 0.288* 0.316** 0.317** 0.317** 0.266* 0.279* 0.281* 0.292* 0.272*[0.155] [0.154] [0.155] [0.155] [0.155] [0.155] [0.155] [0.154] [0.155]
Net profit margin -0.0530** -0.0476** -0.0476** -0.0476** -0.0511** -0.0526** -0.0522** -0.0518** -0.0525**[0.0234] [0.0234] [0.0234] [0.0234] [0.0234] [0.0234] [0.0234] [0.0233] [0.0233]
Sales growth -0.106*** -0.107*** -0.107*** -0.107*** -0.106*** -0.106*** -0.105*** -0.104*** -0.105***[0.0202] [0.0202] [0.0202] [0.0202] [0.0201] [0.0202] [0.0202] [0.0202] [0.0202]
Net worth over assets -0.120** -0.121** -0.122** -0.122** -0.108* -0.124** -0.124** -0.124** -0.122**[0.0594] [0.0596] [0.0595] [0.0595] [0.0596] [0.0594] [0.0594] [0.0593] [0.0593]
Debt over assets -0.0504 -0.0679 -0.0733 -0.0725 -0.0251 -0.0772 -0.0700 -0.0800 -0.0689[0.103] [0.103] [0.105] [0.104] [0.104] [0.105] [0.104] [0.103] [0.103]
Constant 0.203 0.180 0.185 0.184 0.202 0.248 0.237 0.266* 0.248[0.158] [0.158] [0.158] [0.158] [0.158] [0.160] [0.159] [0.160] [0.160]
Firm Fixed Effects Yes Yes Yes Yes Yes Yes Yes Yes Yes
R-squared 0.047 0.044 0.044 0.044 0.051 0.050 0.050 0.051 0.049Observations 1,171 1,171 1,171 1,171 1,171 1,171 1,171 1,171 1,171Number of Firms 100 100 100 100 100 100 100 100 100
This table presents estimates for a subsample of 100 firms for which we hand collected information on lines of credit (LOC) for quarters with an end date from July 1, 2005 to June 30, 2008. Thedependent variable is accounts receivable over sales. The top row indicates the measure that is interacted with the crisis dummy in each regression (Cash, LOC or Liquidity measures). Columns 5to 7 include two interaction terms with the crisis dummy: cash reserves and a LOC measure. All interacting variables are measured at the end of the last fiscal quarter ending before July 1, 2006.LOC Limit is the total amount in lines of credit, scaled by assets. Unused LOC is the unused amount in lines of credit, scaled by assets. Liquidity 1 is the ratio of cash reserves plus total amount inlines of credit, scaled by assets. Liquidity 2 is the ratio of cash reserves plus unused amount in lines of credit, scaled by assets. All other variables are defined in table 1. All specifications includefirm fixed effects. ***, **, or * indicates that the coefficient is significant at the 1%, 5%, or 10% level, respectively. 35

Table 5. Estimations over the demand crisis following September 11, 2001.
Cash Reserves, LOC Dummy
Cash Reserves, LOC Limit
Cash Reserves, Unused LOC
Liquidity (Cash + Unused LOC)
WS 10k WS 10k 10k 10k 10k 10k(1) (2) (3) (4) (5) (6) (7) (8)
Crisis 2001 -0.0154*** 0.0150 -0.0188*** -0.0210 -0.0587 0.0278 0.0173 0.0189[0.00393] [0.0222] [0.00409] [0.0185] [0.0507] [0.0352] [0.0309] [0.0276]
Crisis 2001 * Cash -0.0523*** -0.0158 -0.0575*** 0.113 0.0729 -0.0384 -0.0194 -0.0250[0.0132] [0.0767] [0.0141] [0.0700] [0.0942] [0.0904] [0.0836] [0.0796]
Crisis 2001 * LOC 0.0786 -0.0583 -0.0181[0.0486] [0.124] [0.170]
Log of total assets 0.0747*** -0.0204 0.0744*** 0.00526 -0.0146 -0.0209 -0.0201 -0.0202[0.00695] [0.0509] [0.00775] [0.0457] [0.0510] [0.0509] [0.0510] [0.0509]
Log of age -0.0460*** -0.0663 -0.0594*** -0.0276 -0.0834 -0.0609 -0.0660 -0.0654[0.0103] [0.0756] [0.0116] [0.0656] [0.0762] [0.0764] [0.0756] [0.0755]
PPE over assets 0.0912** 0.299 0.131*** 0.457* 0.266 0.321 0.303 0.307[0.0404] [0.294] [0.0446] [0.261] [0.294] [0.297] [0.296] [0.296]
Net profit margin -0.0707*** -0.129*** -0.0743*** -0.123*** -0.129*** -0.129*** -0.129*** -0.129***[0.00378] [0.0122] [0.00417] [0.0104] [0.0122] [0.0122] [0.0122] [0.0122]
Cash Reserves Excess Cash
[0.00378] [0.0122] [0.00417] [0.0104] [0.0122] [0.0122] [0.0122] [0.0122]Sales growth -0.233*** -0.375*** -0.233*** -0.346*** -0.373*** -0.376*** -0.375*** -0.375***
[0.00571] [0.0265] [0.00646] [0.0253] [0.0265] [0.0265] [0.0265] [0.0265]Net worth over assets -0.000442 0.719*** 0.0255 0.589*** 0.692*** 0.726*** 0.720*** 0.720***
[0.0200] [0.147] [0.0225] [0.141] [0.148] [0.148] [0.147] [0.146]Debt over assets -0.0255 0.748*** 0.00693 0.524*** 0.706*** 0.753*** 0.749*** 0.750***
[0.0274] [0.224] [0.0309] [0.203] [0.225] [0.224] [0.224] [0.224]Constant 0.358*** 0.460 0.360*** 0.282 0.497 0.440 0.456 0.454
[0.0473] [0.331] [0.0520] [0.283] [0.332] [0.334] [0.333] [0.332]
Firm Fixed Effects Yes Yes Yes Yes Yes Yes Yes Yes
R-squared 0.085 0.172 0.089 0.218 0.174 0.172 0.172 0.172Observations 26,704 1,642 20,497 1,283 1,642 1,642 1,642 1,642Number of Firms 3,002 238 2,258 181 238 238 238 238This table presents robustness tests using the demand crisis following September 11, 2001. The estimation sample consists of quarterly data from the last quarter of year 2000 and the third quarter of 2002.The dependent variable is accounts receivable over sales. Columns 1 and 3 are estimated using all firms. Columns 2 and 4-8 use the subsample of 100 firms for which we hand-collected information onlines of credit. The top row indicates the cash measure (Cash) and line of credit measure (LOC) that is interacted with the crisis dummies in each regression: Cash Reserves in columns 1, 2 and 5-7, ExcessCash in columns 3 and 4, Cash reserves and LOC dummy in column 5, Cash reserves and LOC limit in column 6, Cash reserves and unused LOC in column 7, Cash + Unused balance in LOC in column 8.Cash and LOC variables are measured at the third quarter of year 2000. Crisis 2001 is an indicator that equals to one from the fourth quarter of 2001 to the third quarter of 2002. All other variables aredefined in table 1. All specifications control for firms’ characteristics which include: size, age, tangibility, net profit margin, sales growth, net worth, and total debt. All specifications include firm fixed effects.***, **, or * indicates that the coefficient is significant at the 1%, 5%, or 10% level, respectively.
36
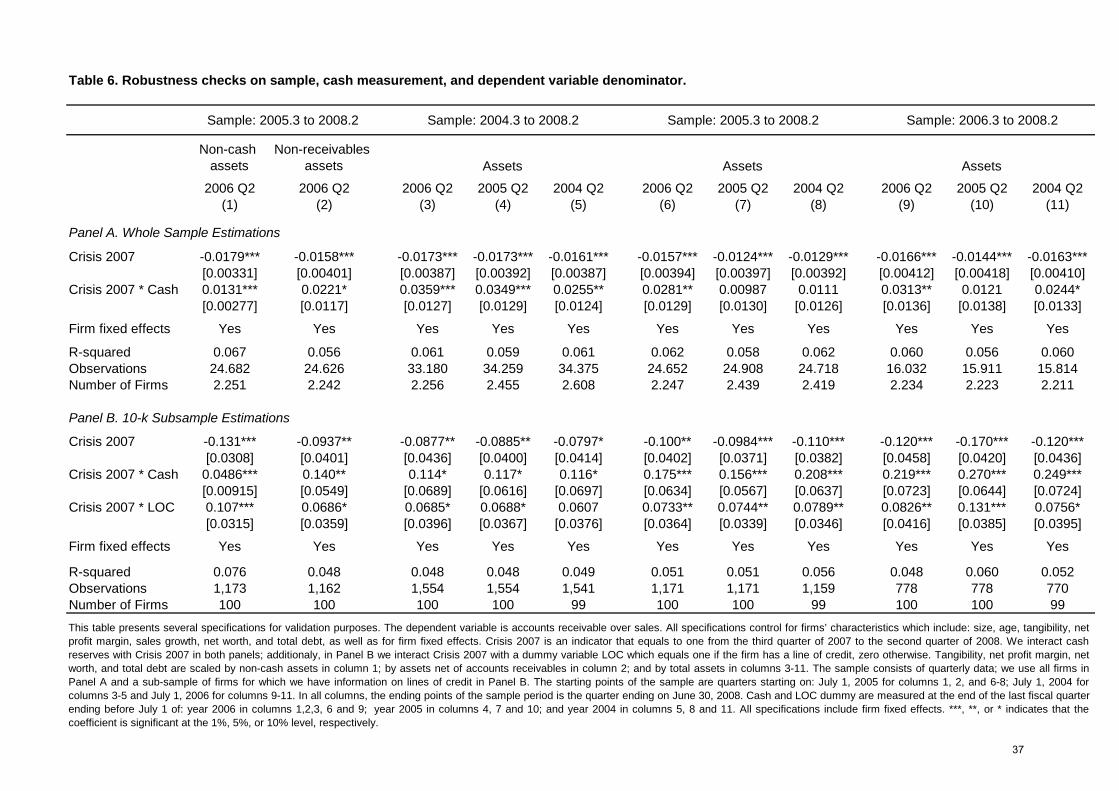
Table 6. Robustness checks on sample, cash measurement, and dependent variable denominator.
Non-cash assets
Non-receivables assets
2006 Q2 2006 Q2 2006 Q2 2005 Q2 2004 Q2 2006 Q2 2005 Q2 2004 Q2 2006 Q2 2005 Q2 2004 Q2(1) (2) (3) (4) (5) (6) (7) (8) (9) (10) (11)
Panel A. Whole Sample Estimations
Crisis 2007 -0.0179*** -0.0158*** -0.0173*** -0.0173*** -0.0161*** -0.0157*** -0.0124*** -0.0129*** -0.0166*** -0.0144*** -0.0163***[0.00331] [0.00401] [0.00387] [0.00392] [0.00387] [0.00394] [0.00397] [0.00392] [0.00412] [0.00418] [0.00410]
Crisis 2007 * Cash 0.0131*** 0.0221* 0.0359*** 0.0349*** 0.0255** 0.0281** 0.00987 0.0111 0.0313** 0.0121 0.0244*[0.00277] [0.0117] [0.0127] [0.0129] [0.0124] [0.0129] [0.0130] [0.0126] [0.0136] [0.0138] [0.0133]
Firm fixed effects Yes Yes Yes Yes Yes Yes Yes Yes Yes Yes Yes
R-squared 0.067 0.056 0.061 0.059 0.061 0.062 0.058 0.062 0.060 0.056 0.060Observations 24.682 24.626 33.180 34.259 34.375 24.652 24.908 24.718 16.032 15.911 15.814Number of Firms 2.251 2.242 2.256 2.455 2.608 2.247 2.439 2.419 2.234 2.223 2.211
Panel B. 10-k Subsample Estimations
Sample: 2005.3 to 2008.2 Sample: 2006.3 to 2008.2Sample: 2005.3 to 2008.2 Sample: 2004.3 to 2008.2
Assets Assets Assets
Crisis 2007 -0.131*** -0.0937** -0.0877** -0.0885** -0.0797* -0.100** -0.0984*** -0.110*** -0.120*** -0.170*** -0.120***[0.0308] [0.0401] [0.0436] [0.0400] [0.0414] [0.0402] [0.0371] [0.0382] [0.0458] [0.0420] [0.0436]
Crisis 2007 * Cash 0.0486*** 0.140** 0.114* 0.117* 0.116* 0.175*** 0.156*** 0.208*** 0.219*** 0.270*** 0.249***[0.00915] [0.0549] [0.0689] [0.0616] [0.0697] [0.0634] [0.0567] [0.0637] [0.0723] [0.0644] [0.0724]
Crisis 2007 * LOC 0.107*** 0.0686* 0.0685* 0.0688* 0.0607 0.0733** 0.0744** 0.0789** 0.0826** 0.131*** 0.0756*[0.0315] [0.0359] [0.0396] [0.0367] [0.0376] [0.0364] [0.0339] [0.0346] [0.0416] [0.0385] [0.0395]
Firm fixed effects Yes Yes Yes Yes Yes Yes Yes Yes Yes Yes Yes
R-squared 0.076 0.048 0.048 0.048 0.049 0.051 0.051 0.056 0.048 0.060 0.052Observations 1,173 1,162 1,554 1,554 1,541 1,171 1,171 1,159 778 778 770Number of Firms 100 100 100 100 99 100 100 99 100 100 99This table presents several specifications for validation purposes. The dependent variable is accounts receivable over sales. All specifications control for firms’ characteristics which include: size, age, tangibility, netprofit margin, sales growth, net worth, and total debt, as well as for firm fixed effects. Crisis 2007 is an indicator that equals to one from the third quarter of 2007 to the second quarter of 2008. We interact cashreserves with Crisis 2007 in both panels; additionaly, in Panel B we interact Crisis 2007 with a dummy variable LOC which equals one if the firm has a line of credit, zero otherwise. Tangibility, net profit margin, networth, and total debt are scaled by non-cash assets in column 1; by assets net of accounts receivables in column 2; and by total assets in columns 3-11. The sample consists of quarterly data; we use all firms inPanel A and a sub-sample of firms for which we have information on lines of credit in Panel B. The starting points of the sample are quarters starting on: July 1, 2005 for columns 1, 2, and 6-8; July 1, 2004 forcolumns 3-5 and July 1, 2006 for columns 9-11. In all columns, the ending points of the sample period is the quarter ending on June 30, 2008. Cash and LOC dummy are measured at the end of the last fiscal quarterending before July 1 of: year 2006 in columns 1,2,3, 6 and 9; year 2005 in columns 4, 7 and 10; and year 2004 in columns 5, 8 and 11. All specifications include firm fixed effects. ***, **, or * indicates that thecoefficient is significant at the 1%, 5%, or 10% level, respectively.
37

Table 7. Cash and liquidity provision during the 2007 - 2008 crisis.
Cash Reserves, LOC Dummy
Cash Reserves, LOC Limit
Cash Reserves, Unused LOC
Liquidity (Cash + Unused LOC)
WS 10k WS 10k 10k 10k 10k 10k(1) (2) (3) (4) (5) (6) (7) (8)
Crisis 2007 -0.0136*** -0.0162 -0.00705* 0.00248 -0.0778* -0.0579** -0.0547* -0.0439**[0.00407] [0.0157] [0.00385] [0.0160] [0.0436] [0.0278] [0.0281] [0.0215]
Crisis 2008 -0.0248*** -0.0341** -0.0197*** -0.0182 0.00876 -0.0321 -0.0317 -0.0529**[0.00434] [0.0169] [0.00422] [0.0186] [0.0435] [0.0282] [0.0284] [0.0220]
Crisis 2007 * Cash 0.0261* 0.111** 0.0224* 0.0467 0.182*** 0.176*** 0.167*** 0.160***[0.0135] [0.0507] [0.0136] [0.0508] [0.0690] [0.0621] [0.0612] [0.0579]
Crisis 2008 * Cash 0.00771 0.176*** -0.00936 0.247*** 0.127* 0.175*** 0.174*** 0.175***[0.0143] [0.0515] [0.0144] [0.0532] [0.0690] [0.0631] [0.0619] [0.0587]
Crisis 2007 * LOC 0.0601 0.211* 0.241[0.0397] [0.117] [0.147]
Crisis 2008 * LOC -0.0427 -0.00467 -0.0105[0.0394] [0.119] [0.148]
Log of total assets 0.0417*** 0.0109 0.0252*** 0.0251 0.0115 0.00888 0.00917 0.00404[0 00538] [0 0210] [0 00579] [0 0228] [0 0210] [0 0210] [0 0210] [0 0210]
Cash Reserves Excess Cash
[0.00538] [0.0210] [0.00579] [0.0228] [0.0210] [0.0210] [0.0210] [0.0210]Log of age -0.0180* -0.0325 -0.0152 -0.0738 -0.0314 -0.0355 -0.0337 -0.0329
[0.00995] [0.0412] [0.0115] [0.0629] [0.0412] [0.0414] [0.0413] [0.0413]PPE over assets -0.188*** 0.162 -0.211*** 0.144 0.166 0.157 0.157 0.146
[0.0312] [0.127] [0.0330] [0.138] [0.128] [0.127] [0.127] [0.128]Net profit margin -0.0314*** -0.129*** -0.0317*** -0.126*** -0.131*** -0.129*** -0.129*** -0.126***
[0.00201] [0.0178] [0.00210] [0.0182] [0.0179] [0.0178] [0.0178] [0.0177]Sales growth -0.175*** -0.109*** -0.176*** -0.111*** -0.110*** -0.110*** -0.110*** -0.108***
[0.00475] [0.0186] [0.00517] [0.0194] [0.0186] [0.0186] [0.0186] [0.0186]Net worth over assets -0.123*** -0.0808 -0.119*** -0.0855 -0.0767 -0.0823 -0.0817 -0.0855*
[0.0159] [0.0508] [0.0171] [0.0591] [0.0509] [0.0508] [0.0508] [0.0508]Debt over assets -0.209*** -0.0306 -0.186*** 0.0122 -0.0271 -0.0396 -0.0355 -0.0607
[0.0215] [0.0851] [0.0233] [0.0978] [0.0855] [0.0863] [0.0860] [0.0850]Constant 0.538*** 0.625*** 0.635*** 0.651*** 0.617*** 0.649*** 0.641*** 0.677***
[0.0425] [0.142] [0.0460] [0.186] [0.142] [0.144] [0.143] [0.144]
Firm fixed effects Yes Yes Yes Yes Yes Yes Yes Yes
R-squared 0.055 0.062 0.056 0.070 0.065 0.064 0.064 0.061Observations 31,919 1,557 26,370 1,429 1,557 1,557 1,557 1,557Number of Firms 2,249 100 1,821 91 100 100 100 100
38
This table presents estimates from panel regressions explaining firm-level quarterly trade credit provided for quarters with an end date from July 1, 2005 to June 30, 2009. The dependent variable isaccounts receivable over sales. Columns 1 and 3 are estimated using all firms. Columns 2 and 4-8 use the subsample of 100 firms for which we hand-collected information on lines of credit. The top rowindicates the cash measure (Cash) and line of credit measure (LOC) that is interacted with the crisis dummies in each regression: Cash Reserves in columns 1 and 2, Excess Cash in columns 3 and 4,Cash reserves and LOC dummy in column 5, Cash reserves and LOC limit in column 6, Cash reserves and unused LOC in column 7, Cash + Unused balance in LOC in column 8. Cash and LOC variablesare measured at the second quarter of year 2006. Crisis 2007 is an indicator that equals to one from the third quarter of 2007 to the second quarter of 2008. Crisis 2008 is an indicator that equals to onefrom the third quarter of 2008 to the second quarter of 2009. All other variables are defined in tables 1 and 4. All specifications control for firms’ characteristics which include: size, age, tangibility, net profitmargin, sales growth, net worth, and total debt. All specifications include firm fixed effects. ***, **, or * indicates that the coefficient is significant at the 1%, 5%, or 10% level, respectively.
39

Table 8. Trade credit taken and credit constraints.
Kaplan Zingales
Whited Wu
Payout Ratio
No Debt Rating Dummy
Kaplan Zingales
Whited Wu
Payout Ratio
No Debt Rating Dummy
LOC Dummy LOC Limit Unused
LOC
(1) (2) (3) (4) (5) (6) (7) (8) (9) (10) (11) (12) (13)
Crisis 2007 -0.00659 -0.0149** -0.0116 0.0188 -0.00656 -0.0206** -0.0359 0.596*** 0.118* -0.0637 0.468*** 0.198** 0.212**[0.00576] [0.00651] [0.00915] [0.0190] [0.00697] [0.0104] [0.0855] [0.148] [0.0644] [0.100] [0.117] [0.0831] [0.0854]
Crisis 2007 * Constraint 0.00396 0.0891 -0.0160 0.0109 0.0536 1.882*** -1.154** 0.179 -0.486*** -0.916** -1.229**[0.00734] [0.0595] [0.0419] [0.0122] [0.0558] [0.484] [0.584] [0.113] [0.123] [0.406] [0.519]
Log of total assets 0.0487*** 0.0355** 0.0372*** 0.0372*** 0.0573*** -0.307** -0.293** -0.284** -0.273** -0.248** -0.238** -0.237**[0.0139] [0.0142] [0.0140] [0.0139] [0.0137] [0.121] [0.116] [0.117] [0.116] [0.115] [0.116] [0.116]
Log of age 0.00601 0.000822 0.00389 0.00417 -0.00511 1.086*** 0.538** 0.599*** 0.600*** 0.511** 0.587*** 0.569**[0.0249] [0.0266] [0.0259] [0.0243] [0.0244] [0.305] [0.227] [0.227] [0.226] [0.226] [0.226] [0.226]
Q 0.00256 0.00507 0.00698 0.00730 0.00352 -0.0628* -0.0742** -0.0707* -0.0672* -0.0762** -0.0664* -0.0645*[0.00467] [0.00479] [0.00472] [0.00472] [0.00462] [0.0381] [0.0370] [0.0372] [0.0369] [0.0368] [0.0369] [0.0369]
Net profit margin 0.0473*** 0.0491*** 0.0494*** 0.0488*** 0.0503*** 1.222*** 1.184*** 1.226*** 1.222*** 1.182*** 1.209*** 1.207***[0.00468] [0.00485] [0.00485] [0.00483] [0.00464] [0.107] [0.106] [0.106] [0.105] [0.105] [0.105] [0.105]
Current assets -0.116* -0.106 -0.156** -0.147** -0.130* -1.556** -1.511** -1.416** -1.388** -1.409** -1.535** -1.548**[0.0683] [0.0703] [0.0687] [0.0688] [0.0675] [0.633] [0.607] [0.610] [0.604] [0.600] [0.608] [0.608]
Sales growth -0.126*** -0.104*** -0.112*** -0.114*** -0.117*** -0.117 -0.111 -0.105 -0.111 -0.108 -0.112 -0.114[0.0108] [0.0113] [0.0110] [0.0110] [0.0107] [0.0999] [0.0970] [0.0977] [0.0969] [0.0963] [0.0968] [0.0968]
Debt over assets -0.116*** -0.0322 -0.0341 -0.0355 -0.149*** 0.123 0.153 0.0593 0.0498 0.0239 0.186 0.163[0.0387] [0.0406] [0.0392] [0.0393] [0.0380] [0.370] [0.346] [0.347] [0.345] [0.341] [0.353] [0.350]
Constant 0.654*** 0.372*** 0.434*** 0.420*** 0.418*** 0.346*** -0.0986 1.237 0.996 0.900 1.030 0.750 0.794[0.00314] [0.110] [0.114] [0.112] [0.110] [0.109] [0.995] [0.895] [0.898] [0.890] [0.883] [0.884] [0.884]
Firm Fixed Effects Yes Yes Yes Yes Yes Yes Yes Yes Yes Yes Yes Yes Yes
R-squared 0.000 0.016 0.013 0.014 0.014 0.016 0.152 0.159 0.149 0.148 0.159 0.150 0.151Observations 22,444 22,444 20,009 20,810 20,969 21,838 1,061 1,098 1,098 1,113 1,113 1,113 1,113Number of Firms 2,429 2,429 1,847 2,065 2,098 2,190 91 98 98 100 100 100 100
This table presents estimates from panel regressions explaining firm-level quarterly trade credit taken for quarters with an end date from July 1, 2005 to June 30, 2008. The dependent variable is accounts payable overcost of goods sold. Columns 1-6 are estimated using all firms. Columns 7-13 use the subsample of 100 firms for which we hand-collected information on lines of credit. The top row indicates the constraint measure ofthe firm (Constraint) that is interacted with the crisis dummies in the regressions of columns 3 to 13: Kaplan-Zingales index in columns 3 and 7, Whited-Wu index in columns 4 and 8, Dividend Payout Ratio in columns5 and 9, Dummy for no LT debt rating in columns 6 and 10, Dummy for availability of LOC in column 11, LOC limit in column 12, unused balances in LOC in column 13. Crisis 2007 is an indicator that equals to onefrom the third quarter of 2007 to the second quarter of 2008. All but the first specification control for firms’ characteristics which include: size, age, Tobin's Q, net profit margin, sales growth, current assets, and totaldebt. All specifications include firm fixed effects. ***, **, or * indicates that the coefficient is significant at the 1%, 5%, or 10% level, respectively.
10-k sample
None
Whole Sample
40
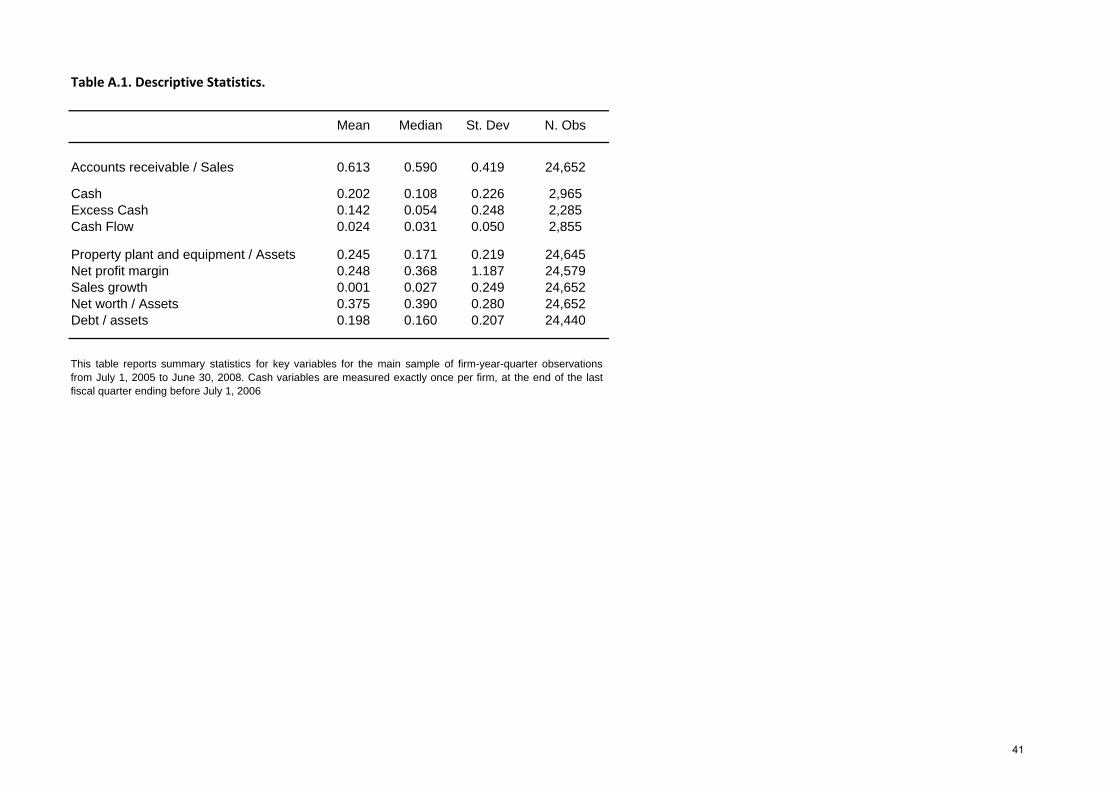
Table A.1. Descriptive Statistics.
Mean Median St. Dev N. Obs
Accounts receivable / Sales 0.613 0.590 0.419 24,652
Cash 0.202 0.108 0.226 2,965Excess Cash 0.142 0.054 0.248 2,285Cash Flow 0.024 0.031 0.050 2,855
Property plant and equipment / Assets 0.245 0.171 0.219 24,645Net profit margin 0.248 0.368 1.187 24,579Sales growth 0.001 0.027 0.249 24,652Net worth / Assets 0.375 0.390 0.280 24,652Debt / assets 0.198 0.160 0.207 24,440
This table reports summary statistics for key variables for the main sample of firm-year-quarter observationsfrom July 1, 2005 to June 30, 2008. Cash variables are measured exactly once per firm, at the end of the lastfiscal quarter ending before July 1, 2006
41

Table A.2. Descriptive Statistics subsample with information on lines of credit.
Year Obs Mean SD Median 75% 95% 99%
Panel A. Balance on line of credit (amount drawn)2005 77 23.4 63.1 0 8 154 3532006 79 30.2 65.1 0 19 200 3132007 78 46.8 102.0 0 54 288 6422008 77 83.0 181.4 6.1 90 400 1,1922009 76 38.9 101.2 0 28 257 710
Panel B. Limit on line of credit2005 77 333.11 872.3 75 250 1,600 6,8002006 79 330.79 820.6 100 250 1,600 6,4002007 78 360.70 834.2 101 300 1,868 6,4002008 77 352.88 783.6 146 300 1,314 6,0002009 76 323.55 707.8 99 300 923 5,200
Panel C. Used ratio on line of credit (balance over limit)2005 77 0.116 0.188 0.000 0.176 0.578 0.7622006 79 0.134 0.187 0.000 0.255 0.537 0.7002007 78 0.159 0.237 0.000 0.277 0.680 0.9022008 77 0.213 0.257 0.100 0.381 0.750 0.9072009 76 0.159 0.251 0.000 0.261 0.750 0.888
This table reports summary statistics for a subsample of 100 firms for which we hand-collected data from the SEC's 10-k annualfilings on lines of credit. Panel A provides summary statistics on the sum of the balance (used credit or drawn amount) in all lines ofcredit to a firm. Panel B reports the sum of the total limit (used and unused) in all lines of credit to a firm. Panel C reports summarystatistics of used ratio of lines of credit, which is computed as the balance over total limit . Data is annual and covers fiscal yearsending in 2005 to 2009.
42