Theory of the Firm: Managerial Behavior, Agency Costs and ...

2
Firm size, managerial practices and innovativeness:
some evidence from Finnish manufacturing
Heli Koski*, Luigi Marengo** , and Iiro Mäkinen*** ♦
Abstract
In this study we use a survey data on 398 Finnish manufacturing firms for the years 2002 and 2005 to empirically explore whether and which organizational factors explain why certain firms produce larger innovative research output than others, and whether the incentives to innovate that certain organizational practices generate differ between small and large firms, and between those firms that are operating in low-tech and high-tech industries. Our study indicates that there appear to be vast differences in the organizational practices leading to more innovation both between small and large firms, and between the firms that operate in high- and low-tech industries. While innovation in small firms benefits from the practices that enhance employee participation in decision-making, large firms that have more decentralized decision-making patterns do not seem to innovate more than those with a more bureaucratic decision-making structure. The most efficient incentive for innovation among the sampled companies seems to be the ownership of a firm’s stocks by employees and/or managers. Performance based wages also relates positively to innovation, but only when it is combined with a systematic monitoring of the firm’s performance. JEL codes: L25, M54, O31 Key words: Innovation, firm size, organizational practices, HRM practices
* Heli Koski, ETLA, Helsinki and Scuola Superiore Sant Anna, Pisa. E-mail: [email protected] ** Luigi Marengo, Scuola Superiore Sant Anna, Pisa. E-mail: [email protected] *** Iiro Mäkinen, ETLA, Helsinki and Stanford University. E-mail: [email protected]. ♦ The authors would like to thank Mikko Mäkinen for kindly letting us to use his survey data. We gratefully acknowledge the support to the research by the European Union, NEST Project CO3, Common Complex Collective Phenomena in Statistical Mechanics, Society, Economics, and Biology; and the 6th FP Network of Excellence DIME, Dynamics of Institutions and Markets in Europe. This paper is also part of a research program "Finland in Global Competition", financed by the Technology Industries of Finland Centennial Foundation, and the Finnish Funding Agency for Technology and Innovation (Tekes).

3
1. Introduction
What makes some firms more innovative than others? This fundamental question in the
economics and management of innovation has been tackled by different angles,
investigating the effects of industry, technology, size and, more recently, organization and
management. Size has been one of the first and foremost variables to be considered, also
because size, and in particular the distinction between small and large firms, appears to
capture many effects of the other explanatory variables. Small and large firms are indeed
likely to be different in many respects such as in regard to their market power, use of
technologies, access to financial sources, organizational structures, incentive systems, and
management styles.
However theoretical arguments and empirical evidence on how all these differences should
impinge on differential rates of innovation are far from being conclusive. Even Schumpeter
himself, as well known, supported opposite conclusions during his life. In his earlier
writings he argued that small firms are likely to be more innovative as they are less
bureaucratic, but later he stated that innovation increases more than disproportionately with
firm size and that larger firms with more market power tend to innovate more than the
smaller ones.
On empirical grounds, the claim that small firms contribute to technological change by
producing disproportionate share of innovations, relative to their R&D spending, has
gained mixed support (see, e.g., Symeonidis, 1996; Martinez-Ros and Labeage, 2002).
Typically, empirical investigations have focused on the relationship between innovation
output and firm size but they have not explicitly considered the underlying reasons for why
the firm size matters. Our study aims at shedding light on the organizational mechanisms
that produce differences in the firms’ innovation performance. We empirically explore

4
whether and which organizational factors explain why certain firms produce larger
innovative research output than others, and whether the incentives to innovate that certain
organizational practices generate differ between the small and medium size enterprises
(SME) and large firms, and between those firms that are operating in low-tech and high-
tech industries.
A relatively new but quickly growing literature tries to collect and elaborate micro
evidence, at the firm or plant level, on managerial practices, organizational structures and
relate it to performance differentials. The issue is not easy to tackle because both
managerial practices and organizational structures are vaguely defined notions, hard to
pinpoint precisely and even harder to measure. Among the many problems of definition
and measurement are the inherently qualitative, subjective, and ambiguous nature of
practices and structures, the often substantial differences between “formal” and “informal”
practices and structures, whereby the real working of the organization might rely mainly on
the latter and these might not be clearly known even to workers and managers themselves.
Finally, even when clearly defined these notions are hard to measure and quantify and
usually the observer can only state whether a practice or structural feature exist or not
without being able to measure the intensity and extent of application.
There are very few empirical studies that cast light on the relationship between firm
organization and innovation, and particularly on the question of which organizational
factors such as employee participation in decision-making, different management control
mechanisms and performance based reward systems affect the innovation performance of
the companies.1 Rogers (1999) finds, using a sample of 698 Australian firms from the years
1990 and 1995, that better employee-management communications is positively related to
1 On a slightly different line of enquiry, a group of works concentrate on studying the consequences of Human Resource Management practices and in particular on incentive pay and workforce participation in decision making and in the distribution of profits. Ichniowski et al. (1997) conduct a direct micro study of the consequences of HRM adoption in a specific production process in 26 US steel plants and find that the adoption of a system of HRM practices considerably raises labour productivity, whereas single practices in isolation do not have any significant effect

5
innovative changes in the workplace. Laursen and Foss (2003) use survey data from 1900
Danish firms to investigate the relationship between different human resource management
practices and innovation. Their study indicates that performance related pay and internal
training positively relate to innovation, as well as complementary implementation of
various HRM practices. The survey data analysis of Zoghi et al. (2007) suggests that the
decentralized decision-making, information-sharing programs and incentive pay plans
relate positively to the likelihood that an establishment introduces an innovation.
Closely related to our study is the stream of literature studying firm organization and
productivity. Jones et al. (2008), whose survey data we use in the present study, find
support for the positive relationship between HRM practices and productivity at the firm
level. Their study indicates though that the use of consultative committee and profit sharing
schemes are the only HRM practices that relate positively and significantly to a firm’s
productivity. Bloom and Van Reenen (2007) report results of a survey of 732 business
firms in US, UK, France and Germany on the adoption of some broadly defined managerial
practices.2 Their study finds a wide dispersion of managerial practices and evidence that
the adoption of best practices is linked to higher performance measures, e.g., in terms of a
firm’s productivity and profitability. Also Black and Lynch (2001) find that workplace
practices do matter for the firm performance when measured by profits and productivity,
and, more importantly, they find that it is not the mere adoption of a workplace practice but
rather its actual implementation within the establishment that is associated with higher
productivity. For example, use of total quality management (TQM) system has an
insignificant or negative effect on productivity unless its adoption is combined with a high
proportion of workers meeting regularly to discuss workplace issues.
2 Firms were interviewed on the adoption, reasons thereof and importance of some managerial practices. Questions were grouped into 18 issues, concerned with such practices as modern manufacturing, performance tracking and monitoring, targets, employees’ incentives, human capital management. For all these 18 groups a “best practice” was defined by the authors and scores were given from 1 to 5 as indicators of the degree of adoption of such best practices.

6
Kato and Morishima (2002) report the first results for Japanese manufacturing firms on the
productivity effects of clusters of employee participation practices. In their study, they
merged firm financial statement data with the HRM survey data on JLMCs (join labor-
management committees), SFCs (shop-floor committees), ESOPs (employee stock
ownership plans) and PSs (profit-sharing schemes). The key finding is that moving from
the traditional system of no HRM practices to a highly participatory cluster of HRMs will
lead to a significant 8-9 percent increase in productivity. Their findings also suggest that
the goal-alignment process needs to be supported both by direct methods (i.e. employee
financial participation) and indirect ones (i.e. employee participation in decision-making).
Conyon and Freeman (2004) examine the use and consequences of shared compensation
schemes in a sample of UK workplaces and firms in the 1990s. They find that shared
compensation practices are substantial and are growing in the UK; more than half of
workplaces have some form of shared compensation scheme. In addition, those firms and
workplaces with such compensation plans are more likely to establish formal
communication and consultation channels with workers and also tend to outperform other
firms. In part, according to Conyon and Freeman, the growth of the practices in the UK can
be attributed to government policies that introduced tax incentives to encourage shared
compensation plans in an attempt to enhance firm productivity. Black and Lynch (2004)
study how US manufacturing workers fare when firms adopt high-performance workplace
practices (HPWPs) such as employee involvement programs, job rotation, self-managed
teams, company-provided training, and incentive-based compensation plans. They find
evidence that HPWPs benefit workers economically; workers’ wages are higher in the
firms that use HPWPs than in more traditionally organized firms.3
3 However, these monetary gains do not seem to be distributed evenly with employees; nonproduction workers appear to be paid a wage premium, whereas compensation for production workers seems to be unaffected in HPWP establishments. The authors suggest that this is one channel that is linked to an increase in within-establishment wage inequality.

7
Another closely related literature concentrates on the performance differences between
small and large firms stemming from the different management and organizational
characteristics of firms of considerably different size. Holmström (1989) suggests that
organizational factors (such as the order of magnitude of bureaucracy and the assignment
of tasks across individuals and organizations) and reasons related to capital market
monitoring rather than purely the firm size as such may explain why the small firms tend to
produce relatively larger innovative research output the larger ones. Some empirical studies
that have analyzed the relationship between the firm’s ownership structure and innovation
suggesting that closer monitoring is positively related to innovation output (see, e.g.,
Francis and Smith, 1995).
Our empirical study contributes to this literature by investigating the relationship between a
firm’s organization, and particularly the firm’s use of different HRM practices, and
innovation. Our aim is to explore not only what are the organizational determinants of
innovation but also whether the relationship between organizational factors and innovation
differs between small and large firms, and between the firms operating on high-tech or low-
tech sectors. We use survey data collected via telephone interviews from the Finnish
manufacturing firms employing 50 or more employees in Statistics Finland’s business
register in September 2005 (i.e. TOL 2002 categories 15-37, based on SIC/NACE 2002
classification). The data were collected from 398 firms, covering about 38% of the total
population of 1,054 firms.4 Jones et al (2008), using the same data, show that the sampled
manufacturing firms represent well the total population of the Finnish manufacturing firms
in terms of industry and size. The survey data was combined with the Asiakastieto5
financial data concerning the sampled firms in 2002 and 2005, and with the data on the
4 See Jones et al. (2008) for a detailed description of the data collection procedure. 5 Asiakastieto is a Finnish company that collects, maintains and sells firm-specific financial and credit information.
8
firms’ patent applications we obtained from the database of National Board of Patents and
Registration of Finland.
This paper is organized as follows. Section 2 discusses theoretical arguments on the
relationship between firm size, organization and innovation, and formulates hypotheses for
the empirical analysis. It also introduces the explanatory variables of the estimated model.
Section 3 reports our empirical findings. Section 4 presents some conclusive comments.
2. Firm size, organization and innovation
We already summarized the Schumpeterian arguments on the relationship between a firm’s
innovation capacity and its size. Industrial organization theory further suggests that the
strategically different positions of small and large firms affect their innovation behavior.
Large incumbent companies have a smaller incentive to invest in producing radically new
technologies as new technologies may cannibalize their profit streams arising from old
technologies, whereas the small markets entrants have no profits to loose (see Gilbert and
Newbery, 1982).
Organizational economics provides different arguments for the underlying reasons why
firm size may matter in the production of innovations. For instance, as already mentioned,
Holmström (1989) argues that large firms’ different internal organization and relation to
the capital markets may make them differ from the smaller firms in their innovation
activities and performance. There are still quite few empirical studies shedding light on the
relationship between firm organization and innovation, and particularly to what extent the
organizational factors such as employee participation in decision-making, different
management control mechanisms and the performance based reward systems affect the
innovation performance of the companies.

9
According to the employee creativity literature, bureaucratic, control-oriented management
giving very little chances to the employees to participate into decision-making in a firm is
likely to hamper employee creativity and creation of innovations (see, e.g., Redmond et al.,
1993). In bureaucratic organizations with centralized decision making, the acceptance of
risky R&D projects is likely to involve a greater number of decision making layers and
especially if consensus is required among multiple parties, the implementation of
innovative projects becomes more complicated and time-taking. The argument was
suggested in general abstract terms by Sah and Stiglitz (1986) who model simple
organizations of individual agents who must evaluate projects, having a limited ability to
do so. Agents may incur into two types of errors: approve a bad project or reject a good
project and the aggregate error is analyzed for different organizational arrangements. In
particular, Sah and Stiglitz (1986) compare basic hierarchical and decentralized structures
and show that the former reject more projects (including good ones) than the latter, while
the latter accept more projects (including bad ones) than the former. In the presence of a
stream of risky innovative projects an increase of hierarchical layers should therefore
decrease the acceptance rate. Innovative projects may get delayed and particularly those
generating exceptional or radical innovations totally rejected during the process.
Organizational structures that decentralize decision making by employing different modes
of practices that increase employees’ participation in decision-making such as autonomous
work teams and employee-involved councils at the firm level encourage teamwork among
employees and share and exchange of innovative ideas. The frequency of communication
between the management and employees and the employees direct involvement in the firm-
level decision-making are also likely to facilitate the exchange of information and, while
affecting the relationships of the employees to the management, lower the barriers to
acknowledge and further develop innovative solutions originating from the employees.

10
We measure employee participation by two variables, one of which (variable
EMPL_PARTICIP) captures the adoption of different formal organizational practices that
allow employee participation to decision-making at the firm-level, while the other (variable
EMPL_PARTICIP_FREQ) measures the frequency or the order of magnitude of employee
participation in the firm’s decision-making. The variable EMPL_PARTICIP is built by
summing up the five different dummy variable that get value 1, respectively, if i) the
employees have a representative(s) in the firm’s board, ii) the company has a firm-level
advisory board between employees and management, iii) the firm uses a suggestion
scheme, iv) the firms has autonomic teams, and v) regular developing discussions are
organized between the managers and the employees; and 0 otherwise. The variable
EMPL_PARTICIP_FREQ is the sum of two variables, the number of developing
discussions held between managers and employees per year and the number of firm-level
decisions that involve joint planning or joint decision making with the employees. Such
decisions are grouped in the questionnaire into seven decision making categories
concerning business strategies, major organizational changes such as mergers, adoption of
new technologies or equipment, the reduction of the firm’s personnel, work safety,
employee education, and the economic incentive mechanisms.
Bureaucracy is particularly the problem of the large firms (Holmström, 1989). Therefore,
our hypothesis is that the estimated coefficients of the variables EMPL_PARTICIP and
EMPL_PARTICIP_FREQ are significant particularly for the sub-sample of the large firms.
We also explore whether job rotation (the dummy variable JOB_ROTATION) is related to
patenting, as it is supposed to facilitate knowledge diffusion and thus potentially contribute
to innovativeness.
Incentive pay schemes are set to align the incentives of a firm’s employees and its owners,
and are expected to motivate employees and to produce better performance at the firm

11
level, and thus they should also encourage innovation that increases productivity and
financial performance. However, on the other hand, when managers are rewarded
according to the short-term performance of the company, they may be induced to act
myopically and favor such R&D projects that produce faster payback and better observed
performance in the short term (Holmström, 1989). This means that risky projects with
longer length and more uncertain outcome – i.e. those that are more likely to generate
radical innovations - are less often undertaken, and innovations tend to be only incremental.
A wage system based on performance may thus result in a firm’s management to have a
bias towards short-term profit maximization and reduce their incentives to undertake risky
R&D projects, resulting in less high quality innovations.6
We test the relationship between the implementation of performance based wage system
and innovation by the dummy variable PERFORM_PAY that gets value 1 if the firm
employs a performance based wage system, and 0 otherwise. We also control for the other
incentive pay mechanisms: whether a firm uses an option scheme for the management or
the personnel in general (the dummy variable OPTION_SCHEME) and whether it uses a
personnel fund (the dummy variable PERSONNEL_FUND). The ownership of a firm’s
stocks seems like a strong mechanism aligning the employees/management incentives with
the (other) owner’s of the firm. We control this by the variable STOCK_OWNED_EMPL
that gets value 1 if the firm’s employees and/or management own the firm’s stocks.
The two most commonly used incentive pay mechanisms is the performance based wage
system (64 % of observations) and the ownership of a firm’s stocks (52 % of observations).
The option scheme and personnel fund were adopted relatively rarely, only in, respectively,
6 % and 4 % of the cases. Some firms also used multiple incentive pay schemes. Figure 1
6 A rigorous test of this proposition should involve an estimate of the economic value of patents and not simply a patent count. The widely recognized tendency of patent offices to liberally grant patents also to innovations of very little value and importance (e.g. Bessen, 2008), makes patents a rather bad indicator of high quality innovation. However, an estimate of the economic values of the patents of Finnish firms is outside the scope of what we can do in the present study (see Bessen (2008) and Hall, Thoma and Torrisi (2007) for recent examples of such estimates).
12
shows that there is almost no difference in the average number of used incentive payment
mechanisms between high-/medium-high-tech and low-/medium-low-tech firms, but there
is clearly a difference between small and large firms: large firms tend to adopt a greater
number of incentive payment systems than the smaller ones (about 1.7 against 1.2 in 2005).
- FIGURE 1 HERE -
It seems plausible that the organizational practices that are adopted to foster and control the
quality of a firm’s products and to monitor the firm’s performance may also alter the
innovation environment of the firm. Continuous emphasis on quality improvements is
likely to materialize also into a greater allocation of a firm’s resources to innovative
activities fostering quality, and thus positively relates to the firm’s innovation output. We
measure organizational practices focusing on quality improvements by the dummy variable
QUALITY that gets value 1 if a firm’s uses quality circles, the total quality management
(TQM) system, or the quality management system based on ISO9000 standard, and 0
otherwise.
A systematic monitoring of the firm’s performance may give incentives for the employees
to perform better, particularly if their salary depends on the firm’s performance. When
monitoring is weak, it is difficult to motivate the employees to undertake risky innovation
activities.7 On the other hand, closer monitoring of the firm’s performance may result in a
short-sighted behavior targeted to short-term profit maximization. Then, monitoring may
prevent the firm’s management or employees to undertake highly risky activities that less
likely result in observable output than research and/or development in the areas where the
7 Particularly at the firm’s R&D department close monitoring maybe important as, since innovation is uncertain and risky, the failures that are independent from the worker’s efforts become more likely and more tolerance for errors are needed especially in the context of the performance based reward system.
13
improvements are incremental but visible in the short-term. The relationship between
closer monitoring and a firm’s innovation performance is thus an empirical question.
The variable MONITOR takes value 1 if a firm uses balanced scorecard (or other similar
tools that monitor a firm’s performance against its strategic goals) or benchmarking
comparison8 to monitor the firm’s performance, and 0 otherwise. As noted above, we
expect that the mere monitoring may not have substantial impact on a firm’s performance
but when combined with the economic incentives for workers via performance based
wages, we should observe significant performance implications. The dummy variable
MONITOR_PERF_PAY captures the organizational practices combining the performance
based wage system and monitoring firm performance using balanced scorecard or
benchmarking comparison and further reporting the performance outcome to the
employees.
Holmström (1989) further suggests that the concern for reputation in the capital markets
may induce managers to act more cautiously and not to undertake risky projects.
Continuous assessment of the firm’s stock market performance may thus have negative
long-run effects on innovation. We control the firm’s reputation by the variable
REPUTATION that get values from 0 to 6 according to the debt rating class of the firm -
assigned by the leading Finnish rating company Asiakastieto - from, respectively,
“poor”=C to “excellent”=AAA. These rating assessments capture the firm’s financial
strength, and are commonly used by the investors to evaluate the financial performance and
future prospects of the companies. We assume that the higher debt rating class means
greater financial reputation among the investors, and thus the variable REPUTATION is
negatively related to the number of applied patents.
8 Benchmarking comparison means that a firm collects quantitative and qualitative data from its practices and performance, and compares them against other similar (in terms of, e.g., size and industry) firms, typically those applying “best practices” in the industry.

14
Overall, if the implications of organizational economics are valid, we should observe that
the above discussed variables explain statistically significant variation in the firm’s
innovation output. Also, if these variables account for some variation that is typically
captured by a firm size variable in the empirical estimations, we should observe that firm
size has significantly lower effect on innovation when the organizational factors are
included into the estimated model. Thus, the estimated coefficient of the firm size variable
and its significance should decrease when the organizational factors are added to the
model. To test this hypothesis, we first estimate the models for the patent counts without
the organizational explanatory variables and then compare the estimates to the ones
obtained when these variables are included.
Control variables:
Furthermore, we control for various factors that may account for the variation in the
innovation output of the firms. First, for some firms the creation and launch of new
innovative products forms a more important part of their competitive strategy, and they
invest more in the development of innovations. We don’t have information on the firms’
R&D expenditures but we can distinguish firms focusing more on innovation creation than
others by the variable INNOVATIVE_PRODUCTS that gets value 1 if innovative products
are the most important competitive means of the main product of a firm, and 0 otherwise.
Second, the ownership structure of a firm may also matter: individual- or family-owned
firms may differ in their innovation behavior from others (see, e.g., Gudmundson et al.,
2003). The dummy variable FAMILY-OWNED distinguishes companies that are owned by
an individual or family from others. Family-owned firms are clearly smaller than the
others; about 85% of them are SMEs, while the correspondent percentage of SMEs is 70
among the other firms.

15
We also control for the births of new firms and the deaths of incumbents by means of the
variables ENTRY and EXIT that measure the logarithm of the number of firms entering
and exiting, respectively, the industry relative to the total number of the firms in a firm’s
industry using the 2-digit standard industrial classification (SIC). The entry and exit
dynamics relates to technological change in the industry, the emergence of successful new
firms and innovations and the collapse of the old, nonviable ones. For the incumbent firms,
more industrial turbulence is likely to mean more competitive pressures to generate both
cost-saving process innovations and the market expanding product innovations.
As the firms’ propensity to patent varies substantially between different industries, we use
dummy variables to control for a firm’s industry (at the 2-digit level).
3. Empirical estimations
Our empirical analysis aims at explaining variation in the number of patent applications the
sampled firms have filed in Finland in 2002 and 2005. We are particularly interested in
whether the innovation dynamics differs between the small-medium and large firms9, and
whether different organizational practices (especially practices of so-called Human
Resource Management) create a fruitful environment for innovation among the firms in
high-/medium-high-tech and/or low-/medium-low-tech industries (see Annex 1 for a
detailed description of what we mean by high- and low- high-/medium-high-tech and low-
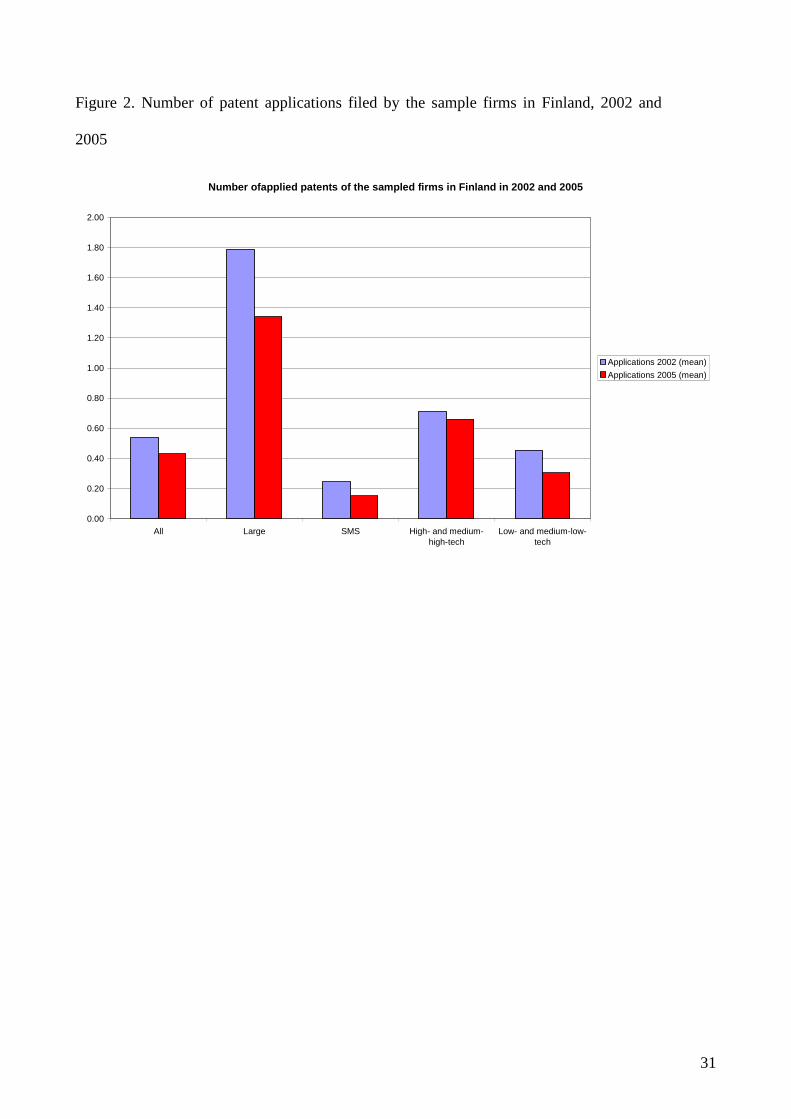
/medium-low-tech industries). Figure 2 shows that large firms file, obviously, more patent
applications than other firms, and that the average number of patents filed by firms in high-
and medium-high-technology industries is also higher than the sample average. Whether
and how these observed differences in the firms’ patenting behavior relate to their use of
9 We use the EU definition of SME and large firms: we define a company to be large if it employs at least 250 employees, and otherwise small or medium sized.

16
different organizational practices is an empirical question that the below reported analysis
aims shedding light on.
- FIGURE 2 HERE -
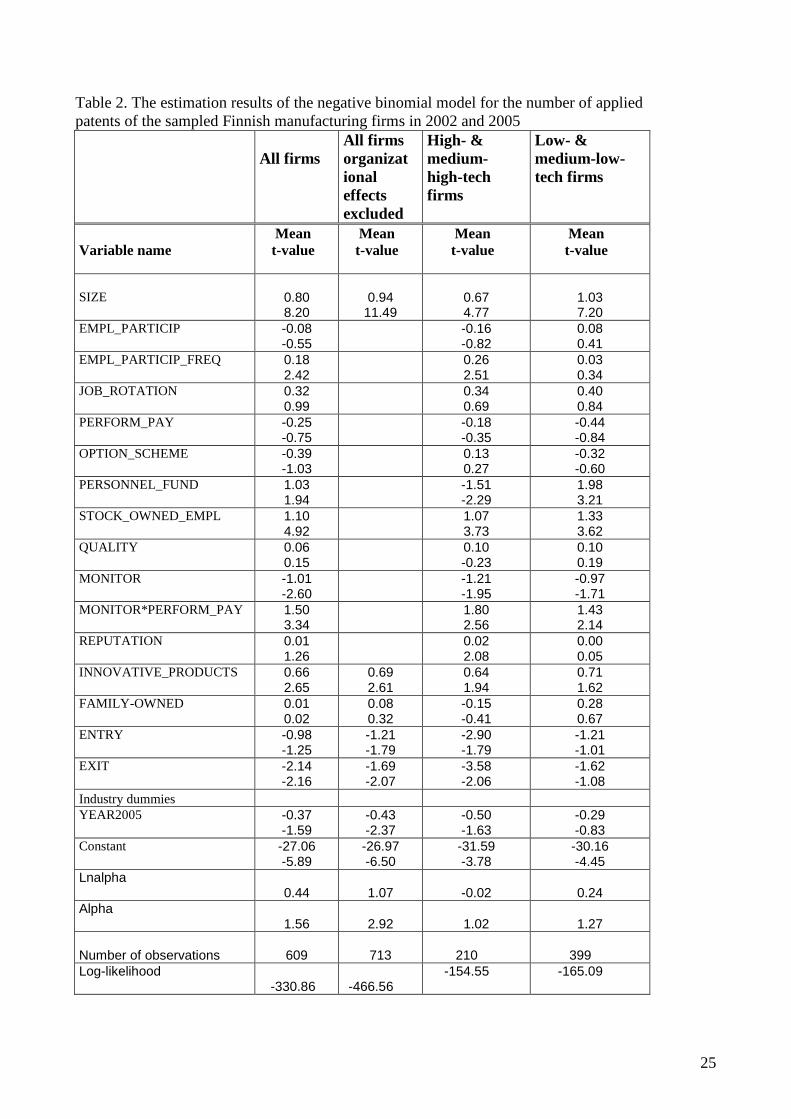
We estimated the negative binomial regression model for the number of patents a firm has
applied for in Finland in 2002 and 2005 using the whole sample and the different sub-
groups of firms10 to explore the relationship between the firm size, organizational factors
and innovation. The estimated standard errors are robust to heteroscedasticity and serial
correlation. Tables 2-4 present the estimation results of the models.
The estimated coefficient of the firm size variable is positive and statistically significant in
all the estimated equations. When we add the organizational factors to the estimated
equations, the size variable remains statistically significant but its estimated coefficient is
lower and has less statistical significance than when the organizational variables are
excluded from the estimated equation. Thus, a part of the variation in firms’ innovation
performance that is believed to relate to the firm size, when the organizational factors are
ignored, actually relates to the different organizational practices and arrangements of the
small and large firms.
The estimated model for all firms indicates that the order of magnitude of employee
participation in a firm’s decision-making relates positively to its innovation output. Further
estimations among the sub-samples of the data, however, show that the variable
EMPL_PARTICIP_FREQ is positively and significantly related to innovation only among
the SMEs, and particularly among the high- and medium-high-tech SMEs, while in the
estimations among the low- and medium-low-tech companies the variable is not
10 Among the sample of large firms, we could not estimate separate models for the low- and high-technology groups.
17
statistically significant. This empirical result hints that the decentralization of decision-
making power benefits much more high-tech companies than those functioning in low-tech
industries. This finding is not surprising as often high-technology SMEs face an
environment in which circumstances tend to change fast, requiring fast adaptation, and
successful firms launch new products frequently. We do find, however, that the low- and
medium-low-tech SMEs that have adopted a higher number of different formal
organizational practices allowing the employees to participate into a firm’s decision-
making tend to file more patent applications than other low tech SMEs.
Among the large firms, the two variables measuring employee participation in the firm’s
decision making do not appear statistically significant. This is opposite to our hypothesis
that particularly the (bureaucratic-by-nature) large firms should benefit from the
decentralization of the decision making. Consistently with this idea, the descriptive analysis
of our data shows that the large firms adopt, on average, a higher number of different
formal organizational practices that allow employee participation to decision-making at the
firm-level than the smaller ones. The t-test confirms that this difference is also statistically
significant. The average frequency or order of magnitude of employee participation in a
firm’s decision making does not, instead, differ significantly between the SMEs and large
firms.
We also find that among the high- and medium-high-tech and the large firms, the firm’s
stock market performance positively relates to its innovation performance, and it other
estimated equations the estimated coefficient of the variable REPUTATION is not
statistically significant. These empirical findings do not provide any evidence that
monitoring arising from the stock market would generate such short-term profit
maximization of a firm’s managers that has detrimental influence on innovation. It rather
seems likely that the stock market performance of the high-tech and large firm’s that patent

18
more than average, perform better than the average companies due to their greater
innovativeness which is materialized as a greater number of patents. This finding is also in
line with the evidence that in the high-tech industries, in which the firms’ success is often
driven by innovation, patenting is used as (positive) signal of firm performance for the
financial markets.
The incentive pay mechanisms do matter as well11: the variable STOCK_OWNED_EMPL
is positively and statistically related to a firm’s innovation performance in all of the
estimated equations. Also, it seems that generally the adoption of performance based wages
combined with performance monitoring enhances innovation, while performance
monitoring alone is negatively related to the innovation output. The estimated coefficient of
the variable MONITOR_PERFORM_PAY is greater in the estimations for the high- and
medium-high-tech firms than among the low- and medium-low-tech firms. This probably
relates to the different performance criteria that the high-tech and low-tech firms tie to the
performance based wages. The study of Balkin et al. (2000) finds that in high-tech firms,
the CEO compensation is directly related to innovation, while such a relationship between
CEO compensation and innovation does not exist in low-tech firms. When performance
based wages are related to other measures than innovation, the employees neglect
innovative activities and, instead, use their resources to such activities that are rewarded.
We also observe some clear differences between the sampled subgroups in the
effectiveness of the incentive pay systems. The large and the low- and medium-low-tech
firms seem to benefit from the use of personnel funds, whereas those high- and medium-
high-tech SMEs using personnel funds seems to perform worse in terms of innovation
11 In addition to the individual incentive pay mechanisms, we were also interested in whether complementarities matter in their use. In other words, does the implementation of various different incentive payment systems affect firm’s performance? To investigate this question, we experimented with the variable capturing the number of different incentive payment systems used by the firm. This variable, however, was not statistically significant in the estimated equations.

19
output than others. Also, those low-tech SMEs that have adopted an option scheme appear
to be inferior innovators compared to the other low-tech companies.
Among all estimated subgroups, except the low- and medium-low-tech SMEs, the firms
that have reported that innovative products are the most important competitive means of
their main product tend to patent more than other firms. The formal organizational
practices concentrating on quality seem, however, to have less importance. Only among the
large firms, the adoption of the organizational practices focusing on the quality of a firm’s
products seems to create a more fruitful innovation environment.
4. Conclusions
Our empirical exploration among the Finnish manufacturing firms indicates that firm
organization and use of different HRM practices influences the innovation output of a firm.
Interestingly, we find that firm size explains less variation in a firm’s innovation output
when organizational factors are included to the empirical analysis. When organizational
factors are ignored, a part of the variation in the dependent innovation variable captured by
the firm’s size arises from the use of different organizational practices of the small and
large firms.
Our finding on the significant positive relationship between the use of economic incentive
mechanisms and innovation is consistent with the (few) previous empirical studies on the
topic. Our empirical exploration sheds further light on the issue by showing that the type of
incentive-based compensation mechanism matters as well. The most efficient incentive-
based compensation means encouraging innovation among the sampled companies seems
to be the ownership of a firm’s stocks by the employees and/or managers. It seems that the
ownership of a firm efficiently aligns incentives of the employees/managers and the (other)
owners’ of the firm, and creates a favorable ground for innovative activities. The
20
performance based wages also enhances innovation, but only when it is combined with a
systematic monitoring of the firm’s performance.
Our study further indicates that one size does not fit all when it comes to the selection of
organizational practices creating a business environment that is fruitful for innovation.
There are vast differences in the organizational practices leading to more innovation both
between the small and large firms, and between the firms that are operating in high- and
low-tech industries. While innovation in the small firms tends to benefit from the practices
that enhance employee participation in decision-making, the large firms that have more
decentralized decision-making patterns do not seem to perform better in terms of
innovation than those with a more bureaucratic decision-making structure. It is likely that
this finding relates to the different organization of innovation in the large and small firms.
Large firms tend to have a more bureaucratic structure, with a greater number of
organizational levels, and they also more often have a separate R&D department than the
smaller firms. Thus, the employees’ greater involvement into decision-making at the firm-
level may not generate such exchange of information and knowledge that would benefit
innovation taking place primarily at the firm’s R&D department.
We find that among the large firms, unlike among the SMEs, a firm’s adoption of HRM
practices focusing on quality, such as the total quality management and the quality
management based on ISO9000 standard, relates strongly and positively to the firm’s
innovation performance. This finding further emphasizes differences between the
innovation environments of the small and large firms, and that organizational innovations
or use of HRM practices may have different performance implications for the firm
depending on its size.

21
References
Balkin, D.B., Markman, G. and Gomez-Mejia, L.R. (2000), Is CEO Pay in High Technology Firms Related to Innovation?, Academy of Management Journal 43, 1118–1129. Bessen, J. (2008). The value of U.S. patents by owner and patent characteristics, Research Policy 37, 932-945. Black, S.E. and Lynch, L. (2001). How to compete: The impact of workplace practices and information technology on productivity. Review of Economics and Statistics 83, 434-445. Black, S.E. and Lynch, L. (2004). What’s driving the new economy: The benefits of workplace innovation. The Economic Journal 114, F97-F116. Bloom, N. and van Reenen, J.V. (2007). Measuring and explaining management practices across firms and nations. Quarterly Journal of Economics 122, 1351-1408. Conyon, M.J. and Freeman, R.B. (2004). Shared modes of compensation and firm performance: UK evidence. in R. Blundell, D. Card and R. Freeman (eds), Seeking a Premiere League Economy, Chicago, University of Chicago Press, 109-146. Francis, J. and Smith, A. (1995). Agency costs and innovation. Some empirical evidence. Journal of Accounting and Economics 19, 383-409. Gilbert, R. and Newbery, D. (1982). Preemptive patenting and the persistence of monopoly. American Economic Review 72, 514-526. Gudmundson, D., Tower, C.B. and Hartman, E.A. (2003). Innovation in small businesses: Culture and ownership structure do matter, Journal of Developmental Entrepreneurship 8, 1-17. Hall, B., Thoma, G. and Torrisi, S. (2007), The Market Value of Patents and R&D: Evidence from European firms, NBER Working Paper No. 13426. Holmström, B.R. (1989). Agency costs and innovation. Journal of Economic Behaviour and Organization 12, 305-327. Ichniowski, C., Shaw, K. and Prennushi, G .(1997). The effects of human resources management practices on productivity: A study of steel finishing lines. American Economic Review 87, 291-313- Jones, D.C., Katao, T., and Mäkinen, M. (2008). The effects of human resource management practices on firm performance – preliminary evidence from Finland. Helsinki, ETLA Discussion paper No. 1121. Kato, T. and Morishima, M. (2002). The productivity effects of participatory employment practices: Evidence from new Japanese panel data. Industrial Relations 41, 487-520.

22
Laursen, K. and Foss, N.J. (2003). New human resource management practices, complementarities, and the impact on innovation performance. Cambridge Journal of Eocnomics 27, 243-263. Martinez-Ros, E. and Labeage, J.M. (2002). The relationship between firm size and innovative activity: A Double decision approach and an application to Spanish manufacturing firms. Economics of Technological Innovation 11, 35-50. Redmond, M., Mumford, M.D. and Teach R. (1993). Putting creativity to work: Effects of leader behavior on employee creativity. Organizational Behavior and Human Decision Processes 55, 120-151. Rogers, M. (1999). Innovation in Australian workplaces: An empirical Analysis. Australian Bulletin of Labour 24, 334-351. Sah, R. K., and J. E. Stiglitz (1986): The architecture of economic systems: hierarchies vs. polyarchies, American Economic Review 76, 716-727. Symeonidis, G. (1996). Innovation, firm size, and market structure: Schumpeterian hypotheses and some new themes. Paris, OECD Economics Department Working Papers No. 161. Zohgi, C., Mohr, R.D. and Meyer, P.B. (2007). Workplace organization and innovation. BLS Working Papers. U.S. Department of Labor. U.S. Bureau of Labor Statistics. Office of Productivity and Technology. Mimeo.

23
Table 1. Description of the explanatory variables
Description of variable
Variable name
Mean
Standard deviation
Log firm’s annual revenues.
SIZE 16.85 1.30
Sum of five dummy variables that get value 1, respectively, if i) employees have representative(s) at firm’s board, ii) company has a firm-level advisory board between employees and the management, iii) firm uses the suggestion scheme, iv) firm has autonomic teams, and v) regular developing discussions are organized between managers and employees, and 0 otherwise.
EMPL_PARTICIP 2.62 1.10
Sum of two variables: number of developing discussions held between managers and employees per year and number of firm-level decision categories out of seven (decision making concerning firm’s business strategies, major organizational changes such as mergers, adoption of new technologies or equipment, reduction of personnel, work safety, employee education, economic incentive mechanisms) that require joint planning or joint decision making with the employees.
EMPL_PARTICIP_FREQ 4.09 1.87
Dummy variable that gets value 1 if firm uses job rotation, 0 otherwise
JOB_ROTATION 0.78 0.41
Dummy variable that gets value 1 if firm uses performance based wage system, and 0 otherwise. PERFORM_PAY 0.64 0.48 Dummy variable that gets value 1 if firm uses an option scheme for the total management/personnel, 0 otherwise.
OPTION_SCHEME 0.06 0.24
Dummy variable that gets value 1 if firm uses personnel fund, 0 otherwise. PERSONNEL_FUND 0.04 0.20 Dummy variable that gets value 1 if wage system rewards performance at the level of individuals, and 0 otherwise. STOCK_OWNED_EMPL 0.52 0.50 Dummy variable that gets value 1 if firm uses quality circles, total quality management (TQM) system, or quality management system based on ISO9000 standard, and 0 otherwise. QUALITY 0.82 0.38 Dummy variable that gets value 1 if firm uses balanced scorecard (or other similar tool) or benchmarking comparison to monitor the firm’s performance, and 0 otherwise. MONITOR 0.72 0.45 The dummy variable that gets value 1 if firm uses balanced scorecard or benchmarking comparison to monitor the firm’s performance, informs employees
MONITOR_PERFORM_PAY 0.46 0.50

24
about the achieved performance, and uses performance based wages, and 0 otherwise. Firm’s debt rating class (assigned by the leading Finnish rating company Asiakastieto): Excellent: AAA = 6 good+ AA+ = 5 good AA = 4 satisfactory+ A+ = 3 satisfactory A = 2 fair B = 1 poor C = 0
REPUTATION 81.68 15.58
Dummy variable that gets value 1 if innovative products are the most important competitive means of firm’s main product, and 0 otherwise.
INNOVATIVE_PRODUCTS 0.14 0.35
Dummy variable that gets value 1 if firm is owned by domestic family or individual, and 0 otherwise. FAMILY-OWNED 0.34 0.47 Log number of firms entering the industry relative to total number of firms in firm’s industry using the 2-digit standard industrial classification (SIC). ENTRY -2.84 0.24 Log number of firms exiting the industry relative to total number of firms in firm’s industry using the 2-digit standard industrial classification (SIC). EXIT -2.88 0.24 Dummy variable that gets value 1 in case of year 2005, and 0 otherwise. YEAR2005 0.55 0.50 + Industry dummies (at the 2-digit level using NACE 1.1 industrial classification)
25
Table 2. The estimation results of the negative binomial model for the number of applied patents of the sampled Finnish manufacturing firms in 2002 and 2005
All firms
All firms organizational effects excluded
High- & medium-high-tech firms
Low- & medium-low-tech firms
Variable name
Mean t-value
Mean t-value
Mean t-value
Mean t-value
SIZE
0.80 8.20
0.94 11.49
0.67 4.77
1.03 7.20
EMPL_PARTICIP
-0.08 -0.55
-0.16 -0.82
0.08 0.41
EMPL_PARTICIP_FREQ
0.18 2.42
0.26 2.51
0.03 0.34
JOB_ROTATION
0.32 0.99
0.34 0.69
0.40 0.84
PERFORM_PAY
-0.25 -0.75
-0.18 -0.35
-0.44 -0.84
OPTION_SCHEME
-0.39 -1.03
0.13 0.27
-0.32 -0.60
PERSONNEL_FUND
1.03 1.94
-1.51 -2.29
1.98 3.21
STOCK_OWNED_EMPL
1.10 4.92
1.07 3.73
1.33 3.62
QUALITY
0.06 0.15
0.10 -0.23
0.10 0.19
MONITOR
-1.01 -2.60
-1.21 -1.95
-0.97 -1.71
MONITOR*PERFORM_PAY
1.50 3.34
1.80 2.56
1.43 2.14
REPUTATION
0.01 1.26
0.02 2.08
0.00 0.05
INNOVATIVE_PRODUCTS
0.66 2.65
0.69 2.61
0.64 1.94
0.71 1.62
FAMILY-OWNED
0.01 0.02
0.08 0.32
-0.15 -0.41
0.28 0.67
ENTRY
-0.98 -1.25
-1.21 -1.79
-2.90 -1.79
-1.21 -1.01
EXIT
-2.14 -2.16
-1.69 -2.07
-3.58 -2.06
-1.62 -1.08
Industry dummies YEAR2005
-0.37 -1.59
-0.43 -2.37
-0.50 -1.63
-0.29 -0.83
Constant
-27.06 -5.89
-26.97 -6.50
-31.59 -3.78
-30.16 -4.45
Lnalpha 0.44 1.07 -0.02 0.24 Alpha 1.56 2.92 1.02 1.27
Number of observations 609 713
210
399 Log-likelihood -330.86
-466.56
-154.55 -165.09

26
Table 3. The estimation results of the negative binomial model for the number of applied patents of the large Finnish manufacturing firms in 2002 and 2005
Large firms
Variable name
Mean t-value
SIZE
0.91 4.89
EMPL_PARTICIP
0.08 0.33
EMPL_PARTICIP_FREQ
-0.10 -0.69
JOB_ROTATION
-0.36 -0.51
PERFORM_PAY
-1.04 -1.32
OPTION_SCHEME
0.42 0.95
PERSONNEL_FUND
1.20 2.36
STOCK_OWNED_EMPL
1.27 3.15
QUALITY
14.51 12.44
MONITOR
-1.40 -1.85
MONITOR*PERFORM_PAY
2.27 2.89
REPUTATION
0.88 2.37
INNOVATIVE_PRODUCTS
0.88 2.37
FAMILY-OWNED
-0.39 -0.66
ENTRY
0.39 0.53
EXIT
1.29 1.70
MEDIUM-LOW-TECH
2.60 4.12
MEDIUM-HIGH-TECH
2.62 3.96
HIGH-TECH
0.56 0.89
YEAR2005
-0.21 -0.48
Constant
-32.20 -8.29
Lnalpha 0.35

27
Alpha
1.41
Number of observations
132
Log-likelihood
-137.54

28
Table 4. The estimation results of the negative binomial model for the number of applied patents of the Finnish manufacturing SMEs in 2002 and 2005
All SMEs
high- & medium-high-tech SMEs
Low- & medium-low-tech SMEs
Variable name
Mean t-value
Mean t-value
Mean t-value
SIZE
0.93 4.64
0.94 3.05
1.00 3.82
EMPL_PARTICIP
-0.08 -0.51
-0.57 -2.49
0.37 1.85
EMPL_PARTICIP_FREQ
0.23 2.59
0.32 2.42
0.11 1.01
JOB_ROTATION
0.29 0.78
0.55 1.27
0.25 0.43
PERFORM_PAY
-0.21 -0.67
-0.05 -0.09
-0.53 -0.93
OPTION_SCHEME
-1.24 -1.16
-1.17 -1.16
-17.00 -17.23
PERSONNEL_FUND
0.24 0.24
-16.52 -13.98
1.29 1.53
STOCK_OWNED_EMPL
1.03 3.35
0.96 2.26
1.39 2.76
QUALITY
0.11 0.31
0.31 0.64
0.09 0.18
MONITOR
-1.14 -2.71
-1.36 -2.20
-1.25 -2.07
MONITOR*PERFORM_PAY
1.46 3.09
1.23 1.76
1.52 1.96
REPUTATION
0.01 0.67
0.03 2.09
0.00 0.16
INNOVATIVE_PRODUCTS
0.73 2.29
0.78 2.09
0.33 0.49
FAMILY-OWNED
0.22 0.68
-0.13 -0.33
0.90 2.14
ENTRY
-0.18 -0.15
-3.51 -1.37
1.99 1.01
EXIT
-0.09 -0.05
-3.52 -1.18
-0.63 -0.26
+ Industry dummies
YEAR2005
-0.63 -2.13
-0.58 -1.31
-1.36 -2.26
Constant
-21.53 -2.51
-40.38 -2.33
-17.85 -1.68
Lnalpha 0.18 -0.77 0.14 Alpha 1.20 0.46 1.15

29
Number of observations
475
158
317
Log-likelihood
-186.75
-85.92 -90.09

30
Figure 1. Number of incentive payment mechanisms in use
Number of incentive payment mechanisms in use
0.00
0.20
0.40
0.60
0.80
1.00
1.20
1.40
1.60
1.80
SMS Large High-tech Low-tech
Year 2002
Year 2005
31
Figure 2. Number of patent applications filed by the sample firms in Finland, 2002 and
2005
Number ofapplied patents of the sampled firms in Finland in 2002 and 2005
0.00
0.20
0.40
0.60
0.80
1.00
1.20
1.40
1.60
1.80
2.00
All Large SMS High- and medium-high-tech
Low- and medium-low-tech
Applications 2002 (mean)
Applications 2005 (mean)

32
Annex 1. Definition of high-tech and low-tech industries
We use the following OECD classification to separate “high-tech” (high-technology and medium-high-technology) industrial sectors from the low-tech (low-technology and medium-low-technology) ones: High-technology NACE Revision 1.1 Aerospace 35.3 Computers, office machinery 30 Electronics-communications 32 Pharmaceuticals 24.4 Scientific instruments 33 Medium-high-technology Motor vehicles 34 Electrical machinery 31 Chemicals 24-24.4 Other transport equipment 35.2+35.4+35.5 Non-electrical machinery 29 Medium-low-technology Rubber and plastic products 25 Shipbuilding 35.1 Other manufacturing 36.2-36.6 Non-ferrous metals 27.4+27.53/54 Non-metallic mineral products 26 Fabricated metal products 28 Petroleum refining 23 Ferrous metals 27-27.3+27.51/52 Low-technology Paper printing 21+22 Textile and clothing 17-19 Food, beverages, and tobacco 15-16 Wood and furniture 20+36.1 Manufacturing n.e. 36-37