Firm size and human capital as determinants of ...
34
UNITED NATIONS INDUSTRIAL DEVELOPMENT ORGANIZATION AND CENTRE FOR THE STUDY OF AFRICAN ECONOMIES Department of Economics, University of Oxford Firm size and human capital as determinants of productivity and earnings* CSAE-UNIDO Working Paper No. 5 Prepared by Måns Söderbom, UNIDO Research Fellow at the CSAE, in co-authorship with Francis Teal United Nations Industrial Development Organization Vienna International Centre P. O. Box 300 A-1400 Vienna Austria Telephone: (43-1) 26026-5231 Fax: (43-1) 26026 6881 E-mail: [email protected] Internet: http://www.unido.org Centre for the Study of African Economies Department of Economics University of Oxford Manor Road Building Oxford OX1 3UQ UK Telephone: +44 (0)1865 271954 Fax: +44 (0)1865 281447 E-mail: [email protected] Internet: http://www.csae.ox.ac.uk/ * This Report has not been formally edited. The designations employed and the presentation of material in this publication do not imply the expression of any opinion whatsoever on the part of the Secretariat of the United Nations Industrial Development Organization concerning the legal status of any country, territory, city or area, or of its authorities, or concerning the delimitation of its frontiers or boundaries. The opinions, figures and estimates set forth in signed articles are the responsibility of the authors, and should not necessarily be considered as reflecting the views or carry the endorsement of UNIDO. The designations “developed” and “developing” economies are intended for statistical convenience and do not, necessarily, express a judgement about the stage reached by a particular country or area in the development process. Mention of firm names or commercial products does not imply endorsement by UNIDO.
Transcript of Firm size and human capital as determinants of ...

UNITED NATIONS INDUSTRIAL DEVELOPMENT ORGANIZATION
AND
CENTRE FOR THE STUDY OF AFRICAN ECONOMIES
Department of Economics, University of Oxford
Firm size and human capital as determinants of
productivity and earnings*
CSAE-UNIDO Working Paper No. 5
Prepared by
Måns Söderbom, UNIDO Research Fellow at the CSAE,
in co-authorship with Francis Teal
United Nations Industrial Development Organization Vienna International Centre P. O. Box 300 A-1400 Vienna Austria Telephone: (43-1) 26026-5231 Fax: (43-1) 26026 6881 E-mail: [email protected] Internet: http://www.unido.org
Centre for the Study of African Economies Department of Economics University of Oxford Manor Road Building Oxford OX1 3UQ UK Telephone: +44 (0)1865 271954 Fax: +44 (0)1865 281447 E-mail: [email protected] Internet: http://www.csae.ox.ac.uk/
* This Report has not been formally edited. The designations employed and the presentation of material in this publication do not imply the expression of any opinion whatsoever on the part of the Secretariat of the United Nations Industrial Development Organization concerning the legal status of any country, territory, city or area, or of its authorities, or concerning the delimitation of its frontiers or boundaries. The opinions, figures and estimates set forth in signed articles are the responsibility of the authors, and should not necessarily be considered as reflecting the views or carry the endorsement of UNIDO. The designations “developed” and “developing” economies are intended for statistical convenience and do not, necessarily, express a judgement about the stage reached by a particular country or area in the development process. Mention of firm names or commercial products does not imply endorsement by UNIDO.

ABSTRACT The evidence that earnings rise with firm size and that human capital affects earnings based on labour market data are two of the most robust empirical findings in economics. In contrast the evidence for scale economies in firm data is very weak. The limited direct evidence of human capital on firm productivity suggests that human capital is indeed productive and that the magnitudes are consistent with the findings based on individual data. The common objection to accepting the role of size and human capital as determinants of either earnings or productivity has been the role of unobserved factors. In this paper we investigate the roles of size and human capital in determining both earnings and productivity using a panel data set of matched labour firm data which allows us to control for such factors. We argue that neither the unobservable quality of labour, nor the unobservable characteristics of the workplace, is the source of the relationship between firm size and earnings, and that this effect can have a rent-sharing interpretation. For our data human capital is of minor importance in explaining either the distribution of earnings or productivity across firms of differing size.
ACKNOWLEDGEMENT The data used in this paper were collected by a team from the Centre for the Study of African Economies, Oxford, the University of Ghana, Legon and the Ghana Statistical Office (GSO), Accra over a period from 1992 to 1998. We are greatly indebted to staff from the GSO for their assistance. The surveys from 1992 to 1994 were part of the Regional Program on Enterprise Development (RPED) organised by the World Bank. The questionnaire was designed by a team from the World Bank. The surveys have been funded by the Department for International Development of the UK government and the CSAE is funded by the Economic and Social Research Council of the UK. Stephen Bond and Frank Windmeijer have been very helpful in enabling us to use their programs to estimate the regressions reported in this paper. We would like to thank Abigail Barr, Arne Bigsten, John Knight, Eric Strobl and Anthony Wambugu for comments on an earlier version of this paper.

1
1 Introduction
Why do we observe such a large dispersion of labour productivity, capital intensity and
earnings by firm size both in developed and developing countries? In this paper we use firm-
level panel data from Ghana’s manufacturing sector and consider three potential answers to
that question. The first is that large firms use more skilled labour than small ones and this
explains the higher labour productivity and higher earnings. Oi and Idson (1999) pp.2189-
2207 survey the reasons why firm size and many dimensions of workforce skills and
workplace characteristics may be correlated. The second potential answer relates to
technology. If large and small firms operate with distinct technologies, this may explain why
we observe substantial differences in capital intensity over the size range. A comprehensive
discussion of this issue in the context of Indian industrial policy can be found in Little,
Mazumdar and Page (1987). The third possible explanation we consider is that of
imperfections in the factor markets, both for labour and capital. Information problems in
financial markets ensure a link from firm characteristics to investment decisions, Hubbard
(1998). One implication of these findings is that capital costs will differ by the size of firm if
size affects access to capital.
The first two of these explanations are consistent with competitive labour markets. In
particular, if the technology is non-homothetic, then factor ratios are predicted to change with
output even under constant factor prices (Pack, 1982). Further, large firms potentially benefit
from economies of scale. There is an extensive theoretical literature on their potential
importance in developing countries, however there is little empirical evidence to suggest that
they are large. Tybout (2000, p. 180) notes that while there is some evidence for locally
increasing returns to scale for very small enterprises, “scale economies are more consistently
missing in studies of microenterprises based on estimated production functions.”
The third explanation is in terms of imperfect factor markets. However, imperfections
in capital markets does not without qualifications explain why earnings would be higher in
large than in small firms. The reason may simply be that large firms with access to cheaper
capital use more skilled labour, e.g. because of complementarities between physical and
human capital. An alternative explanation is that there are imperfections in the labour market.
Empirical studies both for developed and developing countries indicate that firm size has
explanatory power in earnings regressions even when conditioning on human capital
variables, such as education and experience (see Brown and Medoff, 1989, and Troske, 1997,
for analyses based on U.S. data; see Mazumdar, 1983, and Valenchik, 1997, for evidence
from developing countries). This would be consistent with the textbook model of a
competitive labour market if unobserved skills, or workplace characteristics which affect

2
productivity, were associated with firm size. If, controlling for all such factors, size remains
significant then this may be indicative of non-competitive markets.
These issues are by no means new ones. Blanchflower et al (1996, p. 227), for
instance, point out that “one of the oldest questions in economics is that of whether the market
for labor can be represented satisfactorily by a standard competitive model”. Testing and
distinguishing between various hypotheses has proved difficult however, mainly because of
the impact of unobservable variables and because, in some cases, directions of causality are
inherently difficult to determine in cross-section data. The data set we use in this paper
enables us to address such difficulties. We use detailed panel data on manufacturing firms in
Ghana, which not only enables us to control for unobserved heterogeneity by including
controls for firm fixed effects, but also provides us with a rich set of potential instruments
enabling us to address issues of endogeneity and measurement errors in explanatory variables.
Applying an efficient generalised method of moments (GMM) estimator to these data, we can
therefore interpret the empirical findings as causal results. Another attractive feature of the
data set is that it contains matched firm-level employee data, so that we can use individual
information about the characteristics of the workforce to create firm-level human capital
variables.
In the next section we set out how we intend to capture the effects of observable skills
and unobserved factors in determining both productivity and earnings. The data is described
in Section 3. The production function is estimated in Section 4, and the relationship between
earnings and firm size is investigated in Section 5. Explicit tests for competitive labour
markets are carried out in Section 6. A final section concludes.
2 Modelling Productivity and Earnings
To determine the role of human capital and firm size in determining productivity and earnings
we will focus on the production function and the earnings equation. The production function
estimates will enable us to characterise the technology with which firms operate and shed
light on the importance of human capital for productivity performance. The dimensions of
technology which we are most interested in investigating are i) if there is any evidence that
technology is non-homothetic, in which case factor intensities may vary with firm size even
under constant factor prices; ii) if there is any evidence for increasing returns to scale, in
which case firms would have incentives to expand employment, possibly leading to an
upward pressure on earnings; and iii) how human capital impacts on productivity
performance. The estimated earnings function will inform the analysis of the role of human
capital and size as determinants of earnings, and it will form the basis for testing for
imperfections in the labour market. For the latter purpose it is useful to evaluate the estimated

3
earnings function both independent of, and in conjunction with, the production function
results.
Human capital, productivity and the technology
In our analysis of the technology we shall initially assume that the production function can be
approximated by a translog specification (Berndt and Christensen, 1972). We write this in
general notation as
[1] ,
lnln21lnlnln 1,
itt tti
k m mitkitkmj jitjittiit
D
XXXhYY
εδµ
ββαλ
+++
+++=
�
� ��−
where i and t are firm and time subscripts, Y is output1, h is a vector of human capital
characteristics, Xj is the j:th input in the production process, j=1,2,…, J, iµ is a firm specific
effect, the Dt are time dummies measuring common shocks to the firms over time, ε is a
serially uncorrelated random shock to productivity and α, λ, β and δ denote parameters to be
estimated. The translog specification is attractive because of its flexibility, in the sense that it
nests or approximates a number of popular models in the literature. As discussed above the
translog form is especially useful because it allows tests for whether the technology is non-
homothetic, Little, Mazumdar and Page (1987) proceed in this way. We shall also test for
constant returns to scale, and for the standard Cobb-Douglas form implied by the restriction
on [1] that βkm= 0 for all k, m. If the latter restriction holds, we obtain
[2] itt ttij jitjittiit DXhYY εδµβαλ +++++= ��− lnlnln 1, .
In our empirical analysis we will use as inputs in the production process labour,
denoted L, physical capital, K, raw material inputs, M, and indirect inputs, I, while the
arguments of the human capital vector, hit, are the average level of education, tenure and age
of employees in the firm. Our specification hence allows explicitly for the labour augmenting
aspect of human capital on labour input. This is easily seen in [2] where human capital
augmented labour (anti-logged) is eαhL, which follows Hall and Jones (1999) and Bils and
Klenow (2000). As will be seen below, this formulation is closely linked to the Mincerian
earnings equation. We include a lagged dependent variable in the production function to
1 We choose to model gross output rather than value-added in view of recent research by Basu
and Fernald (1995) showing that adopting a value-added production function can yield misleading results if there is imperfect competition or increasing returns to scale.

4
capture the fact that whenever factors of production are changed it may take time for output to
reach its new long-run level (see Nickell, 1996, for a similar specification). Further, we allow
for inter-firm differences in expected productivity due to firm specific effects, iµ , reflecting
for instance differences in managerial technology along the lines argued by Lucas (1978). We
allow these unobserved firm effects to be freely correlated with the inputs and the human
capital variables. Of course, the availability of panel data is crucial for being able to control
for firm specific effects in this manner, yet without such controls it would not be possible to
analyse the dimensions of firm performance with which we are concerned.2
Human capital, earnings and the labour market
Turning to the determinants of earnings, our point of departure is the standard Mincerian
framework stating that differences in individual log earnings are driven exclusively by
differences in human capital, hw α=ln . This will be an appropriate specification if the labour
market is competitive so that firms are wage-takers, and if the observed human capital
variables reflect true labour quality. However, as noted in the introduction, stylised facts both
from developed and developing countries typically show that earnings are positively
correlated with firm size even conditional on differences in human capital.3 As an initial step
towards a model incorporating labour market imperfections, we therefore augment the
Mincerian earnings function with a measure of firm size. Adding controls for unobserved firm
fixed effects, denoted iη , time dummies, a lagged dependent variable to capture the
adjustment process in earnings over time and a serially uncorrelated residual, itν , we hence
write our baseline earnings function as
[3] itit ttittiitit DLwhw νηθγρψ +++++= �− lnlnln 1, ,
2 Much of the work using panel data to analyse productivity and efficiency has used variants
of random effects models. A general class of such models, which specialises to several in the literature, is presented in Battese and Coelli (1992). Unfortunately, if the firm effects are correlated with the inputs then the technology parameter estimates from these models will be biased. This is an important issue given the question we are posing. If firms with better management are using more inputs, for instance, failure to control for this will lead to biased results.
3 Bulow and Summers (1986) suggest that large firms pay efficiency wages (see below) because monitoring is more expensive in large than in small firms. Oi and Idson (1999) argue that the observed size-earnings profile is essentially the result of omitted labour quality variables: large firms have a higher demand for skilled labour than do small firms, and to the extent that there are unobserved dimensions of skills, then, this will be absorbed by the size variable in size-augmented earnings regressions. Brown and Medoff (1989) suggest that firms that pay their workers more are more likely to survive and grow, and that the size effect therefore reflects omitted age effects. Masters (1969) advocates a theory of compensating wage differentials based on the premise that working conditions (which can be thought of as an unobserved variable) in larger firms are worse than in smaller ones, and that workers in large firms therefore must be compensated. Doeringer and Piore (1971) put forward a theory of internal labour markets, where as internal recruitment is less costly than hiring outsiders, large firms are willing to pay wage premiums to workers at low levels in the hierarchy in order to retain a sufficiently large pool of potential workers to consider for promotion.

5
where ψ, ρ, γ and θ are parameters to be estimated. This specification can hence be thought of
as forming a basis for a simple test of the neoclassical human capital model: if the latter is a
correct specification, then we would expect an insignificant coefficient on the size variable
once we control for unobservable characteristics of employees and their workplace. As we
shall see in the empirical analysis, however, size does turn out to have significant explanatory
power in our earnings regressions after such controls. We then probe the data further, as there
are several potential explanations for such a result. For our purposes it is of particular interest
to see if we can relate the size effect to imperfections in the labour market.
The issue whether labour markets can be represented by a standard competitive
model has been examined empirically by numerous authors, see Slichter (1950), Dickens and
Katz (1987), Krueger and Summers (1987, 1988), Katz and Summers (1989), Van Reenen
(1996) and Blanchflower et al (1996) for developed countries and Teal (1996), Valenchik
(1997) and Azam (2001) for developing countries. These studies document unexplained
industry or firm wage differentials and, in some cases, examine the link between wages and
firm or industry profitability. Blanchflower et al (1996) discuss three reasons why earnings
may be positively correlated with profitability. In the first framework the employees get a
share of the rents generated by the firm as a result of a bargaining process.4 Because this rent-
sharing process is an equilibrium outcome, predicting a long-run correlation between earnings
and profits per employee, it is inconsistent with the competitive labour market model. The
second framework is a competitive model where the short-run supply curve of labour slopes
upward. Firms in booming industries will hire more workers and accordingly move up the
labour supply curve, which puts an upward pressure on earnings. Hence this model predicts a
short-run correlation between earnings and levels of profit, and if the wage elasticity of labour
demand is less than unity, there will also be a short-run correlation between earnings and
profits per employee. In the long run, however, there will be no correlation as the labour
supply curve gradually becomes horizontal.5 The third theory is a labour contract model in
which risk-sharing is the optimal contract if both workers and the firm are risk averse. Shocks
to profitability will thus affect earnings as the firm is unwilling to bear the entire risk of
unforeseen income fluctuations, and therefore in the long run profits and earnings will be
positively correlated. Like the rent-sharing model, this risk-sharing framework is inconsistent
with competitive labour markets.
4 While the role of unions has been the traditional focus in bargaining theory, the model can
also be seen as one between “insiders” and the firm, where the insiders derive bargaining power from turnover costs (Van Reenen, 1996).
5 Hence this model is arguably less relevant at the firm-level than at higher levels of aggregation, if the assumption of a horizontal labour supply curve from the point of view of the firm is acceptable.

6
In the previous models causality runs from firm performance to earnings. An
alternative framework is that of efficiency wages, where causality runs in the reverse
direction (see Stiglitz 1974, Weiss 1980, Akerlof, 1982, Shapiro and Stiglitz, 1984, Akerlof
and Yellen, 1986, for theoretical rationales for the payment of efficiency wages and Raff and
Summers 1987, Wadhwani and Wall (1991), Levine (1992), Moll (1993), and Huang et al
(1998), for tests). This theory concerns situations where the firm offers workers wage
premiums in order to provide incentives for the workers to put forth more work effort. This
may be due to the need to prevent shirking, lowering turnover costs or improving the quality
of applicants. The common factor across the theories is that wages paid by the firm will be
higher than the outside wage option and that this will increase the productivity of the firm.
In the empirical analysis we shall focus on unobserved human capital, rent or risk
sharing and efficiency wages as potential explanations why earnings vary with size. The
theories of rent and risk sharing predict that earnings are affected by the performance of the
firm. Although rent and risk sharing have very similar predictions in terms of the effect of
performance on earnings, we propose to test for rent-sharing by adding to the baseline
specification [3] two proxies for the rents in the firm: profits per employee in time t, ( )itLπ ,
and the prediction of log of output in time t scaled by a firm specific time invariant constant,
( )( )iitYE ωln . For profits per employee we will follow the standard procedure in the literature
and use lagged values in the empirical specification, partly to mitigate endogeneity problems
(Blanchflower et al, 1996). To construct a measure of ( )( )iitYE ωln we will use the parameter
estimates from the production function, the idea being that workers base their expectations
about the rents available in the firm in the near future on the observed input levels. We write
our most general rent-sharing model as
[4] ( )( ) ( ) ( )
.
lnlnlnln 2,21,11,
itit tt
titiiitittiitit
D
LLYELwhw
νηθ
πτπτωϕγρψ
+++
++⋅+++=
�
−−−
While acknowledging that it is difficult to distinguish between rent and risk sharing, we argue
that significant coefficients on the lagged measures of rents would be indicative of rent
sharing rather than risk sharing. A significant coefficient on ( )( )iitYE ωln would be
consistent with both frameworks. In the empirical analysis we shall express the term
( )( )iitYE ωln as ( ) iitYE ωlnln − , where the latter term will go into the fixed effect.
Finally we can now readily test for efficiency wages. The wage premium paid by the
firm should enter the production function [2], assuming the Cobb-Douglas form is accepted
by the data, as an additional term:

7
[5] ititt ttij jitjittiit wDXhYY εφδµβαλ ++++++= ��− lnlnlnln 1,
As equation [5] controls for the human capital impact on productivity, adding the term in
earnings is equivalent to adding a premium in earnings. We will instrument and test for the
significance of this variable in determining productivity. If firms are paying efficiency wages
then the elasticity of output with respect to the wage will equal the elasticity with respect to
employment, see Levine (1992) for an application.
Econometric method: The generalised method of moments estimator
To be able to give the parameter estimates in the production function and the earnings
equation a causal interpretation, we need to deal with the fact that the explanatory variables
are likely to be correlated both with the equation error and with the firm specific effect. In the
production function, for instance, the regressors will be correlated with the equation error if
managers alter their inputs in response to contemporaneous shocks to output, while in the
earnings function firm size will be endogenous in that any effect from size onto earnings will
induce the firms to economise on labour. It is also likely that explanatory variables in both
equations are measured with error, which would lead to a downward bias in the estimated
coefficients. To address this problem we will use an instrumental variables approach, where
we exploit the panel dimension of the data and use lagged values of the explanatory variables
as instruments.6 As this approach rules out using the within transformation to wipe out the
firm effects (see e.g. Griliches and Hausman, 1986), we will take first differences. However,
recent research has shown that lagged levels will be weak instruments for contemporaneous
differences when data are highly persistent, potentially giving rise to finite sample bias and
poor precision of the estimates (Blundell and Bond, 1998). Therefore we follow Blundell and
Bond and combine the differenced equation with a levels equation to form a system
generalised method of moments (GMM) estimator, which uses lagged levels as instruments
for contemporaneous differences and lagged differences as instruments for contemporaneous
levels.7 Naturally, the legitimacy of this procedure hinges on the instruments being valid,
6 Clearly, this is one important benefit of panel data. In the case where the researcher has
cross-section data only, purging explanatory variables from simultaneity typically requires extraneous information of the kind rarely available in practice.
7 In highly persistent time series, lagged levels will be poor instruments for contemporaneous differences but lagged differences may still be good instruments for contemporaneous levels. For instance if X follows a random walk, Xt = Xt-1 + εt, implying ∆Xt = εt, then Xt-1 will be uncorrelated with ∆Xt, but ∆Xt will nevertheless be correlated with Xt. Blundell and Bond (1998) present results from a Monte Carlo experiment indicating that the system GMM estimator performs substantially better than the standard differenced GMM when the data are highly persistent. Recent papers following this approach are Blundell and Bond (2000), Blundell, Bond and Windmeijer (2000) and Windmeijer (2000).

8
which will be tested. We provide a brief discussion of the system GMM estimator in
Appendix 1.
3 Data and Descriptive Statistics
The data are drawn from surveys of Ghana’s manufacturing sector which have been
conducted over the 1990s. Annual data are available for the period 1991 to 1997. The data
was collected in face-to-face interviews with the firms’ management. At the same time as the
firms were surveyed a sample of workers and apprentices was chosen from each firm
designed to cover the full range of personnel employed by the firms. The objective was to
have up to 10 workers and 10 apprentices from each firm where firm size allowed. As a result
of this survey design it is possible to use the responses from workers in the firm to create
firm-level averages of worker characteristics. During the course of the surveys a sub-set of
153 firms have provided data on the components of value-added and sufficient information
that the capital stock, employment and the human capital stock of the firm could be calculated
for at least three consecutive years. In the regression we lag the physical capital stock by one
year so the maximum period over which we can observe the firms is six years. The resulting
unbalanced panel contains 732 observations. The three major additions to the primary data are
the derivation of physical stocks from investment flows, the calculation of firm-level human
capital stocks based on worker information and the construction of firm specific price indices
for outputs and material inputs. These prices, which differ for outputs and costs, are used to
deflate all output and inputs into constant price (1991) domestic currency prices. The
consumer price index is used to deflate earnings. All references in the text and tables refer to
these deflated values for output, input, physical capital stock and earnings
To obtain a measure of the human capital stock available to the firm it was necessary
to merge the worker with firm level information. The human capital stock comprises the
following elements: the age of the workforce, their education in years and the tenure of the
workers. In aggregating from the worker to the firm level it is necessary to use weights to
ensure that we can move from individual data to firm based averages. To do this we weighted
the human capital variables by the proportion of workers in a given occupational class within
the firm. Eight common occupational groups across the rounds of the survey were identified.
These occupational categories for the worker level data are matched with the occupational
categories given in the firm level data.8
The average size of firm, measured by employment across the seven rounds of the
data, is 67 employees and the standard deviation is 113, so the range of enterprises covered by
8 A data appendix explaining the details of this procedure is available on request from the
authors.

9
the survey is very large. Firms range in size from 2 to 841 employees. In order to provide a
perspective on the data Table 1 presents the variables we will be modelling. Four size
categories are identified: the micro which is firms with less than six employees, small those
with from 6 to 30, medium those with from 31 to 99, and large those with 100, or more,
employees. In Table 1 the variables presented have been purged of sectoral and time effects
as explained in the notes to the table. The rises in the log of output, and capital, per employee
in moving from micro to large firms is enormous. For output per employee the rise is nearly
three fold. For both output, and capital, per employee there is a monotonic increase over the
whole size range. In contrast the capital to output ratio is approximately constant across the
size range and the variation in human capital across the firms is much smaller. The figures for
earnings are firm-level hourly rates, defined as the sum of the basic wage and allowances, and
these rise by a factor of just over three across the size range identified. These firm-level wage
rates are derived from the individual labour data in a similar manner to that already described
for the human capital variables. The central issue posed by the data is how this very large
dispersion of labour productivity, capital intensity and earnings across firms of different sizes
is to be explained. The descriptive statistics simply confirm that it is not a sectoral effect and
not due to changes over the period of the survey.
4 Technology and the Determinants of Productivity
In addressing the issue of technology and productivity, three issues are central to our
investigation: whether technology is non-homothetic; whether there are increasing returns to
scale; and how human capital impacts on productivity performance. We begin by focussing
on the functional form of the production function. Table 2 shows summary statistics9 based on
non-dynamic translog production functions, where Column [1] is based on the OLS results,
Column [2] on the within estimator and Column [3] on the system GMM results. For neither
estimator can we reject the null hypothesis of homotheticity at conventional levels of
significance, suggesting that technology is not the reason why we observe differing factor
intensities over the size range. Further, we cannot reject the joint hypothesis of homotheticity
and constant returns to scale.10 Quasi-concavity is fulfilled by between 38 and 53 per cent of
the observations depending on which estimator is being used, while monotonicity is fulfilled
by between 55 and 63 per cent.11 The OLS and within estimators strongly indicate that the
9 The full set of the results is available from the authors on request. 10 See the notes under Table 3 for details on how we test for homotheticity and constant
returns to scale. 11 Monotonicity requires that each input has a positive marginal product, and quasi-concavity
requires that the bordered Hessian matrix of first and second partial derivatives of the production

10
Cobb-Douglas model is not an appropriate approximation of the technology with which firms
operate, as we in both cases can reject the simpler model at the 1 per cent level of
significance. Neither of these two models will yield consistent results in the presence of
endogeneity and measurement errors, however, so too much should not be made from this
finding and when we use instruments to address these problems in Column [3] we can easily
accept the Cobb-Douglas model (p-value = 0.73).
Given that the data appear to be consistent with a Cobb-Douglas specification we
proceed in Table 3 showing parameter estimates for this specification. Columns [1]-[3] show
OLS-estimates of various specifications of the Cobb-Douglas production function as a
benchmark. In Column [1], which is estimated without dynamics or fixed effects, all input
coefficients are positive and highly significant.12 These coefficients, directly interpretable as
elasticities of output, sum to 1.00 so we can easily accept constant returns to scale. In Column
[2] we control for firm fixed effects, which yields smaller elasticities than in Column [1]
including a collapsed coefficient on physical capital (0.0005).13 The input coefficients now
sum to 0.83, and the fact that we cannot reject constant returns at conventional levels of
significance (the p-value is 0.16) is due to the poorly identified capital coefficient.14 In
Column [3] we allow for dynamics. The results are very similar to those in Column [1] once
we compute the long-run values of the coefficients, and constant returns to scale is easily
accepted. The coefficient on the lagged dependent variable is equal to 0.18, which suggests
dynamics to be important though it quite probably also reflects omitted fixed effects and/or
serial correlation in the residual.
The results reported in Columns [1]-[3] are biased and inconsistent if explanatory
variables are endogenous or measured with errors. We therefore proceed to the system GMM
estimator. Throughout the analysis we will report two-step GMM estimates, and t-statistics
function are negative semi-definite. In the translog specification the marginal products and the partial derivatives depend both on the values of the inputs and on the estimated parameters, and we therefore investigate if monotonicity and quasi-concavity holds at each data point.
12 In the regression we control for industry heterogeneity by including sectoral dummy variables, time effects (due to, say, demand fluctuations or price changes not captured by the deflators) by wave dummies and location effects by dummies for geographical area. We do not report the associated coefficients in order to conserve space.
13 Numerous productivity studies based on firm-level data both from developed and developing countries report drastically lower input coefficients in the production function when going from OLS to a “within” specification (or, usually even more pronounced, first differences), see Roberts and Tybout (1997); Mairesse and Hall (1996); Griliches and Mairesse (1997); Blundell and Bond (2000). The main casualty is usually the coefficient on the capital stock, supposedly because the capital stock is especially difficult to measure accurately (Tybout, 1992).
14 If we exclude capital from the regression, we can reject constant returns at the 1 per cent level, suggesting decreasing returns to scale.

11
that are based on robust, finite sample corrected standard errors (see Windmeijer, 2000).15 In
order to facilitate comparison with Columns [1] and [2], our first system GMM model has
been estimated without the lagged dependent variable. Results are reported in Column [4].16
The estimated coefficient on employment is equal to 0.20, and significant at the 1 per cent
level, which can be compared with 0.14 in the OLS model and 0.11 in the within
specification. More dramatically, the estimated capital coefficient is 0.07, hence substantially
higher than in the OLS (0.03) and within (0.0005) specifications, and close to being
significant at the 5 per cent level (the p-value is 0.057). The input elasticities sum to 1.03, to
be compared to 0.83 for the within specification and 1.00 for the static OLS model. We
cannot, however, reject the hypothesis of constant returns to scale (p-value = 0.48). We
examine if the elasticity coefficients are stable across industries by interacting dummy
variables for sector with the inputs and testing for the significance of these interaction terms.17
The second part of the table reports the associated p-values for each input, and it is quite clear
that the assumption of constant slope coefficients is not very restrictive.
In Column [5], we add the lagged dependent variable to the set of explanatory
variables. To deal with the Nickell (1981) bias, we treat the lagged dependent variable as
endogenous, using instruments as outlined in the notes to the table. The coefficient on the
lagged dependent variable is 0.06, and insignificantly different from zero. This suggests that
firms adjust to their new long-run levels fairly rapidly, and it is therefore not surprising that
allowing for dynamics of this form has very little impact on the results. When computing the
implied long-run values of the coefficients, these are always very close to the coefficients
reported in Column [4].
The models in Columns [4] and [5] appear to be reasonably well specified. Once we
instrument the Cobb-Douglas specification appears to be fully acceptable. The Sargan and the
difference-Sargan tests indicate that the instruments are valid, and there is little evidence that
slope coefficients vary across industries. Further, the results appear to be reasonable. The fact
15 It is well known that the asymptotic standard errors in two-step GMM estimators can be severely downward biased in finite samples (e.g. Arellano and Bond, 1991). As a consequence, researchers often draw inference based on one-step GMM estimators, which are less efficient than the two-step estimators. However, Windmeijer (2000) shows how the asymptotic two-step standard errors can be corrected when the sample size is finite. Monte Carlo evidence reported by Bond and Windmeijer (2001) indicates that this procedure yields a much more reliable basis for inference than relying on the asymptotic standard errors.
16 See table notes for information about the instrument set. 17 The tests for heterogeneity across industries in slope parameters and for the translog
specification were based on the criterion-based test statistic ))()(( 22UR
RU JJND ββ −= , where U2β is
the two-step GMM estimator in the unrestricted model, R2β is the two-step GMM estimator in the
restricted model, and J( ) denotes the Sargan statistic. Under the null hypothesis, RUD follows a Chi-squared distribution with the degrees of freedom being equal to the number of restrictions (see Bond et al, 2000).
12
that the coefficients on labour and capital are higher than in the OLS specifications, whereas
those on raw materials and indirect costs are not, is according to our expectations. Raw
materials and indirect costs are flexible inputs that will be relatively easy to adjust in response
to changes in demand, thus resulting in feedback effects. Labour and capital are less flexible
and hence less susceptible to bias due to feedback effects18; further, they are probably more
difficult to measure accurately than materials, implying that the measurement error effect will
be more pronounced. Finally constant returns to scale cannot be rejected.
We have addressed two of our three concerns. From the production function we find
no evidence for non-homotheticity and, with constant returns to scale, owners will be
indifferent as to the scale of their output. What of the relative importance of human capital in
determining labour productivity? We know from Table 1 that there is a substantial differential
in labour productivity over size: large firms are on average about 170 per cent more
productive than micro firms and about 120 per cent more productive than small firms. How
much of the size differential in productivity is due to differences in factor inputs and how
much is due to differences in human capital? To answer this, we combine the parameter
estimates from Table 3 with differences in mean values of the regressors (purged of time and
industry effects) over size, to decompose the productivity differential into components
attributable to differences in observables. We use parameter estimates from Columns [3] and
[5], and the mean values for large and micro firms. Results are shown in Table 4. The
decomposition implied by the system GMM estimator gives a predicted total differential of
160 per cent, where 83 per cent is attributed to raw materials and indirect costs and 19 per
cent to capital intensity. This can be compared with the OLS model, where the contribution of
raw materials is 112 per cent and that of capital intensity is only 7 per cent. Naturally, these
discrepancies reflect differences in the estimated technology parameters. The contribution of
human capital is very modest in both models. The GMM estimates imply that tenure accounts
for about 5 per cent of the differential and education and age next to nothing.
5 Earnings and Firm Size
We use similar econometric techniques in estimating the earnings function as that used in the
last section for the production function. We use the same panel as that for the production
function and the human capital variables are directly comparable between the two functions.
In Table 5 Column [1] we present the OLS estimates for the standard Mincerian
earnings function based on firm level averages. The estimated coefficient on size is equal to
0.05 and significant at the five per cent level. The coefficients on education and age are
18 Also recall that the capital variable is lagged one period in all specifications.

13
significant at the five per cent level or better, while the estimated parameter on tenure is
significant at the ten per cent level.19 The results are very similar to that found in previous
studies using early rounds of this data set, Bigsten et al (2000) and Jones (2001).20 However
these specifications for the earnings function are inadequate for similar reasons to those
already discussed for the production function: the size effect will be endogenous in that any
effect from size onto earnings will induce the firms to economise on labour, it will be
correlated with firm fixed effects so the results, either at the individual or the firm level, are
wholly uninformative as to the true size effect on earnings. Introducing controls for fixed
effects in Column [2] more than halves the education coefficient, and substantially reduces
the importance of the age variable. The estimated coefficient on employment is 0.06, but not
significant. In Column [3] we allow for dynamics in the OLS specification, which reduces the
size coefficient considerably.
In Column [4] we present the first of the GMM estimates in which all the regressors
are treated as endogenous and we allow for a dynamic specification. The size effect is once
again substantial and significant at the ten per cent level. The model suggests that in the long
run a 10 per cent rise in firm size is associated with a 1.6 per cent rise in earnings. It will be
noted that the point estimate on education is negative while the estimates for average age are
much lower than those in the OLS. The coefficient on average tenure is identical between the
specifications. In Table 5 Column [5] we use a more restricted set of instruments to test if the
point estimates on size are sensitive to the instruments chosen.21 The result is no significant
change in the long run coefficients and the coefficient on the log of employment is now
significant at the 5 per cent level.22
What do the results imply as to the relative roles of size and human capital as
determinants of earnings? In Table 6 we present three decompositions of the effects of size
and human capital on the log of earnings based on the regressions from Table 5. In the first
column we use the OLS estimates from Table 5 Column [1]. The OLS estimates imply that
earnings will rise by a total of 130 per cent: 8.9 per cent from size, 14.6 per cent from
education, 24.9 per cent from tenure and 47.8 from age. As Table 1 has shown earnings rise
19 We have also estimated the earnings function using the individual data. In this regression
the coefficient on size is larger, 0.16, while the coefficients on the human capital variables are similar. Results are available on request from the authors.
20 Based on individual data, Bigsten et al (2000, p.810) report a coefficient on years of education using three waves of this data equal to 0.09, which compares with 0.07 in Table 5. Jones (2001, p. 71) uses two years of the individual data and reports an education coefficient of 0.07.
21 See notes to the table for details about the instrument set. 22 It can be noted that the Difference-Sargan test indicates that instrument validity for the
levels equation is marginal as we can reject the null hypothesis at the 10 per cent level (but not at the 5 per cent level). We will return to this issue in the next section where we report alternative specifications of the earnings equation.

14
by a factor of three in moving between these size categories. Clearly most of this rise cannot
be explained by the OLS estimates of the returns on human capital. In Table 6 Columns [2]
and [3] we report the results using the estimates from Table 5 Columns [4] and [5]. The rise in
earnings from the point estimates from these two equations range from 198 per cent to 265
per cent thus bracketing the actual rise in earnings of 210 per cent shown in Table 1. Of this
rise by far the most important effect comes from the size of the firm measured by
employment.
We have shown that not only does the size effect remain when we have controlled for
fixed effects but it is the single most important determinant of earnings. The issue remains as
to whether it is efficiency wages or rent-sharing that accounts for the size effect. We turn to
that question in the next section.
6 Rent Sharing and Efficiency Wages
Our formulation of the rent-sharing hypothesis in Section 2 postulates that shocks to
profitability will affect earnings. We now proceed to use our production function as the basis
for a series of tests as to whether we can explain earnings with output or output by the wage
premium, conditional on firm fixed effects.
In Table 7 Column [1] we take the predicted output from the production function in
Table 3 Column [5] and use it as a regressor in the earnings function. The result is to reduce
the size of the coefficient on log employment from 0.11 to –0.02 and it is now wholly
insignificant.23 In Column [2] we drop the log of employment term and the predicted output
from the production function now has a t statistic of 2.3.24 The capital skill complementarity
hypothesis has been interpreted as suggesting that the relevant variables to enter the earnings
function is the capital labour ratio. We test for this in Column [3]. However the there is no
change in the coefficient on log employment term, and it is still significant at the 10 per cent
level. The coefficient on the capital labour ratio term is highly insignificant. In Columns [4]
and [5] we report the effects of using lags of profits per employee, following inter alia
23 It can also be noted that for this specification the Difference-Sargan test indicates that we
can safely accept instrument validity for the levels equation. In contrast, for the specifications reported in Columns [4] and [5], Table 5, instrument validity appears to be marginal for the levels equation.
24 Because predicted output is a generated regressor the standard errors should be corrected. We used the methods proposed by Gilchrist and Himmelberg (1994) to correct the one-step standard errors. Such corrections had very minor results: for no coefficient did the associated standard error change by more than 1 per cent, and for most coefficients there was virtually no effect at all. Correcting the two-step standard errors is computationally difficult because of the finite sample correction of the covariance matrix (see footnote 15). Given the negligible effects on the one-step results, we therefore decided to report standard errors which have not been corrected for the generated regressor.

15
Blanchflower et al (1996).25 While the second lag is positive and significant at the ten per cent
level the size coefficient is only marginally lower than in the baseline specification. Indeed
the long-run size coefficient is identical, 0.16, to that reported in Table 5, Column [4]. Adding
predicted output to this specification results in a negative and highly insignificant size
coefficient (not reported). In Column [5], finally, we exclude the size variable, and include
predicted output and two lags of profit per employee. The estimated coefficient on predicted
log output is 0.15 and significant at the five per cent level, while the coefficients on the profit
per employee terms are unchanged. We interpret these results as showing that the size effect
on earnings can be given a rent-sharing interpretation.
Finally, we turn to the efficiency wage hypothesis. In Table 8 we re-estimate the
Cobb-Douglas production function including the earnings variable as an additional regressor.
Since we control for observed human capital this variable can be interpreted as a wage
premium. In the OLS model, reported in Column [1], the earnings coefficient is positive but
only significantly different from zero at the 10 per cent level. We can reject the hypothesis
that the coefficients on earnings and employment are the same at the 10 per cent level and
nearly at the 5 per cent level (the p-value is 0.051). Once we control for firm fixed effects,
Columns [2] and [3], the coefficient on earnings more than halves and is no longer significant
at conventional levels. Our interpretation of these findings is that there is no evidence in
favour of efficiency wages in this data.
7 Summary and Conclusion
The central question posed in this paper is the relationship between firm size, earnings and
productivity. There is a large dispersion of labour productivity, capital intensity and earnings
by firm size in the data for manufacturing firms in Ghana. This size dispersion is not due to
technology, i.e. it does not reflect the use of more capital intensive technology by some
sectors, and it is not a result of changes in labour productivity during the course of the
surveys. These differences are very substantial in that both labour productivity and earnings
rise by a factor of three or more in moving from a micro firm, one with less than 6 employees,
to a large firm, one with more than 100.
We have estimated production and earnings functions using a system GMM
estimator, to investigate whether there is a size effect on earnings. The GMM estimator
allows us to control for issues of endogeneity, measurement errors and firm fixed effects,
where the latter would capture for instance time invariant unobservable quality of the
25 Because of the introduction of the lagged profit terms, this yields a smaller sample: 518
observations on 115 firms.
16
workforce and the unobservable characteristics of their workplace. We have argued that such
an effect can be found and that size is the most important of the factors determining earnings
across firms of differing size. Using a production function we have shown that constant
returns to scale is not rejected by the data and, once we allow for measurement error, the
Cobb-Douglas form with constant returns to scale can be accepted, thus accepting the
hypothesis that technology is homothetic. We have also shown that observable skills are of
minor importance in explaining differences in productivity across size.
Given our estimates of the production function we have used the predictions to show
that the size effect in the earnings function can be given an interpretation as a rent-sharing
variable. The results show that the effect of predicted output on earnings occurs together with
an effect from lagged profits. While the former is consistent with a risk-sharing interpretation
of the data, the latter is not. Finally we have considered the possible role of efficiency wages
by asking if the productivity of firms is determined by the wage premium. Once controls are
included in the equation for fixed effects we find no evidence for an impact of wages onto
productivity.
References Akerlof, G. (1982) “Labor contracts as partial gift exchange”, Quarterly Journal of Economics, 97 (4), pp. 543-69. Akerlof, G. and J. Yellen (1986) Efficiency Wage Models of the Labour Market. Cambridge: Cambridge University Press. Arellano, M. and S. Bond (1991). “Some tests of specification for panel data: Monte Carlo evidence and an application to employment equations,” Review of Economic Studies 58: 277-297. Azam, J.P. (2001) “Rent-sharing, hold-up and manufacturing sector wages in Cote d’Ivoire”, World Bank Working paper, January. Basu, S. and J. G. Fernald (1995). “Are apparent productive spillovers a figment of specification error?” Journal of Monetary Economics, 36: 165-188. Battese, G.E. and T.J. Coelli (1992) ‘Frontier production functions, technical efficiency and panel data: with application to paddy farmers in India’, Journal of Productivity Analysis, 3, 159-169. Berndt, E., and L. Christensen (1972). “The translog function and the substitution of equipment, structures, and labor in U.S. manufacturing, 1929-1968,” Journal of Econometrics 1: 81-114. Bigsten, A., P. Collier, S. Dercon, B. Gauthier, M. Fafchamps, J.W. Gunning, A. Isaksson, A. Oduro, R. Oostendorp, C. Pattillo, M. Söderbom, F. Teal A. Zeufack and S. Appleton (2000) “Rates of return on physical and human capital in Africa=s manufacturing sector,” Economic Development and Cultural Change 48: 801-827.

17
Bils, M. and Peter Klenow (2000) "Does schooling cause growth?", American Economic Review, Vol. 90, No. 5, December, pp.1160-1183. Blanchflower, D. G., A.J. Oswald and P. Sanfey (1996) “Wages, profits and rent-sharing”, The Quarterly Journal of Economics, Vol. CXI, No. 1, February, pp. 227-251. Blundell R. and S. Bond (1998). “Initial conditions and moment restrictions in dynamic panel data models,” Journal of Econometrics 87: 115-143. Blundell R. and S. Bond (2000). “GMM estimation with persistent panel data: an application to production functions,” Econometric Reviews 19: 321-340. Blundell, R., S. Bond and F. Windmeijer (2000). “Estimation in dynamic panel data models: improving on the performance of the standard GMM estimator,” in B. Baltagi (ed.) Advances in Econometrics, Vol. 15: Nonstationary Panels, Panel Cointegration and Dynamic Panels, Amsterdam: JAI Elsevier Science. Bond, S., C. Bowsher and F. Windmeijer (2000), Criterion-based inference for GMM in autoregressive panel data models, The Institute for Fiscal Studies, Working Paper No. W01/02, London. Bond, S. and F. Windmeijer (2001). “Finite sample inference for GMM estimators in linear panel data models,” Mimeo. London: The Institute for Fiscal Studies. Brown, C. and Medoff, J. (1989) "The employer size-wage effect", Journal of Political Economy, 97, 5, 1027-1059. Bulow, J. and L. Summers (1986), “A Theory of Dual Labor Markets, with Applications to Industrial Policy, Discrimination, and Keynesian Unemployment,” Journal of Labor Economics 4: 376-414. Dickens W. T. and L. F. Katz (1987), “Inter-industry wage differences and industry characteristics,” in K. Lang and J. Leonard (eds.) Unemployment and the Structure of the Labour Markets. Oxford, UK: Basil Blackwell. Doeringer, P. and M. Piore (1971), Internal Labour Markets and Manpower Analysis. D. C. Heath, Lexington. Driscoll, P. J., and R. Boisvert (1991), “Dual second- and third-order translog models of production,” American Journal of Agricultural Economics, 73: 46-60. Gilchrist, S. and C. P. Himmelberg (1994) “Hypothesis Testing with Two-Step GMM Estimator,” Mimeo. Federal Reserve System and New York University. Griliches, Z. and J.A. Hausman (1986) “Errors in variables in panel data”, Journal of Econometrics, 31, pp.93-118. Griliches, Z. and J. Mairesse (1997) Production functions: the search for identification, S. Strom (ed.) Essays in Honour of Ragner Frisch, Econometric Society Monograph Series, Cambridge University Press. Hall, R. E. and C.I. Jones (1999) “Why do some countries produce so much more output per worker than others?” Quarterly Journal of Economics, Vol. CXIV, No.1, February, pp. 83-116.

18
Hansen, L. P. (1982), “Large Sample Properties of Generalized Method of Moments Estimators,” Econometrica 50: 1029-1054. Hubbard, G.R. (1998) “Capital-market imperfections and investment”, Journal of Economic Literature, March, Vol. XXXVI(1), pp.193-238. Huang Tzu-Ling, A. Hallam, P.F.Orazem and E.M. Paterno (1998) “Emprical tests of efficiency wages”, Economica, 65, pp. 125-43. Jones, P. (2001) “Are educated workers really more productive?” Journal of Development Economics, Vo. 64, pp.57-79. Katz, L. R. and L. H. Summers (1989) “Industry rents: evidence and implications,” Brookings Papers on Economic Activity (Microeconomics), 209-275. Krueger, A. B. and L. H. Summers (1987) “Reflections on the inter-industry wage structure,” in K. Lang and J. Leonard (eds.) Unemployment and the Structure of the Labour Markets. Oxford, UK: Basil Blackwell. Krueger, A. B. and L. H. Summers (1988) “Efficiency wages and the inter-industry wage structure,” Econometrica 56: 259-93. Levine, D.I. (1992) “Can wage increases pay for themselves? Tests with a production function,” Economic Journal, 102, September, pp. 1102-1115. Little, I.M.D., Dipak Mazumdar and John M. Page Jr. (1987) Small manufacturing enterprises: A comparative analysis of Indian and other economies, Published for the World Bank by Oxford University Press, Washington. Lucas, R.E. Jr. (1978) “On the size distribution of business firms”, Bell Journal of Economics, Autumn, Vo.9, No. 2, pp.508-523. Mairesse, J. and B.H. Hall (1996) “Estimating the productivity of research and development in French and US manufacturing firms: an exploration of simultaneity issues with GMM methods,” in Wagner, K. and B. Van Ark (eds.) International Productivity Differences and Their Explanation, Elsevier Science, pp. 285-315. Masters, S. H. (1969), “Wages and Plant Size: an Interindustry Analysis,” The Review of Economics and Statistics 51: 341-345. Mazumdar, D. (1983) “The rural-urban wage gap migration and the working of urban labour markets: an interpretation based on a study of the workers in Bombay city”, Indian Economic Review, Vol 18, No. 2. Moll, P. G. (1993) “Industry wage differentials and efficiency wages: a dissenting view with South African evidence”, Journal of Development Economics, Vol. 41, pp. 213-46. Nickell, S. (1981) “Biases in dynamic models with fixed effects”, Econometrica, Vol. 46, pp. 1417-1426. Nickell, S. (1996) “Competition and corporate performance”, Journal of Political Economy, Vol. 104, No.4, pp.724-746. Oi W. Y. and T. L. Idson, (1999) “Firm size and wages”, Chapter 33 Handbook of Labor Economics, Volume 3, edited by O. Ashenfelter and D. Card, North-Holland.

19
Pack, H. (1982) “Aggregate implications of factor substitution in industrial processes,” Journal of Development Economics 11: 1-38. Raff, D. and L. Summers (1987) “Did Henry Ford pay efficiency wages?”, Journal of Labor Economics, 5, 2, pp. 557-586. Shapiro, C. and Stiglitz, J. (1984) “Equilibrium unemployment as a worker discipline device”, American Economic Review, 5, 2, pp. 557-586. Slichter, S. (1950) “Notes on the structures of wages,” Review of Economics and Statistics 32: 80-91. Stiglitz, J. (1974) “Alternative theories of wage determination and unemployment in LDCs: The labour turnover model”, Quarterly Journal of Economics, 88, pp. 194-227. Teal, F. (1996) “The size and sources of economic rents in a developing country manufacturing labour market”, Economic Journal, Vol. 106, No. 437, July, pp.963-976. Troske, K. R. (1997) “Evidence on the employer size-wage premium from worker-establishment matched data”, Centre for Economic Studies, US Bureau of the Census, Washington, DC. Tybout, J. R. (1992) ‘Making noisy data sing: Estimating production technologies in developing countries’, Journal of Econometrics, 53, pp.25-44. Tybout, J. R. (2000) “Manufacturing firms in developing countries: how well do they do and why?” Journal of Economic Literature, Vol. XXXVIII, No. 1, March, pp.11-44. Van Reenen, J. (1996) “The creation and capture of rents: wages and innovation in a panel of U.K. companies”, The Quarterly Journal of Economics, Vol. CXI, No. 1, February, pp.195-225. Valenchik, A. D. (1997) “Government intervention, efficiency wages and the employer size effect in Zimbabwe”, Journal of Development Economics, Vo. 53, pp. 305-338. Wadhwani, S.B. and M. Wall (1991) “A direct test of the efficiency wage model using UK micro-data”, Oxford Economic Papers, 43, pp. 529-548. Weiss, A. (1980) “Job queues and layoffs in labour markets with flexible wages”, Journal of Political Economy, 88, pp. 526-538. White, H. (1980). ”A Heteroscedasticity-Consistent Covariance Matrix Estimator and a Direct Test for Heteroscedasticity,” Econometrica 48: 817-838. Windmeijer, F. (2000). “A finite sample correction for the variance of linear two-step GMM
estimators,” IFS Working Paper 00/19. London: The Institute for Fiscal Studies.

20
TABLE 1
MEANS OF PRODUCTIVITY AND EARNINGS VARIABLES
PURGED OF TIME AND SECTORAL EFFECTS
Large Medium Small Micro All
Log Output per Employee 15.6 14.9 14.8 14.6 14.9 (millions of 1991 cedis) (0.8) (1.1) (0.9) (0.8) (1.0)
Log Capital per Employee 17.6 16.5 15.2 15.1 15.9 (millions of 1991 cedis) (0.8) (1.5) (1.6) (1.8) (12.3)
Capital to Output Ratio 4.2 4.8 3.4 3.8 3.9 (2.9) (4.8) (1.9) (2.5) (3.2)
Log Hourly Earnings per 5.56 5.14 4.70 4.43 4.94 Worker (1991 cedis) (0.5) (0.7) (0.9) (0.9) (0.9)
Average Education (Years) 11.8 10.8 10.2 10.1 10.6 (2.0) (2.0) (2.4) (2.4) (2.3)
Average Age in Years 38 36 31 30 34 (6) (7) (6) (7) (7)
Average Tenure in Years 12.9 12.3 9.8 9.2 10.9 (4.4) (4.6) (2.9) (4.6) (4.2)
Number of Observations 125 206 319 82 732
Number of Firms 29 43 63 18 153 Note: The means reported in this table are obtained from regressing the variables on sector, time and size dummies. The size effect is then obtained from the size dummies in this regression. The size of the firm is its total number of employees when first observed in the sample, where a micro firm has less than six employees, a small firm has from 6 to 29, a medium firm has from 30 to 99, while a large firm has 100, or more, employees.
The data is annual over the period 1991 to 1997. The figures in ( ) are standard deviations. As explained in the text firm-level price indices are used to deflate the output and inputs for the firm while the Consumer Price Index is used to deflate earnings.

21
TABLE 2
SELECTED ESTIMATES BASED ON TRANSLOG PRODUCTION FUNCTION REGRESSIONS
[1] OLS [2] Within [4] SYSa
SPECIFICATION TESTS
Homotheticity (p-value)(1) 0.38 0.53 0.78
Homotheticity and constant returns to scale (p-value) (2)
0.49 0.57 0.87
Quasi-concavity (proportion of observations)(3)
0.38 0.45 0.53
Monotonicity (proportion of observations)(3)
0.63 0.62 0.55
Cobb-Douglas (p-value) (4) 0.00 0.00 0.73
Sargan test (p-value)(5) 0.31
SUMMARY OF SPECIFICATION
Time Dummies Yes Yes Yes
Industry Dummies Yes No No
Inputs Endogenous No No Yes
Firm Fixed Effects No Yes Yes
Lag of dependent variable No No No Number of Observations 732 732 732
Number of Firms 153 153 153
Note: The empirical translog specification is of the form ,lnln21lnln � �� +++=
k m mitkitkmj jitjitit controlsXXXhY ββα where the notation is as
explained in Section 2. Test statistics are based on standard errors robust to heteroskedasticity. a) Based on two-step system GMM results. Test statistics are based on robust, finite sample corrected standard errors (see Windmeijer, 2000). The instrument set for the differenced equation consists of the level of output in periods s = t-3,…, s = 1, and the levels of employment, physical capital, raw materials, indirect costs and human capital, in periods s = t-2,…, s = 1. The instrument set for the levels equation consists of employment, physical capital, raw materials, indirect costs and human capital, differenced, in period t-1, output differenced in t-2, a constant and year dummies.
(1) For homotheticity, H0: � =m km 0β , k = 1,2,3,4. Wald tests were used for all models.
(2) For constant returns to scale and homotheticity, H0: � =j j 1β and � =
m km 0β , k = 1,2,3,4.
Wald tests were used for all models. (3) See footnote 11 for a description of how we investigate quasi-concavity and monotonicity. (4) Tests for the joint significance of the coefficients on the non-linear terms in the translog specification. For the OLS and Within specifications a Wald test was used and in the system GMM models the tests were based on the value of the RUD statistic (see footnote 17). (5) Tests for the validity of the instruments.

22
TABLE 3
COBB-DOUGLAS PRODUCTION FUNCTION ESTIMATES
[1] OLS [2] Within [3] OLS [4] SYSa [5] SYSa
PARAMETER
log Employment 0.14 0.11 0.10 0.20 0.20 (4.22)** (1.78)+ (3.14)** (2.98)** (2.43)*
log Capital(t-1) 0.03 0.0005 0.02 0.07 0.07 (2.37)* (0.004) (1.84)+ (1.90)+ (1.94)+
log Raw Materials 0.69 0.64 0.61 0.69 0.64 (29.20)** (17.94)** (23.00)** (17.33)** (12.24)**
log Indirect Costs 0.13 0.08 0.10 0.07 0.06 (5.50)** (2.94)** (4.78)** (1.99)* (1.93)+
Years of Education / 100 1.28 0.38 1.20 -0.11 -0.10 (1.81)+ (0.41) (1.94)+ (0.09) (0.08)
Age 0.04 0.08 0.03 0.08 0.07 (2.38)* (2.94)** (2.16)* (3.61)** (3.15)**
Age2 / 100 -0.06 -0.13 -0.05 -0.11 -0.10 (2.31)* (3.24)** (2.09)* (3.71)** (3.40)**
Years of Tenure / 100 0.33 1.69 0.29 1.45 1.29 (0.70) (2.90)** (0.65) (1.84)+ (1.67)+
log Output(t-1) 0.18 0.06 (6.33)** (1.21)
Any Foreign Ownership 0.01 0.01 (0.24) (0.26)
Ghanaian State Ownership 0.04 0.06 (0.49) (0.79)
Firm Age / 100 0.22 0.15 (1.09) (0.85)
Union 0.06 -0.001 (0.79) (0.02)
Long-run returns to scale 1.00 0.83 1.02 1.03 1.04 CONTROL VARIABLES
Time Dummies Yes Yes Yes Yes Yes
Industry Dummies Yes No Yes No No
Inputs Endogenous No No No Yes Yes
Firm Fixed Effects No Yes No Yes Yes Number of Observations 732 732 732 732 732
Number of Firms 153 153 153 153 153
Continues…

23
TABLE 3 (CONTINUED)
SPECIFICATION TESTS (p-VALUES)
[1] OLS [2] Within [3] OLS [4] SYS [5] SYS
INDHET, EMPLOYMENT(1) 0.61 0.39 0.54 0.29 0.56
INDHET, CAPITAL(1) 0.52 0.13 0.46 0.27 0.77
INDHET, RAW MATERIALS(1) 0.27 0.55 0.37 0.27 0.79
INDHET, INDIRECT COSTS(1) 0.72 0.86 0.77 0.19 0.64
AGE(2) 0.06 0.00 0.10 0.00 0.00
TRANSLOG(3) 0.00 0.00 0.00 0.73 0.24
CRS(4) 0.94 0.16 0.44 0.48 0.40
M1(5) 0.00 0.00
M2(6) 0.03 0.07
SARGAN(7) 0.39 0.25
DIFF-SARGAN(8) 0.96 0.77 Note: The dependent variable is the log of output. t-statistics based on standard errors robust to heteroskedasticity (White, 1980) are reported in ( ). Significance at the 1 per cent, 5 per cent and 10 per cent level is indicated by *, ** and + respectively. a) The system GMM (SYS) estimator is a combination of a GMM differenced estimator and a GMM levels estimator (see Blundell and Bond, 1998). The reported coefficients are two-step estimates, and the associated t-statistics are based on robust, finite sample corrected standard errors (see Windmeijer, 2000). The instrument set for the differenced equation consists of the level of output in periods s = t-3,…, s = 1, and the levels of employment, physical capital, raw materials, indirect costs and human capital, in periods s = t-2,…, s = 1. The instrument set for the levels equation consists of employment, physical capital, raw materials, indirect costs and human capital, differenced, in period t-1, output differenced in t-2, a constant and year dummies. (1) Tests for heterogeneity across industries in the associated slope coefficient. This is implemented by interacting the relevant variable with dummy variables for industry, and testing appropriately for the joint significance of the coefficients on the interaction terms. For the OLS and Within specifications a standard Wald test was used, whereas the tests in the system GMM models were based on the RUD statistic (see footnote 17). (2) Tests for the joint significance of the age and age2 terms. Wald tests were used for all specifications. (3) Tests for the joint significance of the coefficients on the non-linear terms in the translog specification. For the OLS and Within specifications a Wald test was used and in the system GMM models the tests were based on the value of the RUD statistic. (4) Tests the null hypothesis that the coefficients on employment, physical capital, raw materials and indirect costs sum to unity. For the dynamic specifications (i.e. with the lagged dependent variable), this test is based on the associated long-run values of the coefficients. Wald tests were used for all specifications. (5) Tests the null hypothesis that the differenced residuals in periods t and t-1 are uncorrelated. (6) Tests the null hypothesis that the differenced residuals in periods t and t-2 are uncorrelated. (7) Tests for the validity of the instruments in the differenced and levels equations. (8) Tests for the validity of the instruments in the levels equation.

24
TABLE 4
THE DETERMINANTS OF LABOUR PRODUCTIVITY
Percentage increase in output per employee from a move from a micro to a large firm due to:
OLS
Table2 Model [3]
GMM
Table 2 Model [5]
Log Employment(a) 7.1 14.5
Log Capital per Employee 7.2 19.0
Log Materials per Employee 68.8 61.7
Log Indirect Costs per Employee 25.5 13.3
Education 2.5 -0.2
Tenure 1.3 5.2
Age 0.0 -0.9
Total 151.3 159.9
Note: The percentage increase in output per employee as shown in Table 1 is 172. (a) Under constant returns to scale this should be zero. The positive numbers reflect the fact that the point estimates in Models [3] and [5] indicate increasing returns to scale. When tested, constant returns cannot be rejected.

25
TABLE 5
EARNINGS FUNCTION ESTIMATES
[1] OLS [2] Within [3] OLS [4] SYS$ a [5] SYS$ b
PARAMETER
log Employment 0.05 0.06 0.01 0.11 0.16 (2.07)* (0.83) (0.79) (1.8)+ (2.0)*
Years of Education 0.07 0.03 0.03 -0.01 0.01 (3.89)** (1.37) (2.34)* (0.3) (0.6)
Age 0.25 0.11 0.14 0.08 0.13 (4.18)** (1.62) (3.30)** (1.9)+ (2.92)**
Age2/ 100 -0.29 -0.11 0.00 -0.08 -0.13 (3.12)** (1.15) (2.65)** (1.4) (2.3)*
Years of Tenure 0.03 0.04 0.03 0.03 0.03 (1.94)+ (1.98)* (2.10)* (1.5) (1.5)
log Earnings(t-1) 0.53 0.29 0.17 (11.13)** (2.7)** (1.2)
Long-run effect of log Employment
0.05 0.06 0.03 0.16 0.19
Adjusted R2 0.59 0.78 0.72 CONTROL VARIABLES
Time Dummies Yes Yes Yes Yes Yes
Regressors Endogenous No No No Yes Yes
Firm Fixed Effects No Yes No Yes Yes Number of Observations 732 732 732 732 732
Number of Firms 153 153 153 153 153
SPECIFICATION TESTS (p-VALUES)
AGE (1) 0.00 0.00 0.00 0.02 0.00
M1(2) 0.00 0.00
M2(2) 0.83 0.68
SARGAN(2) 0.16 0.20
DIFF-SARGAN(2) 0.06 0.09 Note: The dependent variable is the log of hourly earnings. t-statistics based on standard errors robust to heteroskedasticity (White, 1980) are reported in parenthesis. Significance at the 1 per cent, 5 per cent and 10 per cent level is indicated by *, ** and + respectively. $ The reported coefficients are two-step estimates, and the associated t-statistics are based on robust, finite sample corrected standard errors (see Windmeijer, 2000).
Table notes continue on the next page.

26
Table notes, continued.
a) The instrument set for the differenced equation consists of employment, all the human capital variables, in levels, in periods s = t-2, t-3,…, s = 1, and the level of earnings in periods s = t-2, t-3,…, s = 1. The instrument set for the levels equation consists of employment, human capital and earnings, differenced, in period t-1 a constant and year dummies. b) The instrument set for the differenced equation consists of employment, all the human capital variables, in levels, in periods s = t-2 only and the level of earnings in periods s = t-3 only. The instrument set for the levels equation consists of employment, and human capital differenced, in period t-1, earnings differenced in period t-2, a constant and year dummies (1) Tests for the joint significance of the age and age2 terms. Wald tests were used for all specifications. (2) See Table 3.

27
TABLE 6
THE DETERMINANTS OF EARNINGS
Percentage increase in hourly earnings from a move from a micro to a large firm due to:
OLS
Table 5 Column [3]
System GMM
Table 5 Column [4]
System GMM
Table 5 Column [5]
Log Employment 8.9 88.0 109.6
Education 14.6 -1.9 3.1
Tenure 24.9 18.0 16.7
Age 47.8 37.5 44.9
Total 130 198 265
Note: The percentage increase in hourly earnings shown in Table 1 is 210.

28
TABLE 7
ADDITIONAL EARNINGS FUNCTION ESTIMATES
[1] SYSa [2] SYSa [3] SYSb [4] SYSc [5] SYSd
PARAMETER
Log Employment -0.02 0.12 0.08 (0.16) (1.94)+ (1.09)
Years of Education -0.01 -0.01 -0.01 -0.01 -0.01 (0.29) (0.29) (0.52) (0.29) (0.45)
Age 0.07 0.07 0.07 0.04 -0.02 (1.21) (1.25) (1.92)+ (0.75) (0.39)
Age2/ 100 -0.07 -0.07 -0.07 -0.03 0.04 (0.84) (0.86) (1.36) (0.45) (0.65)
Years of Tenure 0.04 0.04 0.03 0.04 0.04 (1.74)+ (1.76)+ (1.61) (1.61) (1.97)+
Log Earnings(t-1) 0.29 0.29 0.30 0.49 0.48 (2.82)** (2.88)** (3.15)** (2.17)* (2.48)*
Log Capital / Employment 0.03 (0.80)
Predicted Log Output 0.12 0.11 0.15 (1.37) (2.30)* (2.45)*
Profit / Employee t-1 0.01 0.02 (0.38) (1.49)
Profit / Employee t-2 0.05 0.05 (1.85)+ (2.17)*
Long-run effect of log Employment
-0.03 0.17 0.16
Number of Observations 732 732 732 518 518
Number of Firms 153 153 153 115 115
SPECIFICATION TESTS (p-VALUES)
AGE (1) 0.07 0.07 0.04 0.51 0.27
M1(2) 0.00 0.00 0.00 0.01 0.00
M2(2) 0.80 0.79 0.70 0.32 0.32
SARGAN(2) 0.19 0.21 0.25 0.09 0.22
DIFF-SARGAN(2) 0.29 0.29 0.07 0.15 0.60 Note: The dependent variable is the log of hourly earnings. t-statistics based on robust, finite sample corrected standard errors (Windmeijer, 2000) are reported in parenthesis. Significance at the 1 per cent, 5 per cent and 10 per cent level is indicated by *, ** and + respectively. All regressions include time dummies. All regressions control for fixed effects.
Table notes continue on the next page.

29
Table notes, continued.
a) The instrument set for the differenced equation consists of log earnings, predicted log output, log employment and all the human capital variables, in levels, in periods s = t-2, t-3,…, s = 1. The instrument set for the levels equation consists of employment, predicted log output, human capital and earnings, differenced, in period t-1, a constant and year dummies. b) The instrument set for the differenced equation consists of log earnings, log capital-labour ratio, log employment and all the human capital variables, in levels, in periods s = t-2, t-3,…, s = 1. The instrument set for the levels equation consists of employment, capital-labour ratio, human capital and earnings, differenced, in period t-1, a constant and year dummies. c) The instrument set for the differenced equation consists of log earnings, log employment and all the human capital variables, in levels, in periods s = t-2, t-3,…, s = 1, while the profit per employee terms serve as their own instruments. The instrument set for the levels equation consists of employment, human capital and earnings, differenced, in period t-1, a constant and year dummies. d) The instrument set for the differenced equation consists of log earnings, predicted log output, log employment and all the human capital variables, in levels, in periods s = t-2, t-3,…, s = 1, while the profit per employee terms serve as their own instruments. The instrument set for the levels equation consists of employment, predicted log output, human capital and earnings, differenced, in period t-1, a constant and year dummies. (1) Tests for the joint significance of the age and age2 terms. Wald tests were used for all specifications. (2) See Table 3.

30
TABLE 8
TESTING FOR EFFICIENCY WAGES: PRODUCTION FUNCTION ESTIMATES
[1] OLS [2] Within [3] SYSa
PARAMETER
log Employment 0.15 0.11 0.20 (4.61)** (1.75)+ (2.39)*
log Capital(t-1) 0.03 -0.0002 0.06 (2.34)* (0.002) (1.83)+
log Raw Materials 0.69 0.64 0.64 (29.51)** (18.24)** (12.09)**
log Indirect Costs 0.12 0.08 0.06 (5.44)** (2.92)** (1.87)+
Years of Education / 100 0.01 0.00 0.00 (1.30) (0.33) (0.06)
Age 0.03 0.08 0.06 (1.45) (2.61)** (2.84)**
Age2 / 100 -0.05 -0.13 -0.10 (1.53) (2.95)** (3.29)**
Years of Tenure / 100 1.28 1.58 1.24 (0.27) (2.53)* (1.44)
log Output(t-1) 0.06 (1.21)
log Earnings 0.06 0.03 0.02 (1.67)+ (0.61) (0.62)
M1(1) 0.00
M2(1) 0.07
SARGAN(1) 0.26
DIFF-SARGAN(1) 0.82
Number of Observations 732 732 732
Number of Firms 153 153 153
Note: The dependent variable is the log of output. t-statistics based on standard errors robust to heteroskedasticity (White, 1980) are reported in ( ). Significance at the 1 per cent, 5 per cent and 10 per cent level is indicated by *, ** and + respectively. a) The reported coefficients are two-step estimates, and the associated t-statistics are based on robust, finite sample corrected standard errors (see Windmeijer, 2000). The instrument set for the differenced equation consists of the level of output in periods s = t-3,…, s = 1, the levels of employment, physical capital, raw materials, indirect costs and human capital, in periods s = t-2,…, s = 1, while the earnings variable (differenced) serves as its own instrument. The instrument set for the levels equation consists of employment, physical capital, raw materials, indirect costs and human capital, differenced, in period t-1, output differenced in t-2, a constant and year dummies. (1) See Table 3.

31
Appendix 1: The system GMM estimator
This appendix provides a brief description of the system GMM estimator. For more details
see e.g. Blundell and Bond (1998) and Blundell et al (2000).
Consider
(A1) itiitit xy εµβ ++′= , t = 1,2,…,T,
where i and t are firm and time indices, yit is the dependent variable, xit is a row vector of
order k of explanatory variables possibly including lags of the dependent variable, β is a
column vector of parameters of order k, µi is a fixed effect potentially correlated with xit and
εit is a residual potentially correlated with xit. To eliminate the fixed effect we take first
differences:
(A2) ititit xy εβ ∆+′∆=∆ , t = 2,3,…,T.
If itx∆ is correlated with the differenced residual, the standard OLS estimator will be biased
and inconsistent. However, assume that there exists a set of instruments that enable us to form
a vector of moment conditions of order q, defined as
(A3) ( ) 0=∆′ ititzE ε .
Provided q≥k , we can obtain a consistent GMM estimator of β by minimising the quadratic
(A4) ( ) ( ) ( )GMMNGMMGMM gWgJ βββ ˆˆˆ 1−′= ,
where ( )⋅g is the sum over the sample moment conditions of the form in (A3) and 1−NW is a
weight matrix (Hansen, 1982). A common procedure is to use lags of xit as instruments for the
differenced equation (A2), and because more instruments become available for higher t, we
can form a matrix of instrument as
xi1 0 0 … 0 … 0 t = 1 + l (A5) zi = 0 xi1 xi2 … 0 … 0 t = 2 + l . . . … . … . 0 0 0 … xi1 … xi,T-l t = T
where l is the lag length in use. As discussed in the text, the resulting differenced GMM
estimator often performs poorly in practice due to the problem of weak instruments. Blundell
and Bond (1998) proposed combining the differenced equation (A2) with the levels equation
(A1), for which lagged differences of the explanatory variables may serve as valid
instruments. The vector of moment conditions is then defined as
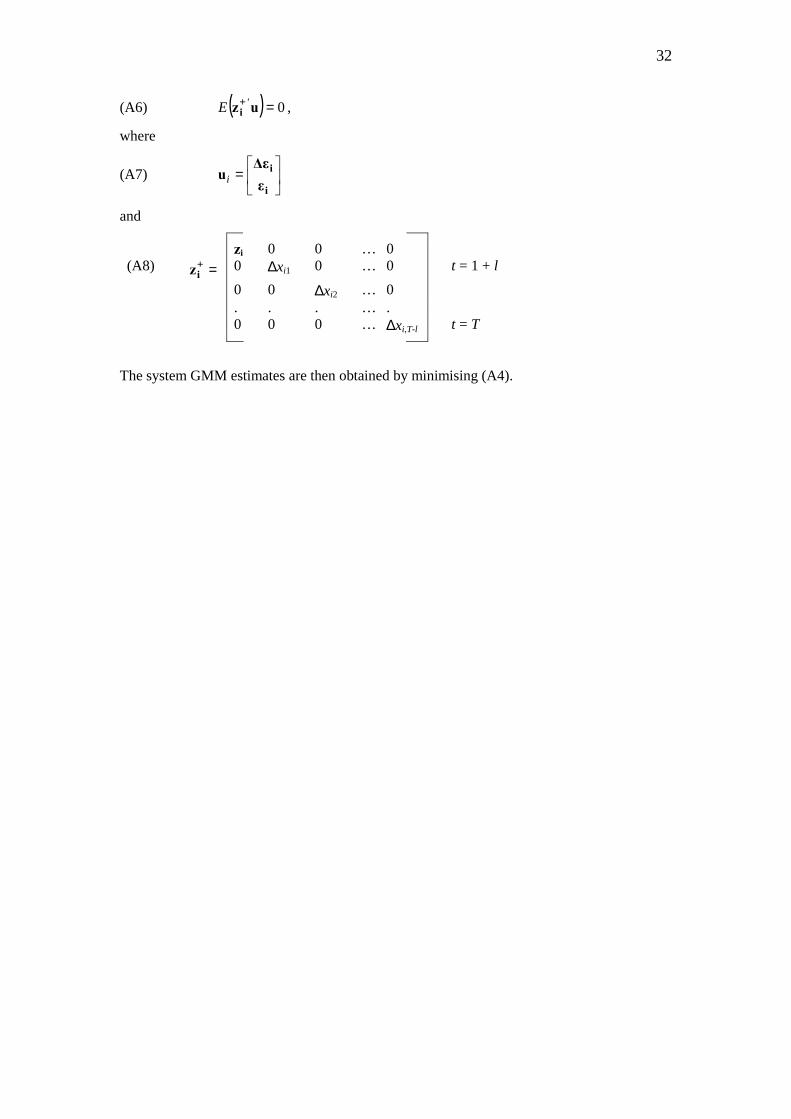
32
(A6) ( ) 0 =+ uzi'E ,
where
(A7) ��
���
�=
i
i
ε∆ε
ui
and
zi 0 0 … 0 (A8) =+
iz 0 ∆xi1 0 … 0 t = 1 + l 0 0 ∆xi2 … 0 . . . … . 0 0 0 … ∆xi,T-l t = T
The system GMM estimates are then obtained by minimising (A4).