Firm-Level R&D Activity, Employee Turnover and HRM ... · Firm-Level R&D Activity, Employee...
30
Firm-Level R&D Activity, Employee Turnover and HRM Practices: Evidence from China Tor Eriksson 1 , Zhihua Qin 2 , Wenjing Wang 3 Abstract With survey data from 582 Chinese firms across five high-tech industries, we examine the association between firm’s R&D activity, employee turnover rates and HRM practices. The analysis is performed using hurdle negative binomial model, which reveals both extensive and intensive margins of employee turnover rates and HRM practices on firms’ R&D activity. We find that turnover rate of technical employee is positively associated with the probability of having indoor R&D, but negatively associated with intensity of R&D activity among R&D-active firms. The adoption of high performance HRM practices like cross-functional team and channel for employee’s suggestion is associated with more indoor R&D, but its impact is independent of employee turnover. These results imply the possibility of encouraging indoor R&D activity by anchoring labor mobility at a suitable level – not too low to block idea exchange and not too high to risk the fruit of indoor R&D. Considering that firms may not have full control of employee turnover (at least not through the examined HRM practices), the government who is interested in facilitating R&D activity may consider using policy to adjust general labor mobility to a suitable level. JEL Codes: L22, M50, O31 Keywords: R&D, HRM Practices, Employee Turnover Acknowledgements: Financial support from Sino-Danish Center for Education and Research is gratefully acknowledged. We thank participants at the CHLR 2012 Symposium on Human Capital and the Labor Market and in particular our discussant, Jing Zhang, for valuable comments and suggestions. 1 Department of Economics and Business, Aarhus University, Denmark. Tel: +45 87 16 49 78. Email: [email protected] 2 School of Business, Renmin University, China. Tel: +86 (0)10 82 50 04 62. Email: [email protected] 3 Department of Economics and Business, Aarhus University, Denmark. Tel: +45 87 16 01 98. Email: [email protected]
Transcript of Firm-Level R&D Activity, Employee Turnover and HRM ... · Firm-Level R&D Activity, Employee...
Firm-Level R&D Activity, Employee Turnover
and HRM Practices: Evidence from China
Tor Eriksson1, Zhihua Qin2, Wenjing Wang3
Abstract
With survey data from 582 Chinese firms across five high-tech industries, we examine the
association between firm’s R&D activity, employee turnover rates and HRM practices. The
analysis is performed using hurdle negative binomial model, which reveals both extensive and
intensive margins of employee turnover rates and HRM practices on firms’ R&D activity. We
find that turnover rate of technical employee is positively associated with the probability of
having indoor R&D, but negatively associated with intensity of R&D activity among R&D-active
firms. The adoption of high performance HRM practices like cross-functional team and channel
for employee’s suggestion is associated with more indoor R&D, but its impact is independent of
employee turnover. These results imply the possibility of encouraging indoor R&D activity by
anchoring labor mobility at a suitable level – not too low to block idea exchange and not too
high to risk the fruit of indoor R&D. Considering that firms may not have full control of
employee turnover (at least not through the examined HRM practices), the government who is
interested in facilitating R&D activity may consider using policy to adjust general labor mobility
to a suitable level.
JEL Codes: L22, M50, O31
Keywords: R&D, HRM Practices, Employee Turnover
Acknowledgements: Financial support from Sino-Danish Center for Education and Research is
gratefully acknowledged. We thank participants at the CHLR 2012 Symposium on Human Capital
and the Labor Market and in particular our discussant, Jing Zhang, for valuable comments and
suggestions.
1 Department of Economics and Business, Aarhus University, Denmark. Tel: +45 87 16 49 78. Email: [email protected]
2 School of Business, Renmin University, China. Tel: +86 (0)10 82 50 04 62. Email: [email protected]
3 Department of Economics and Business, Aarhus University, Denmark. Tel: +45 87 16 01 98. Email: [email protected]
1
1. Introduction
Employee turnover can be an important mechanism for R&D activities in firms. Persistent
differences in turnover between two otherwise identical organizations will evolve very
different tenure distributions, with implications for stability and organizational culture
which in turn may have considerably different implications for R&D. The level of turnover
can be a result of the human resources management (HRM) practices chosen by the firm,
but the HRM practices can also have a direct effect on R&D activities of the firm. This paper
examines the relationship between employee turnover, HRM practices and R&D activity in
Chinese high technology sector firms.
In the current stage of China’s economic development, R&D and innovation are considered
as key factors for continued increase in total factor productivity and hence sustaining high
growth; see e.g., World Bank (2011). Very little systematic evidence of the drivers of R&D
and innovation activities based on firm-level data exists for China.4 Empirical results from
other (mostly advanced industrialized) countries, which are also rather scarce, do not
necessarily generalize to the Chinese context, as labor markets in China are still relatively
underdeveloped and protection of intellectual property rights remains weak. Moreover,
Chinese firms also differ from Western firms with respect to corporate culture and a more
important role for business groups and other networks.
For our empirical analysis we make use of data from a survey carried out by researchers at
Renmin University (Beijing) in 2011. The sample consists of firms in China from five (high
technology) industries: energy, electronic information, biotechnology, equipment
manufacturing and environmental protection. In addition to standard controls in the
analysis of R&D activities, the data set includes information about the firm’s HRM practices
as well as measures of employee turnover for different categories, including technical
personnel. The dependent variable in our analysis is the number of ongoing R&D projects
during 2010. The econometric analysis is performed using a hurdle negative binomial model
for count data. An advantage of this model is that it allows for analyses of both extensive
and intensive margins.
4In fact, we are only aware of one article (written in English) by Wei, Liu and Herndon (2011) on this topic.
2
The empirical analysis shows that a higher turnover rate of technical personnel is associated
with a higher likelihood of having own R&D but a lower intensity of R&D activities in these
firms. This relationship, which is also economically significant, is robust to inclusion of
variables for HRM practices implemented by the firm. Particularly important HRM practices
for enhancing R&D are the use of cross-functional teams and expenditures for employee
training. Notably, the HRM practices are found to have an impact on R&D which is
independent of employee turnover. Among the other drivers of R&D, external network
cooperation attaches an especially large and positive marginal effect. This is perhaps not so
surprising in view of the importance of networks and business groups in the Chinese
corporate system.
The remainder of the paper unfolds as follows. Next, a brief review of the previous studies
of the relationship between HRM practices, employee turnover and R&D is given. The third
section describes the data and the econometric method used. The results are presented
and discussed in section four. Section five concludes.
2. Previous Research
Since the mid-nineties a fairly large literature has built up dealing with HRM and firm
performance. Performance is typically measured by productivity (surveyed in Bloom and
van Reenen, 2011), while there is rather little (beyond case studies) on HRM and R&D.5
Instead, the large R&D and innovation literature has mainly been concerned with firm size,
product market competition, knowledge spillovers and R&D collaboration.
The first two papers to look at the relationship between HRM practices and R&D were
Michie and Sheehan (1999), (2003) in which the authors examined British firms’ use of so-
called high- and low-road HRM practices and how these were related to firms’ R&D
expenditures (the 1999 study) and process and product innovations during a three year
period (the 2003 paper), respectively. They find that extensive use of modern (that is high-
road) practices is positively correlated with investments in R&D and with process (but not
5 Notable exceptions are Michie and Sheehan (2003), Laursen and Foss (2003), Jimenez-Jimenez and Sanz-Valle (2005) and
Zoghi, Mohr and Meyer (2010). See also the recent survey by Foss and Laursen (2012).
3
product) innovations. Laursen and Foss’s (2003) study investigates bundles of work
practices and the degree of novelty in product innovation in Danish firms and finds a
positive relationship. Jimenez-Jimenez and Sanz-Valle’s (2005) analysis of a relatively small
sample of Spanish firms find that participative practices and promotion plans significantly
increases the firm’s innovation orientation.
In a more recent study, Zoghi, Mohr and Meyer (2010) use Canadian longitudinal data to
study how workplace organization is correlated with the adoption of process and product
innovations. They find that decentralized decision-making, information sharing programs
and (individual) incentive pay are associated with more innovations.6 Another recent study
by Zhou, Dekker and Kleinknecht (2011) makes use of four waves of survey data from the
Netherlands and finds that functional flexibility (measured by the rate at which people
change their function or department within the firm) has a positive effect on the percentage
of sales due to new products. Thus, this, as well as other studies, finds some evidence
suggesting that internal labor mobility (functional flexibility, job rotation) is important for
innovation activities.
Although there are a number of studies suggesting that especially the new, high
involvement/performance work practices are implemented more frequently in innovative
firms, the evidence is not very strong. Furthermore, existing empirical studies have made
use of many different measures of innovation as the dependent variable, while few studies
focus on the mechanism of R&D activity.
Could we expect the relationship between HRM practices and R&D activity to be different in
the Chinese case? A central element in the modern work practices is delegation of decision
rights to employees. This may not, however, function well in a Chinese context where
keeping distance to superiors and showing respect to elders is deeply rooted in the culture.
Participative decision making also presupposes a high level of trust between employees at
different levels in the hierarchy, which is often said not to be present in Chinese workplaces;
see Wang, Yeung and Zhang, (2011) for empirical evidence. Another cultural difference that
6 Notably, they also find, but do not discuss, that firms with a high vacancy rate (which is likely to be a sign of high
employee turnover) are also more likely to innovate.
4
may weaken the effect of introducing modern HRM practices is that, in appraisals of
performance, the employee’s attitude and behavior is traditionally considered more
important than the results of her performance.7 There is to the best of our knowledge, only
one earlier study, Wei et al. (2011), of the relationship between HRM practices and
innovation in firms operating in China. The data used in that study was collected by a survey
questionnaire sent to both CEOs and HR managers in firms in various industries
(manufacturing accounts for only 24 of the respondents). Strategic HRM is measured using
Huselid’s (1995) eight-item instrument and the firm’s product innovativeness (relative to
industry average) is self-reported (that is, is assessed by the respondents). The results show
a positive relationship between the strategic HRM measure and product innovation. The
correlation is stronger for firms with flatter structure and developmental culture.
One particular aspect of firms’ internal labor markets that has attracted some attention
recently (Møen, 2005; Kaiser et al., 2008; Müller and Peters, 2010) is the role of worker
flows and employee turnover for firms’ R&D and innovation activities.8 As knowledge and
competencies are embodied in people it is important to consider how these are transferred
between firms. Two broad hypotheses have been put forward. The idea behind the first
hypothesis is that with low employee turnover the result is likely to be result in too little
experimentation and innovation. This is especially the case if the relevant employees are
hired after graduation from college or university (or some vocational education) and
therefore possess little professional experience from other firms or industries. As this brings
few ideas from other companies, the firm itself becomes less capable of exploring new
environments and adapting to changing technologies. Instead the focus will be on existing
product performance – the improvements are typically small – and on efficiency within
existing technology and product variety. As long as there is not sufficient flow of “new
blood”, economic incentives, employee empowerment and involvement, cross-functional
teams and adoption of new information technologies can do little to radically change the
7 Nevertheless, a number of studies have documented a positive relationship between the firm’s use of strategic HRM
practices and its performance (typically measured by subjective ratings of the overall performance of the firm); see e.g.,
Björkman and Fan (2002), Chow, Huang and Liu (2008), Ngo, Lau and Foley (2008), and Wei, Liu, Zhang and Chiu (2008).
8Two recent papers by Balsvik (2011) and Parrotta and Pozzoli (2012) examine the impact of between firm employee flows
on firm productivity.
5
innovation activities within the firm. All in all, this implies that a too low turnover of
personnel is associated with a low level of R&D.
The idea that employee turnover above a certain threshold is good for firm performance is
related to the risky hires hypothesis put forward by Lazear (1995), according to which
employees are thought of as real options and the firm’s choice is between a candidate with
relatively predictable performance and one more risky. As long as firing costs are low, it
may pay off for the employer to hire the risky candidate because s/he has an option value.
Potential benefits are likely to be largest for positions where small differences in talent can
have large impacts on performance outcomes (such as R&D and leadership positions).
Hiring risky workers is likely to result in higher employee turnover, but may nevertheless
give better performance in terms of R&D and creativity.
The alternative hypothesis states that in order to promote R&D activity a firm needs to
employ and retain appropriate staff. As R&D employees need to undergo relatively much
training, a lower rate of employee turnover is also typically associated with lower training
costs. A related argument is that firms with own R&D should provide employment security
as a means to get the employees involved in their firm as this is important for R&D activity.
Another argument goes back to Jovanovic’s (1979) job-worker matching paper according
which long job tenures reflect good matches between the job (or employer) and the
employee.
All in all, whether the relationship between worker turnover and R&D activity is positive or
negative is an empirical matter. However, the evidence is so far rather scant. An early paper
by Ettlie (1985) examines (by means cross-tabulations) the role of new personnel and net
manpower flows on process and product innovation in a small sample of food processing
firms. He finds that “new blood” is good for major process innovations, whereas the
opposite holds for product and minor process innovations.9 Kaiser et al. (2008) carry out a
considerably more elaborated analysis in which they distinguish between R&D employees
leaving and joining the firms. The outcome is number of patents applied for. Their results
indicate that the rate of R&D employees leaving the firm has, not surprisingly, a negative
9 The direction of causality could in both cases go the other way.
6
impact on its patent activity, while an inflow of R&D employees affects patents positively.
The net mobility effect is found to be positive. A recent paper by Müller and Peters (2010)
makes use of the firm level churning rate10 of R&D employees as a measure of workforce
turnover and their empirical analysis allows for non-linearities in the turnover-innovation
relationship. They find that an increase in the churning rate, up to a certain threshold, is
associated with a higher likelihood that the firm has innovated during the previous three
years. Plausibly, the threshold is lower for process innovations than for product innovations.
There are two reasons for why the role of employee turnover for R&D activity is particularly
interesting in a Chinese context. One is that after the removal of the lifelong employment
(“iron rice bowl”) system, employment security seems to have lost some of its importance.
Hence, average turnover rates are reported to be quite high (annual rates of 20-40 percent
have been mentioned); see Schmidt (2011). Another reason is that the new Labor Contracts
Law which came into force in 2008 aims at providing more employment security by
requiring formal employment contracts and introduces costs for employers in connection
with employee displacements. Thus, evidence shedding light on whether and to which
extent employee mobility enhances or decreases firms’ R&D activity is called for. It should
be noted that a traditional feature of Chinese internal labor markets has been a relatively
slow involvement of new employees in firms and organizations. This is because decision
rights typically lie with small informal groups, to become membership of which takes time.
Thus, in firms where these features still are present, a positive relationship between
employee turnover and R&D activity could be weaker.11
3. Data Description and Econometric Method
3.1. Data and Variables
The data used in this study comes from a survey collected by researchers at Department of
Organization and Human Resources at Renmin University (Beijing) in 2011. The survey
10 The churning rate is the employee turnover rate at which employment is unchanged, that is, it is a measure of the extent
of replacement hires during a given time period.
11 Japan is a country with similar traditions. A study by Aoshima (2009) finds a negative relationship between turnover of
engineers and innovation in Japanese firms.
7
targeted firms in five industries: energy, electronic information, biotechnology, equipment
manufacturing and environmental protection, all of which are considered as high tech
industries in China. For each firm, the data set contains in addition to basic firm information
such as total number of employees, establishment year, industry, etc., information about its
overall performance outcomes, input and output of innovation activities, the number of
total employees as well as of technical employees who voluntarily left the firm in each year
during the period 2008-2010, detailed information about the innovation environment,
organizational strategy and the use of HRM practices.
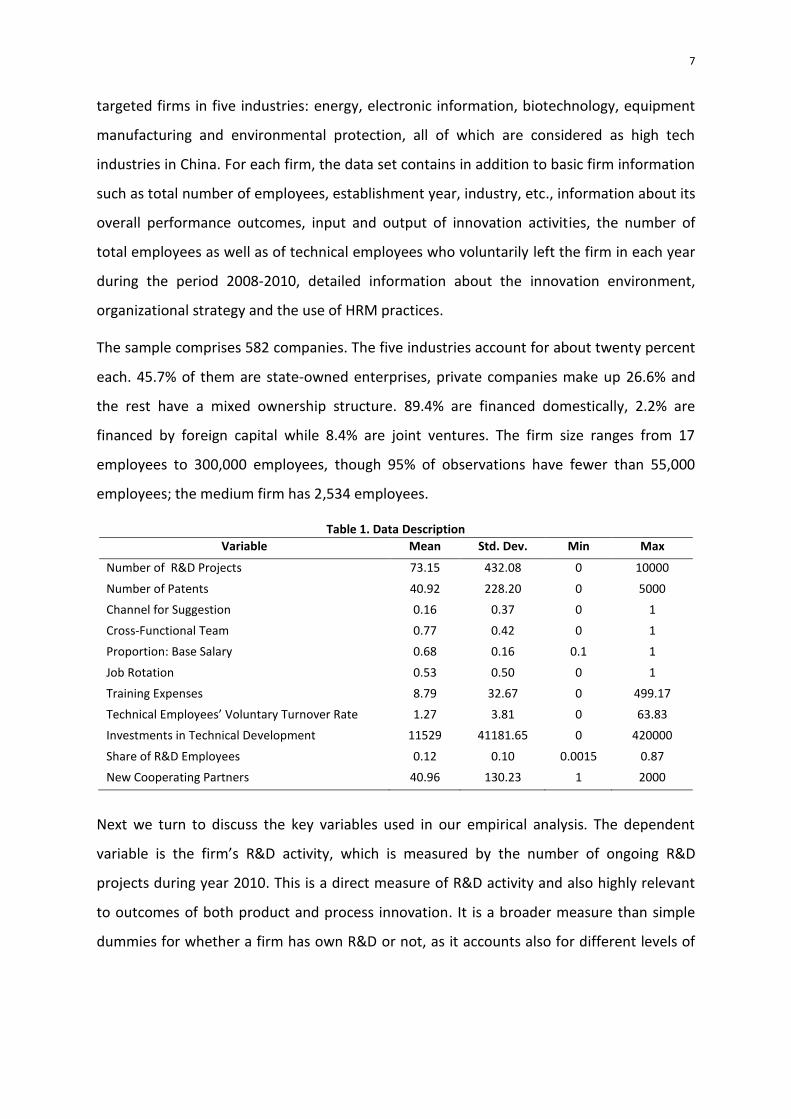
The sample comprises 582 companies. The five industries account for about twenty percent
each. 45.7% of them are state-owned enterprises, private companies make up 26.6% and
the rest have a mixed ownership structure. 89.4% are financed domestically, 2.2% are
financed by foreign capital while 8.4% are joint ventures. The firm size ranges from 17
employees to 300,000 employees, though 95% of observations have fewer than 55,000
employees; the medium firm has 2,534 employees.
Table 1. Data Description
Variable Mean Std. Dev. Min Max
Number of R&D Projects 73.15 432.08 0 10000
Number of Patents 40.92 228.20 0 5000
Channel for Suggestion 0.16 0.37 0 1
Cross-Functional Team 0.77 0.42 0 1
Proportion: Base Salary 0.68 0.16 0.1 1
Job Rotation 0.53 0.50 0 1
Training Expenses 8.79 32.67 0 499.17
Technical Employees’ Voluntary Turnover Rate 1.27 3.81 0 63.83
Investments in Technical Development 11529 41181.65 0 420000
Share of R&D Employees 0.12 0.10 0.0015 0.87
New Cooperating Partners 40.96 130.23 1 2000
Next we turn to discuss the key variables used in our empirical analysis. The dependent
variable is the firm’s R&D activity, which is measured by the number of ongoing R&D
projects during year 2010. This is a direct measure of R&D activity and also highly relevant
to outcomes of both product and process innovation. It is a broader measure than simple
dummies for whether a firm has own R&D or not, as it accounts also for different levels of
8
effort spent on R&D activities.12 On average, a sample firm has 73 ongoing R&D projects in
2010. The distribution is heavily skewed: 84 firms have no R&D project at all; the median
number of projects is 18, which is much lower than the average. 95 percent of the firms
have 280 or fewer ongoing R&D projects, while the most R&D active firms have over 1,000
projects.
The first of two key explanatory variables is the voluntary turnover rate of technical
employees. This is measured by the number of technical employees who left the firm
voluntarily13 divided by the total number of technical employees. As the dependent variable
in the regressions is ongoing R&D projects in 2010, we use a one-year lagged value of
employee turnover rate to reduce the problem of simultaneity. In general, the voluntary
turnover rate of technical employees is much lower than the overall worker turnover rate.
Thus, 125 firms did not experience any turnover of technical employees in 2010; 95 per cent
of the firms had less than 6.5 percent of their technical staff leaving voluntarily. On the
other hand, the highest turnover levels observed are over sixty percent.
The HRM practices used by the firm make up the other category of variables of special
interest in the current study. We have included three binary variables to measure the use of
the following practices: whether the firm uses: (1) cross-functional teams, 2) job rotation
schemes, and (3) special channels for employees’ suggestions. Two additional HRM
practices are measured as continuous variables: (4) the proportion of base salary of an R&D
employee’s annual income, and (5) the firm’s training expenditures in 2010. See Table 1 for
further details.
In addition, we enter a number of conventional control variables into the regressions. These
include firm size for which we use both the total number of employees and firm output
12 Two alternative measures utilized in earlier studies are number of patents and number of new products. Although both
are included in the survey, we have chosen not to focus on them. Firstly, because existing patents are likely to be a noisy measure of current innovation activities, especially in the rapidly developing high-tech industries in China. Secondly, patents only reflect part of the between-firm variation in innovation, since not every innovation is patented. The other outcome variable, the number of new products, has the disadvantage that what constitutes a new product is rather subjective and new products can also be developed by buying external resources rather than through internal innovation activities.
13 This concept presents no ambiguities in the context of Chinese firms as this is part of the regular reporting of their HR
offices.
9
(sales) in 2010. A sizable literature has shown that large firms are more likely to innovate.14
Another factor which has been extensively studied in the innovation literature is product
market structure. We do not have access to measures of competition faced by the sample
firms, but expect the dummy variables for industry affiliation to pick up the variation in
competitive pressure across (but not within) industries. A third factor which potentially
needs to be accounted for, especially in the Chinese context, is the ownership structure of
the company. This is in part because state owned enterprises (SOEs) tend to pay their
employees higher wages than corresponding firms with other forms of ownership and as a
consequence, typically have a lower employee turnover rate. However, SOEs may also be
more R&D active because they are more directly influenced by the government, which
recently has exerted great efforts to stimulate innovation. Yet another dummy variable is
included to indicate whether the capital is financed by a company registered abroad. This is
motivated by the fact that multinational firms may choose to limit their R&D activities in
their Chinese subsidiaries due to the relatively weak protection of intellectual property
rights (Yang and Jiang, 2007).
Firm-level network expansion is measured by the number of new cooperating partners in
2010. Networks have been found to be related to R&D and innovation outcomes in earlier
research (e.g., Rittera and Gemünden, 2004; Whittington et al., 2009; Huggins et al., 2012).
It is also likely that employee mobility could be facilitated by inter-firm cooperation. Hence
it is important to control this factor when examining the relation between the employee
turnover rate and R&D activity.
As we are treating R&D as a production process, it is also necessary to control for R&D input.
Here we control for total number of R&D employee, which represents the input of labor,
and a proxy for the input of capital - the total cost of technical development – including the
cost of in-house R&D, cost of introduction of new technology from other organizations, cost
of technological improvements, costs of consultancy, etc. Moreover, we also include the
total number of technical employees in order to control for the scale factor which
14 Employee turnover has also been shown to be positively correlated with firm size, which is another reason for
controlling for it.
10
influences both technical employee turnover rate and innovation activity. In the regressions
reported below, we use the log value of all continuous independent variables.
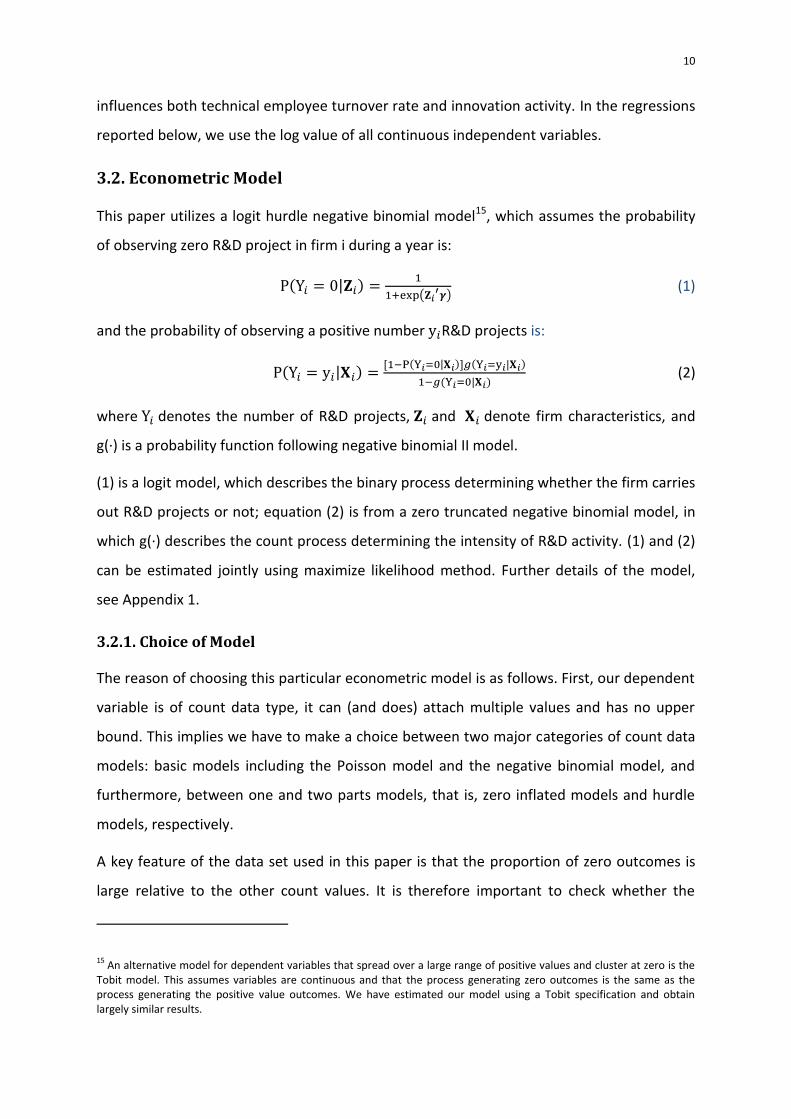
3.2. Econometric Model
This paper utilizes a logit hurdle negative binomial model15, which assumes the probability
of observing zero R&D project in firm i during a year is:
( | )
( )
(1)
and the probability of observing a positive number R&D projects is:
( | ) ( | ) ( | )
( | ) (2)
where denotes the number of R&D projects, and denote firm characteristics, and
g(∙) is a probability function following negative binomial II model.
(1) is a logit model, which describes the binary process determining whether the firm carries
out R&D projects or not; equation (2) is from a zero truncated negative binomial model, in
which g(∙) describes the count process determining the intensity of R&D activity. (1) and (2)
can be estimated jointly using maximize likelihood method. Further details of the model,
see Appendix 1.
3.2.1. Choice of Model
The reason of choosing this particular econometric model is as follows. First, our dependent
variable is of count data type, it can (and does) attach multiple values and has no upper
bound. This implies we have to make a choice between two major categories of count data
models: basic models including the Poisson model and the negative binomial model, and
furthermore, between one and two parts models, that is, zero inflated models and hurdle
models, respectively.
A key feature of the data set used in this paper is that the proportion of zero outcomes is
large relative to the other count values. It is therefore important to check whether the
15 An alternative model for dependent variables that spread over a large range of positive values and cluster at zero is the
Tobit model. This assumes variables are continuous and that the process generating zero outcomes is the same as the process generating the positive value outcomes. We have estimated our model using a Tobit specification and obtain largely similar results.
11
processes generating zero outcomes and strictly positive outcomes differ. Since the factors
influencing firms’ decision regarding whether to innovate or not can be quite different from
those influencing the decision concerning the intensity of innovation, it makes intuitively
sense to relax the constraint assumption that the zeros are generated in the same way as
positives. Furthermore, even if the same factors influence both the decision to innovate and
the innovation intensity, their influences may exhibit different patterns.
The next choice is between hurdle count models and zero inflated models. The difference
between them is that, in zero inflated models the zero outcomes can arise in two ways: as a
consequence of strategic decisions and incidentally, while the hurdle count model assumes
that zeros are exclusively the outcomes of strategic decisions (for details, see Lambert, 1992;
Winkelmann, 2008). In the current case, it seems very unlikely that a firm that has adopted
an innovation strategy would not have any ongoing R&D projects during the year.
Consequently, we think the hurdle count model is a more natural specification to adopt in
this context.
There is a further choice between a hurdle Poisson model and a hurdle negative binomial
model. The former model nests in the latter: the Poisson model assumes that the variance
equals the conditional expectation, while the hurdle negative binomial allows the variance
to grow faster than the expectation (over-dispersion). The likelihood ratio test of over-
dispersion factor alpha confirms that in our case over-dispersion is indeed present in the
second part of model (see Table 2, below).
3.2.2. Marginal Effects
As the coefficient estimates from the hurdle negative binomial models are difficult to
interpret, we have computed marginal effects implied by the estimated models. For binary
part of the model, the marginal effects describe the influences on the probability of being
an innovative firm; for count part of the model, the marginal effects describe the influences
on the expected number of R&D projects among innovating firms. These computations and
their relations to the model estimations are discussed in more detail in Appendix 1.
Subsequently, for each part of the model, two types of marginal effects will be reported: (i)
average marginal effects across all observations and (ii) conditional marginal effects for
certain types of firms. The average marginal effects across all observations are calculated by
12
first obtaining individual marginal effects by inserting the true values of the regressors into
the marginal effect formula for each observation after which we compute the average of
the individual marginal effects. The conditional marginal effects for certain types of firms
are calculated by inserting given values (e.g., mean values) into the formula of marginal
effect.
4. Results
4.1. The Roles of Employee Turnover Rate and HRM practices
Table 2 shows the estimates of the hurdle negative binomial model with full set of
regressors. Columns (1)-(3) report the results of the count part, that is, the association of
the regressors with the number of R&D projects for firms that have positive number of
ongoing R&D projects during 2010. The results of the binary part, the determinants of the
probability of having a positive number of R&D projects, are in columns (4)-(6). Columns (1)
and (4) give the direct estimates of the parameters and columns (2) and (5) report the
average marginal effects. Columns (3) and (6) contain the conditional marginal effects,
which describe the situation for a domestically, non-state owned firm in the energy industry
and with HRM practices of job rotation and cross functional team. Henceforth this will be
referred to as our “example firm”.
Most regressors are found to influence the two processes differently. A one percentage
point increase in employee turnover rate is associated with a decrease in the expected
number of R&D projects by a factor of ( ) ; however, the same increase
in employee turnover rate leads to an increase in the log value of relative probability of
being an innovative firm by 1.21. The average marginal effects have a more direct
interpretation: on average, a one percentage point increase in employee turnover rate is
associated with three fewer R&D projects, but a 1.105 increase in the probability of having
positive number R&D projects. For the example firm described above, a one percentage
point increase in the employee turnover rate is associated with about one fewer R&D
project, but a 0.158 increase in the probability of having a positive number of R&D projects.
The coefficients as well as the marginal effects are significant at the five per cent level.
13
The three types of estimates all paint a similar picture: other things equal, R&D active firms
tend to have a higher level of technical employee turnover rates than R&D inactive firms;
but among firms that have crossed the hurdle and engaged in one or more R&D projects,
employee turnover is negatively correlated with the intensity of R&D activity. A certain level
of employee turnover seems to be necessary to bring new ideas that initiate R&D projects
and to innovate. However, once firms start to carry out their own R&D projects, employee
turnover begins to play a negative, albeit small, role so that firms with higher employee
turnover are likely to have fewer R&D projects (other things being equal).
According to the estimates in Table 2, of the HRM practices examined, the negative
coefficient to job rotation is significant at five per cent level in the binary part, while the
positive estimates to cross-functional teams and training expenses are significant at five per
cent level in the count part. Other things equal, introduction of cross-functional teams is
associated with a higher number of R&D projects by a factor of exp(0.26) = 1.30. For the
example firm, the average number of R&D projects is predicted to increase by around six if
the firm has implemented cross-functional teams.
Training expenditures are found to be positively and significantly associated with a firm’s
R&D activities, which is not surprising. However, its influence is quite small: an increase of
10,000 RMB in the firm’s training expenditure is associated with an increase in expected
number of R&D projects by 0.3 percent.
A potential problem is that the observed impact of employee turnover and HRM practices
could be due to a “spurious” correlation. It is possible that, instead of employee turnover
affecting R&D activity, both employee turnover and innovation are driven by an unobserved
third factor. An example of such an unobserved factor is management quality. Firms with
high management quality may have fewer employees voluntarily resigning and are more
likely to adopt the high-performance HRM practices and to have more R&D projects. As a
test of this spurious correlation, we have performed a “placebo” analysis, in which we
replace the turnover rate for technical employees with that for non-technical employees.
The idea is that if the observed association between technical employee turnover and R&D
is actually driven by a third factor (such as management quality), a similar association
should also be observed between the turnover of other types of employees and R&D - since
general management quality is likely to influence the turnover of different types of
14
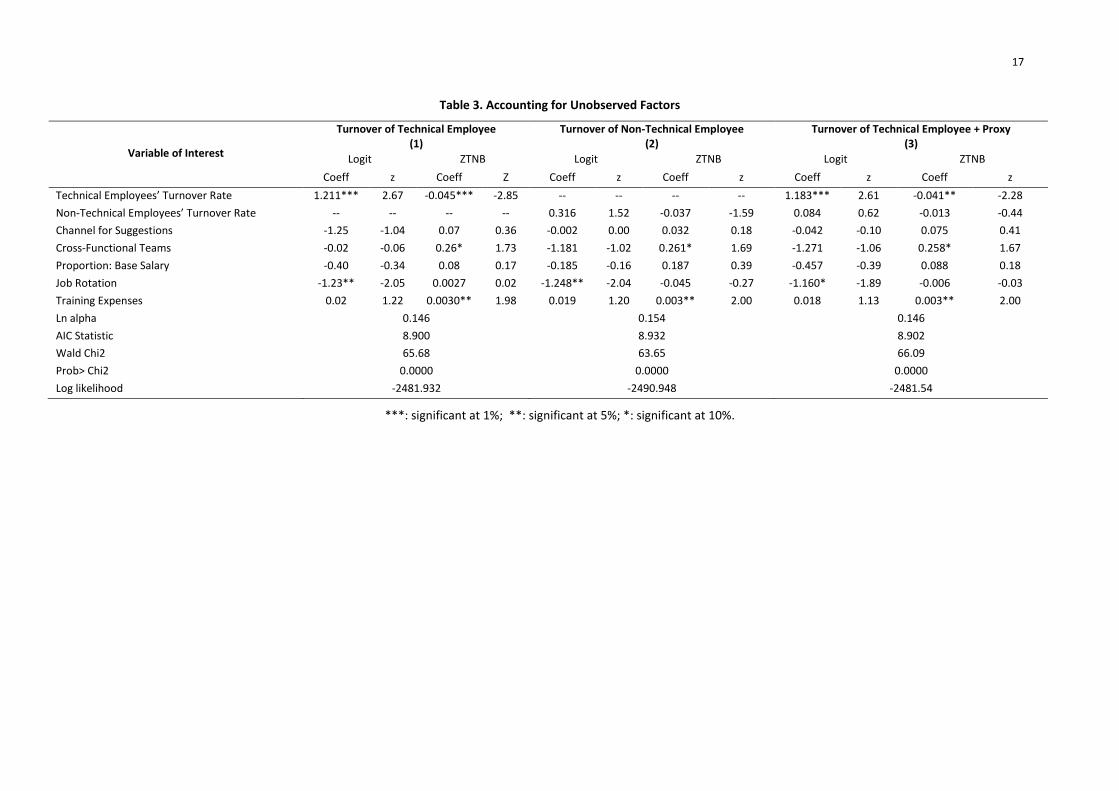
employees in a similar way. The results of the placebo analysis are shown in Table 3.
Column (1) gives for comparison purposes the estimates for the turnover rate of the
technical employees. Column (2) shows the estimates for turnover rate of non-technical
employees, where we can see small and insignificant estimates which are quite different
from those in column (1). These findings imply that a major part of the differences in
innovation activity is due to the difference in technical employee turnover rates across firms,
rather than a third unobserved factor such as management quality.
Another potential problem with our estimates of the impacts of employee turnover and
HRM practices is that they may be biased because of endogeneity. Although placebo test
does indicate that the observed association is not due to the third unobserved factor, the
test does not exclude the potential bias caused by omitting variable that correlated with
both turnover of technical employee and innovation activity. Since management quality is
not directly observable in the data set, endogeneity bias cannot be ruled out. We know its
direction, however, if the correlation directions among employee turnover, number of R&D
projects and management quality can be assumed. Because it is likely that the voluntary
employee turnover rate is negatively correlated with the number of R&D projects and
management quality, while HRM practices and management quality are positively
correlated with the number of R&D projects, the absolute values of unbiased estimates of
employee turnover rate and HRM practices should both be smaller. As a check for possible
bias caused by endogeneity, we include the turnover of non-technical employees into the
regression as a proxy variable for unobserved factors. As shown in column (3) of Table 3,
the inclusion of the proxy variable only leads to a tiny reduction in the magnitude of
coefficient estimates in column (1), which supports our previous results and confirms our
discussion about the direction of bias caused by unobserved factors.
As for the control variables, a few results are worth noting. For example, an increase in the
number of external cooperation partners has a significant and positive effect on the number
of R&D projects for the innovating firms. A one percent increase in the number of new co-
operators is associated with around 0.4 percent increase in the number of R&D projects,
which corresponds to six additional R&D projects in our example firm.
Firm size, as measured by the total number of employees, is associated with a higher
intensity of R&D projects. Thus, a one per cent increase in the firm size is accompanied by a
15
0.3 per cent increase in ongoing projects in the R&D active firms. The size of the firm is,
however, uncorrelated with the probability of being R&D active.
We observe no differences across the five industries in the probability of firms being
innovative. But for the R&D active firms, there are some differences in the intensity of R&D
activities. Firms in the energy industry have fewer ongoing projects than firms in the
information, equipment manufacturing and environmental protection industries.
SOEs are more likely to carry out R&D projects, but among firms actively involved in R&D,
SOEs have fewer projects. This indicates that SOEs may follow the government policy and
start R&D projects, but are in reality exerting less effort in R&D than other R&D active firms.
Finally, firms financed by foreign capital have, as expected, a lower number of ongoing R&D
projects although it should be pointed out that the difference is not very precisely
measured.

16
Table 2. Estimation Results of Hurdle Negative Binomial Model with Full Set of Regressors
Variable
ZTNB Logit
(1) (2) (3) (4) (5) (6)
Coeff. Z AME Z CME1 z Coeff. z AME z CME1 z
Technical Employees’ Turnover Rate -0.045*** -2.85 -3.205*** -2.78 -1.162** -2.4 1.211*** 2.67 0.105*** 2.74 0.158** 2.15
Channel for Suggestions 0.07 0.36 4.795 0.35 1.761 0.35 -1.25 -1.04 -0.002 -0.06 -0.003 -0.06
Cross-Functional Teams 0.26* 1.73 17.564* 1.81 5.990* 1.77 -0.02 -0.06 -0.088 -1.4 -0.104 -1.17
Proportion: Base Salary 0.08 0.17 5.592 0.17 2.027 0.17 -0.40 -0.34 -0.034 -0.34 -0.052 -0.34
Job Rotation 0.0027 0.02 0.190 0.02 0.069 0.02 -1.23** -2.05 -0.113** -2.01 -0.103 -1.15
Training Expenses 0.0030** 1.98 0.213* 1.9 0.077* 1.8 0.02 1.22 0.002 1.22 0.003 1.01
Log Investment of Technical Development 0.06 0.96 4.617 0.96 1.673 0.93 0.11 0.42 0.010 0.42 0.015 0.41
Log #of R&D Employees 0.22*** 3.06 15.722*** 2.95 5.697*** 2.76 -0.74** -2.22 -0.064 -2.29 -0.097 -1.43
Log #of Technical Employees -0.26** -2.40 -18.283** -2.33 -6.626** -2.22 1.03 2.11 0.090** 2.16 0.135 1.47
Log # of New Cooperating Partners 0.36*** 5.04 25.595*** 4.6 9.275*** 3.06 0.27 0.92 0.024 0.92 0.036 0.9
Log Output 0.11 1.53 8.160 1.52 2.957 1.48 -0.04 -0.15 -0.004 -0.15 -0.006 -0.15
Log # of Employees 0.32*** 3.57 22.858*** 3.3 8.284*** 2.88 -0.25 -0.63 -0.021 -0.63 -0.032 -0.63
Energy Industry -0.20 -0.71 -13.111 -0.76 -5.628 -0.71 -15.24 -0.03 -0.541 -0.26 -0.154 -1.42
IT Industry 1.16*** 4.83 117.933*** 3.15 56.322** 2.09 -14.68 -0.02 -0.477 -0.38 -0.846*** -7.79
Equipment Manufacturing Industry 0.45** 2.10 37.034* 1.8 14.611* 1.66 -14.10 -0.02 -0.450 -0.41 -0.846*** -7.79
Environmental Protection Industry 1.08*** 3.65 126.681** 2.29 50.127** 2.17 -15.09 -0.02 -0.623 -0.31 -0.846*** -7.79
Financed by Foreign Capital -0.47 -1.46 -0.703 -0.09 -0.253 -0.09 18.38 0.00 0.000 --- 0.000 ---
SOE -0.01 -0.09 -26.905* -1.83 -9.675* -1.7 0.46 1.29 0.040 1.3 0.051 1.01
Alpha 1.1572 .0875 Likelihood-ratio test of alpha=0: chibar2(01) = 4.4e+04 Prob>=chibar2 = 0.000
AIC Statistic 8.900 Wald Chi 2(18) 65.68
Log likelihood -2481.93 Prob> chi2 0.0000
Number of Observations 562
Notes: .Conditonal on firms in energy industry, with job rotation and cross functional team but no channel for employee suggestion and have mean values as to the continuous variables. ***: Significant at 1%; **: significant at 5%; *: significant at 10%.
17
Table 3. Accounting for Unobserved Factors
Variable of Interest
Turnover of Technical Employee (1)
Turnover of Non-Technical Employee (2)
Turnover of Technical Employee + Proxy (3)
Logit ZTNB Logit ZTNB Logit ZTNB
Coeff z Coeff Z Coeff z Coeff z Coeff z Coeff z
Technical Employees’ Turnover Rate 1.211*** 2.67 -0.045*** -2.85 -- -- -- -- 1.183*** 2.61 -0.041** -2.28
Non-Technical Employees’ Turnover Rate -- -- -- -- 0.316 1.52 -0.037 -1.59 0.084 0.62 -0.013 -0.44
Channel for Suggestions -1.25 -1.04 0.07 0.36 -0.002 0.00 0.032 0.18 -0.042 -0.10 0.075 0.41
Cross-Functional Teams -0.02 -0.06 0.26* 1.73 -1.181 -1.02 0.261* 1.69 -1.271 -1.06 0.258* 1.67
Proportion: Base Salary -0.40 -0.34 0.08 0.17 -0.185 -0.16 0.187 0.39 -0.457 -0.39 0.088 0.18
Job Rotation -1.23** -2.05 0.0027 0.02 -1.248** -2.04 -0.045 -0.27 -1.160* -1.89 -0.006 -0.03
Training Expenses 0.02 1.22 0.0030** 1.98 0.019 1.20 0.003** 2.00 0.018 1.13 0.003** 2.00
Ln alpha 0.146 0.154 0.146
AIC Statistic 8.900 8.932 8.902
Wald Chi2 65.68 63.65 66.09
Prob> Chi2 0.0000 0.0000 0.0000
Log likelihood -2481.932 -2490.948 -2481.54
***: significant at 1%; **: significant at 5%; *: significant at 10%.
18
4.2. The Interaction between Employee Turnover Rate and HRM Practices
Table 4 presents the average marginal effects from estimations of three different models. The first
model includes employee turnover rate as the key independent variable, the second model only
includes HRM practices variables, but not the employee turnover rate, and the third model
includes the employee turnover rate as well as the HRM variables.
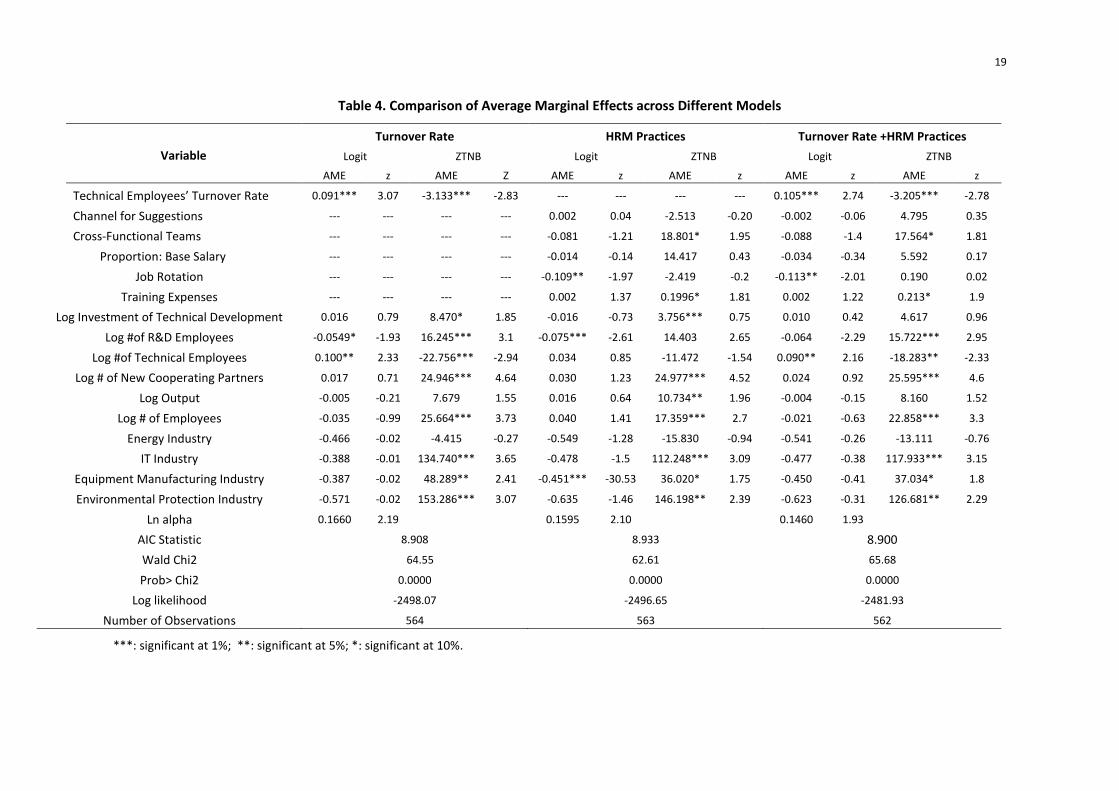
The magnitudes of statistically significant estimates are quite similar in all three models. Notably,
the association between the employee turnover rate and R&D activity does not change much
when the HRM practices are entered into the model. Nor does the inclusion of the employee
turnover rate into the regression give rise to much change in the estimates of the HRM practices.
These results suggest that although the turnover rate of technical employees and HRM practices
both influence R&D activity, their influences seem to operate via different channels - as the
influence of the turnover rate is not picking up the impact of HRM practices. In fact, simple OLS
regressions16 show that the HRM practices are only weakly correlated with differences in the
employee turnover rate.
A closer inspection reveals that the magnitude of the association between employee turnover rate
and intensity of R&D activity varies among firms with different sets of HRM practices. This is
shown in Table 5, which contains the conditional marginal effects of firms with different sets of
HRM practices. Column (1) reports the marginal effects for firms which have no channels for
employee suggestions, cross-functional teams, nor job rotation schemes; column (2) is for firms
having cross-functional teams and job rotation schemes, but no channel for employee suggestions;
column (3) shows marginal effects for firms which have adopted all the three above-mentioned
HRM practices. To make the results comparable, the conditional marginal effects are calculated for
our example firm, which is assumed to be in the energy industry, non-state owned, and has the
sample mean values of the other firm characteristics.
16 Not shown, but available from the authors upon request.
19
Table 4. Comparison of Average Marginal Effects across Different Models
Variable
Turnover Rate HRM Practices Turnover Rate +HRM Practices
Logit ZTNB Logit ZTNB Logit ZTNB
AME z AME Z AME z AME z AME z AME z
Technical Employees’ Turnover Rate 0.091*** 3.07 -3.133*** -2.83 --- --- --- --- 0.105*** 2.74 -3.205*** -2.78
Channel for Suggestions --- --- --- --- 0.002 0.04 -2.513 -0.20 -0.002 -0.06 4.795 0.35
Cross-Functional Teams --- --- --- --- -0.081 -1.21 18.801* 1.95 -0.088 -1.4 17.564* 1.81
Proportion: Base Salary --- --- --- --- -0.014 -0.14 14.417 0.43 -0.034 -0.34 5.592 0.17
Job Rotation --- --- --- --- -0.109** -1.97 -2.419 -0.2 -0.113** -2.01 0.190 0.02
Training Expenses --- --- --- --- 0.002 1.37 0.1996* 1.81 0.002 1.22 0.213* 1.9
Log Investment of Technical Development 0.016 0.79 8.470* 1.85 -0.016 -0.73 3.756*** 0.75 0.010 0.42 4.617 0.96
Log #of R&D Employees -0.0549* -1.93 16.245*** 3.1 -0.075*** -2.61 14.403 2.65 -0.064 -2.29 15.722*** 2.95
Log #of Technical Employees 0.100** 2.33 -22.756*** -2.94 0.034 0.85 -11.472 -1.54 0.090** 2.16 -18.283** -2.33
Log # of New Cooperating Partners 0.017 0.71 24.946*** 4.64 0.030 1.23 24.977*** 4.52 0.024 0.92 25.595*** 4.6
Log Output -0.005 -0.21 7.679 1.55 0.016 0.64 10.734** 1.96 -0.004 -0.15 8.160 1.52
Log # of Employees -0.035 -0.99 25.664*** 3.73 0.040 1.41 17.359*** 2.7 -0.021 -0.63 22.858*** 3.3
Energy Industry -0.466 -0.02 -4.415 -0.27 -0.549 -1.28 -15.830 -0.94 -0.541 -0.26 -13.111 -0.76
IT Industry -0.388 -0.01 134.740*** 3.65 -0.478 -1.5 112.248*** 3.09 -0.477 -0.38 117.933*** 3.15
Equipment Manufacturing Industry -0.387 -0.02 48.289** 2.41 -0.451*** -30.53 36.020* 1.75 -0.450 -0.41 37.034* 1.8
Environmental Protection Industry -0.571 -0.02 153.286*** 3.07 -0.635 -1.46 146.198** 2.39 -0.623 -0.31 126.681** 2.29
Ln alpha 0.1660 2.19 0.1595 2.10 0.1460 1.93
AIC Statistic 8.908 8.933 8.900
Wald Chi2 64.55 62.61 65.68
Prob> Chi2 0.0000 0.0000 0.0000
Log likelihood -2498.07 -2496.65 -2481.93
Number of Observations 564 563 562
***: significant at 1%; **: significant at 5%; *: significant at 10%.
20
Table 5. Comparison of Marginal Effects Conditional on Different HRM Practices
Variable (1) (2) (3)
Logit ZTNB Logit ZTNB Logit ZTNB
Technical Employees’ Turnover Rate 0.0180 -.897** 0.158** -1.162** 0.160* -1.281**
Channel for Suggestions -0.0004 1.259 -0.003 1.761 -0.003 1.799
Cross-Functional Teams -0.036 5.138** -0.104 5.990* -0.107 7.339
Proportion: Base Salary -0.006 1.595 -0.052 2.027 -0.052 2.278
Job Rotation -0.035 0.479 -0.103 0.069 -0.105 0.684
Training Expenses 0.0003 .0595* 0.003 0.077* 0.003 0.085
Log Investment of Technical Development
0.002 1.279 0.015 1.673 0.015 1.827
Log #of R&D Employees -0.011 4.228*** -0.097 5.697*** -0.099 6.039**
Log # of New Cooperating Partners 0.004 6.600*** 0.036 9.275*** 0.036 9.427***
Log output -0.0007 2.188 -0.006 2.957 -0.006 3.125
Log# of employees -0.004 6.324*** -0.032 8.284*** -0.033 9.032**
***: significant at 1%; **: significant at 5%; *: significant at 10%.
The estimates for the binary (that is, logit) part of model reveal little of interest, while there are
more results worth of notice in the count (ZTNB) part of the model. Overall, for the example firm,
the estimates of the employee turnover rate in all three columns are close to -1, indicating that a
one percentage point increase in employee turnover is associated with one less R&D project.
Interestingly, the marginal effect of the employee turnover rate increases slightly with the number
of HRM practices that the firm has adopted: for a firm without any of these three HRM practices,
the marginal effect of the turnover rate is -.9; for a firm with cross-functional teams and job
rotation, but no channel for employee suggestions, it is -1.2; for a firm with all three HRM practices,
the marginal effect of the turnover rate is -1.3. It seems that R&D activity in firms with more
innovative HRM practices is more “sensitive” to technical employee turnover. This could be
because as a consequence of the use of these High Performance HRM Practices, the employees
have become more valuable to the firm. Thus, as some of these employees leave the firm, they
bring a marginally larger negative effect on firm’s R&D activity than in companies that have not
implemented these practices.
21
5. Concluding Remarks
This paper has examined the empirical relationships between firms’ technical employee turnover
rates, HRM practices and R&D activities. Using Chinese firm-level survey data and a logit hurdle
negative binomial model, the study finds a significant negative association between technical
employees’ voluntary turnover rate and intensity of R&D activities. Moreover, this relationship is
robust to inclusion of HRM practices in the model. Likewise, the inclusion of the employee turnover
rate does not give rise to noteworthy changes in the coefficients to the HRM practices. Thus, the
technical employees turnover rate and HRM practices both influence firms’ R&D activities, but
through different and independent channels.
The relatively high employee turnover rate is identified as another potential factor hampering R&D
activities among Chinese firms and especially their decisions regarding how many in-house R&D
projects to carry out. Unlike a few earlier studies that find positive influences of labor mobility on
R&D and innovation, this paper observes a rather different situation in a developing economy like
China. Several differences in the R&D environment may be part of an explanation of the differences
observed.
First, in China, the protection of intellectual property is relatively poor. For a given level of
employee mobility, Chinese firms face a higher risk of being copied by competitors and losing
benefits of R&D due to the transmission of information via leavers. Second, due to the large
population, the average number of job candidates for one position in China is very large, which
results in higher recruitment cost and higher risk of mismatch. Both factors reduce the net benefit
brought by newcomers. So, again, firms facing high labor mobility are reluctant to R&D because
high labor mobility erodes its net benefits. Third, Chinese corporate culture is more conservative
than Western culture. It is generally believed that the best strategy for new joiners is “shut the
mouth and open the eyes and ears”, which limits the spillover of new ideas from new joiners. Since
the positive effect of labor mobility on R&D (which is mainly brought by new employees joining the
firm) is smaller, it is less likely that labor mobility facilitates R&D activities. Moreover, within a
Chinese firm, it is usually small informal groups which actually make the decisions. A newcomer’s
ideas are not be valued unless she is involved in a small group or a member thereof speaks for her.
As it takes time for small groups to accept newcomers, Chinese firms are slower in observing
newcomer’s innovative ideas and in reaping the benefits of having them. Lastly, the general level of
22
trust in China is lower (Wang et al., 2011), which means that the newcomers are less trusted and
hence their ideas are less valued. On the other hand, lack of trust is mutual, and so, new employees
do not commit themselves to R&D.
Thus, there are number of reasons for why the employee turnover is less likely to facilitate R&D
activity in China. This list of characteristics specific to the internal labor markets of Chinese firms is
of course mainly speculative. It should be noted, however, that Aoshima (2008) also finds a
negative effect of the mobility of engineers on Japanese companies’ innovation performance. As
China and Japan have many elements of a conservative corporate culture in common, this may
explain why the labor mobility seems to influence innovation activity in China and Japan differently
than in Western countries.
The employee turnover rate is not found to be reduced by the adoption of modern high
performance HRM practices examined in this paper, such as cross-functional teams, job rotation
schemes and channels for employees’ suggestions. On the other hand, we do find that firms that
have introduced these HRM practices are more negatively affected by an increase in the employee
turnover, suggesting that these practices are contributing to an increase in the value of the
employees.
These results imply the possibility of encouraging indoor R&D activity by anchoring labor mobility at a
suitable level – not too low to block idea exchange and not too high to risk the fruit of indoor R&D.
Considering that firms may not have full control of employee turnover (at least not through the
examined HRM practices), policy makers who is interested in facilitating R&D activity may consider
using policy to adjust general labor mobility to a suitable level.
23
References
Aoshima, Y. (2008), “Mobility of R&D Workers and Technological Performance," Japan Labor
Review, 5, 33-60.
Applebaum, E. and R. Batt (1994), The New American Workplace. Ithaca, ILR Press
Balsvik, R. (2011), “Is Labor Mobility a Channel for Spillovers from Multinationals? Evidence from
Norwegian Manufacturing”, Review of Economics and Statistics, 93(1): 285-297
Björkman, I. and X. Fan (2002), “Human Resource Management and the Performance of Western
Firms in China”, International Journal of Human Resource Management, 13(6): 853-864
Bloom, N. and J. van Reenen (2011), “Human Resource Management and Productivity”, in: O.
Ashenfelter and D. Card (eds.), Handbook of Labor Economics Vol. 4, Part 2, Amsterdam: Elsevier,
1697-1767
Chow, I., J. Huang and S. Liu (2008), “Strategic HRM in China: Configurations and Competitive
Advantage”, Human Resource Management, 47(4): 687-706
Ettlie, J. (1985), “The Impact of Interorganizational Manpower Flows on the Innovation Process”,
Management Science, 31: 1055-1071
Freeman, R. and E. Lazear (1995), “An Economic Analysis of Works Councils”, in J. Rogers and W.
Streeck (eds.), Works Councils: Consultation, Representation, and Cooperation in Industrial
Relations. Chicago, University of Chicago Press, 27-52
Greene, W. (2008), “Functional forms for the Negative Binomial Model for Count Data”, Economics
Letters, 99: 585–590
Greene, W. (2012), Econometric Analysis, 7th edition. New Jersey: Prentice Hall
Huggins R., A. Johnston and P. Thompson (2012),”Network Capital, Social Capital and Knowledge
Flow: How the Nature of Inter-organizational Networks Impacts on Innovation”, Industry and
Innovation, 19(3): 203-23
Huselid, M. (1995), “The Impact of Human Resource Management Practices on Turnover,
Productivity and Corporate Financial Performance”, Academy of Management Journal, 38(3): 635-
672
Jimenez-Jimenez, D. and R. Sanz-Valle (2005), “Innovation and Human Resource Management Fit:
An Empirical Study”, International Journal of Manpower, 26(4): 364-381
Kaiser, U., H. Kongsted, and T. Rønde (2008), Labor Mobility and Patenting Activity. CAM Working
Paper No. 2008-07
Laursen, K. and N. Foss (2003),”New Human Resource Management Practices, Complementarities
and the Impact on Innovation Performance”, Cambridge Journal of Economics, 27(2): 243-263
24
Laursen, K. and N. Foss (2012), “Human Resource Management Practices and Innovation”,
forthcoming in: M. Dodgson, D. Gann and N. Phillips (eds.), Handbook of Innovation Management.
Oxford, Oxford University Press
Lazear, E. (1995), “Hiring Risky Workers”, in I. Ohashi and T. Tachibanaki (eds.), Internal Labour
Markets, Incentives, and Employment. New York, St. Martins Press
McDowell A. (2003), “From the Help Desk: Hurdle Models”, The Stata Journal (2003), 3(2): 178–
184
Michie, J. and M. Sheehan (2003), “Labour Market Deregulation, “Flexibility” and Innovation”,
Cambridge Journal of Economics, 27(1): 123-143
Müller, K. and B. Peters (2010), Churning of R&D Personnel and Innovation. ZEW Discussion Paper
No. 10-032
Møen, J. (2005), “Is Mobility of Technical Personnel a Source of R&D Spillovers?”, Journal of Labor
Economics, 23(1): 81-114
Ngo, H., C. Lau and S. Foley (2008), “Strategic Human Resource Management, Firm Performance,
and Employee Relations Climate in China”, Human Resource Management, 47(1): 73-90
Parrotta P. and D. Pozzoli (2012), “Learning by Hiring and Productivity: The Case of Denmark”,
RAND Journal of Economics, 43(1): 167-185
Piegorsch, W. (1992) Complementary Log Regression for Generalized Linear Models, The American
Statistician, Vol. 46(2): 94-99
Rittera T. and H. Gemünden (2004) “The Impact of A Company’s Business Strategy on Its
Technological Competence, Network Competence and Innovation Success”, Journal of Business
Research, 57: 548– 556
Santos Silva, J. and F. Covas (2000), “A Modified Hurdle Model for Completed Fertility,” Journal of
Population Economics, 13: 173-188
Schmidt, C. (2011), “The Battle for China’s Talents”, Harvard Business Review, March, 25-27
Shaw J., T-Y. Park, and E. Kim (2012), “A Resource-based Perspective on Human Capital Losses,
HRM Investments, and Organizational Performance”, Strategic Management Journal, 23
Wang, L., J. Yeung and M. Zhang (2011), “The Impact of Trust and Contract on Innovation
Performance: The Moderating Role of Environmental Uncertainty”, International Journal of
Production Economics, 134: 114–122
Wei, L-Q., J. Liu and N. Herndon (2011), “SHRM and Product Innovation: Testing the Moderating
Effects of Organizational Culture and Structure in Chinese Firms”, International Journal of Human
Resource Management, 22(1): 19-33
25
Wei, L-Q., J. Liu, Y. Zhang and R. Chiu (2008), “The Role of Corporate Culture in the Process of
Strategic Human Resource Management: Evidence from Chinese Enterprises”, Human Resource
Management, 47(4):777-794
Whittington K., J. Owen-Smith and W. Powell (2009) “Networks, Propinquity, and Innovation in
Knowledge-intensive Industries”, Administrative Science Quarterly, 54: 190-122
Winkelmann, R. (2008), Econometric Analysis of Count Data. Heidelberg, Spinger-Verlag
World Bank (2011), China 2030: Building a Modern, Harmonious, and Creative High-Income Society.
Washington D.C.
Yang, Q. and C. Jiang (2007), “Location Advantages and Subsidiaries’ R&D Activities in Emerging
Economies”, Asia Pacific Journal of Management, 24: 341-358
Zaninotto, P. and E. Falaschetti (2011), “Comparison of Methods for Modeling a Count Outcome
with Excess Zeros: Application to Activities of Daily Living (ADL-s)”, Journal of Epidemiological
Community Health, 65: 205-210.
Zhou, H., R. Dekker and A. Kleinknecht (2011), “Flexible Labor and Innovation Performance:
Evidence from Longitudinal Firm-Level Data”, Industrial and Corporate Change, 20(3): 941-968
Zoghi, C., R. Mohr and P. Meyer (2010), “Workplace Organization and Innovation”, Canadian
Journal of Economics, 43(2): 622-629
I
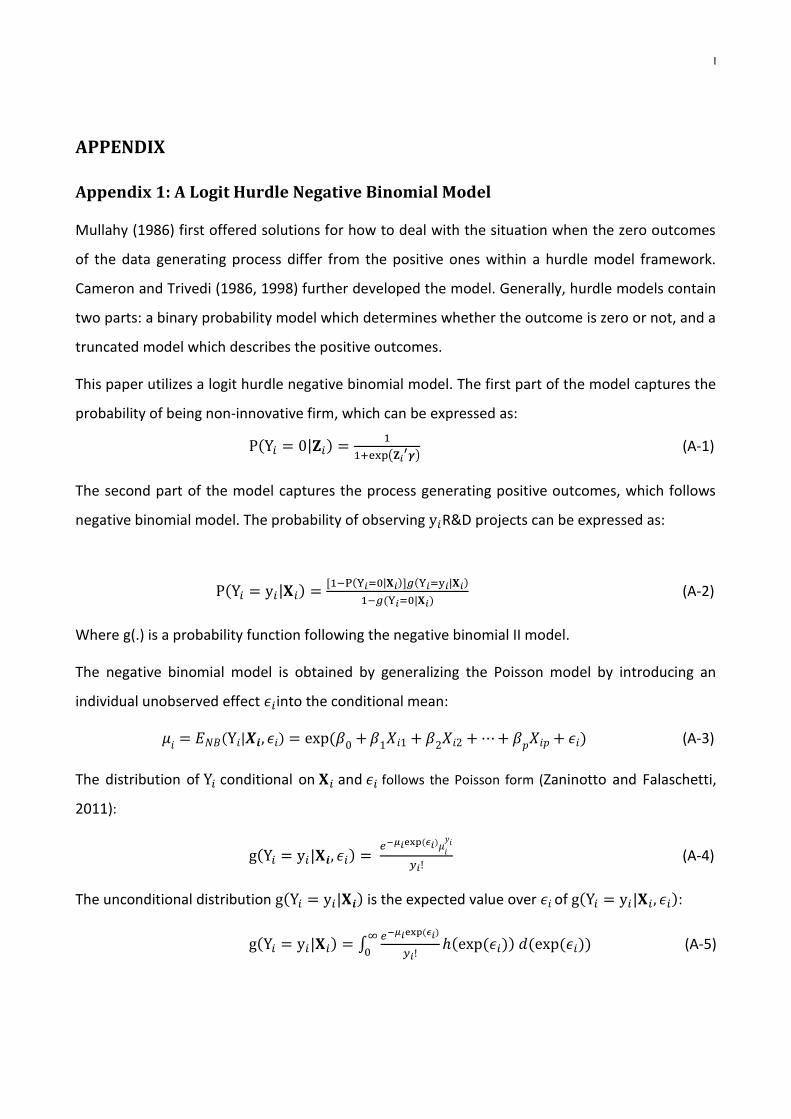
APPENDIX
Appendix 1: A Logit Hurdle Negative Binomial Model
Mullahy (1986) first offered solutions for how to deal with the situation when the zero outcomes
of the data generating process differ from the positive ones within a hurdle model framework.
Cameron and Trivedi (1986, 1998) further developed the model. Generally, hurdle models contain
two parts: a binary probability model which determines whether the outcome is zero or not, and a
truncated model which describes the positive outcomes.
This paper utilizes a logit hurdle negative binomial model. The first part of the model captures the
probability of being non-innovative firm, which can be expressed as:
( | )
( )
(A-1)
The second part of the model captures the process generating positive outcomes, which follows
negative binomial model. The probability of observing R&D projects can be expressed as:
( | ) ( | ) ( | )
( | ) (A-2)
Where g(.) is a probability function following the negative binomial II model.
The negative binomial model is obtained by generalizing the Poisson model by introducing an
individual unobserved effect into the conditional mean:
( | ) ( ) (A-3)
The distribution of conditional on and follows the Poisson form (Zaninotto and Falaschetti,
2011):
( | ) ( )
(A-4)
The unconditional distribution ( | ) is the expected value over of ( | ):
( | ) ∫ ( )
( ( )) ( ( )
) (A-5)
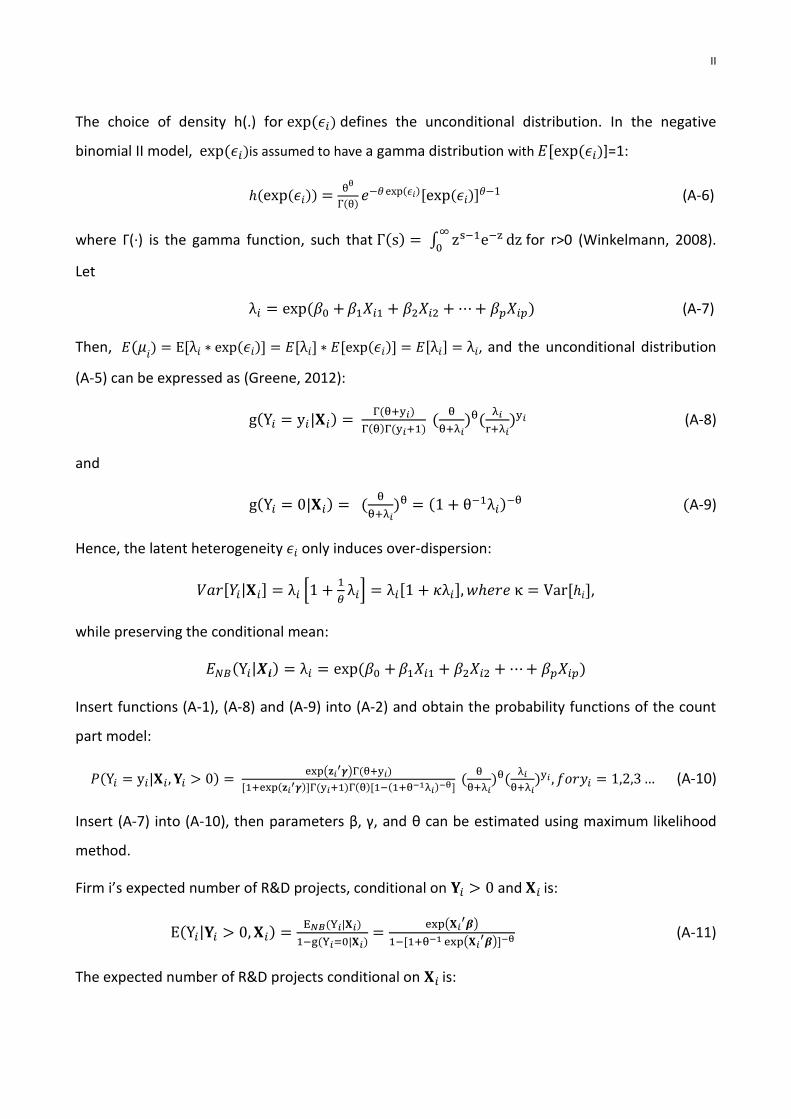
II
The choice of density h(.) for ( ) defines the unconditional distribution. In the negative
binomial II model, ( )is assumed to have a gamma distribution with ( )]=1:
( ( ))
( ) ( ) ( )
(A-6)
where Γ(∙) is the gamma function, such that ( ) ∫
for r>0 (Winkelmann, 2008).
Let
( ) (A-7)
Then, ( ) ( ) ( ) , and the unconditional distribution
(A-5) can be expressed as (Greene, 2012):
( | ) ( )
( ) ( ) (
) (
) (A-8)
and
( | ) (
) ( )
(A-9)
Hence, the latent heterogeneity only induces over-dispersion:
| [
] ,
while preserving the conditional mean:
( | ) ( )
Insert functions (A-1), (A-8) and (A-9) into (A-2) and obtain the probability functions of the count
part model:
( | ) (
) ( )
( ) ( ) ( ) ( )
(
) (
) (A-10)
Insert (A-7) into (A-10), then parameters β, γ, and θ can be estimated using maximum likelihood
method.
Firm i’s expected number of R&D projects, conditional on and is:
( | ) ( | )
( | )
( )
( ) (A-11)
The expected number of R&D projects conditional on is:
III
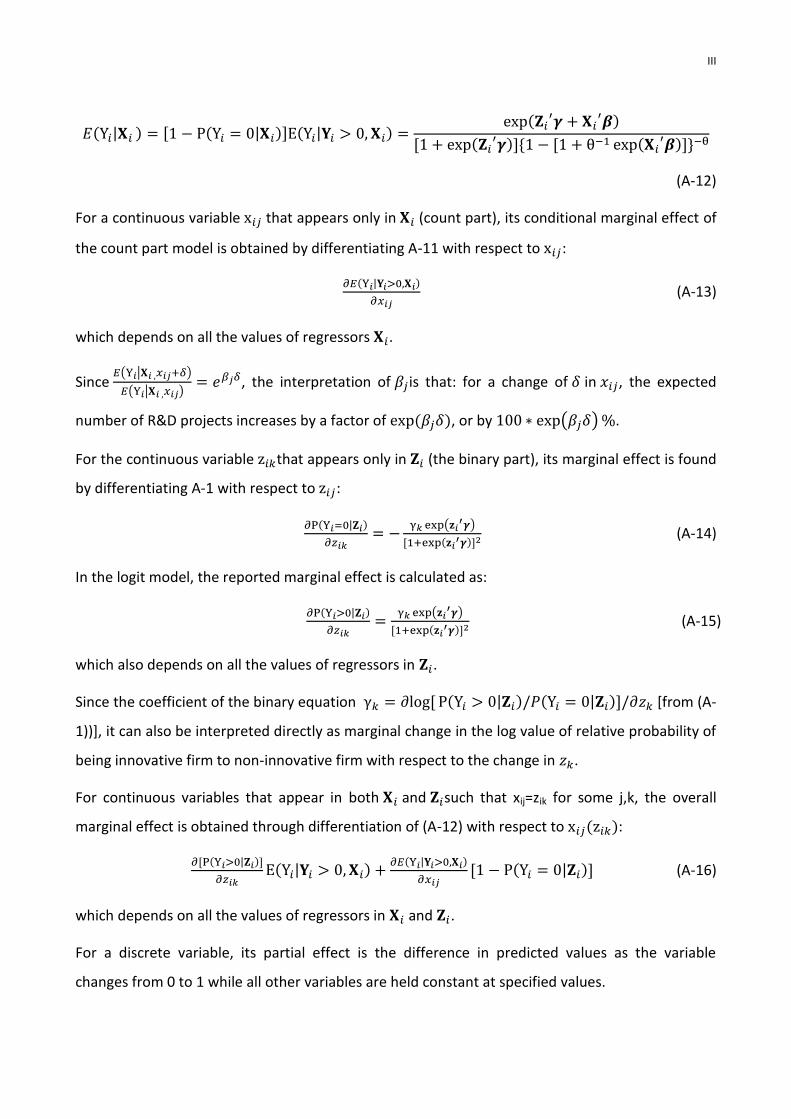
( | ) ( | ) ( | ) (
)
( ) (
)
(A-12)
For a continuous variable that appears only in (count part), its conditional marginal effect of
the count part model is obtained by differentiating A-11 with respect to :
( | )
(A-13)
which depends on all the values of regressors .
Since ( | )
( | ) , the interpretation of is that: for a change of in , the expected
number of R&D projects increases by a factor of ( ), or by ( ) .
For the continuous variable that appears only in (the binary part), its marginal effect is found
by differentiating A-1 with respect to :
( | )
( )
( )
(A-14)
In the logit model, the reported marginal effect is calculated as:
( | )
( )
( )
(A-15)
which also depends on all the values of regressors in .
Since the coefficient of the binary equation ( | ) ( | ) [from (A-
1))], it can also be interpreted directly as marginal change in the log value of relative probability of
being innovative firm to non-innovative firm with respect to the change in .
For continuous variables that appear in both and such that xij=zik for some j,k, the overall
marginal effect is obtained through differentiation of (A-12) with respect to ( ):
( | )
( | )
( | )
( | ) (A-16)
which depends on all the values of regressors in and .
For a discrete variable, its partial effect is the difference in predicted values as the variable
changes from 0 to 1 while all other variables are held constant at specified values.

IV
For the binary part, the partial effect of discrete variable zik is:
( | ) ( | )
= ( | ) ( | ) (A-17)
which can be calculated using equation (A-1).
For the count part, the partial effect of discrete variable xij is:
( | ) ( | ) (A-18)
which can be calculated using equation (A-11).