
Fire Performance of Automated Tall Car Park Structures
29
Fire Performance of Automated Tall Car Park Structures Burak Ayva Boğaziçi University Serdar Selamet ( [email protected] ) Boğaziçi University Research Article Keywords: car park ヲre, vehicle ヲres, ヲre spread, ヲre safety, ヲre resistance Posted Date: August 30th, 2021 DOI: https://doi.org/10.21203/rs.3.rs-827915/v1 License: This work is licensed under a Creative Commons Attribution 4.0 International License. Read Full License
Transcript of Fire Performance of Automated Tall Car Park Structures

Fire Performance of Automated Tall Car ParkStructuresBurak Ayva
Boğaziçi UniversitySerdar Selamet ( [email protected] )
Boğaziçi University
Research Article
Keywords: car park �re, vehicle �res, �re spread, �re safety, �re resistance
Posted Date: August 30th, 2021
DOI: https://doi.org/10.21203/rs.3.rs-827915/v1
License: This work is licensed under a Creative Commons Attribution 4.0 International License. Read Full License

1
-Fire performance of automated tall car park structures
Burak Ayva1 and Serdar Selamet2,*
1Graduate Student, Department of Civil Engineering, Bogazici Unive-rsity, Istanbul 34342, Turkey
2Associate Professor, Department of Civil Engineering, Bogazici University, Istanbul 34342, Turkey
* Corresponding author, e-mail: [email protected]; Tel: +90-212-359-6430
Keywords: car park fire, vehicle fires, fire spread, fire safety, fire resistance
Abstract:
Automated tall car park structures are modern alternatives to conventional parking structures to save
space and volume in highly demanded parking regions in urban areas. -The design of such structures
has significant knowledge gaps especially in regarding the effects of fire spread between passenger cars.
The purpose of this study is to estimate the horizontal and vertical fire spread between passenger cars
in automated tall car park structures and provide fire safety design to eliminate fire spread and possible
structural collapse. The fire spread between cars is established by estimating irradiance heat flux of
each car component. An 8-floor automated tall car park structure is designed in accordance with
European standards. The results show that steel car pallets underneath cars reach to 1000 degree Celsius
in early phases of fire, which could potentially cause a structural failure. Without any fire protection on
the structure, the fire spreads to the neighboring cars in 25 minutes and to the cars above in 20 minutes.
Significant fire protection is needed to eliminate fire spread between passenger cars. A more effective
sprinkler system is also proposed to suppress the car fire.

2
1 Introduction
The purpose of this study is to model and understand fire performance of an automated tall open
car park structures including structural integrity, the energy content and heat release rate of passenger
cars, horizontal and vertical fire spread and the effect of sprinkler locations. The goal is to provide
additional active and passive fire safety measures in open car parks.
Fire safety design requirements for conventional open car parks are not strict. Automatic
sprinkler systems, mechanical ventilation systems and passive fire protection on vertical opening
through floors are not mandatory in NFPA 88A [1]. According to NFPA88A, the height of an open car
park is limited by 25 m for Type II (000) structures, whereas there is no limitation for Type I structures
[1]. Such precautions may be valid for conventional open tall car parks; however, design of slabs and
vertical openings are totally different in automated open tall car parks. Vertical opening area to total
floor area is excessive in automated type car parks due to vertical lift openings. The vertical opening of
lift system may act like an atrium rather than a simple vertical opening during a fire incident within an
automated open tall car park; thereby changes vertical fire spread characteristics. Additionally, there is
no slab fixed to the structural systems in automated open tall car parks. In such structures, car pallets
docking and undocking between columns are utilized as carrying platforms of which structural fire
response is unknown.
Passenger car fires in parking structures are not common, but such events can develop into large
and uncontrollable fires [2]. Some cases of car park fires have involved hundreds of vehicles and caused
structural collapses in the last two decades. A car park fire in Schiphol Airport in Amsterdam burned
nearly 30 passenger cars and partly damaged around 101 passenger cars [3]. Another vital car park fire
event is Kings Dock fire in Liverpool [4]. The fire led to a total loss of 1150 passenger cars. Firefighters
have reported rapid lateral fire spread and vertical fire spread through both downward and upward. The
most recent open car park fire has occurred in Stavanger, Norway [5]. With the effect of strong wind,
flames have engulfed the structure partially, a significant structural collapse has occurred, and around
300 passenger cars were destroyed. A few passenger car fire tests in full-size open car parks are carried
out [6-9]. The general conclusion was that structural fire protection is not necessary for open deck car
parking structures.

3
Automated tall car park structures are modern alternatives to conventional parking structures to
save space and volume in high-demanded parking regions in urban areas. They are generally constructed
from steel. An 8-floor car park structure from Balikesir, Turkey, is shown in Fig. 1. It is an externally
braced steel structure with embedded elevator and car pallets to store and retrieve passenger cars. These
structures may be constructed with either open or closed façade.
Fig. 1. Automated tall car park structure with 4 units (Balikesir, Turkey)
Fire characteristics of passenger cars depend on vehicle size, ignition source and location,
environmental conditions and ventilation level. Peak HRR levels vary in a wide spectrum, from 1.9
MW to 10.8 MW [2]. The high level of heat release rate per unit area during car fires increases the
collapse risk of car park structures. Most of fire spread tests are based on lateral fire spread scenarios
in the literature [10,11]. Weisenpacker et al. [11] focused on temperature levels around and inside of
burning cars and did not measure the heat release rates (HRR). On the contrary, Park et al. [10] measured
HRR by using large-scale calorimeter and the maximum HRR for the single-car fire was estimated as
3.5 MW. Studies suggest that HRR curves of passenger cars show no clear correlation with vehicle age
[2].

4
Fig. 2. Equivalent HRR curves for classification of cars (adapted from Schleich et al. 1999 [12]).
The use of total combustion energy can classify passenger car fires during fire. The calorific
potential classification that has five different categories is generally based on vehicle size and curb
weight. Schleich et al. [12] have presented equivalent HRR curves for the potential calorific
classifications of passenger cars in Fig. 2. The characteristics and trends of the HRR curves are identical.
Schleich et al.’s [12] approach is based on the amplification of HRR values. In addition to the overall
energy potential, ignition mechanism of individual components in vehicles are also essential to
understand car fires. After the 1990s, the use of plastic components in passenger cars has increased
from 5.1% in 1970s to 8.8% of car weight in 2018 [2]. In addition to this, the average combustion
energy per mass of plastic components within passenger cars has increased. Although the change in the
mass of plastic materials is 72%, the total combustion energy has increased by 91% since the 1970s.
The risk of fire spread from one car to another has risen with the increase in the use of plastic materials
for exterior parts of passenger cars.
The occurrence of ignition can be forecast with a calculation of surface temperature if the
substance is heated by convection and radiation. A set of test results of plastic vehicle components that
used on outmost surfaces of passenger cars are given in Table 1 [13]. Ignition times under different
irradiance levels and critical irradiance levels of plastic components are determined by tests [13]. All
exterior plastic components excluding tires can be ignited by an irradiance level of 20 kW/m2 in 7.5

5
minutes, whereas it takes less than 1 minute with an irradiance level of 30 kW/m2. On the other hand,
the ignition of tires takes much more time, but its critical irradiance level is not high.
Table 1. Ignition times of plastic passenger car components [13] (NI: not ignited)
Time to ignition (seconds) (NI=no ignition)
Irradiance level
Critical
irradiance level
(kW/m2) Sample 10 kW/m2 20 kW/m2 30 kW/m2 40 kW/m2
Hub cap NI 205 58 28 17.5
Mud flap 380 57 29 16 10
Wheel arch NI 81 44 25 12
Bumper NI 450 89 43 18.5
Bumper grill NI 114 44 19 17.5
Bumper trim 415 83 30 16 11.5
Fuel tank NI 354 114 59 16.5
10 kW/m2 12 kW/m2 15 kW/m2 20 kW/m2
Tire NI 1100 597 240 11
Building Research Establishment (BRE) conducted a set of fire tests on fire spread modes
between passenger cars [13]. All possible fire spread patterns between passenger cars are tested. These
patterns are side-by-side fire spread, nose-to-nose fire spread and vertical fire spread at car stacker.
Before and after photographs of tests are shown in Fig. 3. The gas temperature close to the ceiling has
reached 1100 °C during side-by-side fire spread test. In the nose-to-nose fire spread test, the fire has
spread to the next vehicle at approximately 5th minute. In the case of car stackers, both cars in the stacker
engulfed in flames after 21 minutes.
Bumper grill Bumper Bumper trim Hub cap
Mud flap
Wheel arch
Bumper trim
Tire
Fuel tank (underside)

6
Fig. 3. Fire spread between passenger cars (BRE,2010 [13]).
One of the most critical knowledge gaps in suppression of passenger car fires is the effectivity
of sprinkler systems in car stackers. Carpark fires are defined as ordinary hazard in most of national fire
safety codes such as BS EN 12845:2015 [14], AS 2118:2017 [15], NZS 4541:2020[16] and Turkey’s
Regulation on Fire Protection [17]. BRE has conducted tests on the efficiency of sprinklers on passenger
car fires for ordinary car parks and stacker systems [18]. The setup represents a closed car park, but
ventilation is enough for a fuel-controlled fire. The fire started at the outermost passenger car. The first
sprinkler was activated after 4 minutes, then all sprinklers were activated at the early stage of fire. The
fire was not extinguished, and its thermal power reached around 7000 kW. However, the fire did not
spread to the next vehicle. Cooling and transport effect of water droplets from sprinklers caused the
smoke to drag down.
2 Methodology
In this study, an automated open tall steel car park structure is designed based on an existing
example shown in Fig. 1 and modelled in Fire Dynamics Simulator (FDS) [19] and SAP2000 [20]. A
widely used design car fire curve is modified to decrease computational demand of FDS and vertical
and lateral fire spread criteria between passenger cars is defined via FDS simulations. Thermal response
of structural members including the car pallets are obtained from FDS analyses.

7
2.1. Car park structure
An 8-floor open-facade steel car park with 4 units and a capacity of 56 cars is designed
according to Turkish Building Earthquake Code 2018 and Eurocode 3 [21,22]. Construction material is
chosen as S235 grade carbon steel. The structure is braced for lateral resistance. All column cross
sections are TUBO 160x160x10. All beams are HEA100 and connect to columns via shear connections.
The structural design is shown in Fig. 4. Member cross sections are tabulated in Table 2.
(a)
(b)
Fig. 4 Tall car park structure: (a) illustration and (b) structural design.
Car pallets stay on wheels, which are mounted to short cantilever beams fixed to the columns.
The car pallet is illustrated in Fig. 5. The pallet contains 4 longitudinal beams and 4 cross beams
1
2
3
4
5
6
7
8
V1 V2 V3 V4 V5 V6 V7 V8
V9 V10 V11 V12 V13 V14 V15 V16
V17 V18 V19 V20 V21 V22 V23 V24
V25 V26 V27 V28 V29 V30 V31 V32
V33 V34 V35 V36 V37 V38 V39 V40
V41 V42 V43 V44 V45 V46 V47 V48
V49 V50 V51 V52 V53 V54 V55 V56
Ele
vato
r sh
aft
1
Ele
vato
r sh
aft
2
Ele
vato
r sh
aft
3
Ele
vato
r sh
aft
4

8
(HEA100) with a 2mm thick sheet metal above to carry the vehicle load. For the loading condition, the
vehicle weight is taken as 2000 kg, which is an average weight of ordinary size SUV. Considering the
vehicle as a live load (i.e. 1.6 live load factor), the vehicle load is applied as 4 point-loads of 7.85 kN
on each pallet, which are 2.7 m apart from each other in accordance to the wheelbase of ordinary size
SUV. Car pallet does not transfer moment or axial force to the cantilever beam supports. The elevator
equipment on the top floor of each elevator shaft as seen in Fig. 4a is taken as 11 kN.
Table 2. Member sections of car park structure (see Fig. 4b).
Member Section
Columns TUBO160x160x10
Beams HEA100
Bracing TUBO80x80x8
Car pallet HEA100
Fig. 5 Car pallet design.
The thermo-mechanical analysis of the cark park structural system is not conducted since both
columns and beams under low utilization ratios 𝜇 have significantly high critical temperatures 𝑇𝑐𝑟 even
without any fire protection. TUBO160x160x10 columns with 𝜇 = 0.129 have 𝑇𝑐𝑟 = 809 ℃ . On the
other hand, HEA100 beams underneath the car pallet carry a significant load and they are likely
subjected to extreme temperatures from car fires just below. HEA100 beams with 𝜇 = 0.502 have 𝑇𝑐𝑟 =

9
590 ℃. A possible collapse mechanism of the car pallet is illustrated in Fig. 6 where a plastic hinge at
the midspan forms during fire. Such failure indicates that the pallet collapse can occur before the fire
spreads to other cars.
Fig. 6. Car pallet collapse mechanism.
2.2. FDS model
The Fire Dynamics Simulator (FDS) model is created in PyroSim [23]. The fire initiates from
the car labeled as V13 on the 2nd floor as illustrated in Fig. 4a. No smoke control system is installed on
the model. The heat and radiation transport calculation is performed with polyurethane as the fuel load
and with 20 cm mesh size [24]. HEA100 and TUBO160x160x10 structural member surface
temperatures are calculated utilizing the ‘exposed back condition’ in the FDS model, i.e. assuming that
the members conduct heat through the cross-sectional thickness.
To estimate this cell size in the FDS model, the characteristic length scale of fire is calculated
using Equation 1, where D* is dimensionless diameter in m, Q is peak heat release rate (HRR) in kW, 𝜌∞ is ambient air density in kg/m3, 𝑇∞ is ambient temperature in °C, 𝑐𝑝 heat capacity of air under
constant pressure in J/kgK and g is gravitational acceleration in m/s2.
𝐷∗ = ( 𝑄𝜌∞𝑇∞𝑐𝑝√𝑔)2/5 (1)
The heat release rate curve of Category III car is with a peak HRR of 8.3 MW, hence D* is
obtained as 2.235 m. It is suggested that for a reliable large eddy simulation (LES) at least 10 cells shall
fit within the dimensionless diameter [25]. Therefore, 20 cm or smaller cell size with a simple chemistry
model can be used. Cell size is chosen as 10 cm for all fire simulations in this study. The Prandtl number
Plastic hinge
formation
Pallet
dislodgement
/2 /2

10
is taken as 0.7. The Radiative Transfer Equation (RTE) is used with a radiation fraction of 0.35. It is
prescribed as a lower bound in order to limit uncertainties in radiation calculation.
2.3. Passenger car design fire
To reduce computational effort and shorten the run time on FDS simulations, both the heat
release rate (HRR) curve and the vehicle model detail is modified without compromising the accuracy.
For the passenger car design fire, Category III HRR curve with a peak HRR of 8.3 MW for maximum
of 70-minute fire duration is modified as seen in Fig. 7. The modification mainly focuses on the ascent
and descent parts around the peak point of the curve. Equations of ascent (q̇𝑎𝑠𝑐) and descent (q̇de ) heat
flux of the Modified Category III fire curve are given in Eq. 2 and Eq. 3 where t is time in minutes and �̇� is heat release rate in kW.
q̇𝑎𝑠𝑐 = 11.8 t2 11 ≤ t ≤ 25 (2)
q̇de = q̇ s (25) ∗ e−(t−25)/6 25 ≤ t ≤ 70 (3)
Fig. 7. Category III design car fire [12] and Modified Category III fire.
As can be seen in Fig. 7, the cumulative thermal energy is shifted to the left in the Modified
Category III fire with respect to the original curve. The decreasing phase is also faster so that the dying
out of fire occurs quickly. This allows the flexibility to stop simulation earlier without compromising

11
accuracy. The predefined termination of simulation is when the fire curve drops to 5% of its peak value
at 43rd minute. The total energy release (i.e. area under HRR curve) is not violated by using the modified
HRR curve. Differences between maximum gas temperatures are detected on a ceiling just above the
fire pool as low as 50 °C, and maximum surface temperature levels are very similar in both cases [26].
Overall, this modification results in 28% reduction of the computational time.
Fig. 8. Car model in FDS.
A compact size car body encloses on a fire pool is designed in FDS with car body and window
details as illustrated in Fig. 8. Metal parts in the body are defined as 1 mm steel sheet with 40 W/m.K
of heat conduction coefficient. Windows are ordinary glass with 3 mm in thickness and 1 W/m.K of
heat conduction coefficient. Glass breakage is simulated according to Weisenpacher et al. [11]. It is
expected that windshield glass will break first followed by side and rear windows. The ground clearance
of the passenger car is 20 cm.
2.4. Horizontal and vertical fire spread between passenger cars
‘NFPA-1710: Standard for the Organization and Deployment of Fire Suppression Operations,
Emergency Medical Operations, and Special Operations to the Public’ by Career Fire Departments
mandates 5:20 minutes response criterion for passenger car fires after the department is informed [27].
Joyeux [8] estimated the time duration needed for horizontal (lateral) fire spread between passenger
cars as 12 minutes. In contrary, Li et al. [28] assessed the period as approximately 20 minutes, whereas
Park et al. [10] reported the fire spread to an adjacent car at the 8th minute. Hence, the fire brigade must
be alerted in a few minutes after the fire initiated.
Gap on radiator grille
1/5 open window
Gap at wheel arch
(no mudguard)
4.4 m
1.6 m
Fragile glass
Fire pool under
car body

12
Table 3 Thermal properties of materials in ignitable passenger car model
Thermal Properties
Material
Ign
itio
n T
emp
.
[°C
]
Sp
ecif
ic H
eat
[kJ/
kg
.K]
Co
nd
uct
ivit
y
[W/m
.K]
Hea
t of
Co
mb
ust
ion
[kJ/
kg
]
Em
issi
vit
y
Den
sity
[k
g/m
3]
Rubber [29] 350 1.88 0.13 50 0.9 910
Polypropylene [29] 388 1.75 0.15 46 0.9 946
Steel [19] - 0.46 45.8 - 0.95 7850
Glass [19] - 0.792 1 - 0.05 2500
Vertical fire spread between passenger cars is as important as lateral fire spread between
passenger cars. However, the literature on this topic is very limited [13] [18]. To assess criteria for
vertical fire spread; undercover, tires, and front bumper of the car model given in Fig. 8 is altered with
combustible polymers. The undercover and bumper are chosen as polypropylene and the tires are
selected as rubber. Thermal properties of materials used in the model are given in Table 3.
Fig. 9. Vertical fire spread to a passenger car.

13
Fig. 10. Incident surface heat flux on car tires (* : ignition points).
During the fire simulation, the first ignition occurred at the undercover of car, which is also
observed in BRE tests [13]. However, the undercover caught fire at 12th minute, in contrary of 5 minutes
observed in BRE tests. After the ignition of undercover, front tires ignite at 16th minute. The vertical
fire spread is illustrated chronologically in Fig. 9. The result indicates that at approximately 10 kW/m2
of incident surface heat flux is sufficent to start combustion on undercover. Incident surface heat flux
curves for tires are shown in Fig. 10. The incident surface heat flux at ignition time nearly reaches to
20 kW/m2 on front tires and 10 kW/m2 on back tires.
With the aforementioned analysis, both vertical and lateral fire spread criteria are proposed.
When the incident heat flux level is lower than 8 kW/m2, there is no risk of ignition, whereas the level
is higher than 16 kW/m2, passenger cars start to burn and spread the fire. If the incident heat flux level
is between 8 and 16 kW/m2, the adiabatic surface temperature [30] should be observed closely. As long
as the adiabatic surface temperature is lower than the ignition temperature of the material, the related
component cannot catch fire.
3. Case Studies
In order to provide fire safety to automated tall car park structures, it is imperative to eliminate
or slow down the fire spread between passenger cars. In addition, the structural integrity including the
steel pallets should be maintained during fire. Fire spread risk levels are shown in Fig. 11. Fire starts

14
at vehicle V13 as shown in Fig. 4a. The neighboring passenger cars are designated as ‘R’ (right side of
the car), ‘L’ (left side of the car), and ‘U’ (upper side of the car).
Fig. 11. Automated tall car park: Fire at vehicle V13.
Case studies are illustrated in Fig. 12 with passive and active fire safety measures. In all case
studies, Modified Category III HRR design curve is utilized. Unprotected car park is the base scenario
(Case A). The same structure with partial firewalls and fireproof ceilings is Case B. The structure with
fire shutter doors is Case C. Finally, Case D utilizes sprinkler layout by [31] and Case E utilizes an
improved sprinkler layout proposal.
Fig. 12. Case studies.
Case A
Unprotected
Case B
Firewall+fireceiling
Case C
Firewall+fireceiling
+fire shutter door
Case D
Sprinkler AFAC
Case E
Sprinkler Proposed

15
Fig. 13. Sensor positions on passenger cars.
The passenger car model in Fig. 8 is used in FDS simulations. Adiabatic surface temperature
and incident heat flux sensors shown in Fig. 13 are used as indicators for fire spread. The nomenclature
of structural elements around the fire zone V13 over the car pallet P2E is shown in Fig. 14.
Fig. 14. Nomenclature of structural elements around the fire zone
3.1. Case A: Car park without fire protection
The fire safety level of an open façade unprotected car cark is inspected. Fig. 15 shows the
development of vehicle fire in the car park. After 15th minute, hot gases and flames start to pervade the
entire parking slot and upper areas. The gas temperature reaches to 900 °C under the upper car pallet
P3E. It causes the ignition on the undercover of car U1 at 20th minute. Hot gases with 600°C are dragged
up with buoyancy force and reach to car U2 and R2. At 25th minute, the hot gas temperatures around
2.2
m
Adiabatic Surface Temperature
And Incident Heat Flux Sensors
Front bumper
Front tireMid bumperBack tireBack bumper
Wind shieldFront glassBack glassMid glass

16
the neighboring vehicle U1 and R1 reached 1100 °C as illustrated in Fig. 15. Passenger cars L0, L1 and
L2 are at a relatively far distance from the fire, where the gas temperature remains low. Incident heat
flux levels over these cars are under 5 kW/m2 which is deemed safe as previously stated. Incident heat
flux levels for car U1, R0 and R1 are given in Fig. 16. Incident heat flux levels at mid bumpers of upper
cars reach over 50 kW/m2 that causes fire to spread. Fig. 16 also indicates that the fire can spread to all
surrounding cars within 25 minutes.
Fig. 15. Gas temperature map (Case A)
Fig. 16. Incident heat flux levels on cars (Case A)
t=10 min t=15 min t=20 min t=25 min t=30 min °C
1250
50
170
290
410
530
650
770
890
1010
1130
1.4 m
2 m

17
The average temperature of steel members are shown in Fig. 17. The column average
temperatures (C2N1, C2N2, C3N1, C3N2) remain below 100 °C. The beam (B2E) near the elevator
shaft (see Fig. 14) reaches as high as 800 °C, whereas the temperature level is much lower (i.e. 150 °C)
in beams B2W and B3NE. This observation suggests that vehicle fire intensifies near the shaft where
ventilation is expected to be at maximum levels. The beam underneath the car pallet P3E reach
temperatures as high as 1000 °C. It can be concluded that a possible dislodgement of the car pallet will
occur at the early phase of fire because these beams have merely 590 ℃ critical temperature as
calculated previously. Overall, the columns in the car park structure remain below critical temperatures
even left fire unprotected. The beams, however, go beyond the critical temperatures and exhibit a high
risk of collapse.
Fig. 17. Average temperature levels of steel structural members (Case A)

18
3.2. Case B: Car park with firewalls
In order to minimize the fire spread, firewalls between passenger cars and outmost columns are
placed throughout the structure. In addition, fire ceilings with 30cm overhang are placed just underneath
car pallets. The firewall configuration is seen in Fig. 18. By utilizing firewalls, hot gases are expected
to channelize between the firewall and the overhang and exhausted through the façade. The firewalls
are 5cm thick with 0.05 W/mK conductivity and 1 kJ/kgK specific heat. It is assumed that the thermal
properties are temperature-independent and thereby stay constant throughout the fire.
Fig. 18. Fire wall configuration (Case B)
Fig. 19. Gas temperature map (Case B)
The gas temperatures in Case B show that the firewall and fire ceiling are mostly effective in
preventing fire spread. The incident heat flux levels on neighboring passenger cars as given in Fig. 20
are considerably lower compared to Case A. Car R0 and R1 are also totally protected by extended side
Ceiling Heat
Shield with
Overhang
Extended Side
Heat Shield
Front Partial
Heat Shield with
inclined overhang
35% Open
t=10 min t=15 min t=20 min t=25 min t=30 min°C

19
heat shield as illustrated in Fig. 18. The vehicles on the opposite of the elevator shaft (i.e. L0, L1) are
subjected to incident heat flux below 3 kW/m2 and therefore the fire spread is eliminated to these
vehicles. The mid bumper and the front tires of car U1 are exposed to an incident heat flux between 8
kW/m2 and 16 kW/m2. Ignition temperatures for bumpers and tires were previously defined as 388 °C
and 350°C, respectively. As seen in Table 4, the temperature levels obtained from the fire simulation
are 382°C for mid bumper and 392°C for the front tire at 25th minute. Thus, the car U1 is assumed to
catch fire at front tires. Case B significantly minimizes the fire spread but it cannot prevent it
completely.
Fig. 20. Incident heat flux levels on cars (Case B)
Table 4 Maximum adiabatic surface temperatures of the car U1 at 25th minute
Bumper Tire
Front Mid Back Front Back
U1 348℃ 382℃ 252℃ 392℃ 293℃
3.1 m
2 m

20
3.3. Case C: Car park with firewalls and shutter doors
In Case C, fire shutter doors are placed between the slots and elevator shaft. In addition, all
firewall overhangs are removed as seen in Fig. 21. This design approach aims to convert the fuel-
controlled fire into the ventilation-controlled fire once the fire shutter doors are activated. The activation
time or triggering mechanism of the fire shutter is essential. Fire shutters can be triggered not only
electronically but also mechanically. If the triggering mechanism fails, and the electric motor is
disabled, the fire shutter should be closed manually by security personnel or firefighter. The previous
FDS results reveal that the activation time of 15 minutes to close the fire shutter is deemed to be
satisfactory.
Fig. 21. Improved fire wall configuration with fire shutter doors.
Fig. 22. Gas temperature map (Case C)
t=10 min t=15 min t=20 min t=25 min t=30 min °C
21
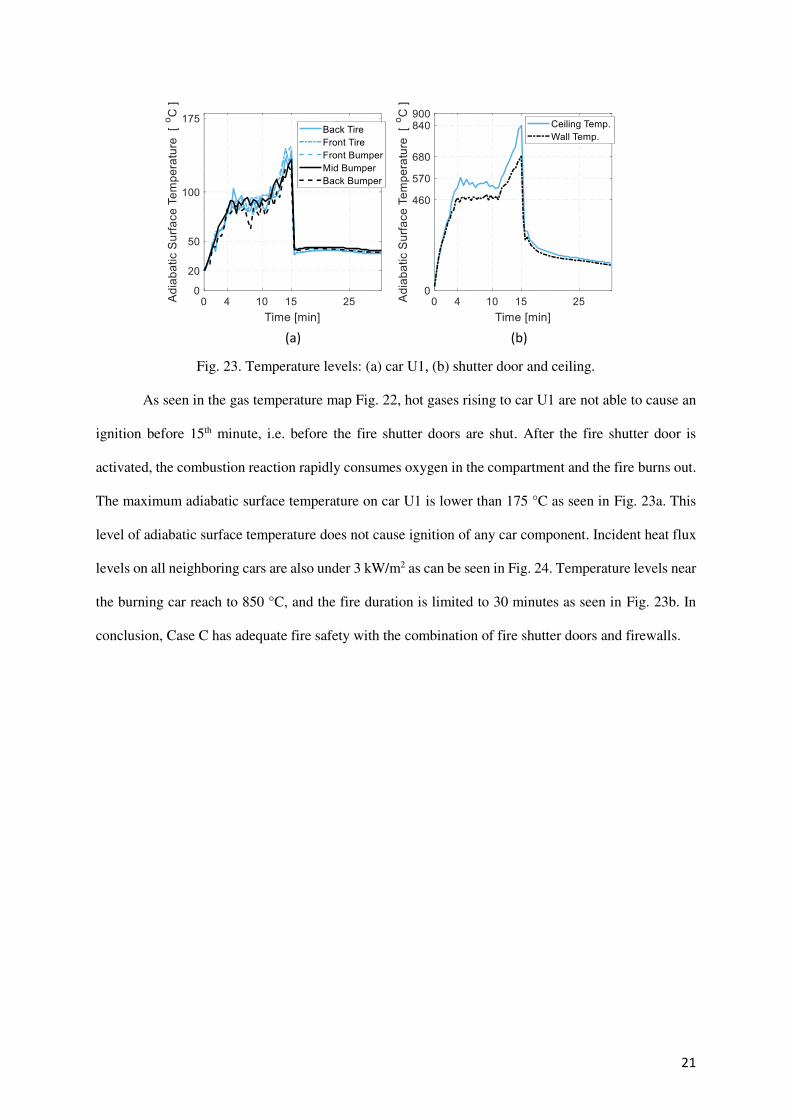
Fig. 23. Temperature levels: (a) car U1, (b) shutter door and ceiling.
As seen in the gas temperature map Fig. 22, hot gases rising to car U1 are not able to cause an
ignition before 15th minute, i.e. before the fire shutter doors are shut. After the fire shutter door is
activated, the combustion reaction rapidly consumes oxygen in the compartment and the fire burns out.
The maximum adiabatic surface temperature on car U1 is lower than 175 °C as seen in Fig. 23a. This
level of adiabatic surface temperature does not cause ignition of any car component. Incident heat flux
levels on all neighboring cars are also under 3 kW/m2 as can be seen in Fig. 24. Temperature levels near
the burning car reach to 850 °C, and the fire duration is limited to 30 minutes as seen in Fig. 23b. In
conclusion, Case C has adequate fire safety with the combination of fire shutter doors and firewalls.
(a) (b)

22
Fig. 24. Incident heat flux levels for cars (Case C, Fire shutter doors are closed after 15 minutes).
3.4. Case D and Case E: Car park with sprinklers
The main purpose of sprinkler water on a fire zone is to create a cooling effect by absorbing
heat during phase change from liquid to vapor [32]. FDS is capable of modelling heating up and
evaporation of water droplets engulfed by hot gases or over a hot surface. FDS is also adequate to model
a reduction in HRR, while water droplets encounter the burning surface with predefined HRR curve.
The main equation that governs the phenomena is given in Eq. 4 [19]. 𝑞�̇�′′(𝑡) is the predefined heat
release rate per unit area in kW/m2. The term may be obtained by dividing time dependent HRR to the
area of the burning surface. The term k is calculated by Eq. 5, in where 𝑚𝑊′′ is the local mass of water
per unit area in kg/m2. a is an empirical constant in m2/kg.s. The empirical constant is dependent on
the water flux, material properties and global geometric features of the burning substance. Thus, it is
strictly case-specific, and there is no study found that defines a coefficient for passenger car fires.
�̇�′′(𝑡) = 𝑞�̇�′′(𝑡) 𝑒−∫𝑘(𝑡)𝑑𝑡 (4) 𝑘(𝑡) = 𝑎 𝑚𝑊′′ (5)
3.1 m
2 m

23
The coefficient a is taken as 0.001 m2/kg.s. Same sprinkler nozzle is used in all cases. K factor
is chosen as 160 𝐿/𝑚𝑖𝑛√𝑎𝑡𝑚. The activation temperature and operating pressure are 68 °C and 1 atm.
Latitude angles of conical jet stream is defined as 60° and 75° in the sprinkler spray model in FDS. Jet
stream velocity is chosen as 5 m/s. Two different sprinkler system layouts are examined. The layouts
are given in Fig. 25. The first layout is marked as ‘Case D’, which is the current sprinkler application
in car parks suggested by Australasian Fire and Emergency Service Authorities Council Limited [31].
It contains one sprinkler at corners of each passenger car. The second layout is proposed by [26], which
contains four sprinklers per passenger car at corners.
Fig. 25. Sprinkler layouts: Case D proposed by AFAC [31] and Case E proposed by authors [26]
Fig. 26. First sprinkler activation times.
Sprinkler activation is illustrated in Fig. 26. In the case D layout, the sprinkler at the south-
west corner of the burning car is activated at 191st sec. Position of the sprinkler is not on the heat flow
path from the gap on the front grill or the partially open window. It is the main reason for the relatively
Sp
rin
kle
r
Ca
se E
Ca
se D
t=1
91
. se
ct=
41
. se
c
Ca
se D
Ca
se E

24
late sprinkler activation. In contrary, the sprinkler on the west of burning car is triggered at 41th sec. in
the Case E because of its proper location. In the case, sprinkler water faces directly to the fire plume
exhausted from side windows.
(a) (b)
Fig. 27. Effect of sprinklers: (a) on HRR, (b) on the convective heat transfer.
The reduction in HRR is directly related to the amount of water penetrating on the fire surface.
The sudden changes in HRR curves are shown in Fig. 27a. Sprinkler water also absorbs an important
portion of total convective heat as shown in Fig. 27b. A similar phenomenon on convective heat transfer
during a FDS simulation of a water mist spray on a propane burner is observed in another study [32].
The incident heat flux levels on surrounding vehicles for both sprinkler layouts are shown in Fig. 28.
The performance of the AFAC layout is satisfactory (Case D). Fire spread risk is eliminated for car U1
and R0 and, nearly 80% of convective heat is absorbed. However, the incident heat flux on the mid
bumper of car R1 is still over 20 kW/m2. On the other hand, the proposed sprinkler layout in Case E not
only prevents the fire spread but also suppresses it completely. Incident heat flux levels on all
surrounding cars remain below 8 kW/m2.

25
Fig. 28. Incident heat flux on surrounding cars.
4. Conclusion
In this study, the fire performance of an 8-story automated car park structure is investigated.
The main goal is to find out the characteristics of vertical fire spread between passenger cars and add
passive and active fire prevention measures to the structure to minimize the fire spread. Given the HRR
of the passenger car, FDS model simulates the ignition times of the components of nearby cars and
thereby realistically estimates the fire spread rate in tall car park structures. The following conclusions
are drawn:
- Without any fire protection on the car park structure, the fire spreads to neighboring cars in 25
minutes, to cars above in 20 minutes. The ignition in the vehicle starts with undercover and tires

26
with incident heat flux levels higher than 16 kW/m2. FDS simulations show that car components
do not ignite if the incident heat flux levels are below 8 kW/m2.
- During a car fire, all columns of the unprotected tall car park structure remain below their critical
temperatures. Maximum column temperatures in all cases are under 200 °C. Such temperature
levels are not considered as structurally significant for collapse. The beam temperatures on the
façade remain below 150°C. The beams next to the elevator shaft reach critical temperatures as
high as 800°C if left unprotected.
- Steel car pallets are not robust against a passenger car fire. The member temperature of car pallet
beams reaches to 1000°C at around 20th minute of fire. Plastic hinge mechanism will likely form
in the load-bearing beams underneath the car pallet in the very early phase of fire. This means that
a car pallet just above a fire may collapse before the fire spreads vertically to a car on the car pallet.
To prevent such collapse, fire protection is necessary underneath each car pallet.
- The proposed sprinkler layout is more efficient. When the sprinkler heads are placed at the
backside, frontside and sides of the cars as opposed to placing at the corners of the cars. The most
effective way to suppress passenger car fire spread in a car park structure without a sprinkler system
is to deprive the fire from oxygen by the use of fire shutter doors.
Acknowledgments
The authors acknowledge Newton Collaborative Research Programme NRCP1516/4/72, Bogazici
University Scientific Research Project BAP: 13084D and 1002-TUBITAK Project: 218M550, which
provided the funding for this study.
References
[1] NFPA 88A Standard for Parking Structures 2019 Edition, Quincy, MA.
[2] Boehmer and Klassen, CSE Combustion Science & Engineering: Modern Vehicle Hazards in
Parking Garages and Vehicle Carriers, 2020.
[3] L. Noordijk, T. Lemaire, Modelling of fire spread in car parks, Heron. 50 (2005) 209–218.
[4] BAFSA British Automatic Fire Sprinkler Association, Kings Dock Car Park Fire. 2018.
[5] FESG Fire Engineered Solutions, Stavanger car park fire.

27
[6] I. D. Bennetts, D. Proe, R. Lewins and I. R. Thomas, Open-vehicle park fire analyses, Proceedings
of the Pacific Structural Steel Conference, 1986, Aukland, New Zealand.
[7] T. Kitano, O. Sugawa, H. Masuda, T. Ave and H. Uesugi, Large Scale Fire Tests of 4-Story Type
Car Park Part 1: The Behavior of Structural Frame Exposed to the Fire at the Deepest Part of the First
Floor, in Proceedings of the 4th Asia-Oceania Symposium on Fire Science and Technology, Tokyo
Japan, 2000, pp. 527-538.
[8] D. Joyeux, J. Kruppa, L.G. Cajot, J.B. Schleich, P. Van de Leur, L. Twilt, Demonstration of real
fire tests in car parks and high buildings, Technical Steel Research Report, European Commission,
Brussels, Belgium, 2002.
[9] B. Zhao, J. Kruppa, Structural Behaviour of an Open Car Park Under Real Fire Scenarios, Fire and
Materials, 28 (2004) 269-280.
[10] Park, J. Ryu, H.S. Ryou, Experimental study on the fire-spreading characteristics and heat release
rates of burning vehicles using a large-scale calorimeter, Energies. 12 (2019).
[11] P. Weisenpacher, J. Glasa, L. Halada, Automobile interior fire and its spread to an adjacent vehicle,
J. Fire Sci. 34 (2016) 305–322.
[12] J.B. Schleich, L.G. Cajot, J.M. Franssen, J. Kruppa, D. Joyeux, L. Twilt, J. Van Oerle, G.
Aurtenetxe. Development of design rules for steel structures subjected to natural fires in closed car
parks, Technical Steel Research Report, European Commission, Brussels, Belgium, 1999.
[13] BRE British Research Establishment, Fire Spread in Car Parks. BRE Report, Department for
Communities and Local Government, London, UK, 2010.
[14] British Standard Institution, BS EN 12845:2015 Fixed firefighting systems – Automatic sprinkler
systems – Design, installation and maintenance.
[15] Standards Australia, AS 2118.1:2017 Automatic fire sprinkler systems-General Systems.
[16] Standards New Zealand, NZS 4541:2020 Automatic fire sprinkler systems.
[17] Republic of Turkey Ministry of Environment and Urbanization, Binaların Yangından Korunması Hakkında Yonetmelik, Turkish Official Journal, 27344, (2009) 45.
[18] BRE British Research Establishment, Sprinkler Protected Car Stacker Fire Test. BRE Technical
Report, The British Automatic Fire Sprinkler Association, London, UK, 2009.
[19] K. McGrattan, S. Hostikka, R. McDermott, J. Floyd, C. Weinschenk, K. Overholt, Sixth edition
fire dynamics simulator technical reference guide volume 1 : mathematical model, NIST Spec. Publ. 1018. 1 (2015).
[20] Computers and Structures Inc. SAP2000, Berkeley, California, USA, 2020.
[21] Afet ve Acil Durum Yönetimi Başkanlığı, TBDY-2018 Türkiye Bina Deprem Yönetmeliği, Ankara, 2018.
[22] EN 1993-1-2: Eurocode 3. Design of steel structures. Part 1–1: General rules – Structural Fire
Design. European Committee for Standardization (CEN), Brussels, 2005.
[23] Thunderhead, PyroSim 2020, Manhattan, Kansas, USA, 2020.
[24] McGrattan K. B., McDermott R. J., Weinschenk C. G. and Forney G. P., Fire Dynamics Simulator
User’s Guide. NIST special publication 1019.6, National Institute of Standard and Technology,
Maryland, USA, 2013.
[25] McGrattan K.B., Baum H.R., Rehm, R.G., Large eddy simulations of smoke movement, Fire
Safety Journal 30:161–178, 1998.
[26] B. Ayva, Performance-Based Fire Safety Design For Automated Vehicle Parking Steel Structures,
Master’s Thesis, Bogazici University, 2020.

28
[27] NFPA 1710 Standard for the Organization and Deployment of Fire Suppression Operations,
Emergency Medical Operations, and Special Operations to the Public by Career Fire Departments 2020
Edition, Quincy, MA.
[28] D. Li, G. Zhu, H. Zhu, Z. Yu, Y. Gao, X. Jiang, Flame spread and smoke temperature of full-scale
fire test of car fire, Case Stud. Therm. Eng. 10 (2017) 315–324.
[29] E.M. Pearce, Polymer Flammability. Am. Chem. Soc. Polym. Prepr. Div. Polym. Chem. 26 (1985)
198.
[30] U. Wickström, A. Robbins, G. Baker, The use of adiabatic surface temperature to design structures
for fire exposure, J. Struct. Fire Eng. 2 (2011) 21–28.
[31] Australiasian Fire and Emergency Service Authorities Council, Fire Safety Requirements for
Automated Vehicle Parking Systems. AFAC Publication no 3044, East Melbourne, AU, 2020.
[32] B. Merci, M. Shipp, Smoke and heat control for fires in large car parks: Lessons learnt from
research?, Fire Saf. J. 57 (2013) 3–10. https://doi.org/10.1016/j.firesaf.2012.05.001.
[33] S. Noda, B. Merci, F. Tanaka, T. Beji, Experimental and numerical study on the interaction of a
water mist spray with a turbulent buoyant flame, Fire Saf. J. (2020) 103033.