· PDF file10 Finolex Cables Limited when compared to the previous year, underwent a change...
63
8 Finolex Cables Limited Board of Directors P. P. Chhabria Chairman Dr. H. S. Vachha B. G. Deshmukh Atul C. Choksey Sanjay K. Asher P. G. Pawar S. B. (Ravi) Pandit Pradeep R. Rathi A. J. Engineer D. K. Chhabria Managing Director V. K. Chhabria Dy. Managing Director M. L. Jain Asst. Managing Director and Chief Operating Officer P. B. Parasnis Asst. Managing Director and Chief Financial Officer Company Secretary & Vice President (Legal) R. G. D’Silva Bankers Central Bank of India Bank of Baroda BNP Paribas Citibank N.A. Corporation Bank HDFC Bank Ltd. ICICI Bank Ltd. Standard Chartered Bank State Bank of India The Bank of Nova Scotia Auditors B. K. Khare & Co. Chartered Accountants Solicitors Crawford Bayley & Co. Registered Office 26/27, Mumbai-Pune Road, Pimpri, Pune 411 018 Tel.: 020-27475963
Transcript of · PDF file10 Finolex Cables Limited when compared to the previous year, underwent a change...

8
FinolexCables Limited
Board of Directors
P. P. Chhabria Chairman
Dr. H. S. Vachha
B. G. Deshmukh
Atul C. Choksey
Sanjay K. Asher
P. G. Pawar
S. B. (Ravi) Pandit
Pradeep R. Rathi
A. J. Engineer
D. K. Chhabria Managing Director
V. K. Chhabria Dy. Managing Director
M. L. Jain Asst. Managing Director andChief Operating Officer
P. B. Parasnis Asst. Managing Director andChief Financial Officer
Company Secretary &Vice President (Legal) R. G. D’Silva
Bankers Central Bank of India
Bank of Baroda
BNP Paribas
Citibank N.A.
Corporation Bank
HDFC Bank Ltd.
ICICI Bank Ltd.
Standard Chartered Bank
State Bank of India
The Bank of Nova Scotia
Auditors B. K. Khare & Co.Chartered Accountants
Solicitors Crawford Bayley & Co.
Registered Office 26/27, Mumbai-Pune Road,Pimpri, Pune 411 018Tel.: 020-27475963

9
40thAnnual Report 2007-08
Directors’ Report
To
The Members
Your Directors are pleased to present their 40th Annual Report and Audited Accounts for the year ended 31st March, 2008.
FINANCIAL RESULTS:
(Rs. in million)
2008 2007
Income 14,178.983 10,526.253
Profit Before Interest, Depreciation and Tax 1,656.939 1382.582
Less : Interest 189.287 147.987
Less : Depreciation 264.671 264.288
Profit Before Tax 1,202.981 970.307
Less : Provision for Taxation
(a) Current Tax 341.360 280.000
(b) Deferred Tax (33.720) (4.623)
(c) Fringe Benefit Tax 6.100 5.000
Profit After Tax 889.241 689.930
Surplus brought forward and other adjustments 152.527 113.101
1,041.768 803.031
APPROPRIATIONS
Debentures Redemption Reserve 50.000 100.000
Proposed Dividend 229.409 214.115
Tax on Proposed Dividend 38.988 36.389
General Reserve 300.000 300.000
Surplus carried to Balance Sheet 423.371 152.527
1,041.768 803.031
GOLDEN JUBILEE YEAR
Your Directors feel proud to state that the calendar year 2008 is the 50th year of glorious business presence. The manufacturing ideawas conceived by the promoters and started in the year 1958 in the form of a partnership firm; albeit the business assumingcorporate form sometime later. A meeting of the Board of Directors is planned to be held at appropriate time to make a specialannouncement with regard to Golden Jubilee Year. The Directors extend their warm greetings to the members for the Golden JubileeYear and are grateful to them for the encouragement and support over the period of time.
DIVIDEND
Your Directors are pleased to recommend enhancement in dividend on equity shares from 70% to 75%. The amount thereof per equityshare will be Rs.1.50. The total dividend outgo (including dividend tax) will be Rs.268.397 million. Dividend distribution as a percentageof the net profit is 30.2%.
OPERATIONSIncome for the year under review was Rs.14,178.983 million and net profit was Rs.889.241 million. The income was higher by 34.7%and the net profit was up by 28.9% over the previous year. Segmentally, electrical cables contributed 59.9%, communication cablescontributed 19.8%, copper rods contributed 18.2% and other products contributed 2.1% to the total sale of products. The sales mix,

10
FinolexCables Limited
when compared to the previous year, underwent a change due to increase in jelly filled telephone cable (JFTC) orders. During theyear under review, the Company received orders from different customers for supply of JFTCs.
The sales of electrical cables and other communication cables were in line with the market conditions prevailing from time to timeduring the year. Copper prices once again experienced a great deal of volatility for most of the year. The Company had done product-price revisions to effectively deal with the volatility in copper prices. The system of Value Added Tax (VAT) has now been adoptedby all the states within the Union Territory. However, there continues to be disparity in VAT rates for many of the Company’s products.Added to the divergence in rates is the variability in procedures for compliance. The state governments are working towards unifyingthe rates and procedures for VAT. The Union Government has made known its intentions to implement a single tax regime called‘Goods and Services Tax’ (GST). The governmental initiatives should promote a better compliance environment and provide animpetus for business by organized sector companies like your Company.
The Company witnessed good growth in profit for the year on account of increase in business activity coupled with cost managementmeasures undertaken.
PROJECTS
The Company had undertaken initiatives to manufacture new products and expand production base for the existing products in dueconsideration of the emerging market needs.
Compact Fluorescent Lamps (CFLs) Project
CFLs have been branded ‘Finoglow’ by your Company. Finoglow is an energy saving lamp, can save energy consumption upto 80%as against an equivalent incandescent lamp. Finoglow is available in different color temperatures, wattages and sizes. Finoglow hasa high color rendering index essential for true color lighting. Finoglow is available in retrofit and non-retrofit versions. The manufacturingfacility went on stream during September, 2007. Keeping in mind the high future CFL demand, your Company has taken steps toexpand the present CFL capacity by almost three times.
The business of CFL should get a big boost with the Government of India considering to ban conventional GLS lamps and promote CFLin support of the efforts to control global warming. Keeping in mind the high future CFL demand, your Company has decided to expandthe CFL capacity from 10 million units to 30 million units per year at an additional expenditure of Rs. 300 million. Your Company hasintentions to further expand capacity to 100 million CFLs over medium term at a new location in the state of Gujarat or Andhra Pradesh.
High Voltage Power Cables Project
This project was undertaken to manufacture insulated, underground usage power cables upto 66 KV rating. The manufacturingfacility has been set up at Urse near Pune. The plant has started trial runs during March, 2008.
High voltage power cables are required at power generation station and in power transmission segment in lower quantum; however,major requirements come from power distribution segment for upgrading the existing network by replacing overhead transmissionwires and underground power cables to cater to the ever growing demand for power caused by continuing urbanization process.
Uttarakhand Project
This project was conceived to expand the manufacturing base for light duty electrical cables for use in construction industry, electricalpanel wiring and consumer electrical goods. This plant is fast nearing completion and expected to go on stream in May 2008. ThisGreenfield manufacturing facility would be capitalized in the books in the next financial year.
The Uttarakhand manufacturing facility will enjoy fiscal incentives by way of excise duty exemption and income tax benefit in thedefined manner for the defined period. The commissioning of this facility will enhance competitiveness of the Company; besidesstaying close to the current and potential customers in business-booming northern and eastern regions of the country.
Electrical Switches Project
Branded as ‘Finoswitch’, the Company manufactures electrical switches of superior quality and aesthetics. Finoswitch is meant forcontrolling the flow of power. Finoswitch is safe, durable and tested to last over sixty thousand clicks. They are launched in tworanges; premium range for niche market and classic range for mass market. Premium range has a unique fluorescent stripe that glowsin dark and acts as a guide. The intermediate manufacturing facility at Urse is fully operational. The Company has intentions to shiftmanufacturing operations to Uttarakhand state at the present location and manufacture electrical switches on full scale basis.
The products manufactured / to be manufactured at the above plants have / will have the same assurance of Finolex quality andsafety standards. The products will ride on the high brand equity enjoyed by your Company and are sold/will be sold through theexisting country wide distribution network.
Urse Expansion
Your Company manufactures a variety of electrical and communication cables at its plants located at Urse near Pune. The Companyhas undertaken expansion of capacity of compounding plant and of various copper cable capacity at Urse at an estimated capitalexpenditure of about Rs. 400 million. The expansion in capacity is targeted to be completed in the financial year 2008-09, in a phasedmanner.

11
40thAnnual Report 2007-08
Finolex J-Power Systems Private Limited
On 13th December, 2007, the Company entered into a joint venture agreement with J-Power Systems Corporation of Japan to offercomplete turnkey solutions in extra high voltage (EHV) cable systems in India and abroad. The joint venture will be equipped withstate-of-the-art production facility such as vertical continuous vulcanizing (VCV) tower to produce high voltage cross linkedpolyethylene (XLPE) insulated power cables. Since such cables are installed in the trunk lines of high voltage power transmissiongrids in the urban areas, extreme quality and reliability are required.
The joint venture has been named “Finolex J-Power Systems Private Limited” and will manufacture and sale high voltage powercables upto 500KV capacity. The joint venture company shall also offer complete services of turnkey installation and connectorizationof the complete circuit along with the manufacture and supply of power cables and accessories (jointing kits).
J-Power Systems Corporation is a Japanese cable manufacturer specialized in high voltage power cables and systems, establishedin 2001 as an equally owned joint venture between Hitachi Cable Limited and Sumitomo Electric Industries Limited, the global leadersin the field of extra high voltage cable technology. Your Company will hold 49% of the share capital of the joint venture company andthe balance 51% will be held by the joint venture partner. However, the management control will be with your Company.
The joint venture is a significant development for the Company. With it, the Company completes its electric cable product range fromthe lowest voltage grade of 48 volts in auto cable to the highest voltage of 500,000 volts in power cable segment. Your Company isthe only company in India with this unique distinction.
NEW PRODUCTS
Looking at the customer requirements, your Company adds new variety of cables to its product range. Accordingly during the yearunder review, the Company’s Marketing team successfully launched various state-of-the-art cables designed and developed by thein-house R&D team. As part of its future plans, your Company is studying the market potential for manufacture of Aluminium ConductorSteel Reinforced (ACSR Conductor) and Enamelled Wires with a view to develop products to meet requirements of niche markets.
EXPORTS
In January 2008 your Company was awarded the prestigious trophy by Engineering Export Promotion Council for Star Performer asmedium enterprise in the product group of miscellaneous electrical machinery and apparatus (including electrical distribution and controlapparatus) for outstanding contribution to engineering exports during the year 2005-06.
The Company’s sustained efforts to improve its earnings from its business in the international markets have started yielding results.FOB value of exports for the year was Rs. 779.118 million as against Rs. 672.532 million for the previous year. The Company exportsa variety of cables. With the manufacturing background for years, access to and availability of best breed technology and conformitywith international standards the Company has been offering customized cable solutions to its international customers. The Companyhas initiated the process of establishing its maiden branch office in DUBAI.
FINANCE
Your Company has been accorded P1+ rating, the highest rating for a Rs. 2.5 billion (enhanced from Rs. 2 billion) short term debtprogram. The Company holds AA+ / Stable rating for its Rs. 500 million long term non convertible debentures outstanding. TheCompany has also obtained a similar rating for another Rs. 500 million long term non convertible debentures to be issued at anappropriate time in future. All the debt ratings have been given by CRISIL. The Company follows a balanced policy to manage liquidityand borrowing. The Company has been able to meet its financial commitments in a timely manner. The Company has been able tocontain its interest cost despite rising interest rates.
SUPERBRAND STATUS
It is a matter of great pride that the Company has been selected as the ‘Superbrand’ in the exclusive and elite Superbrand Category.The Business Superbrand status was for the calendar years 2004, 2005 and 2006. The Company moved forward and was awardedthe Consumer Superbrand status as well for the calendar years 2006 and 2007. New ‘Superbrand’ status for the year 2008-09 isunder issuance to the Company. The Company is the only Indian cable company to have achieved this distinction.
SIX SIGMA
Your Company has committed itself to Six Sigma initiative. The Six Sigma initiative is progressing satisfactorily. The training phase of thefirst group of participants is over and pilot projects undertaken by them are under financial evaluation. Six Sigma will help the Companyidentify, focus on and solve business challenges before it in a disciplined manner. Six Sigma demands hardwork and commitment ofresources. Six Sigma is a continuous improvement process.
FIXED DEPOSITS
The Company had stopped accepting fixed deposits since 28th April, 2003. As on 31st March, 2008, the unclaimed deposits were Rs.40,000 and interest accrued thereon till due date. The reminders sent by the Company in the past to the deposit holders at their known
12
FinolexCables Limited
address were not helpful in liquidating the unclaimed deposits. Under the provisions of the Companies Act, 1956, unclaimed depositsof Rs. 71,000 and interest accrued thereon of Rs 3722 have been transferred on 25th March 2008 to the Investor Education andProtection Fund (IEPF) established by the Central Government. If the deposits of Rs. 40,000 continue to remain unclaimed, they willalso be transferred to the IEPF Account of the Central Government on the due dates.
EMPLOYEES
Human resource management has assumed immense importance in the present days. The economy is growing at unprecedentedrates and on a continuous basis; hence demand for trained and talented human capital has gone up. Towards human resourceretention and development, the Company follows pragmatic methods. The human skill development part is taken care of throughtraining programs. The training programs are designed in a systematic manner after identifying an individual’s training needs. Cuttingacross the organizational hierarchy, training sessions are held for promoting team spirit and for addressing training needs. Themotivation part is taken care of through empowerment and ensuring healthy working environment. The dual remuneration system:assured as well as performance related: promotes talent within the Company. The Company endeavours to ensure that its differentfunctions are adequately manned.
Industrial relations continued to be cordial during the year.
The Company had 1,316 permanent employees on its roll as on 31st March, 2008.
CORPORATE GOVERNANCE
The statement of Management Discussion and Analysis is annexed hereto and forms a part of this Report.
CORPORATE SOCIAL RESPONSIBILITY
The Company has decided to sponsor setting up of a rural residential school under the Government of Andhra Pradesh State’slandmark initiative to provide quality education to semi urban and rural students of the State in collaboration with the corporate world.The Government has handed over about 43 acres against the 50 acres of land agreed to be provided free of cost for setting up theschool. Your Company shall set-up the school infrastructure such as school building, library, games facilities, hostels, staff quarters,etc. This school will be affiliated to Central Board of Secondary Education, New Delhi. 25% of the school running cost will be borneby the Company whereas, Government will bear 50% of such cost and the balance 25% will be met through collection of fees. Thisschool will be managed by the Board of Governors to be constituted.
As the members are aware, the Company has been contributing to Finolex Academy of Management & Technology which runs a fullfledged engineering college since 1994 at Ratnagiri which is affiliated to Mumbai University, Mumbai. The Academy also offersMasters Degree in Computer Applications. International Institute of Information Technology or I2IT as it is known is also patronized bythe Company. I2IT offers post graduate MS and MBA courses with various specializations in Advanced Information Technology.
Your Company has adopted ITI Lonavala, Pune under the Government of India scheme for public private partnership for revamping ofindustrial training in India by converting Industrial Training Institutes (ITIs) into centres of excellence. All Industry Partners have to enterinto a Memorandum of Agreement (MoA) in a common form under the said scheme and the Company has entered into such MoA withPresident of India and the Government of Maharashtra for revamping ITI Lonavala, Pune as a centre of excellence. The Company’sassociate company, Finolex Industries Limited has adopted ITI, Ratnagiri under the said scheme. Besides, the Company also extendsfinancial assistance to worthy social causes.
The Company discharges its duties as a responsible corporate citizen. The Company accords highest importance to legal compliancesand contributes to the exchequer handsomely. All of its plants are environment compliant and hold ISO 14001 (Environment ManagementSystem) certification. The Company has adopted a Code of Conduct. Honesty and integrity are the corner stones on which the humancapital is built within the Company. The Company promotes an environment of trust and confidence while functioning.
DIRECTORS’ RESPONSIBILITY STATEMENT
Pursuant to Section 217(2AA) of the Companies Act, 1956, the Directors confirm that;
i) in the preparation of the annual accounts, the applicable accounting standards have been followed;
ii) appropriate accounting policies have been selected and applied consistently and have made judgments and estimates that arereasonable and prudent so as to give a true and fair view of the state of affairs of the Company as at 31st March, 2008 and ofthe Profit and Loss Account for the year ended 31st March, 2008;
iii) proper and sufficient care has been taken for the maintenance of adequate accounting records in accordance with theprovisions of the Companies Act, 1956 for safeguarding the assets of the Company and for preventing and detecting fraud andother irregularities;
iv) the annual accounts have been prepared on a going concern basis.

13
40thAnnual Report 2007-08
ENERGY, TECHNOLOGY AND FOREIGN EXCHANGE
Information on conservation of energy, technology absorption, foreign exchange earning and outgo required to be given pursuant toSection 217(1) (e) of the Companies Act, 1956 read with the Companies (Disclosure of Particulars in the Report of the Board ofDirectors) Rules, 1988 is annexed hereto and forms part of this Report.
PARTICULARS OF EMPLOYEES
Information as required under the provisions of Section 217(2A) of the Companies Act, 1956 (the Act) and the rules framed thereunder forms part of this Report. However, as per the provisions of Section 219(1)(b)(iv) of the Act, the Report and Accounts arebeing sent to the shareholders, excluding the statement of particulars of employees under Section 217(2A) of the Act. Any shareholderdesirous of obtaining a copy of the said statement may write to the Company Secretary & Vice President (Legal) at the RegisteredOffice of the Company.
LISTING OF SECURITIES
The Company’s equity shares are listed on the two premier stock exchanges of the country namely Bombay Stock Exchange Limitedand National Stock Exchange of India Limited, amongst other stock exchanges. The Company has issued Global Depository Receiptswhich are listed on the Luxembourg Stock Exchange. The Company’s non-convertible debentures are listed on wholesale debt marketsegment of the National Stock Exchange of India Limited.
DIRECTORS
In February 2008, Dr. N.A. Kalyani resigned from the Board of Directors of the Company for health reasons. The Board of Directorsplaces on record its deep appreciation of the valuable services and contribution rendered by Dr. Kalyani since his appointment on theBoard of Directors in October 1998 as senior member of the Board. With his resignation, he relinquished his membership of the AuditCommittee of the Board of Directors.
Mr. P P Chhabria and Mr.V K Chhabria, Wholetime Directors of the Company will be completing their term of appointment on 30th June2008. The Board of Directors has approved their reappointment for a period of five years. The terms and conditions of theirreappointment are being put up to the members for approval. Accordingly, suitable resolutions which appear in the notice of theensuing Annual General meeting have been proposed for consideration.
In accordance with the provisions of the Companies Act, 1956 and the Articles of Association of the Company, Mr. Sanjay K. Asher,Mr. Pratap G. Pawar and Mr. B.G. Deshmukh retire by rotation at the ensuing Annual General Meeting and are eligible for re-appointment.
Mr. Adi J Engineer was co-opted as an Additional Director on 23rd October 2007. He is B.E. (Civil), FIE and AIIA and is a technocrat withimmense experience in the Energy sector. He had been responsible and successful in setting up diverse projects during his long andsuccessful career with various multinational and other companies. He was earlier the Managing Director of Tata Power Limited andcontinues as a Director on its Board of Directors. He is also a Director on the Boards of several companies. Mr.Engineer’s appointmentis to be confirmed by the members at the ensuing Annual General Meeting. The Board of Directors feel that the presence of Mr.Adi JEngineer as a Director of the Company will greatly benefit the Company. Accordingly, the Board of Directors recommends hisappointment as a Director of the Company.
AUDITORS
M/s B.K. Khare & Company, Chartered Accountants, Auditors of the Company, hold office until conclusion of the ensuing AnnualGeneral Meeting and being eligible, offer themselves for reappointment.
ACKNOWLEDGEMENT
Your Directors are grateful to the channel partners, dealers and customers of the Company for their growing patronage for theCompany’s products. Your Directors thankfully acknowledge the support received from other business associates of the Company.Your Directors compliment the central and state governments, statutory authorities, local bodies, banks and financial institutions fortheir cooperation and support to the Company’s business operations. The employees are assets of the Company and your Directorsappreciate their contribution for the progress and growth of the Company. Your Directors are grateful to the members for extendingtheir complete support in conduct of the affairs of the Company.
For and on behalf of the Board of Directors
Pune P.P. ChhabriaDated : 28th April, 2008 Chairman

14
FinolexCables Limited
Annexure to Directors’ Report
COMPANIES (DISCLOSURE OF PARTICULARS IN THE REPORT OF BOARD OF DIRECTORS) RULES, 1988 :
A. Conservation of Energy :
a) Energy Conservation measures :
i) Commissioning of new 4MW heavy fuel oil engine to stop use of high energy consuming diesel engines.
ii) Providing thermal insulation on the chilled water tanks and pipelines to minimize radiation loss.
iii) Installed HT power factor compensation for Goa Electricity Department power, resulting in energy conservation.
iv) Luminous push button provided at work centres and installed limit switches where necessary.
v) Energy Efficient Metal Halide light fittings provided in aisle ways in place of 250 W HPML lamps.
vi) Auto control ON-OFF provided to street lights.
vii) Installation of energy efficient light fittings in place of conventional tube lights.
viii) Improved preventive maintenance of machines to reduce energy loss.
b) Additional investments and proposals, if any, being implemented for reduction of consumption of energy :
Various proposals / measures for reducing energy consumption are under consideration.
c) Impact of the measures at (a) and (b) above for reduction of energy consumption and consequent impact on the cost of
production of goods:
Impact has not been separately measured.
d) Total energy consumption and energy consumption per unit of production as per Form A in respect of industries specified
in the schedule thereto:
Not applicable.
B. Technology Absorption :
Efforts made in technology absorption as per Form B are as follows :
Form for disclosure of particulars with respect to Absorption, Research and Development (R&D)
1. Specific areas in which the Company is pursuing R & D efforts :
(a) Following new cables have been designed, developed and successfully launched in the market :
(i) Co-axial cable using CCS conductor.
(ii) RG214 Co-axial cables.
(iii) Figure 8 cables.
2. Benefits derived as a result of the above R&D :
The aforesaid newly developed products have been introduced in the market and give significant benefits in terms of quality,
better performance of the end-user application and import substitution.
3. Future plan of action:
- To develop RF cables
- To develop CAT7 LAN cables with higher bandwidth.
- To develop cross-linkable HFFR cables for high temperature working.
- To develop low water peak optic fibres.
- To develop cost effective FTTH Cables.
- To develop ZHFR building wires.

15
40thAnnual Report 2007-08
4. Expenditure on R & D
(a) Capital } The development work is carried on
(b) Recurring } by the concerned departments on
(c) Total } an ongoing basis. The expenses
(d) Total R & D expenditure as } and the costs of assets are grouped
a percentage of total turnover } under the respective heads.
Technology Absorption, Adaptation and Innovation :
1. Efforts in brief, made towards technology absorption, adaptation and innovation :
(a) Power Modules for heating control were indigenised for substantial savings.
(b) Overall temperature control of the manufacturing process was improved by using specially designed PID controllersin-house.
(c) Imported equipment PLC programs were suitably modified for minimum product damage during power interruptionsfor reducing in process scrap.
(d) Continuous efforts are going on for further developing, improving and upgrading all types of cables.
2. Benefits derived as a result of the efforts e.g. product improvement, cost reduction, product development, importsubstitution etc. :
Several tangible and intangible benefits from new technology are derived such as cost reduction, productivity, developmentof new products, import substitution and better customer services. Development and manufacture of new products withenhanced features will extend the product range of the Company, enabling it to cater to different customer needs.
3. Imported technology (imported during the last 5 years reckoned from the beginning of the financial year) :
a) Technology Imported : Nil
b) Year of Import : Not applicable
c) Has technology been fully absorbed ? : Not applicable
d) If not fully absorbed, areas where thishas not taken place, reasons therefor,and future plans of action : Not applicable
C. Foreign Exchange Earnings and Outgo :
Exports have shown good growth in the year. The geographical spread of exports has now widened to the countries in thedeveloped part of the world. With the manufacturing background for years, access to and availability of best breed technologyand conformity with international standards, the Company has been offering customized cable solutions to its internationalcustomers. The Company continues to remain focused on export activity and is confident of achieving an impressive exportturnover in due course of time. The Company has initiated the process of establishing its maiden branch office in DUBAI.
i) Earnings by way of Exports : Rs. 779.118 million
ii) Outgo by way of Imports : Rs. 1,565.970 million
For and on behalf of the Board of Directors
Pune P.P. ChhabriaDated : 28th April, 2008 Chairman
16
FinolexCables Limited
Management Discussion and Analysis
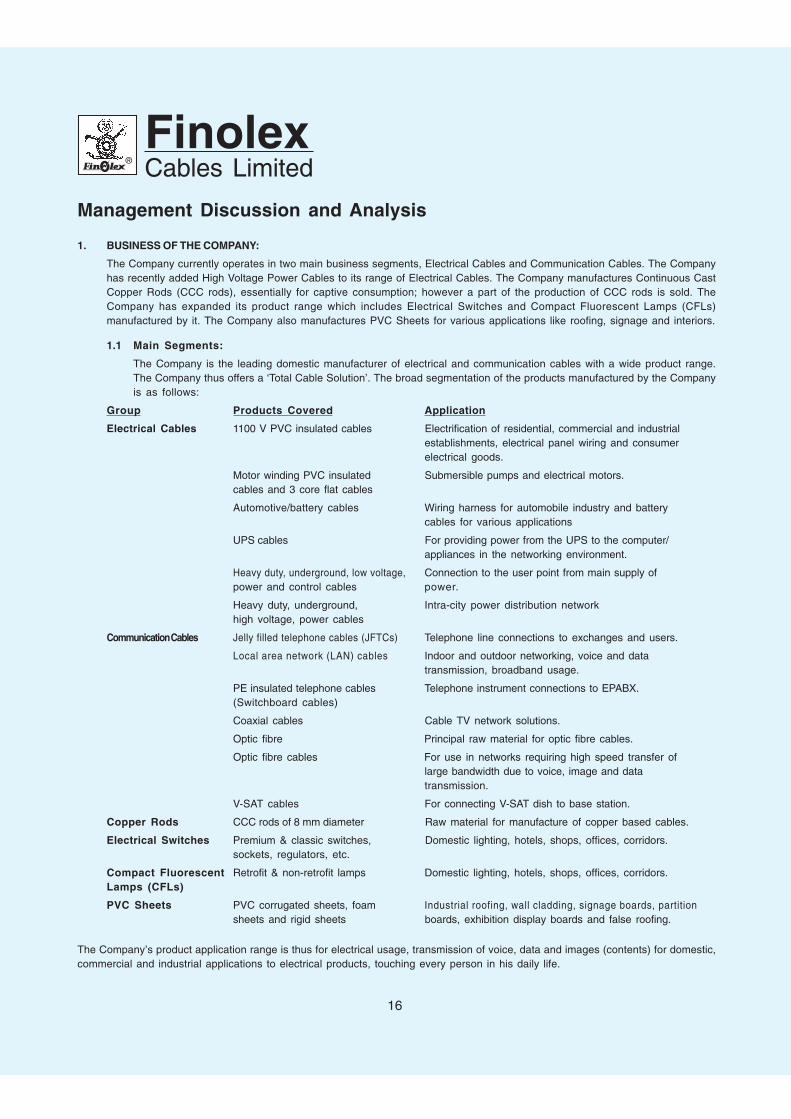
1. BUSINESS OF THE COMPANY:
The Company currently operates in two main business segments, Electrical Cables and Communication Cables. The Companyhas recently added High Voltage Power Cables to its range of Electrical Cables. The Company manufactures Continuous CastCopper Rods (CCC rods), essentially for captive consumption; however a part of the production of CCC rods is sold. TheCompany has expanded its product range which includes Electrical Switches and Compact Fluorescent Lamps (CFLs)manufactured by it. The Company also manufactures PVC Sheets for various applications like roofing, signage and interiors.
1.1 Main Segments:
The Company is the leading domestic manufacturer of electrical and communication cables with a wide product range.The Company thus offers a ‘Total Cable Solution’. The broad segmentation of the products manufactured by the Companyis as follows:
Group Products Covered Application
Electrical Cables 1100 V PVC insulated cables Electrification of residential, commercial and industrialestablishments, electrical panel wiring and consumerelectrical goods.
Motor winding PVC insulated Submersible pumps and electrical motors.cables and 3 core flat cables
Automotive/battery cables Wiring harness for automobile industry and batterycables for various applications
UPS cables For providing power from the UPS to the computer/appliances in the networking environment.
Heavy duty, underground, low voltage, Connection to the user point from main supply ofpower and control cables power.
Heavy duty, underground, Intra-city power distribution networkhigh voltage, power cables
Communication Cables Jelly filled telephone cables (JFTCs) Telephone line connections to exchanges and users.
Local area network (LAN) cables Indoor and outdoor networking, voice and datatransmission, broadband usage.
PE insulated telephone cables Telephone instrument connections to EPABX.(Switchboard cables)
Coaxial cables Cable TV network solutions.
Optic fibre Principal raw material for optic fibre cables.
Optic fibre cables For use in networks requiring high speed transfer oflarge bandwidth due to voice, image and datatransmission.
V-SAT cables For connecting V-SAT dish to base station.
Copper Rods CCC rods of 8 mm diameter Raw material for manufacture of copper based cables.
Electrical Switches Premium & classic switches, Domestic lighting, hotels, shops, offices, corridors.sockets, regulators, etc.
Compact Fluorescent Retrofit & non-retrofit lamps Domestic lighting, hotels, shops, offices, corridors.Lamps (CFLs)
PVC Sheets PVC corrugated sheets, foam Industrial roofing, wall cladding, signage boards, partitionsheets and rigid sheets boards, exhibition display boards and false roofing.
The Company’s product application range is thus for electrical usage, transmission of voice, data and images (contents) for domestic,commercial and industrial applications to electrical products, touching every person in his daily life.

17
40thAnnual Report 2007-08
1.2 Revenue Break up :
Segment-wise revenue breakup for the last two years is as follows:
2. REVIEW OF OPERATIONS:
• Production of metal based electrical and communication cables during the year under review was at 2,640 TCKM(thousand core kilometers) (previous year : 1,565 TCKM). Production of optic fibre cables during the year was 38,265cable kilometers (previous year : 20,547 cable kilometers). The sale value of electrical cables increased by 15% and thesale of communication cables was higher by 73% (due to better JFTC business) over the earlier year.
• The sale of CCC rods (net of interdivisional transfers) was at Rs. 2,869.468 million.
• Exports were higher at Rs. 779.118 million as against Rs. 672.532 million of the earlier year.
• The income from operations (including excise duty) was higher at Rs. 15,928.978 million for the year under review ascompared to Rs. 11,859.227 million for the earlier year.
• Profit after tax was higher at Rs. 889.241 million against Rs. 689.930 million for the earlier year.
• The Company commissioned its high voltage power cables plant at Urse near Pune and thus added high voltage powercables upto 66 KV rating to its range of electrical cables. The Company signed a joint venture agreement with J-PowerSystems Corporation, Japan for manufacturing extra high voltage power cables between 60 KV to 500 KV range and tooffer complete services of turnkey installation and connectorization with supply of jointing kits.
• The Company commissioned its CFL manufacturing facility at Urse near Pune. Keeping in mind the high future CFL demand,the Company has taken steps to raise CFL manufacturing capacity from 10 million units to 30 million units per year.
• A Greenfield manufacturing facility was conceived and set up at Roorkee, Uttarakhand to expand the manufacturing basefor light duty electrical cables for use in construction industry, electrical panel wiring and consumer electrical goods. Thisplant is fast nearing completion and expected to go on stream in May 2008.
• A reference may please be made to the financial statements.
3. KEY STRENGTH AREAS
3.1 Leading Manufacturer
The Company is India’s leading manufacturer of electrical and communication cables with a wide product range. Thisstatus not only helps the Company in terms of economies of scale, but as a market leader it is well positioned to reach outto new customers, both domestic and international.
3.2 Technical Superiority of Products
The Company lays a lot of emphasis on maintaining superiority status in terms of quality and product features through in-house research and development. The Company has defined quality assurance processes and strives for improvementin products. This product advantage is key reason why the Company has been able to carve out a niche position for itselfin the market.
3.3 Extensive Distribution Network
The Company has created a strong and dependable distribution network of channel partners and dealers, spreadingacross the country. The distribution network also includes commission agents/dealers appointed in the overseas market.The intention is to service the customer at his doorstep. Not only has the distribution network been built, the Companyundertakes a periodical review of it for upgradation and expansion. The domestic distribution network is well supportedby branch offices and depots opened by the Company at a number of locations throughout the Country.

18
FinolexCables Limited
3.4 Backward Integration
The Company manufactures CCC rods used as principal raw material for copper based electrical and communication cables.The Company makes its own compounds using PVC resin of different grades and formulations tailored specially for highperformance cables. The Company manufactures FRP rods and draws its own fibre for fibre optic cables. These backwardintegration measures help in product differentiation and facilitate maintaining desired quality of products for superiorconsistent performance besides ensuring timely supply of the raw material.
3.5 Unique Practices
The Company has pioneered many unique practices followed in the cable industry. The Company runs an enrollment schemefor electricians who qualify for performance based incentives. The Company grants personal accident insurance cover asone of the key incentives.
The Company has arranged for bank finance under a channel finance scheme to facilitate trade cycle of the channel partners.The bank lends money to the channel partners on soft terms and for extended duration. The credit is strictly regulated by theCompany. The channel finance scheme is in vogue for over last many years and is run without recourse to the Company.
3.6 ERP System
The Company uses the best of breed technology SAP R/3 software, the most widely used ERP software in the world, tomanage its internal processes. All the manufacturing plants, branch offices and stock-points of the Company are connectedto the SAP-ERP system through leased data circuits 24 X 7. This provides cohesiveness and efficiency in handling ofbusiness operations. To dovetail its processes with the distributor’s internal processes, the Company has extended someof the functionalities of SAP ERP to its distributors through a CRM application by virtue of which a distributor can place anorder directly, check the order execution status, verify the credit status, etc.
3.7 Superbrand Status
The Company is the only Indian cable company which holds the coveted Superbrand status right from the year 2004 andonwards till 2007. The new Superbrand status for the year 2008-09 is under issuance to the Company.
3.8 Six Sigma
The Company has initiated Six Sigma exercise at the manufacturing locations and support functions like purchase, sales,finance, human resource development and administration etc. The financial benefits will accrue from time to time; however,more importantly, Six Sigma will keep guiding the Company through a disciplined methodology to focus on solving businesschallenges before it.
3.9 Export potential
The Company’s products meet the requirement of international standards and thus are capable of geographical penetration.The Company has its presence in the international market for sometime now. The Company has been exporting light dutyelectrical cables, LAN cables, optic fibre cables and a variety of customised cables. With the best technology products in itsarmoury, the Company is putting a greater thrust on exports.
3.10 Total Cable Solution
The Company is probably the only one of its kind in the country to offer a “Total Cable Solution”. Different types of electricalcables are produced using copper as the core conductor. Various types of communication cables are produced using copperas well as optic fibre as the primary medium of transportation of signals. Different types of low voltage power cables areproduced using aluminum or copper as the core conductor. Different types of high voltage power cables will be produced at therecently commissioned manufacturing facility, using copper as the core conductor. The Company keeps on introducing newcable varieties besides upgrading the existing cable varieties. The Company has the ability to produce customised cables.The Company manufactures electrical products namely electrical switches and CFLs which are germane to electrical cablebusiness of the Company. Due to its product portfolio, the Company has the advantage of operating in multiple marketsegments simultaneously. The Company is well placed to leverage its position for a distinct competitive advantage.
4. GROWTH DRIVERS
The Company enjoys the leadership position in business on account of its commitment to, and continuous efforts in, thefollowing main areas;
• Ensuring consistent product quality
• Focusing on product improvement
• Ensuring competitive pricing and cost structure
• Planning timely supply and servicing
• Expanding existing businesses
• Developing new products
• Undertaking of new businesses• Pursuing market development, penetration and visibility• Creating customer preference• Adopting dynamic approach to situations

19
40thAnnual Report 2007-08
5. BUSINESS ENVIRONMENT :
The segment-wise discussion on the markets which are served by the Company is as follows:
5.1 Electrical Cables
Electrical cables can be further categorised into light duty electrical cables, power and control cables.
(i) Light duty electrical cables include electrical wires used extensively for lighting. The main product of this category is 1100volts PVC insulated wires which find application in electrification of residential, commercial and industrial establishments,electrical panel wiring and consumer electrical goods. The building industry and white goods industry have a closecorrelation with personal income. Higher the personal income, higher is the spending on essentials for life and thereafteron comforts of life. India is a growth story due to favourable demographics and competitive cost structure. As the economicactivity is increasing, the personal incomes are growing as well as more and more of population is coming within thespectrum of spending for housing and white goods. This fuels commercial and industrial activity to go up. Upswing ineconomic activity is attracting foreign investment into the country, boosting the economic activity further. The business andindividual confidence levels are high. Hence, there is increase in demand for buildings and rise in consumption-expenditure.Such an environment is creating deeper and a wider market place for this variety of electrical wires.
Due to India growth story, many of the renowned automobile manufacturers have set-up automobile manufacturingfacilities in India. Due to cost advantage, global auto manufacturers have started out sourcing auto components fromIndia. Domestic demand for automobiles coupled with export potential thereof augurs well for the automobile wiresproduced by the Company. The Company manufactures automobile wires according to international standards suchas German VDE Standards, Japanese JIS Standards, etc. The Company has been accepted and considered as adependable source of quality automobile wire for auto-wire harness manufacturers.
Majority of the population in India is still dependent for their living on agriculture. Farming is still monsoon dependent.Rain water is harvested by farmers trapping it underground in wells and is drawn for irrigation during non-monsoonperiod. The drawing of water happens by virtue of a submersible pump. The motor of the submersible pump is woundwith the winding wire and the pump is powered through a 3 core flat cable. Both these products are manufacturedby the Company for sale within the country as well as for exports.
UPS cables are battery backup cables used for providing power from UPS to the consumption points. Many states inIndia are facing shortage of power. UPS substitutes for electricity supplied through grid. If grid supplied electricity is notavailable, UPS takes over and meets power needs to a certain extent. Thus UPS has become a household item in India.
The Company is adding to its production base of light duty electrical cables by setting up manufacturing facility near Roorkeein the Uttarakhand State. Additionally, the Company has decided to spend for expansion of capacity at Urse near Pune.
(ii) The other category of electrical cables namely power and control cables are also manufactured by the Company. Inpower cable category, with addition of new unit commissioned at Urse recently, the Company has the ability tomanufacture such cables within the range 3.3 KV to 66 KV. These cables are either low voltage or high voltagecables depending upon their applications; however, always meant for underground usage. Power and controlcables upto 3.3 KV rating are used for connecting user point to the main supply of power. Power cables above 3.3KV rating are meant for use in underground application for intra-city electricity distribution network. The Companymanufactures insulated power cables only. These cables meet the requirements of international standards.
Performance
For the year under review, the electrical cables registered sales of Rs.9,339.225 million against Rs. 8,132.680 million ofthe previous year showing a growth of 15%.
Outlook
Electrical cables is the main focus area of business for the Company. It accounted for 59.9% of total sales for the year underreview. The main activities consuming electrical cables in bulk like building industry, automobile industry, agricultural irrigation andelectricity distribution are generally in the growth mode. There might be a temporary lowering of growth estimates due to theconcerns about global economic slow down. However, Indian economy is not expecting a major slow down in growth. Thesystem of VAT in place in all the states which, once harmonized, will generate accelerated business for electrical cables. Themacro environment for power cable sector is very strong on the back of improved investment scenario in the country. Largeinvestment is coming in power generation, distribution, rural electrification, upgrading existing distribution network, industrialcapacity expansion, construction and the like. These factors would drive demand growth for power cables in India.The manufacturing facility set up at Roorkee (first phase) is expected to go into commercial production of light dutyelectrical cables in May 2008. The expansion of manufacturing capacity at Urse is underway. These initiatives areexpected to provide competitive advantages to the Company.The Company faces two principal risks in this business. The Indian electrical cable industry is characterised by a largeunorganized sector. Besides, there are smaller, regional players creating electrical cables business to be highly competitive.The first and foremost risk the Company faces is of competition from unorganized sector and smaller and regional players.The Company has been dealing with the competitive forces through its organized business approach by providingsuperior quality products, safe products and maintaining high standards of service levels with its customers. TheCompany enjoys the advantages of economies of scale and backward integration. The Company evolves innovativebusiness practices and adopts a dynamic approach for handling the competitive business situations. The system of VAT

20
FinolexCables Limited
is helping to curb unorganized sector. The other risk is of raw material price movements which can occasionally be sharp.Though the Company endeavors to pass on the price effect to the customers, there has always been a time lag betweenthe price movement and the passing thereof which could benefit or dis-benefit the Company for the lag period orotherwise. The Company negotiates price variation contracts with bulk buyers. The Company has been fair in dealing withits customers and accordingly enjoys customer confidence in pricing decisions.
5.2 Communication Cables
The communication cables comprise of state of art, new generation communication cables and traditional telephone cables.(i) The state of art communication cables are either copper based or glass based. The copper based cables include
LAN cables, coaxial cables, PE insulated switchboard cables and V-SAT cables. These cables are used for last mileconnectivity. LAN cables are used in high speed networks, coaxial cables are used to provide content input to TVreceiving sets, PE insulated switchboard cables are used to connect telephone instruments to an EPABX system andV-SAT cables find their application in V-SAT towers to connect the dish to the base station.Optic fibre cables are glass based cables and they have the maximum bandwidth and speed. Certain cable designsused as trunk cables in long distance networks while other designs are used in distribution, whether by telecomcompanies, multi-service organisations or other service providers.Communication cables which carry voice, data or images is the backbone of an economic activity. The speed andbandwidth determine the capabilities of a communication network.
(ii) Traditional telephone cables include JFTCs which are laid underground and are used for connecting land linetelephones to exchanges. These are copper based cables. With introduction of mobile telephones in India and due tosubstitution by optic fibre cables, JFTC business has lost its value. Nevertheless, JFTC continues to remain apreferred option for last mile connectivity in fixed line telephones. The demand for JFTCs may continue to remainmodest. The Company would continue to manufacture JFTCs especially with broadband features for public sectorand private sector telecom companies and to meet the export demand. The Company has the capability to makeJFTCs as per customer’s needs.
Performance:
The communication cables segment (including optic fibre) recorded sales of Rs.3,104.802 million for the year underreview against Rs. 1,794.804 million for the earlier year showing a growth of 73 %. The Company received orders fromdifferent customers for supply of JFTCs.
Outlook:
India is growing at a good pace on year-on-year basis. Favourable demographics and opportunities to earn income is helpingthe country to keep maintaining the pace of development. The economic development requires inter-area, a strong, dependableand sustainable communication network. Cable is a backbone of the communication network. The performance characteristicsof cable defines the effectiveness of the communication network. Growing networking requirements, expanding entertainmentindustry and increasing broad band usage offer good business prospects for communication cables’ business of theCompany. The Company’s communication cables meet with the requirement of local as well as international standards. Andtherefore, find ready acceptance with domestic customers as well as in the exports market. In fact, the Company’s LANcables are accredited with UL (Underwriters’ Laboratories Inc., USA) verification status. Thus there exists a good scope forsale of communication cables in India and abroad. The Company has been exporting these cables.
The risks of competition and copper price movements similar to the electrical cables business are also applicable to thebusiness of communication cables. The varying global demand-supply equation of optic fibre and resultant price movementthereof; availability of preforms and price thereof and delay/slow-down in investment into networks by telecom companies/service provider and other relevant entities due to global slow-down pose risk to the business of communication cables.
5.3 Copper Rods
The copper rod is the feed stock for copper based electrical and communications cables. The Company manufactures itsown copper rods. The base material for producing copper rods is copper cathodes; the bulk of which are procured fromlocal manufacturers under supply agreements. A smaller portion of the requirement of copper cathodes is imported as andwhen need be. After meeting the in-house requirement of copper rods, the balance production of copper rods is allocatedfor third party sale.Performance:
During the year under review, the CCC rods division recorded a production volume of 24,642 metric tonnes and sales ofRs. 8,578.481 million, of which Rs.5,709.013 million were inter-divisional transfers and Rs.2,869.468 million were sales toothers. The volatility which had been observed in copper prices in the earlier period continued during the year underreview. The monthly average LME copper price (CSP) varied between a high of US dollars (USD ) 8439 per metric tonneto a low of USD 6588 per metric tonne.
Outlook:
The copper rod production is mainly for in-house consumption. The Company’s steps to set up new plants for cables as well asto expand the cable capacity at the existing plants will boost up the captive consumption of copper rods. The Company hassigned a joint venture agreement with J-Power Systems Corporation of Japan to manufacture extra high voltage power cables.These are essentially copper based cables. Accordingly the utilization of capacity at copper rod plant is expected to improve.

21
40thAnnual Report 2007-08
5.4 Electrical Switches and CFLs
The manufacture and sale of these electrical products act as a logical extension of the cables business of the Company.They have the backing of Finolex name, assuring the customer of quality, safety and performance standards. Theseelectrical and lighting products are sold through the existing well-spread distribution network of cables. Market responsehas been encouraging. On its part to contain the effects of global warming, the Government is promoting use of CFLs.Keeping in mind, high future CFL demand the Board of Directors has decided to expand the CFL capacity.
5.5 PVC Sheets
PVC Sheets may be classified as corrugated, flat sheets and rigid sheets. Corrugated sheets are used for roofing. Flatsheets are used for partition, exhibition, false roofing, wall cladding, display board and signage. The Company alsomanufactures rigid sheets which find application in chemical industry for manufacture of tanks and other handling systemfor corrosive chemicals and gasses. PVC sheets are light in weight, anti-corrosive and clean. The Company manufacturesthem in various thicknesses, profiles and colours. PVC sheets are meant for substituting asbestos sheet (which may becarcinogenic) and metal sheets (which are corrosive).
Performance:
During the year under review, the PVC Sheets division recorded production volume at 1,617 metric tonnes as against 1,570metric tonnes for the earlier year. The sales were Rs.157.011 million, as against Rs.148.896 million, for the earlier year.
Outlook:
The business of PVC sheets is not growing as expected due to availability of cheaper substitutes (though not recommended)like asbestos sheet, metal sheets, etc. The domestic market is extremely competitive. There exists an overseas demandfor PVC sheets and the Company exports PVC sheets in modest quantity.
5.6 Summary
The Company’s main business which comprises of manufacture of electrical cables and communication cables is closelylinked to the economic development of the country. India is coming of age and thriving to progress and convert herself intoa developed nation. This crusade for development requires substantial spending on infrastructure for development andupgradation. Addition to power generation capacity, spending on construction, industrialization, urbanization, increase inconsumption expenditure, laying, upgradation and modernization of communication network and the like are the indicatorsfor growing cable business. The governmental initiative on rationalizing commercial taxation system like VAT and consolidatingdifferent business and commercial taxes into a single point tax system like Goods and Services Tax (GST) should give abusiness boost to the manufacturers in the organized sector like your Company. Copper rod consumption shall increasedue to increase in business of copper based electrical and communication cables. The Company is also desirous ofincreasing copper rod sale to other consumers. Electrical switches and CFL businesses are steadily gaining firmer rootsin the market. The business of PVC sheets is closely linked to the customer preference for a better quality product. TheCompany’s products satisfy the Indian and international standards’ requirements. The Company has been able to grow onits exports. Looking futuristically, the Company has undertaken expansion of manufacturing capacities. The Company hasadded high voltage power cables to its range of electrical cables. Through a joint venture the Company is entering into thebusiness of extra high voltage power cables hitherto not within the Company’s domain.
Thus the Company is committed to expanding its business activities in an optimal manner. The Company has resourcesavailable at its disposal to implement and realize its business goals.
6. RISK MANAGEMENT DOCUMENT:
The Company has a Risk Management Document in place. The Document defines the risk policies, lays out the risk strategiesand methodology to decide on the risk taking ability of the organisation. The Document has been created with the intention tobring in awareness about various risks associated with the business of the Company. The risk management process involvesrisk identification, risk measurement, risk prioritisation, risk monitoring, risk escalation and risk mitigation. This Document sets outthe infrastructure for risk management. The risk policies are reviewed at appropriate time.
7. INTERNAL CONTROL SYSTEM
The Company has established a system of internal controls commensurate with its size and nature of business operations. Theinternal control system enables exercise of control over the transactions in the desired manner and at the desired level. Theinternal control system comes up for review periodically and wherever required is upgraded from time to time. In addition tointernal control system, there exists a system of internal audit. The internal audit is conducted under the guidance and adviceof the Audit Committee comprising of independent directors. The internal audit thus plays an important role as it conducts auditof all key business areas as per a predrawn and approved audit plan. The internal audit, amongst other things, looks at internalcontrols and procedures, reports to the Audit Committee non-compliances and gives suggestions for strengthening the internalcontrols. All audit observations, reviews and follow-up actions are reported to the Audit Committee. The Audit Committee metnine times during the year under review.

22
FinolexCables Limited
Financial summary for ten years(Rs. In million)
1998-99 1999-2000 2000-01 2001-02 2002-03 2003-04 2004-05 2005-06 2006-07 2007-08
PROFIT AND LOSSACCOUNT DATA
Gross Revenue ++ 4,656 5,761 6,279 6,750 5,189 5,689 6,701 8,899 12,055 16,270
Materials andmanufacturing cost(including excise duty) 3,023 3,922 4,313 4,876 3,682 4,132 5,191 6,855 9,557 13,068
Employee cost 158 189 230 261 251 292 254 326 355 497
Administration &selling expenses 290 372 424 502 493 461 520 660 750 1,033
Extra ordinary Items — — — — — 37 — — — —
Depreciation 88 150 190 222 235 263 259 313 264 265
Interest and financecharges 237 181 196 164 246 178 106 128 159 204
Profit before tax 860 947 926 725 282 326 371 617 970 1,203
Taxation 240 240 201 65 35 30 63 113 280 314
Profit after tax 620 707 725 660 247 296 308 504 690 889
Dividend (including taxon dividend distributionif applicable) 140 286 284 230 104 138 157 209 251 268
BALANCE SHEET DATA
Share capital 180 343 343 343 306 306 306 306 306 306
Reserves 5,509 5,103 5,545 5,526 4,923 5,080 4,702 5,055 5,495 6,109
Net worth 5,689 5,446 5,888 5,869 5,229 5,386 5,008 5,361 5,801 6,415
Loan Funds 1,126 1,190 1,047 1,223 2,036 1,880 1,321 2,343 2,653 2,876
Deferred Tax (Net) — — — 213 285 295 184 213 208 175
Total Liabilities 6,815 6,636 6,935 7,305 7,550 7,561 6,513 7,917 8,662 9,466
Gross Block 1,605 2,733 3,102 4,211 4,596 4,777 4,126 4,753 5,807 6,773
Net Block 948 1,866 2,049 2,872 3,074 3,006 2,118 2,288 3,079 3,784
Investments 1,758 1,719 2,137 2,012 2,318 3,067 2,491 2,722 2,833 3,168
Net current assets 4,109 3,051 2,749 2,421 2,144 1,488 1,904 2,907 2,750 2,514
Miscellaneous Expenditure(to the extent not writtenoff or adjusted) — — — — 14 — — — — —
Total Assets 6,815 6,636 6,935 7,305 7,550 7,561 6,513 7,917 8,662 9,466
KEY RATIOS
Growth in Revenue (%) 1.0 23.8 9.0 7.5 (23.1) 9.6 17.8 32.8 35.5 35.0
PAT to Revenue (%) 13.3 12.3 11.5 9.8 4.8 5.2 4.6 5.7 5.7 5.5
Return on Net Worth (%) 10.9 13.0 12.3 11.2 4.7 5.5 6.2 9.4 11.9 13.9
Earnings per Share Rupees 6.9 4.1 4.2 3.8 1.6 1.9 2.0 3.3 4.5 5.8(for face value of Rs. 2/- each)
Asset Turns (Revenue to
Total Assets) 0.7 0.9 0.9 0.9 0.7 0.8 1.0 1.0 1.4 1.7
Return on Capital
Employed (%) 14.5 16.3 16.3 12.3 6.2 6.5 6.7 10.1 13.5 15.4
Debt to Equity Ratio 0.2 0.2 0.2 0.2 0.4 0.4 0.3 0.4 0.5 0.4
Dividend (incl. Dividend
Tax) Distribution to PAT(%) 22.6 40.5 39.1 34.8 41.9 46.7 51.0 41.5 36.4 30.2
Note :++ Comprises Income From Operations(including excise duty) and Other Income

23
40thAnnual Report 2007-08
Auditors’ Report
To the Members of Finolex Cables Limited.
We have audited the attached Balance Sheet of Finolex Cables Limited as at 31st March 2008, and also the Profit and Loss Accountand the Cash Flow Statement for the year ended on that date annexed thereto. These financial statements are the responsibility ofthe Company’s management. Our responsibility is to express an opinion on these financial statements based on our audit.
We conducted our audit in accordance with auditing standards generally accepted in India. Those Standards require that we plan andperform the audit to obtain reasonable assurance about whether the financial statements are free of material misstatement. An auditincludes examining, on a test basis, evidence supporting the amounts and disclosures in the financial statements. An audit alsoincludes assessing the accounting principles used and significant estimates made by management, as well as evaluating the overallfinancial statement presentation. We believe that our audit provides a reasonable basis for our opinion.
We report as follows:
1. As required by the Companies (Auditor’s Report) Order, 2003, issued by the Central Government of India, in terms of Section227(4A) of the Companies Act, 1956, we enclose in the Annexure a statement on the matters specified in the paragraphs 4 and5 of the said Order.
2. Further to our comments in the Annexure referred to in paragraph 1 above:
a) We have obtained all the information and explanations, which to the best of our knowledge and belief were necessary forthe purposes of our audit;
b) In our opinion, proper books of account as required by law have been kept by the Company so far as appears from ourexamination of the books and proper returns adequate for the purposes of our audit have been received from thebranches not visited by us;
c) The Balance Sheet, Profit and Loss Account and Cash Flow Statement dealt with by this report are in agreement with thebooks of account;
d) In our opinion, the Balance Sheet, Profit and Loss Account and Cash Flow Statement dealt with by this report comply with theAccounting Standards referred to in sub-section (3C) of Section 211 of the Companies Act, 1956;
e) On the basis of the written representations received from the Directors as on 31st March, 2008 and taken on record by theBoard of Directors, we report that none of the Directors is disqualified as on 31st March, 2008 from being appointed asDirector in terms of clause (g) of sub section (1) of Section 274 of the Companies Act, 1956;
f ) In our opinion, and to the best of our information and according to the explanations given to us, the said accounts, readtogether with the Company’s Accounting Policies and the Notes thereto give the information required by the CompaniesAct, 1956 in the manner so required and give a true and fair view in conformity with the accounting principles generallyaccepted in India:
i) in the case of the Balance Sheet, of the state of affairs of the Company as on 31st March, 2008
ii) in the case of the Profit and Loss Account, of the Profit of the Company for the year ended on that date; and
iii) in the case of Cash Flow Statement, of the cash flows for the year ended on that date.
For B. K. Khare & Co.Chartered Accountants
U. B. JoshiPlace : Pune PartnerDated : 28th April, 2008 Membership No. 44097

24
FinolexCables Limited
Annexure to the Auditors’ Report
Referred to in paragraph 1 of our Report of even date:
i. a) The Company has maintained proper records showing full particulars including quantitative details and situation of fixedassets.
b) All the assets have not been physically verified by the management during the year but there is a regular programme ofverification, which in our opinion, is reasonable having regard to the size of the Company and the nature of its assets. TheCompany has substantially completed the reconciliation of Physical Inventory of Fixed Assets with book records.
c) During the year, Company has not disposed of any substantial/major part of fixed assets.
ii. a) As explained to us, the inventory has been physically verified during the year by the management. In our opinion, thefrequency of verification is reasonable.
b) In our opinion and according to the information and explanations given to us, the procedures of physical verification ofinventory followed by the management are reasonable and adequate in relation to the size of the Company and the natureof its business.
c) In our opinion and according to the information and explanations given to us and on the basis of our examination of therecords of inventory, the Company is maintaining proper records of inventory. The discrepancies noticed on physicalverification of inventory as compared to the book records were not material and have been properly dealt with in thebooks of account.
iii. a) According to the information and explanations given to us, the Company has not taken any loans, secured or unsecuredfrom companies, firms or other parties covered in the register maintained under Section 301 of the Companies Act, 1956.The Company has granted a loan of Rs. 3.50 Mn to Finolex Infrastructure Limited, a party covered in the registermaintained under Section 301 of the Companies Act, 1956. The loan is not sqaured off during the year.
b) The rate of Interest and other terms and conditions of the loan are not prejudical to the interest of the Company.
c) The principal amount is not due during the year.The party is regular in payment of interest.
iv. In our opinion and according to the information and explanations given to us, there are adequate internal control procedurescommensurate with the size of the Company and nature of its business with regard to the purchase of inventory and fixedassets, and with regard to the sale of goods. During the course of our audit, no major weakness has been noticed in the internalcontrols.
v. In respect of transactions entered in the register maintained in pursuance of section 301 of the Companies Act 1956,
a) Based on audit procedures applied by us, to the best of our knowledge and belief and according to the information andexplanations given to us, we are of the opinion that the particulars of contracts or arrangements have been entered in theregister required to be maintained under Section 301.
b) According to the information and explanations given to us and excluding certain transactions of purchase of goods andmaterial of special nature for which alternate quotations are not available, in our opinion, the contracts or arrangements havebeen made at prices which are prima facie reasonable having regard to the prevailing market prices at the relevant time.
vi. In our opinion and according to the information and explanations given to us, the Company has not accepted deposits from thepublic and therefore, the provisions of Section 58A and 58AA or any other relevant provisions of the Companies Act, 1956 andRules there under are not applicable to the Company.
vii. In our opinion, the Company has an internal audit system commensurate with the size and the nature of its business.
viii. We have broadly reviewed the books of account maintained by the Company relating to the manufacture of cables, conductorsand Compact Florescent Lamps pursuant to the rules made by the Central Government for the maintenance of cost recordsunder Section 209(1)(d) of the Companies Act, 1956 and are of the opinion that prima facie the prescribed accounts andrecords have been maintained. We have not, however, made a detailed examination of the records with a view to determiningwhether they are accurate or complete.
ix. a) According to the records of the Company and information and explanations given to us, the Company has been regular indepositing undisputed statutory dues including Provident Fund, Investor Education and Protection Fund, Employees’ StateInsurance, Income Tax, Sales Tax, Wealth Tax, Service Tax, Customs Duty, Excise Duty, cess and other statutory dueswith the appropriate authorities during the year.

25
40thAnnual Report 2007-08
b) According to the records of the Company and information and explanations given to us, dues of Income Tax, Sales Tax,Wealth Tax, Service Tax, Customs Duty, Excise Duty and cess which have not been deposited on account of disputes andthe forum where dispute is pending as under:
Name of the statute Nature of dues Amount Period to which Forum where dispute is(Rs.in Million) amount relates pending
Sales Tax Act Sales Tax demand 0.403 F.Y.1992-1993 Appellate Tribunal
Sales Tax demand 0.560 F.Y.1993-1994 Appellate Tribunal
Sales Tax demand 0.070 F.Y.1999- 2000 Deputy Commissioner (Appeals)
Sales Tax demand 0.060 F.Y.2001-2002 Deputy Commissioner (Appeals)
x. The Company does not have accumulated losses as at the end of the year and the Company has not incurred cash lossesduring current and the immediately preceding financial year.
xi. Based on our audit procedures and on the basis of information and explanations given by the management, we are of theopinion that the Company has not defaulted in the repayment of dues to financial institutions, banks and debenture holders.
xii. According to the information and explanations given to us, the Company has not granted any loans and advances on the basisof security by way of pledge of shares, debentures and other securities.
xiii. The provisions of any Special Statute applicable to Chit Fund, Nidhi or Mutual Benefit Fund/Societies are not applicable to theCompany.
xiv. (a) Based on the records examined by us and according to the information and explanations given to us, we are of the opinionthat the Company is maintaining proper record of the transactions and contracts of dealing in shares and securities andthat timely entries have been made in these records.
(b) Based on our audit procedures and to the best of our knowledge and belief and according to the information andexplanation given to us, the shares and securities have been held by the Company in its own name.
xv. According to the information and explanations given to us, the Company has not given any guarantee for loan taken by othersfrom banks and financial institutions.
xvi. To the best of our knowledge and belief and according to the information and explanation given to us, term loans availed by theCompany were, prima facie, applied by the Company during the year for the purposes for which the loans were obtained.
xvii. According to the Cash Flow Statement and records examined by us and according to the information and explanations givento us, on overall basis, funds raised on short-term basis have, prima facie, not been used during the year for long-terminvestment .
xviii. The Company has not made any preferential allotment to parties and companies covered under register maintained underSection 301 of the Companies Act, 1956, during the year and the question of whether the price at which the shares have beenissued is prejudicial to the interest of the Company does not arise.
xix. According to the information and explanations given to us and the records examined by us, security or charge has beencreated in respect of the debentures issued.
xx. The Company has not raised money by any public issues during the year and hence the question of disclosure and verificationof end use of such money does not arise.
xxi. To the best of our knowledge and belief and according to the information and explanation given to us, no fraud on or by theCompany was noticed or reported during the year.
For B. K. Khare & Co.Chartered Accountants
U. B. JoshiPlace : Pune PartnerDated: 28th April, 2008 Membership No. 44097
26
FinolexCables Limited
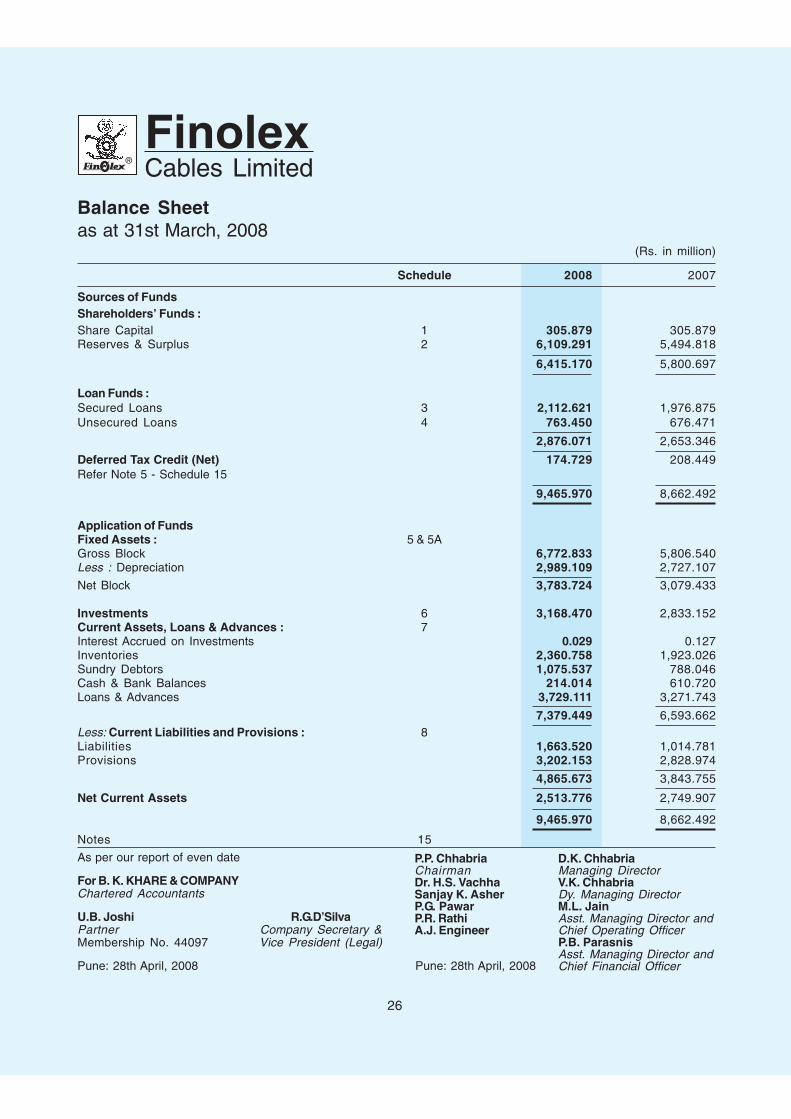
Balance Sheetas at 31st March, 2008
(Rs. in million)
Schedule 2008 2007
Sources of FundsShareholders’ Funds :Share Capital 1 305.879 305.879Reserves & Surplus 2 6,109.291 5,494.818
6,415.170 5,800.697
Loan Funds :Secured Loans 3 2,112.621 1,976.875Unsecured Loans 4 763.450 676.471
2,876.071 2,653.346
Deferred Tax Credit (Net) 174.729 208.449Refer Note 5 - Schedule 15
9,465.970 8,662.492
Application of FundsFixed Assets : 5 & 5AGross Block 6,772.833 5,806.540Less : Depreciation 2,989.109 2,727.107
Net Block 3,783.724 3,079.433
Investments 6 3,168.470 2,833.152Current Assets, Loans & Advances : 7Interest Accrued on Investments 0.029 0.127Inventories 2,360.758 1,923.026Sundry Debtors 1,075.537 788.046Cash & Bank Balances 214.014 610.720Loans & Advances 3,729.111 3,271.743
7,379.449 6,593.662Less: Current Liabilities and Provisions : 8Liabilities 1,663.520 1,014.781Provisions 3,202.153 2,828.974
4,865.673 3,843.755
Net Current Assets 2,513.776 2,749.907
9,465.970 8,662.492
Notes 15
As per our report of even date
For B. K. KHARE & COMPANYChartered Accountants
U.B. Joshi R.G.D’SilvaPartner Company Secretary &Membership No. 44097 Vice President (Legal)
Pune: 28th April, 2008 Pune: 28th April, 2008
P.P. Chhabria D.K. ChhabriaChairman Managing DirectorDr. H.S. Vachha V.K. ChhabriaSanjay K. Asher Dy. Managing DirectorP.G. Pawar M.L. JainP.R. Rathi Asst. Managing Director andA.J. Engineer Chief Operating Officer
P.B. ParasnisAsst. Managing Director andChief Financial Officer

27
40thAnnual Report 2007-08
Profit and Loss Accountfor the year ended 31st March, 2008
(Rs. in million)
Schedule 2008 2007
Income:Income from Operations 9 15,928.978 11,859.227Less : Excise Duty 2,091.311 1,529.016
13,837.667 10,330.211
Other Income 10 341.316 196.042
14,178.983 10,526.253
Expenditure:Materials & Manufacturing 11 10,976.637 8,027.519Personnel Expenses 12 497.153 355.321Other Expenses 13 1,033.346 749.571Finance Charges 14 204.195 159.247Depreciation 264.671 264.288
12,976.002 9,555.946
Profit Before Tax 1,202.981 970.307Less : Provision for Taxation
Current Tax 341.360 280.000Deferred Tax (Net) (33.720) (4.623)Fringe Benefit Tax 6.100 5.000
Profit After Tax 889.241 689.930Add : Surplus brought forward 152.527 113.101
Balance Available for Appropriation 1,041.768 803.031AppropriationsDebenture Redemption Reserve 50.000 100.000Proposed Dividend 229.409 214.115Tax on Proposed Dividend 38.988 36.389General Reserve 300.000 300.000
618.397 650.504
Surplus Carried to Balance Sheet 423.371 152.527
Earnings Per ShareBasic / Diluted (face value Rs. 2/- each) 5.81 4.51Profit after Tax available for equity shareholders 889.241 689.930No. of Shares used in computing Earnings per Share (Basic / Diluted) 152,939,345 152,939,345
Notes 15
As per our report of even date
For B. K. KHARE & COMPANYChartered Accountants
U.B. Joshi R.G.D’SilvaPartner Company Secretary &Membership No. 44097 Vice President (Legal)
Pune: 28th April, 2008 Pune: 28th April, 2008
P.P. Chhabria D.K. ChhabriaChairman Managing DirectorDr. H.S. Vachha V.K. ChhabriaSanjay K. Asher Dy. Managing DirectorP.G. Pawar M.L. JainP.R. Rathi Asst. Managing Director andA.J. Engineer Chief Operating Officer
P.B. ParasnisAsst. Managing Director andChief Financial Officer

28
FinolexCables Limited
Cash Flow Statement for the year ended 31st March, 2008(Rs. in million)
2008 2007
A. Cash Flow from Operating ActivitiesNet profit Before Tax 1,202.981 970.307Adjustments for :Depreciation (Net) 264.671 264.288Provision for Short term compensated absences 2.726 3.200Income from Investments (27.308) (9.921)Dividend Income (137.246) (126.585)Interest Income (24.369) (11.959)Loss / (Profit) on : Sale of Fixed Assets (28.256) (1.361)Loss / (Profit) on : Sale of Investments (86.665) (15.826)Loss / (Profit) on : Forex Transactions 128.305 1.120Interest Cost 189.286 147.987Diminution in the value of Investments 10.646 4.187
291.791 255.131
Operating Profit before Working Capital Changes 1,494.772 1,225.438
Adjustments for Working Capital Changes :Trade and Other Receivable (373.361) (34.665)Inventories (437.732) 161.319Trade Payable 657.966 80.373
(153.127) 207.027
Cash generated from Operations 1,341.645 1,432.465Tax refund / (Paid) (371.794) (356.714)
Net Cash Flow from Operating Activities 969.851 1,075.751
B. Cash Flow from Investing ActivitiesIncome from Investments 27.308 9.921Dividend Income 137.246 126.584Interest Income 24.369 11.959Inflow from / (Additions to) Investments 67.356 7.450Diminution in the value of Investments (10.646) (4.187)Purchase of Fixed Assets/ Capital Expenditure (Net) (940.706) (1,054.522)
Net Cash Flow from Investing Activities (695.073) (902.794)
C. Cash Flow from Financing ActivitiesProceeds from External Commercial Borrowings 349.100 850.000Short Term Acceptances movement 711.829 (284.523)(Loss) / Profit on : Forex Transactions (128.305) (1.120)Dividend & dividend tax paid (254.926) (205.553)Interest Cost (189.286) (147.987)
Net Cash Flow from Financing Activities 488.412 210.817
Total (A) + (B) + ( C ) 763.189 383.773

29
40thAnnual Report 2007-08
Cash Flow Statement for the year ended 31st March, 2008(Rs. in million)
2008 2007
D. Increase / (Decrease) in Cash and Cash Equivalents
Cash and Cash Equivalents
Opening Balance 733.327 349.554
Closing Balance 1,496.516 733.327
Net Increase / (Decrease) in Cash and Cash Equivalents 763.189 383.773
Notes :
1) The above Cash Flow Statement has been prepared under the “Indirect Method” as set out in the AccountingStandard 3 on Cash Flow Statement issued by ICAI
2) Previous year figures have been regrouped wherever necessary to conform to current year’s classification.
As per our report of even date
For B. K. KHARE & COMPANYChartered Accountants
U.B. Joshi R.G.D’SilvaPartner Company Secretary &Membership No. 44097 Vice President (Legal)
Pune: 28th April, 2008 Pune: 28th April, 2008
P.P. Chhabria D.K. ChhabriaChairman Managing DirectorDr. H.S. Vachha V.K. ChhabriaSanjay K. Asher Dy. Managing DirectorP.G. Pawar M.L. JainP.R. Rathi Asst. Managing Director andA.J. Engineer Chief Operating Officer
P.B. ParasnisAsst. Managing Director andChief Financial Officer

30
FinolexCables Limited
Schedule 1 - Share CapitalAuthorised235,000,000 Equity Shares of Rs. 2/- each 470.000 470.00015,000,000 Unclassified Shares of Rs. 2/- each 30.000 30.000
500.000 500.000
Issued & Subscribed152,939,345 Equity Shares of Rs. 2/- each fully paid. 305.879 305.879
(Of the above, 146,065,520 Equity Shares are issuedas fully paid up bonus shares by capitalisation of Reserves)
305.879 305.879
During the previous year the Company had subdivided the Rs. 10/- share into5 shares of Rs. 2/- each. Consequently 30,587,869 shares of Rs.10/- eachhave become 152,939,345 shares of Rs. 2/- each w.e.f 16th January, 2007.
Schedule 2 - Reserves & SurplusCapital Reserveas per last Balance Sheet 84.079 84.079
84.079 84.079
Share Capital Buyback Reserveas per last Balance Sheet 55.183 55.183
55.183 55.183
Share Premiumas per last Balance Sheet 1,090.955 1,090.955
1,090.955 1,090.955
Debenture Redemption Reserveas per last Balance Sheet 200.000 100.000Add : Transferred from Profit & Loss Account 50.000 100.000
250.000 200.000Less : Transferred to Profit & Loss Account — —
250.000 200.000
General Reserveas per last Balance Sheet 3,912.074 3,612.074Less : Provision for differential amount of compensated absence 6.371 —Add : Transferred from Profit & Loss Account 300.000 300.000
4,205.703 3,912.074Surplus in Profit & Loss Account 423.371 152.527
4,629.074 4,064.601
6,109.291 5,494.818
Schedules forming part of the Balance Sheet(Rs. in million)
2008 2007
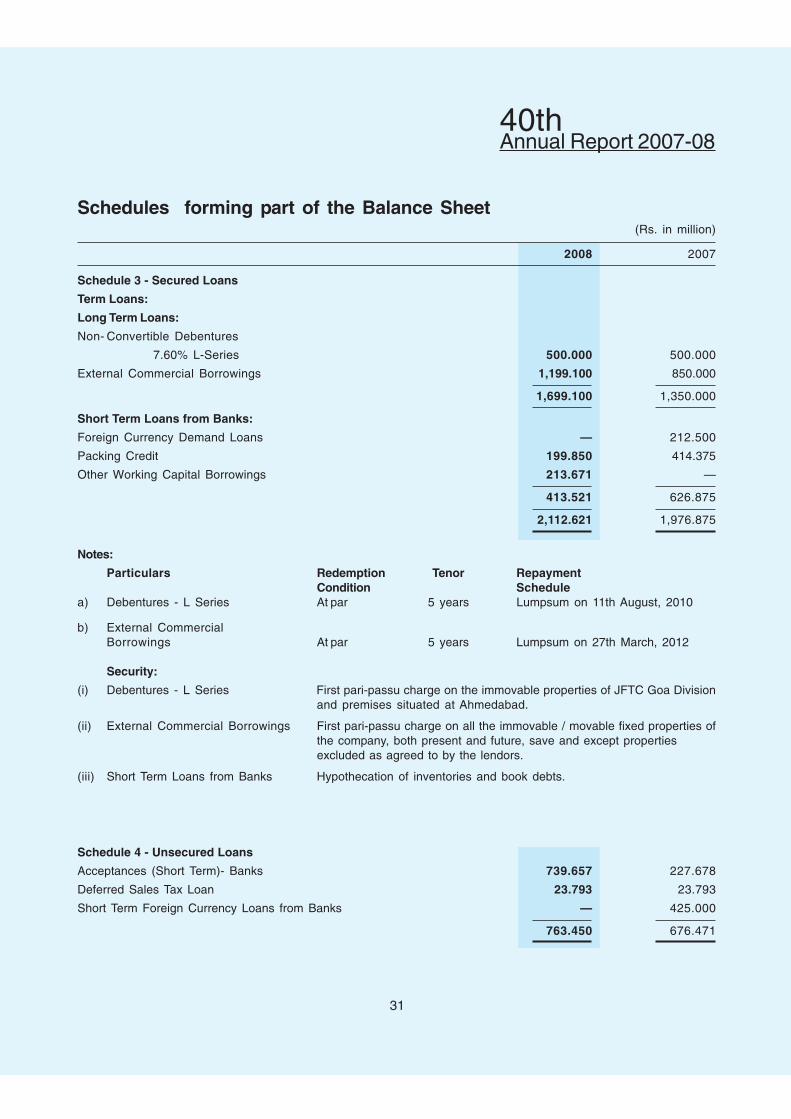
31
40thAnnual Report 2007-08
Schedule 3 - Secured Loans
Term Loans:
Long Term Loans:
Non- Convertible Debentures
7.60% L-Series 500.000 500.000
External Commercial Borrowings 1,199.100 850.000
1,699.100 1,350.000
Short Term Loans from Banks:
Foreign Currency Demand Loans — 212.500
Packing Credit 199.850 414.375
Other Working Capital Borrowings 213.671 —
413.521 626.875
2,112.621 1,976.875
Notes:
Particulars Redemption Tenor RepaymentCondition Schedule
a) Debentures - L Series At par 5 years Lumpsum on 11th August, 2010
b) External CommercialBorrowings At par 5 years Lumpsum on 27th March, 2012
Security:
(i) Debentures - L Series First pari-passu charge on the immovable properties of JFTC Goa Divisionand premises situated at Ahmedabad.
(ii) External Commercial Borrowings First pari-passu charge on all the immovable / movable fixed properties ofthe company, both present and future, save and except propertiesexcluded as agreed to by the lendors.
(iii) Short Term Loans from Banks Hypothecation of inventories and book debts.
Schedule 4 - Unsecured Loans
Acceptances (Short Term)- Banks 739.657 227.678
Deferred Sales Tax Loan 23.793 23.793
Short Term Foreign Currency Loans from Banks — 425.000
763.450 676.471
Schedules forming part of the Balance Sheet(Rs. in million)
2008 2007
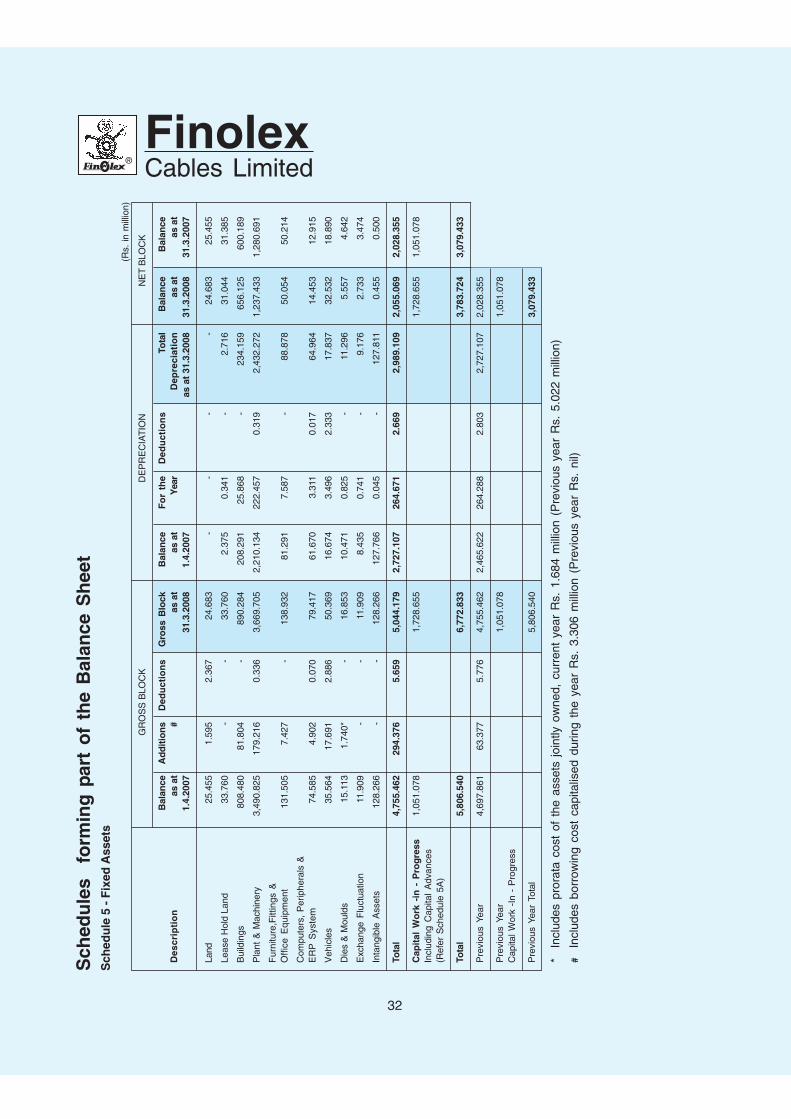
32
FinolexCables Limited
Sch
edu
les
fo
rmin
g p
art
of
the
Bal
ance
Sh
eet
Sch
edu
le 5
- F
ixed
Ass
ets
(R
s. in
mill
ion)
GR
OS
S B
LOC
KD
EP
RE
CIA
TIO
NN
ET
BLO
CK
Bal
ance
Ad
diti
on
s D
edu
ctio
ns
Gro
ss B
lock
Bal
ance
Fo
r th
eD
edu
ctio
ns
Tot
al B
alan
ce B
alan
ceD
escr
ipti
on
as a
t#
as a
tas
at
Yea
rD
epre
ciat
ion
as a
tas
at
1.4.
2007
31.3
.200
81.
4.20
07as
at
31.3
.200
831
.3.2
008
31.3
.200
7
Land
25.
455
1.5
95 2
.367
24.
683
- -
- -
24.
683
25.
455
Leas
e H
old
Land
33.
760
- -
33.
760
2.3
75 0
.341
- 2
.716
31.
044
31.
385
Bui
ldin
gs 8
08.4
80 8
1.80
4 -
890
.284
208
.291
25.
868
- 2
34.1
59 6
56.1
25 6
00.1
89
Pla
nt &
Mac
hine
ry 3
,490
.825
179
.216
0.3
36 3
,669
.705
2,2
10.1
34 2
22.4
57 0
.319
2,43
2.27
21,
237.
433
1,2
80.6
91
Fur
nitu
re,F
ittin
gs &
Offi
ce E
quip
men
t 1
31.5
05 7
.427
- 1
38.9
32 8
1.29
1 7
.587
- 8
8.87
8 5
0.05
4 5
0.21
4
Com
pute
rs,
Per
iphe
rals
&E
RP
Sys
tem
74.
585
4.9
02 0
.070
79.
417
61.
670
3.3
11 0
.017
64.
964
14.
453
12.
915
Veh
icle
s 3
5.56
4 1
7.69
1 2
.886
50.
369
16.
674
3.4
96 2
.333
17.
837
32.
532
18.
890
Die
s &
Mou
lds
15.
113
1.74
0* -
16.
853
10.
471
0.8
25 -
11.
296
5.5
57 4
.642
Exc
hang
e F
luct
uatio
n 1
1.90
9 -
- 1
1.90
9 8
.435
0.7
41 -
9.1
76 2
.733
3.4
74
Inta
ngib
le A
sset
s 1
28.2
66 -
- 1
28.2
66 1
27.7
66 0
.045
- 1
27.8
11 0
.455
0.5
00
Tota
l 4
,755
.462
294
.376
5.6
59 5
,044
.179
2,7
27.1
07 2
64.6
71 2
.669
2,98
9.10
92,
055.
069
2,0
28.3
55
Cap
ital
Wo
rk -
in -
Pro
gre
ss 1
,051
.078
1,7
28.6
55 1
,728
.655
1,0
51.0
78In
clud
ing
Cap
ital
Adv
ance
s(R
efer
Sch
edul
e 5A
)
Tota
l 5
,806
.540
6,7
72.8
333,
783.
724
3,07
9.43
3
Pre
viou
s Ye
ar 4
,697
.861
63.
377
5.7
76 4
,755
.462
2,4
65.6
22 2
64.2
88 2
.803
2,7
27.1
07 2
,028
.355
Pre
viou
s Ye
ar 1
,051
.078
1,05
1.07
8C
apita
l Wor
k -I
n -
Pro
gres
s
Pre
viou
s Ye
ar T
otal
5,8
06.5
403,
079.
433
*In
clud
es p
rora
ta c
ost
of t
he a
sset
s jo
intly
ow
ned,
cur
rent
yea
r R
s. 1
.684
mill
ion
(Pre
viou
s ye
ar R
s. 5
.022
mill
ion)
#In
clud
es b
orro
win
g co
st c
apita
lised
dur
ing
the
year
Rs.
3.3
06 m
illio
n (P
revi
ous
year
Rs.
nil)

33
40thAnnual Report 2007-08
Schedules forming part of the Balance Sheet(Rs. in million)
2008 2007
Schedule 5A- Capital WIP including Capital Advances & Expenditurepending Allocation
High Voltage Power Cable Project - Urse:
Capital Advances 3.958 39.511
Capital WIP & Expenditure Pending Allocation
Land 30.143 30.143
Building 344.730 202.089
Plant & Machinery 330.286 215.123
Other Assets 1.842 0.059
Preoperative Expenses 16.177 0.731
Interest 19.879 —
Trial Run Expenses - Net of Trial Run Income 20.449 —
767.464 487.656
Light Duty Cable Project - Roorkee:
Capital Advances 13.297 131.152
Capital WIP & Expenditure Pending Allocation
Land 129.935 124.797
Building 206.360 75.465
Plant & Machinery 285.855 2.964
Other Assets 0.038 0.036
Preoperative Expenses 77.226 22.546
Interest 13.680 1.814
726.391 358.774
Others:
Capital Advances 78.976 26.421
Capital WIP 155.824 178.227
234.800 204.648
TOTAL 1,728.655 1,051.078
Note: Includes borrowing cost capitalised during the year Rs. 35.813 million (Previous year Rs. 1.814 million)

34
FinolexCables Limited
Schedules forming part of the Balance Sheet(Rs. in million)
2008 2007
Schedule 6 - InvestmentsNon Trade Long Term (At Cost)Quoted Investments (Listed)
91,000 Equity Shares of Rs. 2 each fully paid in Bharat Forge Limited 1.506 1.506(Previous Year 91,000)
40,192,597 Equity Shares of Rs. 10 each paid in Finolex Industries Limited 1,518.530 1,518.530(Previous Year 40,192,597)
399,500 Equity Shares of Rs. 10 each paid in IndusInd Bank Limited 3.995 3.995(Previous Year 399,500)
Aggregate Market Value of Quoted Investments
Rs. 2,702.452 million (Previous Year 2,806.651 million) 1,524.031 1,524.031
Unquoted Investments6,100,000 Equity Shares of Rs. 10 each fully paid in I2IT Pvt Limited 61.000 61.000
(Previous Year 6,100,000)1,000,000 Equity Shares of Rs. 10 each fully paid in Plastro 10.011 10.011
Plasson Industries(India) Limited (Previous Year 1,000,000)
3,350 Equity Shares of Rs. 10 each fully paid in Promain 0.041 0.041Limited (Previous Year 3,350)
967,700 Equity Shares of Rs. 10 each fully paid in SICOM 77.803 77.803Limited (Previous Year 967,700)
— 6% cumulative redeemable preference shares of — —Re. 1 each in Sun Pharmaceutical Industries Limited(Bouns Shares) (Previous year 4,268)
1,000 Equity Shares of Rs. 10 each fully paid in The Saraswat 0.010 0.010Co-op Bank Limited (Previous Year 1,000)
24,975 Equity Shares of Rs.10 each fully paid in Finolex 0.250 —Infrastructure Limited (Previous Year Nil)
Investment in Joint Venture Company4,900 Equity Shares of Rs. 10 each fully paid in Finolex 0.049 —
J-Power Systems Private Limited (Previous Year Nil)
Share Application Money - Finolex J - Power Systems Private Limited 3.500 —
152.664 148.865
Provision for diminution in value of shares of SICOM Ltd. 25.373 34.213
127.291 114.652
Current Investments(Valued at lower of cost and fair value)Quoted Invesments
5,000 Equity Shares of Rs. 10 each fully paid in Bank of Rajasthan 0.155 0.155Limited (Previous Year 4,000)
198,750 Equity Shares of Rs.10 each fully paid in BF Utilities Limited 0.994 0.994(Previous Year 198,750)

35
40thAnnual Report 2007-08
Schedules forming part of the Balance Sheet(Rs. in million)
2008 2007
Schedule 6 - Investments (Contd.)
5,000 Equity Shares of Rs.10 each fully paid in Bhojwani Leasing & 0.000 0.000Finance Limited (Previous Year 5,000)
100 Equity Shares of Rs.10 each fully paid in Birla Ericsson 0.001 0.001Optical Limited (Previous Year 100)
100 Equity Shares of Rs. 10 each fully paid in Delton 0.001 0.001Cables Limited (Previous Year 100)
57 Equity Shares of Re. 1 each fully paid in Dish TV 0.000 —India Limited (Previous Year Nil)
5,000 Equity Shares of Rs. 10 each fully paid in Global 0.000 0.000Boards Limited (Previous Year 5,000)
3,150 Equity Shares of Rs. 10 each fully paid in ICICI Bank Limited 0.460 0.460(Previous Year 3,150)
200,000 Equity Shares of Rs. 10 each fully paid in Kirloskar 6.210 6.210Ferrous Limited (Previous Year 200,000)
100,000 Equity Warrants in Kirloskar Ferrous Limited 0.000 0.000(Previous Year 100,000 )
100 Equity Shares of Rs. 10 each fully paid in Nicco Corporation 0.000 0.000(Previous Year 100)
2,100 Equity Shares of Rs. 10 each fully paid in RPG Cables 0.030 0.030Limited (Previous Year 2,100)
100 Equity Shares of Rs. 10 each fully paid in Sterlite Optical 0.003 0.003Tech Limited (Previous Year 100)
100 Equity Shares of Rs. 10 each fully paid in Uniflex Cables 0.001 0.001Limited (Previous Year 100)
100 Equity Shares of Rs. 10 each fully paid in Usha Martin 0.000 0.000Infotech Limited (Previous Year 100)
500 Equity Shares of Re. 1 each fully paid in Usha Martin Limited 0.003 0.003(Previous Year 100 Equity Shares of Rs.5 each fully paid)
100 Equity Shares of Rs. 10 each fully paid in Vindhya 0.002 0.002Telelinks Limited (Previous Year 100)
50 Equity shares of Rs. 10 each fully paid in Wire & Wireless 0.000 0.000India Limited (Previous Year 50)
100 Equity Shares of Rs. 10 each fully paid in ZEE Entertainment 0.014 0.014Enterprises Limited (Previous Year 100)
45 Equity Shares of Rs. 10 each fully paid in ZEE News Limited 0.000 0.000(Previous Year 45)
— Units of Rs. 10 each of ABN AMRO Fixed Term Plan — 10.000Series 2 - 13 Month plan - Growth (Previous Year 1,000,000)
— Units of Rs. 10 each of ABN AMRO Fixed Term Plan Series-1 — 5.000Growth (Previous Year 500,000)
1,000,000 Units of Rs. 10 each of ABN AMRO Fixed Term Plan Series 10 10.000 —Plan E Institutional- Growth (Previous Year Nil)
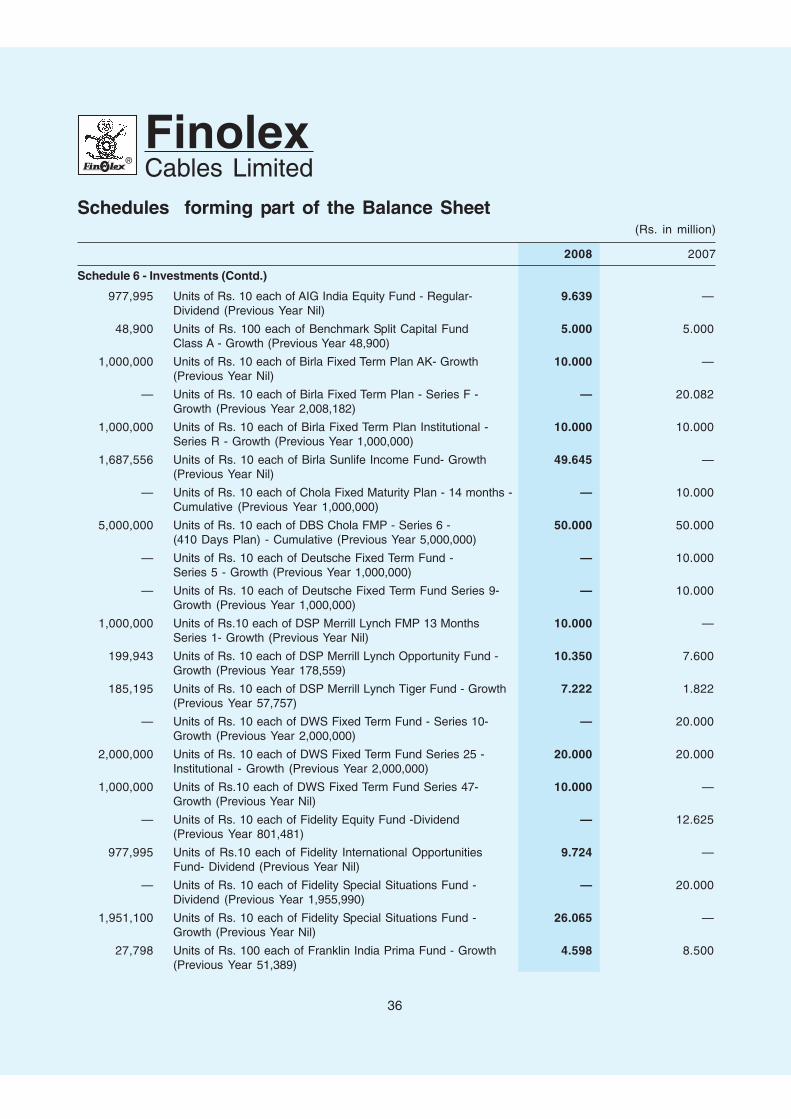
36
FinolexCables Limited
Schedules forming part of the Balance Sheet(Rs. in million)
2008 2007
Schedule 6 - Investments (Contd.)
977,995 Units of Rs. 10 each of AIG India Equity Fund - Regular- 9.639 —Dividend (Previous Year Nil)
48,900 Units of Rs. 100 each of Benchmark Split Capital Fund 5.000 5.000Class A - Growth (Previous Year 48,900)
1,000,000 Units of Rs. 10 each of Birla Fixed Term Plan AK- Growth 10.000 —(Previous Year Nil)
— Units of Rs. 10 each of Birla Fixed Term Plan - Series F - — 20.082Growth (Previous Year 2,008,182)
1,000,000 Units of Rs. 10 each of Birla Fixed Term Plan Institutional - 10.000 10.000Series R - Growth (Previous Year 1,000,000)
1,687,556 Units of Rs. 10 each of Birla Sunlife Income Fund- Growth 49.645 —(Previous Year Nil)
— Units of Rs. 10 each of Chola Fixed Maturity Plan - 14 months - — 10.000Cumulative (Previous Year 1,000,000)
5,000,000 Units of Rs. 10 each of DBS Chola FMP - Series 6 - 50.000 50.000(410 Days Plan) - Cumulative (Previous Year 5,000,000)
— Units of Rs. 10 each of Deutsche Fixed Term Fund - — 10.000Series 5 - Growth (Previous Year 1,000,000)
— Units of Rs. 10 each of Deutsche Fixed Term Fund Series 9- — 10.000Growth (Previous Year 1,000,000)
1,000,000 Units of Rs.10 each of DSP Merrill Lynch FMP 13 Months 10.000 —Series 1- Growth (Previous Year Nil)
199,943 Units of Rs. 10 each of DSP Merrill Lynch Opportunity Fund - 10.350 7.600Growth (Previous Year 178,559)
185,195 Units of Rs. 10 each of DSP Merrill Lynch Tiger Fund - Growth 7.222 1.822(Previous Year 57,757)
— Units of Rs. 10 each of DWS Fixed Term Fund - Series 10- — 20.000Growth (Previous Year 2,000,000)
2,000,000 Units of Rs. 10 each of DWS Fixed Term Fund Series 25 - 20.000 20.000Institutional - Growth (Previous Year 2,000,000)
1,000,000 Units of Rs.10 each of DWS Fixed Term Fund Series 47- 10.000 —Growth (Previous Year Nil)
— Units of Rs. 10 each of Fidelity Equity Fund -Dividend — 12.625(Previous Year 801,481)
977,995 Units of Rs.10 each of Fidelity International Opportunities 9.724 —Fund- Dividend (Previous Year Nil)
— Units of Rs. 10 each of Fidelity Special Situations Fund - — 20.000Dividend (Previous Year 1,955,990)
1,951,100 Units of Rs. 10 each of Fidelity Special Situations Fund - 26.065 —Growth (Previous Year Nil)
27,798 Units of Rs. 100 each of Franklin India Prima Fund - Growth 4.598 8.500(Previous Year 51,389)

37
40thAnnual Report 2007-08
Schedules forming part of the Balance Sheet(Rs. in million)
2008 2007
Schedule 6 - Investments (Contd.)
1,000,000 Units of Rs. 100 each of Franklin India Smaller Companies 10.000 10.000Fund - Growth (Previous Year 1,000,000)
— Units of Rs. 10 each of Grindlays Fixed Maturity 22nd Plan - — 10.000Dividend (Previous Year 1,000,000)
— Units of Rs. 10 each of Grindlays Fixed Maturity Plus — 10.000Plan I - Plan B-Growth (Previous Year 1,000,000)
133,020 Units of Rs. 10 each of HDFC Equity Fund - Growth 18.686 13.000(Previous Year 113,708)
— Units of Rs. 10 each of HDFC Fixed Maturity Plan - — 10.00013 Months - Growth (Previous Year 1,000,000)
1,000,000 Units of Rs. 10 each of HDFC Fixed Maturity Plan - 13 Months 10.000 —March 08 Series VII - Growth (Previous Year Nil)
5,000,000 Units of Rs. 10 each of HDFC Fixed Maturity Plan 15 Months 50.000 50.000Feb 2007 (3) - Wholesale Plan - Growth(Previous Year 5,000,000)
1,000,000 Units of Rs. 10 each of HDFC Fixed Maturity Plan 14 Months 10.000 —Feb 2008 (VII) - Wholesale Plan - Growth (Previous Year Nil)
3,000,000 Units of Rs. 10 each of HDFC Fixed Maturity Plan - 370 Days 30.000 —March 08 (2) - Growth (Previous Year Nil)
1,000,000 Units of Rs.10 each of HDFC Infrastructure Fund-Dividend 9.354 —(Previous Year Nil)
155,134 Units of Rs. 10 each of HSBC Equity Fund - Growth 10.493 7.600(Previous Year 135,067)
— Units of Rs. 10 each of HSBC Fixed Term Series 13 -Growth — 10.000(Previous Year 1,000,000)
— Units of Rs. 10 each of HSBC Fixed Term Series 4 - Growth — 10.000(Previous Year 1,000,000)
2,000,000 Units of Rs. 10 each of HSBC Fixed Term Series 23 - Growth 20.000 20.000(Previous Year 2,000,000)
4,802,245 Units of Rs.10 each of HSBC Flexi Debt Institutional- Growth 50.000 —(Previous Year Nil)
— Units of Rs. 10 each of ING Vysya Fixed Maturity Fund — 20.000Series VII - Growth (Previous Year 2,000,000)
2,000,000 Units of Rs. 10 each of ING Vysya FMP-Series XXII - Growth 20.000 20.000(Previous Year 2,000,000)
1,000,000 Units of Rs.10 each of ING Vysya Global Real Estate Fund- 10.000 —Dividend (Previous Year Nil)
1,000,000 Units of Rs.10 each of ING Vysya Long Term FMP 1 10.000 —Institutional- Growth (Previous Year Nil)
1,000,000 Units of Rs.10 each of JM Agri & Infra Fund - Dividend 7.024 —(Previous Year Nil)
977,995 Units of Rs.10 each of JM Contra Fund - Dividend Payout 9.362 —(Previous Year Nil)

38
FinolexCables Limited
Schedules forming part of the Balance Sheet(Rs. in million)
2008 2007
Schedule 6 - Investments (Contd.)
2,000,000 Units of Rs.10 each of JM FMP Series IX Months Institutional- 20.000 —Growth (Previous Year Nil)
977,517 Units of Rs.10 each of JM Small & Midcap Fund - Dividend 10.000 —(Previous Year Nil)
977,995 Units of Rs.10 each of JP Morgan India Equity Fund - Dividend 9.914 —(Previous Year Nil)
2,312,478 Units of Rs.10 each of Kotak Bond Fund Regular- Growth 49.660 —(Previous Year Nil)
2,000,000 Units of Rs. 10 each of Kotak Fixed Maturity Plan 13 Months- 20.000 20.000Series 1 - Growth (Previous Year 2,000,000)
1,000,000 Units of Rs.10 each of Kotak FMP 14 Months Series 4- 10.000 —Growth (Previous Year Nil)
— Units of Rs. 10 each of Kotak 30 -Dividend — 8.806(Previous year 278,327)
3,084,818 Units of Rs.10 each of Lotus India Arbitrage Fund - Dividend 31.549 —(Previous Year Nil)
1,000,000 Units of Rs.10 each of Lotus India FMP 13 Months Series IV- 10.000 —Institutional- Growth (Previous Year Nil)
5,000,000 Units of Rs. 10 each of Lotus India FMP 15 Months Series 1- 50.000 50.000Growth (Previous Year 5,000,000)
1,000,000 Units of Rs.10 each of Lotus India FMP 375 Days 10.000 —Series VIII- Growth (Previous Year Nil)
2,000,000 Units of Rs.10 each of Lotus India FMP 375 Days Series I to III - 20.000 —Growth (Previous Year Nil)
71,028 Units of Rs.1000 each of Mirae Asset Liquid Super 71.500 —Institutional- Growth (Previous Year Nil)
487,805 Units of Rs.10 each of Optimix Multimanager Equity Fund - 5.000 —Dividend (Previous Year Nil)
— Units of Rs. 10 each of Principal Cash Managment Fund - — 40.000Liquid Institutional Premium - Growth (Previous Year 3,425,332)
— Units of Rs. 10 each of Principal Deposit Fund (FMP -4-20) — 10.000385 days plan - Growth (Previous Year 1,000,000)
3,704,003 Units of Rs.10 each of Principal Income Institutional Plan- 49.937 —Growth (Previous Year Nil)
244,499 Units of Rs. 10 each of Prudential ICICI Equity & Derivatives 2.420 2.480Fund- Optimiser - Dividend (Previous Year 244,499)
2,000,000 Units of Rs. 10 each of Prudential ICICI Fixed Maturity Plan 20.000 20.000Series 34-15 Months- Growth (Previous Year 2,000,000)
— Units of Rs. 10 each of Prudential ICICI Fixed Maturity Plan — 20.000Series 37- 3M-Plan A - Growth (Previous Year 2,000,000)
1,000,000 Units of Rs.10 each of Prudential ICICI FMP Series 43 14 10.000 —Months Plan A- Growth (Previous Year Nil)

39
40thAnnual Report 2007-08
Schedules forming part of the Balance Sheet(Rs. in million)
2008 2007
Schedule 6 - Investments (Contd.)
1,000,000 Units of Rs. 10 each of Prudential ICICI Fusion Fund - 10.000 10.000Growth (Previous Year 1,000,000)
977,995 Units of Rs.10 each of Reliance Equity Advantage Fund - 9.822 —Dividend (Previous Year Nil)
— Units of Rs. 10 each of Reliance Equity Fund -Dividend — 22.025(Previous Year 1,995,000)
1,990,013 Units of Rs. 10 each of Reliance Equity Fund -Growth 26.427 —(Previous Year Nil)
2,000,000 Units of Rs. 10 each of Reliance Fixed Horizon Fund II 20.000 20.000Annual Plan Series V Intitutional - Growth(Previous Year 2,000,000)
5,000,000 Units of Rs. 10 each of Reliance Fixed Horizon Fund II 50.000 50.000Annual Plan Series VI Institutional - Growth(Previous Year 5,000,000)
50,387 Units of Rs. 100 each of Reliance Growth Fund - Growth 12.127 11.000(Previous Year 54,540)
1,940,081 Units of Rs. 10 each of Reliance Income Fund Retail Plan 49.494 —Growth Plan- Growth (Previous Year Nil)
— Units of Rs. 10 each of Reliance Liquidity Fund -Growth — 0.577(Previous Year 51,673)
345,457 Units of Rs.10 each of Reliance Liquid Fund -Treasury Plan 6.639 —Institutional - Growth (Previous Year Nil)
— Units of Rs. 10 each of Reliance Monthly Interval Fund- — 50.000Growth (Previous Year 5,000,000)
977,995 Units of Rs.10 each of Reliance Natural Resources Fund- 9.411 —Dividend (Previous Year Nil)
40,179 Units of Rs. 100 each of Reliance Vision Fund- Growth 8.282 2.322(Previous Year 13,684)
498,750 Units of Rs. 10 each of SBI Magnum Bluechip Fund - 5.356 5.436Dividend (Previous Year 498,750)
1,000,000 Units of Rs. 10 each of SBI Debt Fund Series 13 Months- 10.000 —Growth (Previous Year Nil)
178,640 Units of Rs. 10 each of SBI Magnum Sector Funds Umbrella 7.893 1.893Contra - Growth (Previous Year 53,249)
1,000,000 Units of Rs.10 each of SBI Infrastructure Fund - Dividend 10.000 —(Previous Year Nil)
1,138,443 Units of Rs. 10 each of SBI Multicap Equity Fund - Dividend 14.356 14.583(Previous Year 1,138,443)
383,723 Units of Rs. 10 each of Standard Chartered Classic Equity - 4.690 7.500Growth (Previous Year 613,665)
1,000,000 Units of Rs. 10 each of Standard Chartered Enterprise Equity - 10.000 10.000Dividend (Previous Year 1,000,000)

40
FinolexCables Limited
Schedules forming part of the Balance Sheet(Rs. in million)
2008 2007
Schedule 6 - Investments (Contd.)
2,000,000 Units of Rs. 10 each of Standard Chartered Fixed Maturity Plan 20.000 20.000Yearly Series 2- Growth (Previous Year 2,000,000)
1,000,000 Units of Rs.10 each of Standard Chartered Fixed Maturity Plan 10.000 —Yearly Series 20 Plan B - Growth (Previous Year Nil)
— Units of Rs. 10 each of Standarad Chartered Fixed Maturity — 50.000Plan- Quarterly Series 7- Growth (Previous Year 5,000,000)
— Units of Rs. 10 each of Standarad Chartered Liquidity — 100.000Manager Plus - Growth (Previous Year 93,155)
959,506 Units of Rs. 10 each of Sundaram BNP Paribas Equity 9.362 9.389Multiplier Fund - Growth (Previous Year 959,507)
1,000,000 Units of Rs. 10 each of Sundaram BNP Paribas Fixed Term 10.000 10.000Plan Series XIX-14M - Growth (Previous Year 1,000,000)
1,000,000 Units of Rs. 10 each of Sundaram BNP Paribas Fixed Term 10.000 —Plan Series C Institutional - Growth (Previous Year Nil)
1,000,000 Units of Rs. 10 each of Sundaram BNP Paribas Fixed Term 10.000 —Plan Series E - Growth (Previous Year Nil)
— Units of Rs. 10 each of Sundaram BNP Paribas Fixed Term — 30.000Plan Series XVI-90 Days-Growth (Previous Year 3,000,000)
973,236 Sundaram BNP Paribas Global Advantage Fund - Dividend 9.799 —
1,000,000 Units of Rs.10 each of Sundaram BNP Paribas Select 7.971 —Thematic Funds Energy Opportunities Fund - Dividend(Previous Year Nil)
— Units of Rs. 10 each of Sundaram Rural India Fund - — 19.450Dividend (Previous Year 2,000,000)
1,819,851 Units of Rs. 10 each of Sundaram Rural India Fund - 24.568 —Growth (Previous Year Nil)
181,918 Units of Rs. 100 each of Sundaram Select Midcap Fund - 16.760 7.400Growth (Previous Year 99,848)
— Units of Rs. 10 each of TATA Fixed Horizon Fund Series 3- — 10.000scheme D (13 Months) Growth (Previous Year 1,000,000)
67,913 Units of Rs. 10 each of TATA Growth Fund - Growth 1.670 3.200(Previous Year 13,118)
3,000,000 Units of Rs. 10 each of TATA Fixed Horizon Fund Series 6 - 30.000 30.000Scheme C - Growth (Previous Year 3,000,000)
5,000,000 Units of Rs. 10 each of Templeton Fixed Horizon Series 1 - 50.000 50.00013M Plan - Growth (Previous Year 5,000,000)
1,854,809 Units of Rs. 10 each of Templeton India Income Builder 49.404 — Account- Growth (previos Year Nil)
4,500,000 Units of Rs. 10 each of UTI Fixed Term Income Fund 45.000 45.000Series II - Growth (Previous Year 4,500,000)

41
40thAnnual Report 2007-08
Schedules forming part of the Balance Sheet(Rs. in million)
2008 2007
Schedule 6 - Investments (Contd.)
1,000,000 Units of Rs. 10 each of UTI Fixed Term Income Fund 10.000 —Series VI Plan V - Growth (Previous Year Nil)
[Aggregate Market Value of Current Quoted Investments 1,504.047 1,180.164
Rs. 1,803.319 million (Previous Year Rs. 1,685.928 million)]
Unquoted Investments
100 Equity Shares of Rs. 10 each fully paid in East West 0.000 0.000Travel & Trade Links Limited (Previous Year 100)
1 Pass through Certificate of Rs. 10,000,000/- each of 5.638 6.842Old Palasia RMBS Trust Series - I; Trustee - IDBIBank Limited (Previous Year 1)
5.638 6.842
Investment in Property
Immovable Property * 7.463 7.463
3,168.470 2,833.152
* The Company has entered into agreements for saleof some flats against which it has received an advanceof Rs. 2.300 million (Previous Year - Rs. 2.300 million)
Aggregate Value of - Quoted Investments
Book Value 3,028.078 2,704.195
Market Value 4,505.771 4,492.579
- Unquoted Investments
Book Value 132.930 121.494

42
FinolexCables Limited
Schedules forming part of the Balance Sheet
Details of Purchase and Sale of No. of Shares/Shares/ Units during the year Units
Details of Purchase and Sale of No. of Shares/Shares/ Units during the year Units
ABN AMRO Cash Fund Institutional Plan-Growth 2,410,277
ABN AMRO FTP Series 10 Plan E Institutional -Growth 1,000,000
ABN AMRO Money Plus Regular- Growth 2,510,662
AIG India Equity Fund Regular-Dividend 977,995
AIG India Liquid Fund Retail- Growth 10,468
AIG India Liquid Fund Super Institutional - Growth 302,073
AIG India Treasury Plus Fund Institutional Growth 3,141,605
Birla Cash Plus Institutional Premium - Growth 71,654,772
Birla FTP Series AK-Growth 1,000,000
Birla Sun Life Cash Manager-InstitutionalPlan-Growth 25,703,732
Birla Sun Life Income Fund - Growth 1,687,556
Chola Liquid Institutional Plus-Growth 2,601,592
DBS Chola Liquid Super Institutional-Growth 18,469,839
DBS Chola Short Term Floating Rate-Growth 31,389,426
DSP ML FMP 13 Months Series 1 - Growth 1,000,000
DSP ML Liquidity Fund Institutional - Growth 33,581
DSP ML Opportunity Fund - Growth 66,261
DSP ML Tiger Fund-Growth 142,850
DWS Fixed Term Fund Series-47 - Growth 1,000,000
DWS Short Maturity Fund- Growth 7,538,692
Fidelity Cash Fund - Super Institutional - Growth 18,791,734
Fidelity Cash Fund Institutional Plan-Growth 51,799,445
Fidelity Equity Fund -Dividend 801,481
Fidelity International Opportunities Fund- Dividend 977,995
Fidelity Liquid Plus Institutional - Growth 1,000,404
Fidelity Short Term Income Institutional - Growth 27,895,924
Fidelity Special Situations Fund-Growth 1,951,100
Fidelity Special Situations Fund-Dividend 1,955,990
Franklin India Prima Fund - Growth 23,590
Grindlays Floating Rate Fund - Liquid - InstitutionalPlan-B-Growth 1,485,531
HDFC Equity Fund - Growth 47,021
HDFC FMP 13 Months March 2008- Series VII -Growth 1,000,000
HDFC FMP 14Months February 2008 (VII) -Wholesale Plan - Growth 1,000,000
HDFC FMP 370 Days March 2008 (2) - Growth 3,000,000
HDFC Infrastructure Fund- Dividend 1,000,000
HSBC Cash Fund-Institutional Plan-Growth 19,967,676
HSBC Cash Fund-Institutional Plus-Growth 27,372,265
HSBC Equity Fund - Growth 48,441
HSBC Flexi Debt Institutional-Growth 4,802,245
ICICI Liquid Super Institutional Premium - Growth 106,275,362
ICICI Prudential FMP Series 43 - 14 MonthsPlan A - Growth 1,000,000
ICICI Prudential Institutional Liquid Plan-SuperInstitutional - Growth 64,632,704
ING Global Real Estate Fund-Dividend 1,000,000
ING Long Term FMP -1 Institutional-Growth 1,000,000
ING Vysya Liquid Plus Fund-Growth 2,363,622
ING Vysya Liquid Super Institutional - Growth 59,713,552
JM Agri & Infra Fund-Dividend 1,000,000
JM Contra Fund - Dividend 1,000,000
JM FMP Series IX - 15 Months- Institutional-Growth 2,000,000
JM High Liquid Super Institutional - Growth 3,090,744
JM Small & Midcap Fund-Dividend 977,517
JP Morgan India Equity Fund-Dividend 977,995
JP Morgan India Liquid Fund -Growth 59,067,095
JP Morgan India Liquid Plus Fund - Growth 50,017,334
Kotak 30 - Dividend 278,327
Kotak Bond (Regular) - Growth 2,312,478
Kotak FMP 14 Months Series 4 - Growth 1,000,000
Kotak Liquid Institutional Premium - Growth 1,740,958
Kotak Liquid Institutional Premium-Growth 22,403,619
Lotus India Arbitrage Fund- Dividend 2,981,201
Lotus India FMP -13 Months-Series IV-Institutional-Growth 1,000,000
Lotus India FMP 375 Days Series VIII - Growth 1,000,000
Lotus India FMP-375 Days- Series I To III-Growth 2,000,000
Lotus India Liquid Fund Institutional-Growth 53,141,236
Magnum Insta Cash Fund Liquid Floater Plan-Growth 11,167,978
Magnum Sector Funds Umbrella Contra-Growth 125,391
Mirae Asset Liquid Fund - Institutional- Growth 159,529
Mirae Asset Liquid Fund - Super Institutional-Growth 258,754
Optimix Multimanager Equity Fund-Dividend 487,805
Principal Cash Management Fund LiquidInstitutional Premium - Growth 12,428,397
Principal Income Institutional Plan - Growth 3,704,003

43
40thAnnual Report 2007-08
Schedules forming part of the Balance Sheet
Details of Purchase and Sale of No. of Shares/Shares/ Units during the year Units
Details of Purchase and Sale of No. of Shares/Shares/ Units during the year Units
Reliance Equity - Dividend 1,995,000
Reliance Equity Advantage Fund - Dividend 1,000,000
Reliance Equity Fund - Growth 1,990,013
Reliance Floater-Growth 5,980,657
Reliance Growth Fund - Growth 21,710
Reliance Income Fund-Retail Plan-Growth Plan -Growth 1,940,081
Reliance Liquid Fund - Treasury Plan - InstitutionalOption-Growth 4,212,374
Reliance Liquidity - Growth 5,539,705
Reliance Liquidity Fund -Growth 6,212,606
Reliance Natural Resources Fund-Dividend 977,995
Reliance Vision Fund-Growth 26,495
SBI Debt Fund Series 13 Months - Growth 1,000,000
SBI Infrastructure Fund -Dividend 1,000,000
SBI Premier Liquid Fund-Institutional Growth 22,334,344
SBI-Liquid Plus Institutional Plan-Growth 5,000,690
Standard Chartered Classic Equity - Growth 229,942
Standard Chartered Liquid Manager Plus-Growth 522,415
Standard Chartered FMP Yearly Series 20Plan B - Growth 1,000,000
Standard Chartered Liquidity Manager-Growth 9,293,617
Sundaram BNP FTP Plan C Institutional-Growth 1,000,000
Sundaram BNP FTP Plan E - Growth 1,000,000
Sundaram BNP Paribas Fixed Term PlanSeries XXIX - Growth 3,080,460
Sundaram BNP Paribas Global Advantage -Dividend 1,000,000
Sundaram BNP Paribas Rural India Fund-Growth 1,819,851
Sundaram Money Super Institutional Plan - Growth 11,726,377
Sundaram Rural India - Dividend 2,000,000
Sundaram Select Midcap Fund - Growth 29,684
Sundaram Select Thematic Energy OpportunitiesFund-Dividend 1,000,000
Tata Growth Fund - Growth 62,205
Tata Liquid Manager - Growth 54,675
Templeton India Income Builder Account - Growth 1,854,809
UTI Fixed Income Interval Fund-MonthlyInstitutional Plan Series-I - Growth 19,753,477
UTI Fixed Income Interval Fund-QuarterlyInstitutional Plan Series-I - Growth 2,000,000
UTI Fixed Term Income Fund Series IV -Plan V - Growth 1,000,000
UTI Liquid Cash Plan Institutional Plan-Growth 515,767

44
FinolexCables Limited
Schedules forming part of the Balance Sheet(Rs. in million)
2008 2007
Schedule 7 - Current Assets, Loans and Advances(A) Current Assets
Interest Accrued on Investments 0.029 0.127
InventoriesStores and Spares 103.403 82.164Raw Materials 420.199 341.708Semi finished Goods 737.101 631.299Finished Goods 1,051.324 833.160Packing Materials 16.213 15.291Scrap 20.075 8.719Goods for Trading 12.443 10.685
2,360.758 1,923.026Sundry DebtorsUnsecured, considered good, unless stated otherwiseOutstanding for a period exceeding six months 114.428 135.600Considered Doubtful 8.573 8.573Less : Provision 8.573 8.573
114.428 135.600Other Debts 961.109 652.446
1,075.537 788.046
Cash & Bank BalancesCash on hand 2.028 1.822Balances with Scheduled Banks in :
- Current Accounts 171.658 183.873- Fixed Deposit Accounts 0.025 0.025
171.683 183.898Balance with Barclays Bank Plc. in :
- Fixed Deposit Account 40.303 425.000
(maximum amount outstanding during the year 214.014 610.720Rs. 430.100 million, previous year Rs. 425.000 million)
3,650.338 3,321.919(B) Loans & Advances
Unsecured, considered good, unless stated otherwiseBalances with Customs, Excise etc. 77.954 49.778Advances recoverable in cash or in kind or for valueto be received 510.516 452.724Include Rs. 3.500 million (Previous Year Rs. Nil)to associate company, Finolex Infrastructure Ltd.Maximum amount outstanding during the yearRs. 3.500 million (Previous Year Rs. Nil)Advance Income Tax 3,140.641 2,769.241
3,729.111 3,271.743
7,379.449 6,593.662

45
40thAnnual Report 2007-08
Schedules forming part of the Balance Sheet(Rs. in million)
2008 2007
Schedule 8 - Current Liabilities and Provisions
(A) Current Liabilities
Sundry Creditors (Refer Note No. 6) 792.498 543.761
Other Liabilities 812.516 414.664
Deposits from Distributors 3.227 7.127
Deposits from Customers / Others 37.524 29.473
Interest accrued but not due 8.181 5.683
Unclaimed Fixed Deposits 0.040 0.116
Unclaimed Dividend * 9.534 13.957
1,663.520 1,014.781
(B) Provisions
Proposed Dividend 229.409 214.115
Tax on Proposed Dividend 38.988 36.388
Provision for Taxation 2,906.237 2,559.171
Provision for Short term compensated absences 27.097 18.000
Provision for Gratuity 0.422 1.300
3,202.153 2,828.974
4,865.673 3,843.755
*The figure does not include any amount due and outstanding tobe credited to Investor Education & Protection Fund.

46
FinolexCables Limited
Schedule 9 - Income from operations
Sale of Products 15,657.798 11,659.130Sale Others 30.212 30.989Sale of Scrap 240.968 169.108
15,928.978 11,859.227
Schedule 10 - Other Income
Interest earned on- Investments 27.308 9.463- Deposits — 0.459- Others 24.369 11.959
Dividend ReceivedFrom Long Term Investments 122.636 126.157From Current Investments 14.610 0.427
Profit on Sale of Assets 28.475 1.547Profit on Sale of Investments (Net)
From Current Investments 86.665 15.826Miscellaneous Income 37.253 30.204[Tax deducted at source Rs. 2.959 million(Previous year Rs. 3.757 million)]
341.316 196.042
Schedule 11 - Materials and Manufacturing Expenses
Materials ConsumedRaw Materials * 10,729.380 7,503.200Packing Materials 175.926 123.330Stores & Spares 155.960 83.280Add/(Less) : Decrease/(Increase) in stock of (335.322) 146.770
Finished, Semi-finished Goods & ScrapIncremental Excise Duty on 14.370 (26.318)Closing Stock of Finished Goods
10,740.314 7,830.262
Manufacturing Expenses (Direct)Processing Charges 1.541 2.212
Power & Fuel 267.520 203.078
269.061 205.290
Less: Captive Consumption for Capitalisation 32.738 8.033
10,976.637 8,027.519
* Includes cost of goods traded in Rs.5.264 million( Previous year Rs. 14.338 million )
Schedules forming part of the Profit and Loss Account(Rs. in million)
2008 2007

47
40thAnnual Report 2007-08
Schedules forming part of the Profit and Loss Account(Rs. in million)
2008 2007
Schedule 12 - Personnel Expenses
Salaries, Wages, Bonus and Commission etc. 471.288 347.872Contribution to Provident and other Funds 19.048 3.489Workmen and Staff Welfare Expenses 3.350 2.219Recruitment & Training Expenses 3.467 1.741
497.153 355.321
Schedule 13 - Other Expenses
Rent, Rates and Taxes 20.200 13.363Insurance 14.911 17.323Repairs & Maintenance :
Building 8.471 5.153Machinery 10.067 16.533Other Assets 16.311 16.075
Directors’ Sitting Fees 1.095 0.488Auditors’ Remuneration :
Audit Fees 2.500 2.050Tax Audit Fees 0.500 0.500Other Services 0.800 0.758Out of Pocket Expenses 0.060 0.048
Travelling and Conveyance 36.253 32.409Communication Expenses 14.154 11.643Selling & Distribution Expenses :
Sales Incentives 444.623 359.451Freight Outward (Net) 115.721 95.787Advertisement, Publicity etc. 68.726 45.553
Miscellaneous Expenses 150.428 128.413Provision for Doubtful Advances — 2.710Amounts Written off 0.002 0.008Loss on Derivative / Forex Transactions (Net) 128.305 1.120(Refer Note No. 10D, Schedule 15)Loss on Sale of Assets 0.219 0.186
1,033.346 749.571
Schedule 14 - Finance Charges
Interest:Fixed Period Loans 87.902 58.738Others 101.385 89.249
Bank Charges 14.908 11.260
204.195 159.247
48
FinolexCables Limited
Notes forming part of the Accounts
Schedule - 151. Significant Accounting Policies
i) Accounting Convention:
The financial statements are prepared under the historical cost convention, having due regard to fundamental accountingassumptions of going concern, consistency and accrual, in compliance with the accounting standards referred to in Section211(3C) of the Companies Act, 1956.
ii) Fixed Assets
a) Fixed Assets are stated at cost of acquisition or construction less accumulated depreciation. Attributable financecosts and expenses of bringing the respective assets to working condition for their intended use are capitalised.
b) Intangible Assets :Expenses incurred by the Company on acquisition , development or enhancement of intangibleresources are recognised as intangible assets if these are identifiable , Controlled by the Company and it is probablethat future economic benefit attributable to the asset would flow to the enterprise. Intangible asset are amortisedfrom the date when they are available for use over the best estimate of their useful life.
c) Impairment: The carrying amount of cash generating units / assets are reviewed at balance sheet date to determinewhether there is any indication of impairment. If any such indication exists, the recoverable amount is estimated asthe higher of net selling price and value in use. Impairment loss is recognised whenever carrying amount exceedsthe recoverable amount.
d) Borrowing Costs that are directly attributable to the acquisition or production of a qualifying asset are capitalised as partof the cost of those assets. Other borrowing costs are recognised as expense in the period in which they are incurred.
iii) Depreciation:
Depreciation is provided on straight-line method as per the rates and in the manner prescribed in Schedule XIV to theCompanies Act, 1956.
iv) Valuation of Investments:
Investments classified as long-term investments are stated at cost. Provision for diminution, if any, in the value of long-term investments is made to recognise a decline other than temporary in the fair value of investments. The fair value of along-term investment is ascertained with reference to its market value, investee’s assets and results and the expectedcash flows from the investment as well as the strategic importance to the company.
v) Valuation of Inventories:
All the inventories are valued at lower of cost or net realisable value. Cost of Raw Materials, Packing Materials, Stores andSpares is determined at weighted average cost. Finished goods and Semi Finished goods are valued at material cost, costof conversion and production cess wherever applicable. Scrap generated out of manufacturing process is valued at netrealisable value except in case of sheets, optic fibre, CFL and Switch divisions where it is accounted for on sale.
vi) Foreign Currency Transactions:
Transactions in foreign currencies are recorded at the exchange rates prevailing on the date of the transaction. CurrentAssets and Current Liabilities are translated at the year-end rate. The difference between the rate prevailing on the date oftransaction and on the date of settlement as also on translation of Current Assets and Current Liabilities at the end of the yearincluding exchange difference related to purchase of fixed assets from outside India is recognised as income or expense,as the case may be.
The company uses foreign exchange forward contracts and options to reduce the cost or to hedge it’s risks associatedwith foreign currency fluctuations to underlying transactions, for certain firm commitments or forecasted transactions.The difference between the forward rate and the exchange rate at the inception of the forward contract for underlyingtransaction is recognised as income or expense over the life of the contract. In respect of hedge contracts, for firmcommitment or forecasted transactions, the attributable gain or loss is taken to profit and loss account on accrual or oncompletion of hedge contract. Loss if any, in respect of outstanding derivatives at the balance sheet date is assessed bythe management based on the principle of prudence and charged to profit and loss account of that period.
vii) Revenue Recognition:
a) Sale of goods is recognised on despatches to customers and includes excise duty.b) Dividend income is accounted for when right to receive is established.c) Credits on account of Custom Duty and other benefits, which are due to be received with reasonable certainty, are
accrued upon completion of exports.
viii) Employee Benefits:
a) Defined Contribution Plan :Contributions are made to approved Superannuation and Provident Fund.
b) Defined Benefit Plan:
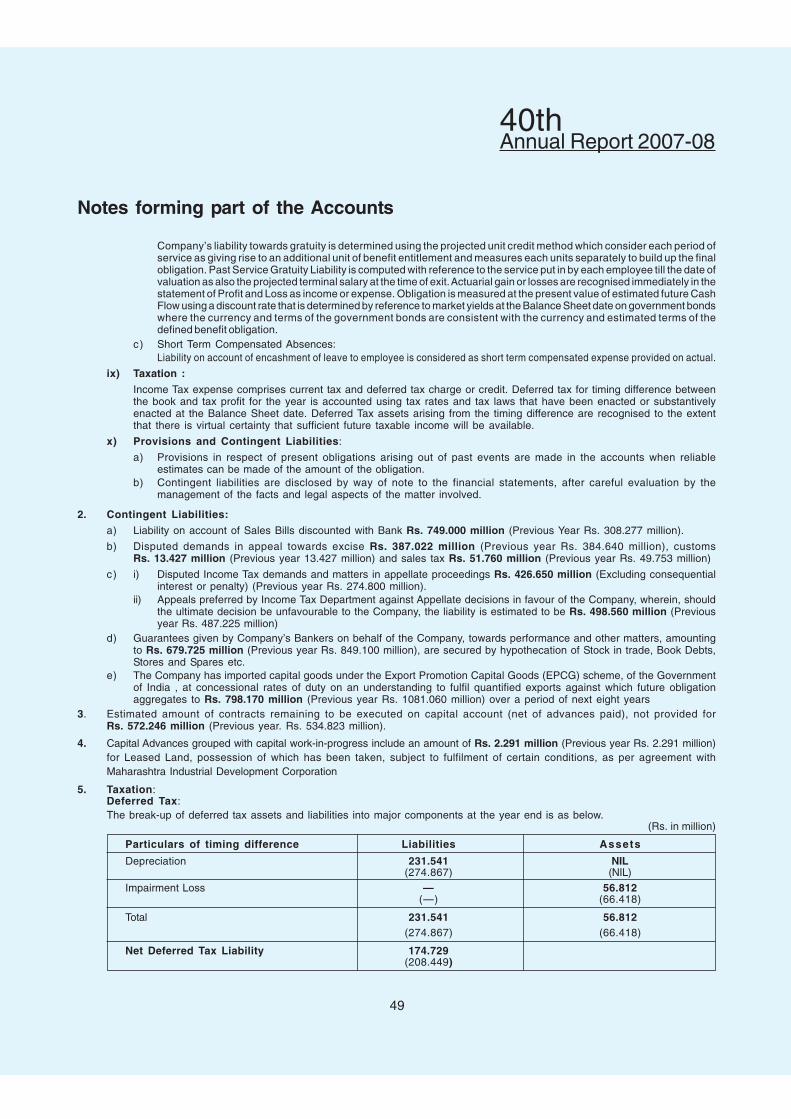
49
40thAnnual Report 2007-08
Notes forming part of the Accounts
Company’s liability towards gratuity is determined using the projected unit credit method which consider each period ofservice as giving rise to an additional unit of benefit entitlement and measures each units separately to build up the finalobligation. Past Service Gratuity Liability is computed with reference to the service put in by each employee till the date ofvaluation as also the projected terminal salary at the time of exit. Actuarial gain or losses are recognised immediately in thestatement of Profit and Loss as income or expense. Obligation is measured at the present value of estimated future CashFlow using a discount rate that is determined by reference to market yields at the Balance Sheet date on government bondswhere the currency and terms of the government bonds are consistent with the currency and estimated terms of thedefined benefit obligation.
c) Short Term Compensated Absences:Liability on account of encashment of leave to employee is considered as short term compensated expense provided on actual.
ix) Taxation :
Income Tax expense comprises current tax and deferred tax charge or credit. Deferred tax for timing difference betweenthe book and tax profit for the year is accounted using tax rates and tax laws that have been enacted or substantivelyenacted at the Balance Sheet date. Deferred Tax assets arising from the timing difference are recognised to the extentthat there is virtual certainty that sufficient future taxable income will be available.
x) Provisions and Contingent Liabilities:
a) Provisions in respect of present obligations arising out of past events are made in the accounts when reliableestimates can be made of the amount of the obligation.
b) Contingent liabilities are disclosed by way of note to the financial statements, after careful evaluation by themanagement of the facts and legal aspects of the matter involved.
2. Contingent Liabilities:
a) Liability on account of Sales Bills discounted with Bank Rs. 749.000 million (Previous Year Rs. 308.277 million).
b) Disputed demands in appeal towards excise Rs. 387.022 million (Previous year Rs. 384.640 million), customsRs. 13.427 million (Previous year 13.427 million) and sales tax Rs. 51.760 million (Previous year Rs. 49.753 million)
c) i) Disputed Income Tax demands and matters in appellate proceedings Rs. 426.650 million (Excluding consequentialinterest or penalty) (Previous year Rs. 274.800 million).
ii) Appeals preferred by Income Tax Department against Appellate decisions in favour of the Company, wherein, shouldthe ultimate decision be unfavourable to the Company, the liability is estimated to be Rs. 498.560 million (Previousyear Rs. 487.225 million)
d) Guarantees given by Company’s Bankers on behalf of the Company, towards performance and other matters, amountingto Rs. 679.725 million (Previous year Rs. 849.100 million), are secured by hypothecation of Stock in trade, Book Debts,Stores and Spares etc.
e) The Company has imported capital goods under the Export Promotion Capital Goods (EPCG) scheme, of the Governmentof India , at concessional rates of duty on an understanding to fulfil quantified exports against which future obligationaggregates to Rs. 798.170 million (Previous year Rs. 1081.060 million) over a period of next eight years
3. Estimated amount of contracts remaining to be executed on capital account (net of advances paid), not provided forRs. 572.246 million (Previous year. Rs. 534.823 million).
4. Capital Advances grouped with capital work-in-progress include an amount of Rs. 2.291 million (Previous year Rs. 2.291 million)for Leased Land, possession of which has been taken, subject to fulfilment of certain conditions, as per agreement withMaharashtra Industrial Development Corporation
5. Taxation:Deferred Tax:The break-up of deferred tax assets and liabilities into major components at the year end is as below.
(Rs. in million)
Particulars of timing difference Liabilities Assets
Depreciation 231.541 NIL(274.867) (NIL)
Impairment Loss — 56.812(—) (66.418)
Total 231.541 56.812(274.867) (66.418)
Net Deferred Tax Liability 174.729(208.449)

50
FinolexCables Limited
Notes forming part of the Accounts
Current Tax:
Provided in accordance with the provisions of the Income Tax Act 1961.
6. Sundry Creditors
A) Outstanding to creditors other than Micro, Small and Medium Enterprise Rs. 792.238 million (Interest Paid/Payable is Rs. Nil)
B) Outstanding to Micro, Small and Medium Enterprise : Rs. 0.260 million
The Company is in the process of compiling information from its suppliers regarding their status under Micro, Small andMedium Enterprise Development Act, 2006 and hence disclosure, if any, of the amounts unpaid as at the year end togetherwith the interest paid / payable as required has been given to the extent of information available.
Rs. million
a) Principal amount due 0.167
b) Interest paid under MSMED Act, 2006 Nil
c) Interest due 0.065
d) Interest accrued and due Nil
e) Interest due and payable till actual payment 0.065
7. Based on the review as on 1stApril, 2004 the Company has accounted for the impairment loss on the assets of “Optic Fibre”cash generating unit forming part of Communication Cable segment. Accordingly the impairment loss of Rs. 650.595 million andrelated deferred tax effect of Rs.121.877 million has been adjusted against the General Reserve in accordance with transitionalprovision of AS 28 as at 31st March, 2005. On review there is no indication of further increase or reversal in the impairment lossas at 31st March, 2008.
8. Investment in Joint Venture
1. The name of the joint venture company : Finolex J-Power Systems Private Limited
2. Ownership interest : 49%
3. Country of Incorporation : India
On 13th December, 2007, the Company entered into a joint venture agreement with J- Power Systems Corporation of Japan, tooffer complete turnkey solutions in extra high voltage (EHV) cable systems in India and abroad.
Accordingly, Rs. 0.049 million have been invested by way of share capital and Rs. 3.5 million have been paid in advance againstshare application money. Share Capital commitment at present is Rs. 192.451 million (net of the above)
9. Related Party Transactions: Disclosures as required by Accounting Standard 18 “Related Party Disclosures” are given below:
a) List of Related Parties :
Associate Companies Finolex Industries Limited
Finolex Proprietary Limited
Corrugated Box Industries (India) Private Limited
Plastro Plasson Industries (India) Limited
Finolex Infrastructure Limited
Joint Venture Finolex J-Power Systems Private Limited
b) Key management Personnel and Relatives
Key Management Personnel
1. Mr. P. P. Chhabria - Chairman
2. Mr. D. K. Chhabria - Managing Director
3. Mr. V. K. Chhabria - Deputy Managing Director
4. Mr. M. L. Jain - Asst. Managing Director and Chief Operating Officer
5. Mr. P. B. Parasnis - Asst. Managing Director and Chief Financial Officer.
Relatives
Mr. K. P. Chhabria - Brother of Mr. P.P. Chhabria, and Father ofMr. D. K. Chhabria and Mr. V. K. Chhabria

51
40thAnnual Report 2007-08
Notes forming part of the Accounts
c) Transactions with Related Parties -Major Parties
(Rs in million)
Nature of Transactions Associate Key ManagementCompanies/ Personnel and Relatives
Joint Venture
Sales, Services and Other Income
1 Sale of goodsFinolex Industries Limited 51.413 —
(8.998 ) (—)
Others 1.342 —(1.406 ) (—)
2 Sale of other materialFinolex Industries Limited 8.844 —
(1.305) (—)
3 RecoveriesFinolex Industries Limited 0.948 —
(0.360) (—)
4 Sale of LandFinolex Industries Limited 30.833
(—) (—)
5 Dividend ReceivedFinolex Industries Limited 120.578 —
(120.578) (—)
6 Reimbursement of Expenses ReceivedFinolex Industries limited 0.302 —
(0.656) (—)
Purchase of Material / Assets
1 Purchase of Raw Material andComponentsFinolex Industries Limited 25.809 —
(50.152) (—)
Others 0.041 —(—) (—)
2 Purchase of Fixed AssetsFinolex Industries Limited 0.347 —
(1.397) (—)
3 Purchase of InvestmentsFinolex J-Power Systems Private Limited 0.049 —
(—) (—)
Finolex Infrastructure Limited 0.250 —(—) (—)
Expenses
1 Managerial Remuneration — 90.010(—) (60.960)
2 ServicesFinolex Proprietary Limited 6.183 —
(5.604) (—)

52
FinolexCables Limited
Notes forming part of the Accounts
Nature of Transactions Associate Key ManagementCompanies/ Personnel and Relatives
Joint Venture
3 Rent
Corrugated Box Industries (India) 2.991 —Pvt. Limited (2.100) (—)
Mr. K.P. Chhabria — 0.528(—) (0.528)
4 Reimbursement of Expenses PaidFinolex Industries limited — —
(10.579) (—)
Finolex Proprietary Limited 0.498 —(0.511) (—)
5 Dividend Paid
Finolex Industries limited 31.062 —(26.624) (—)
Amount Outstanding1 Creditors
Finolex Industries Limited 4.808 —-(5.839) (—)
Others — —(0.088) (—)
2 Debtors
Finolex Industries Limited 25.495 —(4.126) (—)
Others 1.917 —(2.155) (—)
3 Loans and Advances and Deposits
Corrugated Box Industries (India) 0.925 —Pvt. Limited (2.275) (—)
Mr. K.P. Chhabria — 5.000(—) (5.000)
Finolex Infrastructure Limited 3.500 —(—) (—)
4 Finolex J-Power Systems private 3.500 —Limited – Share Application Money (—) (—)
5 Others
Refund of DepositCorrugated Box Industries (India) 1.350 —Pvt. Limited (1.050) (—)
Interest Receivable
Finolex Infrastructure Limited 0.032 —(—) (—)

53
40thAnnual Report 2007-08
Notes forming part of the Accounts
10 A. Quantitative information of derivative instruments outstanding as at the Balance Sheet date:
(Rs. in million)
Category Amount Amount
Year ended Year ended31.03.2008 31.03.2007
Foreign Exchange Forwards/ Options 9,214.000 —
Interest Rate Swaps 4,868.000 2,461.400
Currency Swaps 2,498.000 1,376.025
B. The Company has entered into derivative transactions with an objective to hedge the financial risks associated with itsbusiness viz. foreign exchange and interest rate.
C. The Company has not hedged the following foreign currency exposures :
(i) Borrowings grouped under secured loans equivalent to Rs. 999.250 Million (Previous year Rs. 1,476.875 million) andunder unsecured loans equivalent to Rs. 739.657 million. (Previous year Rs. 652.678 million)
(ii) Creditors for imports equivalent to Rs. 39.393 million (Previous year Rs. 45.691 million)
(iii) Receivables equivalent to Rs. 171.991 million. (Previous year Rs. 195.630 million)
D. Loss on Derivative / Forex transactions includes Rs. 92.000 million loss on certain outstanding derivatives at the BalanceSheet date assessed by the management based on the principle of prudence. In respect of other contracts, since they arein the nature of effective hedge, profit / loss, if any, has not been ascertained separtely.

54
FinolexCables Limited
Notes forming part of the Accounts
(Rs. in million)
2008 2007
11. Managerial Remuneration
a) Computation of Net Profit in accordance
with Sec.198 of the Companies Act 1956.
Profit as per Profit & Loss Account (Before Tax) 1,202.981 970.307
Add: Directors’ Remuneration 30.580 21.180
Directors’ Commission 60.780 40.580
Directors’ Sitting Fees 1.095 0.488
Depreciation 264.671 264.288
357.126 326.536
1,560.107 1,296.843
Less: Depreciation u/s 350 of the CompaniesAct, 1956 264.671 264.288
Profit on Sale of Assets (Net) 28.256 1.361
Profit / (Loss) on Sale of 86.665 15.826Investments (Net) 379.592 281.475
Profits available for Distribution 1,180.515 1,015.368
Commission as decided by the Board :
Chairman, Managing Director and
Deputy Managing Director 59.430 39.780
Non Whole-time Directors 1.350 0.800
60.780 40.580
b) Details of payments and provisions onaccount of remuneration to Chairman,Managing Director, Deputy Managing Director,Asst. Managing Directors and Non Whole-timeDirectors included in the Profit and Loss Account :
i) Salary 11.574 8.558
ii) Commission to:
Chairman, Managing Director &
Deputy Managing Director. 59.430 39.780
Non Whole-time Directors 1.350 0.800
60.780 40.580
iii) Contribution to Funds 4.627 2.333
iv) Other Perquisites 14.379 10.289
Note: Contribution to Gratuity Fund is made on global valuation and hence is not precisely ascertained.

55
40thAnnual Report 2007-08
Notes forming part of the Accounts
12. Capacities and Production
Class of Goods Unit Installed Production Installed ProductionCapacity (Net) Capacity 2006-200731.3.2008 2007-2008 31.3.2007
1 Electrical Cables TCKM 1,030.00 874.29 # 1,030.00 702.96 #
2 Telecommunication CablesOptic Fibre Cables KM 48,000.00 38,264.91 48,000.00 20,547.44
Other Telecommunication Cables TCKM 10,612.00 1,766.14 10,612.00 862.53
3 PVC Sheets and Accessories M T 2,100.00 1,617.24 2,100.00 1,570.05
4 Fibre KM 600,000.00 381,193.82 * 600,000.00 414,028.00 *
5 Cross Linked Polyethylene and other M T 2,500.00 — 2,500.00 —Compounds ( used for captive consumption)
6 Polycoated FRP Rod KM 1,500.00 — 1,500.00 —
7 Continuous Cast Copper Rods M T 60,000.00 24,642.11@ 60,000.00 16,653.79 @
Installed capacities are certified by the Managing Director and relied upon by the Auditors.
# Equivalent tonnage 27,757 MT (Previous Year 23,211 MT)
* Includes captive consumption of 456,982 Kms (Previous Year 170,762 Kms)
@ captive consumption of 16,898 MT( Previous Year 13,207 MT)
5,000 TCKM of Other Communication Cables Capacity is interchangeable with 332 TCKM of Electrical Cable capacity.
13. Stock & Turnover (Rs. in million)
Class of Goods Unit Opening Stock Closing Stock Turnover
Quantity Value Quantity Value Quantity # Value
1 Electrical Cables TCKM 49.63 514.482 70.12 684.298 853.81 9,339.225(84.01) (617.837) (49.63) (514.482) (737.34) (8,132.680)
2 Communication CablesOptic Fibre Cables KM 1,684.92 29.889 2920.81 50.155 37,029.00 979.849
(6,262.00) (79.664) (1,684.92) (29.889) (25,124.52) (552.020)
3 Other communication TCKM 188.08 114.283 114.25 98.864 1,839.98 2,092.177cables (227.46) (149.636) (188.08) (114.283) (901.91) (1,216.052)
4 PVC Sheets and MT 273.72 14.196 373.45 14.681 1,517.51 157.011Accessories (257.53) (16.266) (273.72) (14.196) (1,553.86) (148.896)
5 Fibre KM 251,375.04 110.091 88,360.00 32.443 544,209.00 ** 32.776(74,534.23) (37.932) (251,375.04) (110.091) (237,187.19) ** (26.732)
6 Continuous Cast MT 202.28 73.933 283.41 117.084 24,560.98 $ 2,869.468Copper Rod (614.91) (209.107) (202.28) (73.933) (17,066.42) $ (1,526.408)
7 Others *** 86.377 86.242 458.472(—) (86.377) (256.439)
8 Less - Excise Duty 2,091.311(1,529.016)
943.251 1,083.767 13,837.667
(1,110.442) (943.251) (10,330.211)
# Includes captive consumption** Includes captive consumption of 456,982 Kms (Previous Year 170,762 Kms.)$ Includes captive consumption of 16,898 MT (Previous Year 13,207 MT)*** Includes goods traded in Rs. 11.203 million (Previous Year Rs. 30.514 million.)
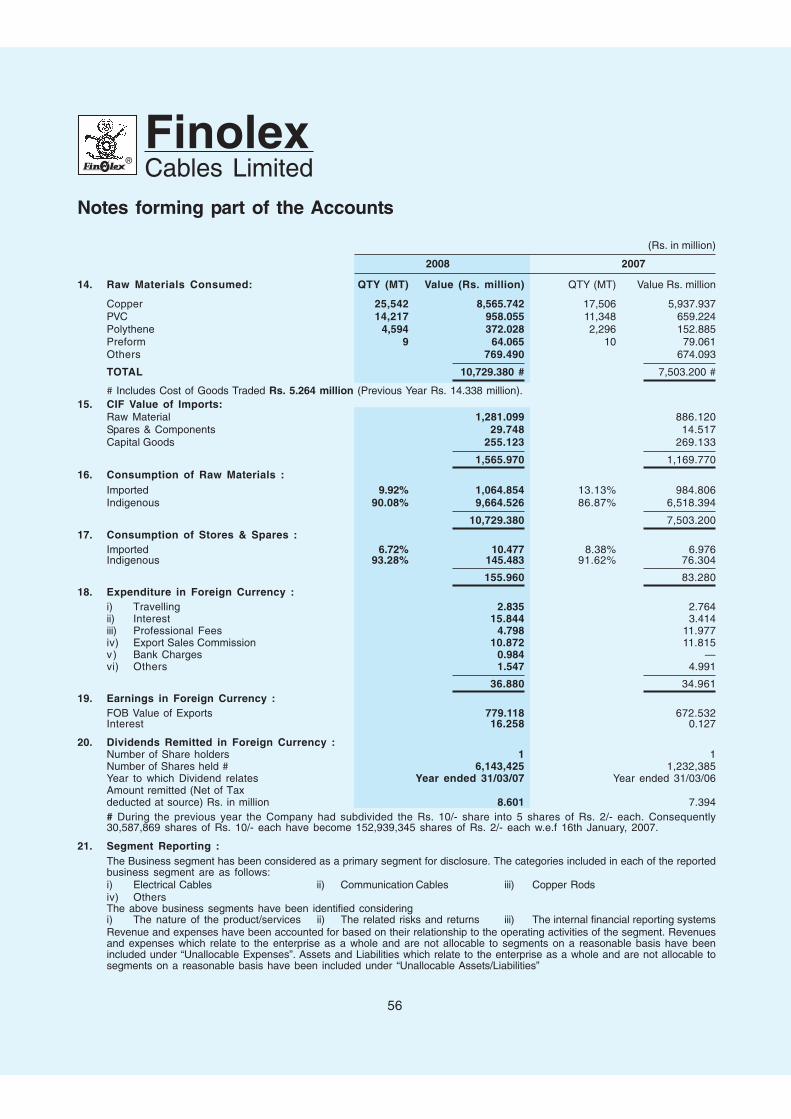
56
FinolexCables Limited
Notes forming part of the Accounts
(Rs. in million)
2008 2007
14. Raw Materials Consumed: QTY (MT) Value (Rs. million) QTY (MT) Value Rs. million
Copper 25,542 8,565.742 17,506 5,937.937PVC 14,217 958.055 11,348 659.224Polythene 4,594 372.028 2,296 152.885Preform 9 64.065 10 79.061Others 769.490 674.093
TOTAL 10,729.380 # 7,503.200 #
# Includes Cost of Goods Traded Rs. 5.264 million (Previous Year Rs. 14.338 million).15. CIF Value of Imports:
Raw Material 1,281.099 886.120Spares & Components 29.748 14.517Capital Goods 255.123 269.133
1,565.970 1,169.77016. Consumption of Raw Materials :
Imported 9.92% 1,064.854 13.13% 984.806Indigenous 90.08% 9,664.526 86.87% 6,518.394
10,729.380 7,503.20017. Consumption of Stores & Spares :
Imported 6.72% 10.477 8.38% 6.976Indigenous 93.28% 145.483 91.62% 76.304
155.960 83.28018. Expenditure in Foreign Currency :
i) Travelling 2.835 2.764ii) Interest 15.844 3.414iii) Professional Fees 4.798 11.977iv) Export Sales Commission 10.872 11.815v) Bank Charges 0.984 —vi) Others 1.547 4.991
36.880 34.96119. Earnings in Foreign Currency :
FOB Value of Exports 779.118 672.532Interest 16.258 0.127
20. Dividends Remitted in Foreign Currency :Number of Share holders 1 1Number of Shares held # 6,143,425 1,232,385Year to which Dividend relates Year ended 31/03/07 Year ended 31/03/06Amount remitted (Net of Taxdeducted at source) Rs. in million 8.601 7.394# During the previous year the Company had subdivided the Rs. 10/- share into 5 shares of Rs. 2/- each. Consequently30,587,869 shares of Rs. 10/- each have become 152,939,345 shares of Rs. 2/- each w.e.f 16th January, 2007.
21. Segment Reporting :The Business segment has been considered as a primary segment for disclosure. The categories included in each of the reportedbusiness segment are as follows:i) Electrical Cables ii) Communication Cables iii) Copper Rodsiv) OthersThe above business segments have been identified consideringi) The nature of the product/services ii) The related risks and returns iii) The internal financial reporting systemsRevenue and expenses have been accounted for based on their relationship to the operating activities of the segment. Revenuesand expenses which relate to the enterprise as a whole and are not allocable to segments on a reasonable basis have beenincluded under “Unallocable Expenses”. Assets and Liabilities which relate to the enterprise as a whole and are not allocable tosegments on a reasonable basis have been included under “Unallocable Assets/Liabilities”

57
40thAnnual Report 2007-08
Notes forming part of the Accounts
21. A ) Primary Segment Information for the year ended 31st March, 2008(Rs. in million)
Period Electrical Communication Copper Others Other than Elimination TotalCables Cables R o d Segments
REVENUE
External Current Year 9,570.828 3,103.368 2,920.449 334.333 - - 15,928.978Previous Year 8,268.172 1,820.579 1,529.669 240.807 - - 11,859.227
Inter - segment Current Year - - 5,709.013 - - (5,709.013) -(Net of Excise) Previous Year - - 4,677.626 - - (4,677.626) -
Less : Excise Duty Current Year 1,284.198 364.071 400.222 42.820 - - 2,091.311Previous Year 1,090.337 198.698 214.295 25.686 - - 1,529.016
Total Revenue Current Year 8,286.630 2,739.297 8,229.240 291.513 - (5,709.013) 13,837.667Previous Year 7,177.835 1,621.881 5,993.000 215.121 - (4,677.626) 10,330.211
RESULT
Segment Result Current Year 1,244.419 183.500 143.034 (55.738) - - 1,515.215Previous Year 1,081.357 29.624 79.767 23.413 - - 1,214.161
Other Unallocable Current Year - - - - (122.948) - (122.948)income net of Previous Year - - - - (95.867) - (95.867)expenditure
Less
Interest Expenses Current Year - - - - - - 189.286Previous Year - - - - - - 147.987
Profit before Current Year - - - - - - 1,202.981Taxation Previous Year - - - - - - 970.307
Less
Provision for Current Year - - - - - - 313.740Taxation Previous Year - - - - - - 280.377
Profit after Tax Current Year - - - - - - 889.241Previous Year - - - - - - 689.930
OTHER INFORMATION
Segment Assets Current Year 3,589.685 2,726.048 490.149 639.742 6,886.019 - 14,331.643Previous Year 2,513.391 2,555.959 421.249 553.693 6,461.955 - 12,506.247
Segment Liabilities Current Year 688.926 170.200 361.046 98.356 3,547.145 - 4,865.673Previous Year 350.225 131.305 300.278 101.403 2,960.544 - 3,843.755
Capital Expenditure Current Year 743.558 120.140 0.000 63.718 132.752 - 1,060.168Previous Year 710.773 23.545 0.649 134.456 13.892 - 883.315
Depreciation Current Year 65.913 147.934 19.205 25.735 5.884 - 264.671Previous Year 77.449 145.222 19.150 17.299 5.168 - 264.288
20. B) Secondary Segment Information (by Geographical Segment)(Rs. in million)
Particulars Year ended Year ended31.03.2008 31.03.2007
REVENUE (Net of Excise)Exports 790.415 682.149Domestic 13,047.252 9,648.062
Total 13,837.667 10,330.211
DebtorsExports 171.991 195.630Domestic 903.546 592.416
Total 1,075.537 788.046
Note :Assets of the Company except sundry debtors are not identified with the geographical segment as these are used interchangeably and arelocated in India.

58
FinolexCables Limited
Notes forming part of the Accounts
22. Disclosure as per Accounting Standard 15 (Revised 2005)
In view of the revised Accounting Standard on Employee Benefits AS15 (Revised 2005), additional charge of Rs. 6.371 million
upto 31st March 2007, has been adjusted against opening balance of revenue reserves in consonance with transitional
provisions of AS 15 (Revised 2005).
The following table sets out the status of the Gratuity Plan as required under AS 15 (Revised 2005).
Statement Showing changes in Present Value of obligations as on 31st March, 2008
(Rs. in million)
Present Value of obligations at the beginning of the Year 41.799
Interest Cost 3.147
Current Service Cost 3.454
Benefits Paid 3.670
Actuarial(gain)/Loss on obligations 4.382
P.V. of obligations as at end of the year 49.115
Table showing changes in the fair value of plan assets as on 31st March, 2008
Fair Value of plan Assets at the beginning of the year 43.235
Expected return on Plan assets 4.145
Contributions 5.507
Benefits Paid 3.670
Actuarial Gain/ (Loss) on Plan assets (0.525)
Fair value of plan Assets at the end of Year 48.692
Funded Status (0.422)
Actuarial Gain/Loss recognised as on 31st March, 2008
Actuarial gain/(Loss) for the year-obligation (4.382)
Actuarial gain/(Loss) for the year-plan assets (0.525)
Total(gain)/Loss For the year 4.013
Actuarial (gain)/Loss recognised in the year 4.013
Amounts to be recognised in the Balance Sheet as on 31st March, 2008
Present Value of obligations as at the end of the year 49.115
Fair value of plan assets as at the end of the year 48.692
Funded Status (0.422)
Net Asset/(Liability) recognised in balance sheet (0.422)
Expenses Recognised in statement of Profit & Loss Account
Current Service Cost 3.454
Interest Cost 3.147
Expected return on plan assets 4.045
Net Actuarial(gain)/Loss recognised in the year 4.907
Expenses recognised in statement of Profit & Loss 7.363

59
40thAnnual Report 2007-08
Notes forming part of the Accounts
Table showing fair value of plan assets as on 31st March, 2008
Fair Value of plan assets at beginning of the year 43.234
Actual return on plan assets 3.620
Contributions 5.507
Benefits Paid 3.669
Fair Value of plan assets at the end of the year 48.692
Funded Status (0.422)
Excess of actual over estimated return on Plan Assets (0.526)
Actuarial Assumptions:
Other than Copper Rod Division Rod Division
Discounted Rate 8% 8.25%
Salary Escalation 7 % 5.50%
23. Figures in respect of the previous year have been regrouped or rearranged wherever necessary to confirm to current year’sclassification.
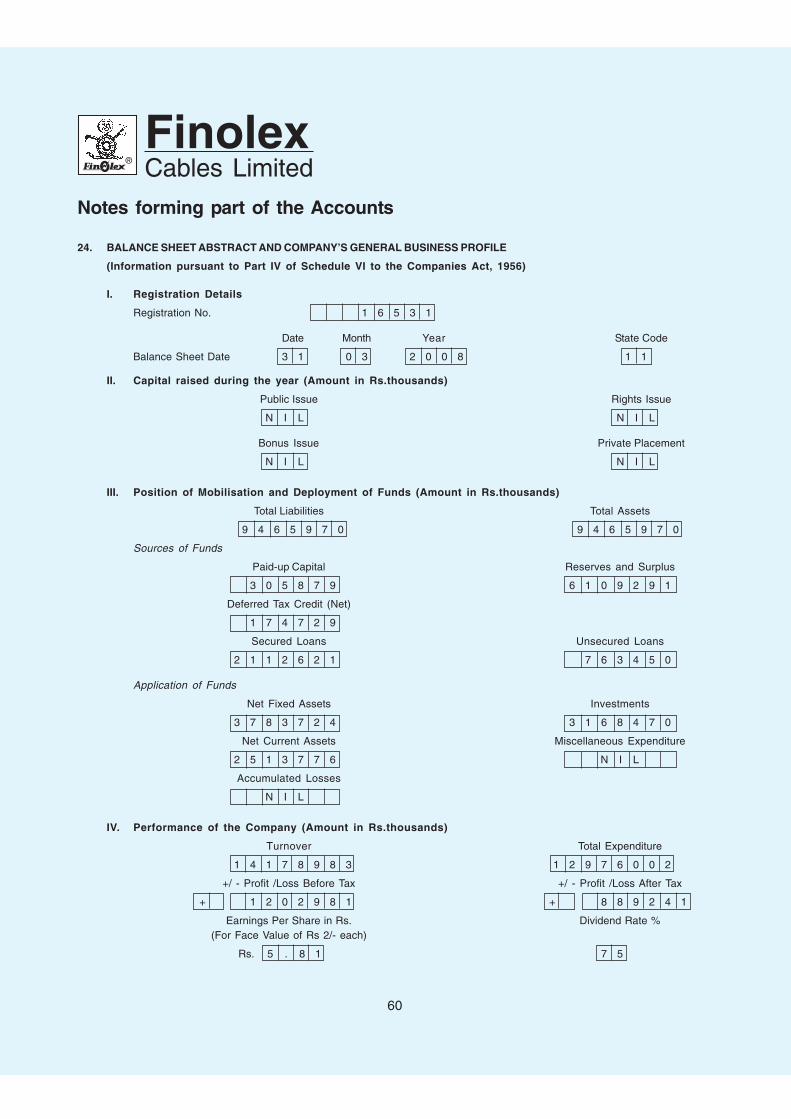
60
FinolexCables Limited
Notes forming part of the Accounts
24. BALANCE SHEET ABSTRACT AND COMPANY’S GENERAL BUSINESS PROFILE
(Information pursuant to Part IV of Schedule VI to the Companies Act, 1956)
I. Registration Details
Registration No. 1 6 5 3 1
Date Month Year State Code
Balance Sheet Date 3 1 0 3 2 0 0 8 1 1
II. Capital raised during the year (Amount in Rs.thousands)
Public Issue Rights Issue
N I L N I L
Bonus Issue Private Placement
N I L N I L
III. Position of Mobilisation and Deployment of Funds (Amount in Rs.thousands)
Total Liabilities Total Assets
9 4 6 5 9 7 0 9 4 6 5 9 7 0
Sources of Funds
Paid-up Capital Reserves and Surplus
3 0 5 8 7 9 6 1 0 9 2 9 1
Deferred Tax Credit (Net)
1 7 4 7 2 9
Secured Loans Unsecured Loans
2 1 1 2 6 2 1 7 6 3 4 5 0
Application of Funds
Net Fixed Assets Investments
3 7 8 3 7 2 4 3 1 6 8 4 7 0
Net Current Assets Miscellaneous Expenditure
2 5 1 3 7 7 6 N I L
Accumulated Losses
N I L
IV. Performance of the Company (Amount in Rs.thousands)
Turnover Total Expenditure
1 4 1 7 8 9 8 3 1 2 9 7 6 0 0 2
+/ - Profit /Loss Before Tax +/ - Profit /Loss After Tax
+ 1 2 0 2 9 8 1 + 8 8 9 2 4 1
Earnings Per Share in Rs. Dividend Rate %(For Face Value of Rs 2/- each)
Rs. 5 . 8 1 7 5

61
40thAnnual Report 2007-08
Notes forming part of the Accounts
V. Generic Names of Three Principal Products / Services of the Company
(As per Monetary Terms)
Item Code No. (ITC Code) Product Description
8 5 4 4 4 9 1 9 JELLY FILLED TELEPHONE CABLES
Item Code No. (ITC Code) Product Description
8 5 4 4 ELECTRICAL CABLES - LIGHT DUTY
Item Code No. (ITC Code) Product Description
8 5 4 4 ELECTRICAL CABLES - HEAVY DUTY
Item Code No. (ITC Code) Product Description
9 0 0 1 1 0 FIBRE OPTIC CABLE
Item Code No. (ITC Code) Product Description
8 5 4 4 2 0 CO- AXIAL CABLES
Item Code No. (ITC Code) Product Description
8 5 4 4 5 9 LAN CABLES
Item Code No. (ITC Code) Product Description
3 9 2 0 PVC SHEETS
Item Code No. (ITC Code) Product Description
7 4 0 7 . 1 0 CONTINUOUS CAST COPPER RODS
As per our report of even date
For B. K. KHARE & COMPANYChartered Accountants
U.B. Joshi R.G.D’SilvaPartner Company Secretary &Membership No. 44097 Vice President (Legal)
Pune: 28th April, 2008 Pune: 28th April, 2008
P.P. Chhabria D.K. ChhabriaChairman Managing DirectorDr. H.S. Vachha V.K. ChhabriaSanjay K. Asher Dy. Managing DirectorP.G. Pawar M.L. JainP.R. Rathi Asst. Managing Director andA.J. Engineer Chief Operating Officer
P.B. ParasnisAsst. Managing Director andChief Financial Officer

62
FinolexCables Limited
CORPORATE GOVERNANCE
1. COMPANY’S PHILOSOPHY ON CORPORATE GOVERNANCE :The Company’s philosophy on Corporate Governance envisages attainment of transparency, accountability and propriety in thetotal functioning of the Company and in the conduct of its business internally and externally, including its interactions withemployees, shareholders, deposit holders, creditors, consumers and institutional and other lenders.
The Company believes that its systems and actions must be dovetailed for enhancing the performance and shareholder value inthe long term.
The Company has adopted certain practices to achieve good corporate governance; the salient ones being fairness andtransparency in dealings, accountability for performance, effective management control by the Board, constitution of BoardCommittees as a part of internal control system, fair representation of professional, qualified, non-executive and independentDirectors on Board, adequate and timely disclosure of financial and other information and prompt discharge of statutoryobligations and duties. The Board has laid down a Code of Conduct for all Board members and senior management of theCompany. The Code of Conduct has been hosted on the website (http://www.finolex.com) of the Company.
2. BOARD OF DIRECTORS:2.1 Constitution of the Board :
• The composition of the Board of Directors with reference to number of Executive and Non-Executive Directors,meets the requirement of Code of Corporate Governance.
• Out of Thirteen Directors, there are three promoter executive Directors namely Mr. P.P. Chhabria, Chairman, Mr. D.K.Chhabria, Managing Director and Mr. V.K. Chhabria, Deputy Managing Director and two non-promoter executiveDirectors Mr. M.L. Jain, Assistant Managing Director and Chief Operating Officer and Mr. P.B. Parasnis, AssistantManaging Director and Chief Financial Officer.
• There are eight independent non-executive Directors, namely Dr. H.S. Vachha, Mr. B.G. Deshmukh, Mr. Atul C. Choksey,Mr. Sanjay K. Asher, Mr. P.G. Pawar, Mr. S.B. (Ravi) Pandit, Mr. P.R. Rathi and Mr. A. J. Engineer (appointed on 23rd
October 2007). Dr. N.A. Kalyani an independent non-executive Director resigned from the Board wef 9th February 2008for health reasons.
2.2 Meetings :
Board meetings are held at least four times during the year coinciding with the presentation of each quarterly result.During the last Financial Year four Board meetings were held i.e. on 10th May 2007, 20th July 2007, 23rd October 2007 and31st January 2008.
The meetings were attended as follows:
• Mr. P. P. Chhabria, Mr. D.K. Chhabria, Mr. V. K. Chhabria, Mr. M. L. Jain, Mr. P.B. Parasnis and Dr. H. S. Vachha attendedall the four meetings.
• Mr. B.G. Deshmukh, Mr. P.G. Pawar and Mr. P.R. Rathi attended three meetings.• Mr. Sanjay K. Asher, Mr. S.B. (Ravi) Pandit and Mr. A.J. Engineer (appointed w.e.f. 23rd October 2007) attended two
meetings.• Mr. A.C. Choksey attended one meeting and Dr. N.A. Kalyani, who resigned from the Board wef 9th February 2008 for
health reasons, did not attend any of the meetings.All Directors attended the last Annual General Meeting held on 29th June 2007 except for Mr. A.C. Choksey, Mr. S.B.(Ravi) Pandit and Dr. N. A. Kalyani.
2.3 Remuneration to Executive Directors:
(Amount in Rupees)
Particulars Chairman Managing Deputy Managing Asst. Managing Asst. ManagingDirector Director Director and Chief Director and Chief
Operating Officer Financial OfficerP.P.Chhabria D.K.Chhabria V.K.Chhabria M.L. Jain P.B. Parasnis
Salary and Allowances 3,300,000 3,300,000 1,890,000 1,661,000 1,423,000
Contribution to Provident 1,386,000 1,386,000 823,800 547,020 484,606& Superannuation Funds
Other perquisites 3,297,418 3,297,888 1,887,710 1,529,670 1,365,813
Commission / Incentive 23,100,000 23,100,000 13,230,000 1,500,000 1,500,000
Total 31,083,418 31,083,888 17,831,510 5,237,690 4,773,419

63
40thAnnual Report 2007-08
Notes:1) There is no scheme of ‘Employee Stock Options’ during the year.2) The above does not include contributions to group superannuation and gratuity funds as the contributions/benefits are on
a group basis.3) In all the cases, the service contract is for a period of five years from the date of appointment. Notice period / severance
fees applicable are 180 days for Mr. P.P. Chhabria, Mr. D.K. Chhabria and Mr. V.K. Chhabria and 90 days and 60 days incase of Mr. M.L. Jain and Mr. P.B. Parasnis respectively.
4) Performance criteria is a value judgement made by the Remuneration Committee which considers and recommendspayment of commission / incentive based on the performance of the Company and contemporary practices in Industry.The recommendations of the Committee are further considered by the Board and a collective decision taken withoutparticipation of interested Directors.
2.4 Remuneration to Non-Executive Directors:
Name of Non- Sitting Fees Commission Total Shareholdings (in Nos. of Shares) of Non-Executive Director (Rs.) (Rs.) (Rs.) Executive Directors in the Company
Dr. H.S. Vachha 195,000 150,000 345,000 —
Mr. B.G. Deshmukh 60,000 150,000 210,000 —
Mr. Atul C. Choksey 15,000 150,000 165,000 17,750
Mr. Sanjay K. Asher 300,000 150,000 450,000 12,395
Mr. P.G. Pawar 210,000 150,000 360,000 —
Dr. N. A. Kalyani — 150,000 150,000 —
Mr. S. B. (Ravi) Pandit 30,000 150,000 180,000 —
Mr. P.R. Rathi 255,000 150,000 405,000 —
Mr. A.J. Engineer 30,000 150,000 180,000 —
Total 1,095,000 1,350,000 2,445,000 30,145
(a) Sitting fees are uniform for meetings of the Board / Committee thereof and are paid to each Non-Executive Director for attendingBoard / Committee meetings.
(b) Commission not exceeding one percent of the net profits of the Company or Rupees Fifteen Lacs, which ever is less and as maybe determined by the Board each financial year is paid to non-executive Directors. Such commission has been shared equallyamongst such Directors. The sitting fees was approved by the shareholders at the Annual General Meeting held on 27th June 2006and payment of commission to non-executive Directors upto maximum of Rs.15 lacs was approved by the shareholders at theAnnual General Meeting held on 29th June 2007.
2.5 The details of other Directorships and Committee memberships:
No. of Company Directorships Committee Positions held
Public Companies Other Companies
Mr. P.P. Chhabria 03 18 02 (Chairman of two)
Dr. H.S. Vachha 04 01 05 (Chairman of three)Mr. B.G. Deshmukh 02 02 01 (Chairman of one)Mr. Atul C. Choksey 10 03 —Mr. Sanjay K. Asher 16* 19 08 (Chairman of three)Mr. P.G. Pawar 06 11 01Mr. D.K. Chhabria 01 08 —Mr. V.K. Chhabria — — —Mr. M.L. Jain — 01 —Mr. P.B. Parasnis 03 01 02Mr. S.B. (Ravi) Pandit 03 07 01Mr. P.R. Rathi 11 06 04Mr. A.J. Engineer 06 — 01 (Chairman of one)
* Alternate Directorship in one company

64
FinolexCables Limited
2.6 Information placed before the Board of Directors:
The information placed before the Board of Directors is as follows:
a) Annual operating plans and budgets, revisions and updates, if any.
b) Capital budgets with revisions and updates, if any.
c) Quarterly (including periodic) results of the Company and its operating divisions / business segments.
d) Minutes of meetings of Audit and other Committees of the Board.
e) The information on recruitment and remuneration of senior officers below the Board level, including appointment orcessation of office by Chief Financial Officer and Company Secretary.
f ) Show cause, demand and prosecution notices, which are materially important.
g) Fatal or serious accidents, dangerous occurrences, any material effluent or pollution problems.
h) Details of any joint venture or collaboration agreement.
i) Transactions that involve substantial payment towards goodwill, brand equity, or intellectual property.
j) Industrial relationship issues of material nature and proposed remedial actions. All significant developments in HumanResources / Industrial Relations.
k) Transactions of material nature of buying and selling of investments, or undertaking / assets, which are not in normalcourse of business.
l) Quarterly reports on foreign exchange exposure and the steps taken by the Management to manage the risks ofadverse exchange rate movement, if material.
m) Status on compliance with all regulatory, statutory and material contractual requirements.
n) Details of delegation of authorities to executives and Powers of Attorney issued.
3. AUDIT COMMITTEE:
The Audit Committee which was formed in February 1997, presently comprises of three independent non-executive Directors,namely Dr. H.S. Vachha (Chairman of the Committee), Mr. Sanjay K. Asher and Mr. P.R. Rathi (Alternate Chairman). Dr. N. A.Kalyani, resigned from the Board and consequently the Audit Committee with effect from 9th February 2008 for health reasons.
The brief terms of reference of the Audit Committee include -
1) Review of the Company’s financial reporting process and financial Statements,
2) Review of accounting and financial policies and practices,
3) Review of internal control and internal audit systems,
4) Discussion with Internal Auditors and Statutory Auditors on any significant findings and follow-up thereon,
5) Reviewing the Company’s financial and risk management policies,
6) To investigate any activity within its terms of reference,
7) To seek information from any employee,
8) To obtain outside legal or other professional advice,
9) To secure attendance of outsiders with relevant expertise, if it considers necessary,
10) Oversight of the Company’s financial reporting process and the disclosure of its financial information to ensure that thefinancial statement is correct, sufficient and credible,
11) Recommending to the Board, the appointment, re-appointment and, if required, the replacement or removal of the statutoryauditor and the fixation of audit fees,
12) Approval of payment to statutory auditors for any other services rendered by the statutory auditors,
13) Reviewing, with the management, the annual financial statements before submission to the board for approval, withparticular reference to:
a) Matters required to be included in the Directors’ Responsibility Statement to be included in the Board’s report in termsof clause (2AA) of section 217 of the Companies Act, 1956,
b) Changes, if any, in accounting polices and practices and reasons for the same,
c) Major accounting entries involving estimates based on the exercise of judgment by management,
d) Significant adjustments made in the financial statements arising out of audit findings,
e) Compliance with listing and other legal requirements relating to financial statements,

65
40thAnnual Report 2007-08
f ) Disclosure of any related party transactions,
g) Qualifications, if any, in the draft audit report,
14) Reviewing, with the management, the quarterly financial statements before submission to the Board for approval,
15) Reviewing, with the management, performance of statutory and internal auditors, adequacy of the internal controlsystems,
16) Reviewing the adequacy of internal audit function, if any, including the structure of the internal audit department, staffingand seniority of the official heading the department, reporting structure coverage and frequency of internal audit,
17) Discussion with internal auditors any significant findings and follow up there on,
18) Reviewing the findings of any internal investigations by the internal auditors into matters where there is suspected fraudor irregularity or a failure of internal control systems of a material nature and reporting the matter to the Board,
19) Discussion with statutory auditors before the audit commences, about the nature and scope of audit as well as post-auditdiscussion to ascertain any area of concern,
20) To look into the reasons for substantial defaults, if any, in the payment to the depositors, debenture holders, shareholders(in case of non payment of declared dividends) and creditors,
21) The Audit Committee shall mandatorily review the following information:
a) Management discussion and analysis of financial condition and results of operations,
b) Statement of significant related party transactions (as defined by the audit committee),
c) Management letters / letters of internal control weaknesses issued by the statutory auditors,
d) Internal audit reports relating to internal control weaknesses, and
e) The appointment, removal and terms of remuneration of the Chief internal auditor.
The Committee has met nine times during the financial year ended 31st March 2008, as against the minimum requirement of fourmeetings i.e. on 21st April 2007, 10th May 2007, 20th July 2007, 30th August 2007, 18th September 2007, 23rd October 2007, 18th
December 2007, 31st January 2008 and 26th February 2008. Dr. H.S. Vachha attended all the meetings, Mr. Sanjay K. Asher attendedseven meetings, Mr. P.R. Rathi (appointed on 10th May 2007) attended six meetings and Dr. N.A. Kalyani who resigned from the Boardand consequently from the Audit Committee with effect from 9th February 2008 for reasons of health did not attend any of themeetings. The date of the meeting of the Committee held for considering finalisation of accounts for the year ended 31st March 2008was 28th April 2008.
4. REMUNERATION COMMITTEE:
In view of the importance given by the Company to good corporate governance and though it is a non-mandatory requirement,a Remuneration Committee was constituted by the Board of Directors at its meeting held on21st October 2000.
The Remuneration Committee has been set up to determine on behalf of the Board and on behalf of the shareholders withagreed terms of reference, the Company’s policy on specific remuneration packages for Executive Directors including pensionrights and any compensation payment.
The Committee comprises four independent and non-executive Directors namely Mr. B.G. Deshmukh (Chairman of the Committee),Mr. Sanjay K. Asher, Mr. P.G. Pawar. and Mr. P.R. Rathi.
The Committee has met on 10th May 2007 and 31st January 2008 during the financial year ended 31st March 2008. Mr. Sanjay K.Asher and Mr. P.G. Pawar attended all the meetings and Mr. B.G. Deshmukh attended the meeting held on 10th May 2007.
5. SHAREHOLDERS’ COMMITTEE:
The Share Transfer Cum Investors’ Grievances Committee presently comprises of three Executive Directors (namely Mr. P.P.Chhabria, Mr. D.K. Chhabria and Mr. M.L. Jain) and three independent, non-executive Directors (namely Mr. P.G. Pawar, Mr.Sanjay K. Asher and Mr. P.R. Rathi). Mr. P.G. Pawar an independent and non-executive Director is the Chairman of theCommittee. The Board has designated Mr. R.G.D’Silva, Company Secretary as the Compliance Officer.
The Committee in addition to considering share transfer matters, oversees redressal of shareholder and investors’ complaints/ grievances and recommends measures to improve the level of investor services.
The Committee normally meets about once in a month as required, and there were nine meetings during the year.
The total number of complaints received and replied to the satisfaction of shareholders during the year were four and nocomplaint was outstanding as on 31st March 2008.
There was no share transfer request pending as on 31st March 2008.

66
FinolexCables Limited
6. GENERAL BODY MEETINGS:
Location and time for last three Annual General Meetings:
Year Location Date Time Whether any special resolutionpassed therein
2004-05 Acharya Atre Rangmandir 5st July, 2005 11.30 a.m. NoSant TukaramnagarPimpri, Pune – 411 018
2005-06 Acharya Atre Rangmandir 27th June, 2006 11.30 a.m. YesSant TukaramnagarPimpri, Pune – 411 018
2006-07 Acharya Atre Rangmandir 29th June, 2007 11.30 a.m. YesSant TukaramnagarPimpri, Pune – 411 018
(a) No special resolution was passed through postal ballot last year and no such resolution is proposed to be passed by postalballot this year.
7. DISCLOSURES:
(a) Disclosure regarding materially significant related party transactions:
For details please refer Schedule 15 (Note No. 9) of Notes forming part of the Accounts.
(b) There were no instances of non-compliance or penalty, strictures imposed on the Company by Stock Exchanges or SEBI or anyStatutory Authority on any matter related to capital markets, during the last three years.
(c) The Company has complied with the mandatory requirements of corporate governance Clause 49 of the Listing Agreementswith the Stock Exchanges.
(d) The non-mandatory requirements have not been adopted as a formal policy except for Remuneration Committee as set out initem 4 above.
8. MEANS OF COMMUNICATIONS:
The quarterly results of the Company are published in leading national newspapers viz., normally Financial Express (alleditions) / Economic Times (Mumbai edition) and Sakal (Pune edition) and also displayed on the corporate website (http://www.finolex.com) along with official news releases. The corporate presentation prepared by the Company was uploaded onits website and was also informed to the Stock Exchanges for taking the same on record.
Management provides detailed analysis of Company’s operations, which forms a part of the Annual Report.
9. SHAREHOLDER INFORMATION:
The Annual report includes Financial Statements, key financial data and detailed information in the Shareholders’ informationsection.
10. CODE OF CONDUCT:
THE Board has laid down a code of conduct for all Board members and senior management of the Company. The Code ofConduct has been hosted on the website (http://www.finolex.com) of the Company.
Declaration:
All Board members and senior management personnel have affirmed compliance with the Code of Conduct of the Company in the yearunder report.
Sd/-Place : Pune D. K. ChhabriaDate : 28th April 2008 Managing Director

67
40thAnnual Report 2007-08
Auditors’ Certificate on Corporate Governance
To the Members of
FINOLEX CABLES LIMITED
We have examined the compliance of conditions of corporate governance by Finolex Cables Limited (the Company) for the yearended on 31st March 2008 as stipulated in clause 49 of the Listing Agreement of the Company with the stock exchanges.
The compliance of conditions of corporate governance is the responsibility of the management. Our examination was limited toprocedures and implementation thereof, adopted by the Company for ensuring the compliance of the conditions of the CorporateGovernance. It is neither an audit nor an expression of opinion on the financial statements of the Company.
In our opinion and to the best of our information and according to the explanations given to us we certify that the Company hascomplied with the conditions of Corporate Governance as stipulated in the above mentioned Listing Agreements.
We state that such compliance is neither an assurance as to the future viability of the Company nor the efficiency or effectivenesswith which the management has conducted the affairs of the Company.
For and on behalf ofB. K. KHARE & CO.
Chartered AccountantsSd/-
U. B. JoshiPartner
Place : Pune Membership No. 44097Date : 28th April, 2008
Shareholder InformationRegistered Office
Finolex Cables Limited, 26/27 Mumbai - Pune Road, Pimpri, Pune 411018.
Annual General Meeting
The Fortieth Annual General Meeting (“AGM”) of the Company will be held on Wednesday, 30th July, 2008 at 11.30 a.m. at Acharya AtreRangmandir, Sant Tukaramnagar, Pimpri, Pune – 411 018.
Financial Calendar (Tentative) :
(a) Annual General Meeting : 30th July 2008(b) Results for quarter ending 30th June, 2008 : Last week of July 2008(c) Results for quarter ending 30th September, 2008 : Last week of October 2008(d) Results for quarter ending 31st December, 2008 : Last week of January 2009(e) Results for quarter ending 31st March, 2009 : Last week of April 2009
Dates of Book Closure
The Company’s Transfer Books will be closed from Saturday, 19th July 2008 to Wednesday, 30th July 2008 (both days inclusive) forpurpose of AGM and for payment of Dividend for the year ended 31st March 2008.
Dividend Payment
The Board of Directors of the Company at its meeting held on 28th April 2008 recommended payment of Dividend @ 75 % (i.e.Rs.1.50 per share) for the year ended 31st March, 2008. The payment of dividend is to be approved by the shareholders at theAGM and as on date is exempt from income - tax in the hands of the shareholders. The aforesaid Dividend, if declared at theAGM, will be paid on or before 28th August 2008 to those members whose names appear in the Register of Members as on thedate of the AGM. In respect of shares held in electronic form, the dividend will be paid on the basis of beneficial ownership asper details to be received from the Depositories i.e. National Securities Depository Limited (NSDL) and Central Depository Services(India) Limited (CDSL) for this purpose, the same being as of close of their respective hours of business on the date immediatelypreceding the aforesaid Book Closure period (ie as of 18th July, 2008).
Stock Exchange Listing
The Company’s shares are presently listed on the Stock Exchanges at Ahmedabad, Bangalore, Chennai, Cochin, Delhi, Kolkata,
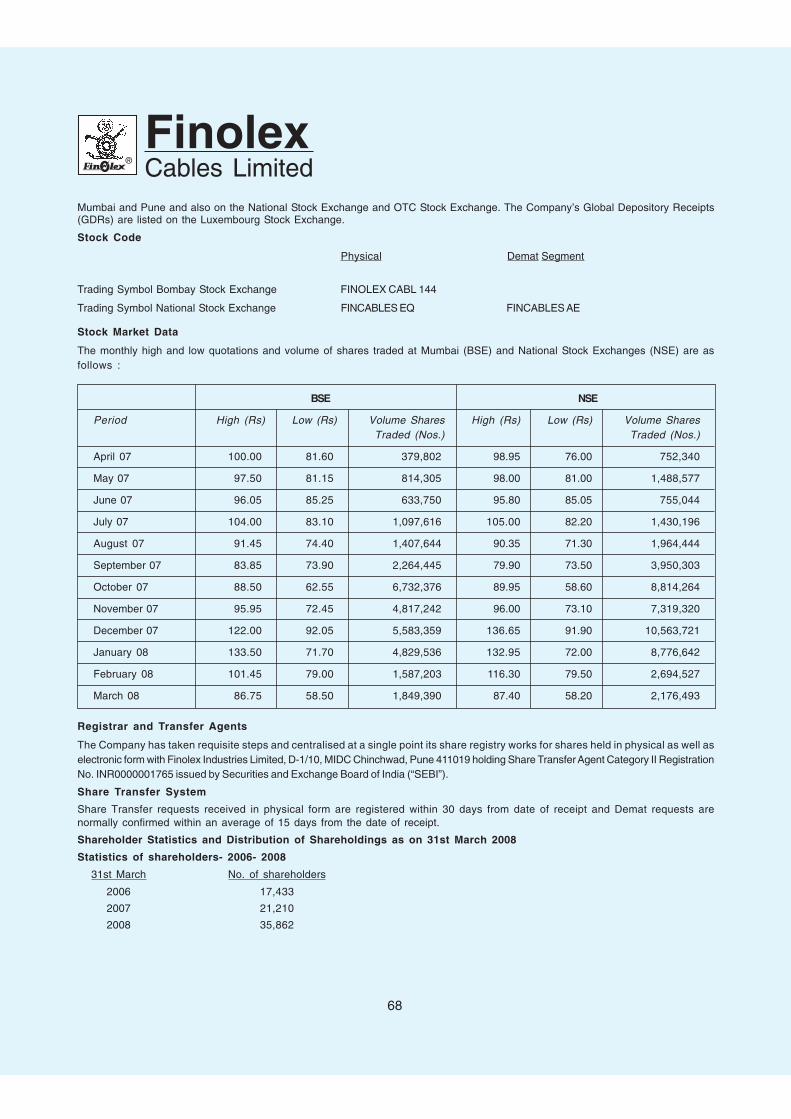
68
FinolexCables Limited
Mumbai and Pune and also on the National Stock Exchange and OTC Stock Exchange. The Company’s Global Depository Receipts(GDRs) are listed on the Luxembourg Stock Exchange.
Stock Code
Physical Demat Segment
Trading Symbol Bombay Stock Exchange FINOLEX CABL 144
Trading Symbol National Stock Exchange FINCABLES EQ FINCABLES AE
Stock Market Data
The monthly high and low quotations and volume of shares traded at Mumbai (BSE) and National Stock Exchanges (NSE) are asfollows :
BSE NSE
Period High (Rs) Low (Rs) Volume Shares High (Rs) Low (Rs) Volume SharesTraded (Nos.) Traded (Nos.)
April 07 100.00 81.60 379,802 98.95 76.00 752,340
May 07 97.50 81.15 814,305 98.00 81.00 1,488,577
June 07 96.05 85.25 633,750 95.80 85.05 755,044
July 07 104.00 83.10 1,097,616 105.00 82.20 1,430,196
August 07 91.45 74.40 1,407,644 90.35 71.30 1,964,444
September 07 83.85 73.90 2,264,445 79.90 73.50 3,950,303
October 07 88.50 62.55 6,732,376 89.95 58.60 8,814,264
November 07 95.95 72.45 4,817,242 96.00 73.10 7,319,320
December 07 122.00 92.05 5,583,359 136.65 91.90 10,563,721
January 08 133.50 71.70 4,829,536 132.95 72.00 8,776,642
February 08 101.45 79.00 1,587,203 116.30 79.50 2,694,527
March 08 86.75 58.50 1,849,390 87.40 58.20 2,176,493
Registrar and Transfer Agents
The Company has taken requisite steps and centralised at a single point its share registry works for shares held in physical as well aselectronic form with Finolex Industries Limited, D-1/10, MIDC Chinchwad, Pune 411019 holding Share Transfer Agent Category II RegistrationNo. INR0000001765 issued by Securities and Exchange Board of India (“SEBI”).
Share Transfer System
Share Transfer requests received in physical form are registered within 30 days from date of receipt and Demat requests arenormally confirmed within an average of 15 days from the date of receipt.
Shareholder Statistics and Distribution of Shareholdings as on 31st March 2008
Statistics of shareholders- 2006- 2008
31st March No. of shareholders
2006 17,433
2007 21,210
2008 35,862

69
40thAnnual Report 2007-08
Distribution of Shareholding as on 31st March 2008
Category No. of Shares Held Percentage ofShareholding
A Promoter’s holding1 Promoters
- Indian Promoters 50,604,919 33.09- Foreign Promoters NIL NIL
2 Persons acting in Concert NIL NIL
Sub total 50,604,919 33.09
B Non-Promoters holding3 Institutional Investors
a Mutual Funds and UTI 12,178,776 7.96b Banks, Financial Institutions, Insurance 15,204,395 9.94
Companies (Central / State Govt. Institutions/ Non-Government Institutions)
c FIIs 5,145,467 3.37
Sub total 32,528,638 21.27
4 OTHERSa Private Corporate bodies* 26,205,333 17.14b Indian Public 36,923,863 24.14c NRIs / OCBs 533,167 0.34d Any others (Custodian for GDRs) 6,143,425 4.02
Sub total 69,805,788 45.64
Grand Total 152,939,345 100.00
* Includes 22,187,075 shares (14.51%) held by Associate Company – Finolex Industries Limited.
Dematerialisation of shares
The Company’s equity shares are included in the list of Companies whose scrips have been mandated by SEBI for settlement only indematerialised form by all institutions and all investors. The Company had signed agreements with National Securities Depository Limited(NSDL) and Central Depository Services (India) Limited (CDSL) to offer depository services to its shareholders. As on 31st March 200894.06 % of the equity share capital of the Company has been dematerialised.
Outstanding GDRs / DRs / Warrants, etc
There are no outstanding GDRs / ADRs / Warrants or any convertible instruments as on 31st March 2008.
Plant Locations
Pimpri (Electrical Cables) Urse26/27, Mumbai-Pune Road (Electrical & Communication Cables)Pimpri, Pune 411 018 Taluka Maval, Dist. Pune 410 506Telephone : 27475963 (15 lines) Telephone (02114) 237026/27Facsimile : (020) 27472239 / 27472224 Facsimile (02114) 237025Email : [email protected] Email : [email protected]
Goa (Electrical & Communication Cables) Goa (Communication Cables)Plot No 117/L118 Plot No. L123/9A, Verna Industrial EstateVerna Industrial Estate Verna Salcette, South GoaVerna Salcette Telephone : (0832) 2782002/3/4South Goa, GOA Facsimile : (0832) 2783909Telephone : (0832) 2782002/3/4 Email : [email protected] : (0832) 2783909Email : [email protected]

70
FinolexCables Limited
Goa (CCC Rod) Sheets DivisionPlot No S263/2 Gat No 399Panjim-Belgaum Road Village UrseUsgaon-Tisk, Ponda Taluka MavalGoa – 403406 Dist. Pune 410 506Telephone : (0832) 2344378/9 Telephone : (02114) 237035/36Facsimile : (0832) 2344140 Facsimile : (02114) 237042Email : [email protected] Email : [email protected]
Optic Fibre Division Lighting Division (CFL)Urse Plot No.399, Village – Urse,Taluka Maval Tal – Maval,Dist Pune – 410 506 Dist – Pune – 410 506Telephone : (02114) 237003/4/5/6/7 Telephone : (02114) 237035, 237036Facsimile : (02114) 237009 Facsimile : (02114) 237041Email : [email protected] Email : [email protected]
Switches Division RoorkeeGat No.344, Village Urse, Plot Nos. K-1 & K-2 AIS Industrial EstateTaluka Maval Latherdeva Hoond, Mangalaur, RoorkeeDistrict Pune – 410 506 Taluka Haridwar, Uttarakhand - 247667Telephone : (02114) 237021/2/3 Telephone : (01332) 224069Facsimile : (02114) 237006 Telefax : (01332) 224068Email : [email protected] Email : [email protected]
Investor Correspondence
The Company’s Share Department provides assistance to shareholders under the supervision of Mr. R.G D’Silva, Company Secretary& Vice President (Legal).
Any query relating to shares and requests for transactions such as transfers, transmissions and nomination facilities, duplicateshare certificates, change of address, non-receipt of dividends / Annual Report, as also regarding dematerialisation of shares mayplease be taken up with :
Mr. R. G. D’SilvaCompany Secretary & Vice President (Legal)Finolex Cables Limited26/27 Mumbai - Pune Road,Pimpri, Pune 411 018Telephone : (020) 27475963 Extn.279 / 230Facsimile : (020) 27472239 / 27470260Email : [email protected]
Shareholder information On-line
The Balance Sheet information is a part of the Company’s World Wide Web home page http://www.finolex.com. Users can obtaininformation on Company products and services, Company background, Management and financial information and other majordevelopments.
Nomination Facility
Individual shareholders can now avail of the facility of nomination. The nominee shall be the person in whom all rights of transfer and/or amount payable in respect of the shares shall vest in the event of the death of shareholder(s). A minor also can be a nomineeprovided the name of the guardian is given in the Nomination Form. The facility of nomination is not available to non-individualshareholders such as bodies corporate, financial institutions, Kartas of Hindu Undivided Families and holders of Power of Attorney.In case of any assistance, please contact Mr. R.G. D’Silva, Company Secretary & Vice President (Legal) at the Registered Office ofthe Company.