Finite Strain and Their Relation to Tectonic Deformation Byusing Normalized Fry Method in Ber Bahr...
18
AARJMD VOLUME 2 ISSUE 3 (AUGUST 2015) ISSN : 2319 - 2801 Asian Academic Research Journal of Multidisciplinary www.asianacademicresearch.org 272 A Peer Reviewed International Journal of Asian Academic Research Associates AARJMD ASIAN ACADEMIC RESEARCH JOURNAL OF MULTIDISCIPLINARY FINITE STRAIN AND THEIR RELATION TO TECTONIC DEFORMATION BY USING NORMALIZED FRY METHOD IN BER BAHR ANTICLINE NORTH OF MOSUL CITY –IRAQ AHMED A. H. AL-MOADHEN 1 ; MUSTAFA R. S. AL-OBAIDI 2 1 Department of Geology, College of Science, University of Baghdad 2 Department of Geology, College of Science, University of Baghdad Abstract Iraq is one of the countries that are exposed to tectonic activity due to its location. Zagros- Tours belt is located in the collision area between the Arabian plate and Iranian- Turkish plates. For the first time in the High Folded Zone- North of Iraq, the principal strain axes has been analyzed and this related to tectonic deformation of beds. This zone is one of the most important tectonic zone in Iraq. Different strained beds are present in this zone; Sandstone and limestone beds being the dominant type in the N and NE of Iraq. These beds in the study area are deformed and contain many faults and folds The calculated axial ratios (three dimensional orientations of the strain axes) of strained beds are shown which is equivalent to the log Flinn diagram normally used for plotting strain ellipsoids and according to the stereographic projection method, the long axes of these ellipsoid are sub parallel to measured fold axes and the short axes are approximately perpendicular to the axial planes of folds in the area. The compensation of strain data (axial ratio layer parallel shortening) between the study area and other areas has been done. These orientation of these axes is related to the movement of the Arabian plate. Keywords: Structural geology, Strain analysis, Fry Method, Ber Bahr Anticline, Iraq.
-
Upload
ahmed-abbas-hasan -
Category
Documents
-
view
8 -
download
0
description
AbstractIraq is one of the countries that are exposed to tectonic activity due to its location. Zagros-Tours belt is located in the collision area between the Arabian plate and Iranian- Turkishplates. For the first time in the High Folded Zone- North of Iraq, the principal strain axes hasbeen analyzed and this related to tectonic deformation of beds. This zone is one of the mostimportant tectonic zone in Iraq. Different strained beds are present in this zone; Sandstoneand limestone beds being the dominant type in the N and NE of Iraq. These beds in the studyarea are deformed and contain many faults and folds The calculated axial ratios (threedimensional orientations of the strain axes) of strained beds are shown which is equivalent tothe log Flinn diagram normally used for plotting strain ellipsoids and according to thestereographic projection method, the long axes of these ellipsoid are sub parallel tomeasured fold axes and the short axes are approximately perpendicular to the axial planesof folds in the area. The compensation of strain data (axial ratio layer parallelshortening) between the study area and other areas has been done. These orientation of theseaxes is related to the movement of the Arabian plate.Keywords: Structural geology, Strain analysis, Fry Method, Ber Bahr Anticline, Iraq.
Transcript of Finite Strain and Their Relation to Tectonic Deformation Byusing Normalized Fry Method in Ber Bahr...

AARJMD VOLUME 2 ISSUE 3 (AUGUST 2015) ISSN : 2319 - 2801
Asian Academic Research Journal of Multidisciplinary
www.asianacademicresearch.org
272
A Peer Reviewed International Journal of Asian
Academic Research Associates
AARJMD
ASIAN ACADEMIC RESEARCH
JOURNAL OF MULTIDISCIPLINARY
FINITE STRAIN AND THEIR RELATION TO TECTONIC DEFORMATION BY
USING NORMALIZED FRY METHOD IN BER BAHR ANTICLINE NORTH OF
MOSUL CITY –IRAQ
AHMED A. H. AL-MOADHEN1; MUSTAFA R. S. AL-OBAIDI
2
1Department of Geology, College of Science, University of Baghdad
2Department of Geology, College of Science, University of Baghdad
Abstract
Iraq is one of the countries that are exposed to tectonic activity due to its location. Zagros-
Tours belt is located in the collision area between the Arabian plate and Iranian- Turkish
plates. For the first time in the High Folded Zone- North of Iraq, the principal strain axes has
been analyzed and this related to tectonic deformation of beds. This zone is one of the most
important tectonic zone in Iraq. Different strained beds are present in this zone; Sandstone
and limestone beds being the dominant type in the N and NE of Iraq. These beds in the study
area are deformed and contain many faults and folds The calculated axial ratios (three
dimensional orientations of the strain axes) of strained beds are shown which is equivalent to
the log Flinn diagram normally used for plotting strain ellipsoids and according to the
stereographic projection method, the long axes of these ellipsoid are sub parallel to
measured fold axes and the short axes are approximately perpendicular to the axial planes
of folds in the area. The compensation of strain data (axial ratio layer parallel
shortening) between the study area and other areas has been done. These orientation of these
axes is related to the movement of the Arabian plate.
Keywords: Structural geology, Strain analysis, Fry Method, Ber Bahr Anticline, Iraq.

AARJMD VOLUME 2 ISSUE 3 (AUGUST 2015) ISSN : 2319 - 2801
Asian Academic Research Journal of Multidisciplinary
www.asianacademicresearch.org
273
1-2 Introduction
Folded strata must always have an heterogeneous strain state through the structure ( Ramsy
& Huber 1987) at any locality where the bedding has a constant orientation the strain may
be homogenouses , but the different lithologies are likely to have different strain. Under
this assumption the Fry method is one of the best methods for the analysis of deformed
ellipsoids. This method is based on the assumption that the initially uniform anticlustered
distribution distribution of points will change after deformation into a non-uniform
distribution.
Finite strain data can provide important information about the structure of a deformed
terrane, such as strain intensity gradients or distribution of strain in high folded zone in the
north part of Iraq. Many methods of finite strain determination exist, and are based either
on grain-location analysis (Fry, 1979; Erslev, 1988) or on grain-shape analysis (Rf/ɸ)
method of Ramsay (1967) and Dunnet (1969); Panozzo methods (Panozzo, 1983, 1984);
Feret diameters method of Lapique et al. (1988). These methods require different
parameters to characterize the shape or location of the quartz grains or other strain markers
(coordinates of the centers of mass, lengths of major and minor axes and their orientations,
or location of whole boundaries of grains). In fact, all of these parameters can be computed
from the whole boundary of a grain, if it is assumed to be an ellipse. This paper deals with
computation of the finite strain using the Normalized Fry method from thin sections of
sandstone of the Ber Bahr Anticline - North of Iraq.
The Ber Bahr anticline (Zawita anticline) located in the northern part of Iraq, it lies within
Dohuk Governorate, its covering an area of 195 square kilometers and the geographic
coordinates of the study area as follows : Northing 36°50´ – 36°58´ and Easting 42° 57´-
43°14´ (Figure 1).
1-3 Geological Setting
The exposed geological formations in study area range in age from Cretaceous to
Quaternary, these formations are Bekhmah , Shiranish, Kolosh, Khurmala, Gercus, Pila
spi, Avanah, Fatha and Injanah (Figure 2).
According to the tectonic map (Buday and Jassim,1984 ) (Jassim and Goff, 2006), study
area is located within the Unstable Shelf , represented by the High Folded (Figure 1). Ber
Bahr anticline is the continuation of Shaik Adi Anticline towards west. It has abnormal
trend, bence began with E-W direction, then swings to ENE-WSW and again to E-W. It
probably joins with Aqra Anticline, but because the probable area is built up by Pilaspi
Formation which is highly deformed, therefore it is difficult to decide whether the two
anticlines join, each other or not. The southern limb is steeper than the northern one, with
exposed Bekhme Formation in the core. The northwestern plunge is inundated by Dohuk
lake (Sisakian,1995).
Between Ber Bahr and Swara Tika Anticlines there is long, narrow and deep syncline, in
its trough even the Mukdadiyah Formation is preserved. The axis of the syncline is

AARJMD VOLUME 2 ISSUE 3 (AUGUST 2015) ISSN : 2319 - 2801
Asian Academic Research Journal of Multidisciplinary
www.asianacademicresearch.org
274
truncated by thrust fault with E-W direction and has brought the Pilaspi Formation in
contact with Injana and Mukdadiyah Formations. The thrust fault is truncated by small
fault of NE-SW trend, the displacement is about 200-300m (Sisakian,1995).
Figure 1 : Tectonic map of Iraq (after Buday and
Jassim1984).
Figure 2: Geologic map of study area (Sisakian,1995).
AARJMD VOLUME 2 ISSUE 3 (AUGUST 2015) ISSN : 2319 - 2801
Asian Academic Research Journal of Multidisciplinary
www.asianacademicresearch.org
275
1-4 Methodology
Strain analysis quantifies strain magnitude and/or orientation of distortion in rocks between
microscopic to regional scales. The basis of strain-measurement techniques involves
measuring strain markers to obtain principle strain axes orientations and axial ratios. In
case strain markers are passive, which means they have similar rheological properties as
the host rock and deform in the same manner as the whole rock, then the total strain in the
sample can be characterized. Non-passive strain markers have rheological properties which
are contrast those of the host rock, and thus provide only a minimum estimate of total bulk
strain (Bannister,2004).
1-4-1 Normalized Fry method:
Fry method is the fastest and visually more considered the most attractive method for
finding two-dimensional strain and was developed by Norman Fry at the end of the 1970s
(Fossen, 2010). This method of strain analysis is a type of center-to-center method, it uses
the distances between grain centers as a basis for measuring strain. Specifically, this
method is a graphical approach uses the distribution of the centers of initially spherical
strain markers to determine a strain ellipse for the rock (Fry 1979; Ramsay and Huber
1983; Figure 3). A Fry plot is produced by plotting the location of strain-marker centers
which used as a function of distance from every other strain-marker center (Figure 4).and
this can be done manually by plotting each grain center on a sheet of tracing paper
overlying a photomicrograph of grains; if the grain centers plotted again and the overlay
is moved incrementally, the shape of a strain ellipse eventually appears. The ellipse is in
the form of a void in the center of the Fry plot, which defines the strain ellipse with an
axial ratio (Rs). The orientation of the strain ellipse is mainly measured by using the rake
of the long axis from the baseline (Φ) in the principle plane of strain. This method is the
most effective with strongly anti-clustered, basicly spherical strain markers of an equal
sizes that are strained homogenously (Fry 1979; Dunne et al. 1990; Crespi, 1986). The
occurrence of such strain markers is not usually common in nature. So to compensate for
this problem, developed the normalized Fry method Erslev (1988). This modification
accounts for natural variations in the sizes and sphericity of strain markers. This method
generates plots with agreater definition of the central void.
Six field-oriented samples of Sandstone were collected from Injana , Fatha and Gercus
Formation from both limbs of the fold (Figure 5 ). All the samples have been cut into
three mutually perpendicular slabs in anticipation of a future 3D strain analysis: (1)
bedding normal/parallel to strike (PTS); (2) bedding normal/in the dip plane (IDP); and (3)
bedding parallel (PTB). Slabs were notched to preserve the field orientation of the sample
during professional thin section preparation. Large-format thin sections were used to
provide ample surface area for choosing representative areas for analysis (Figure 6
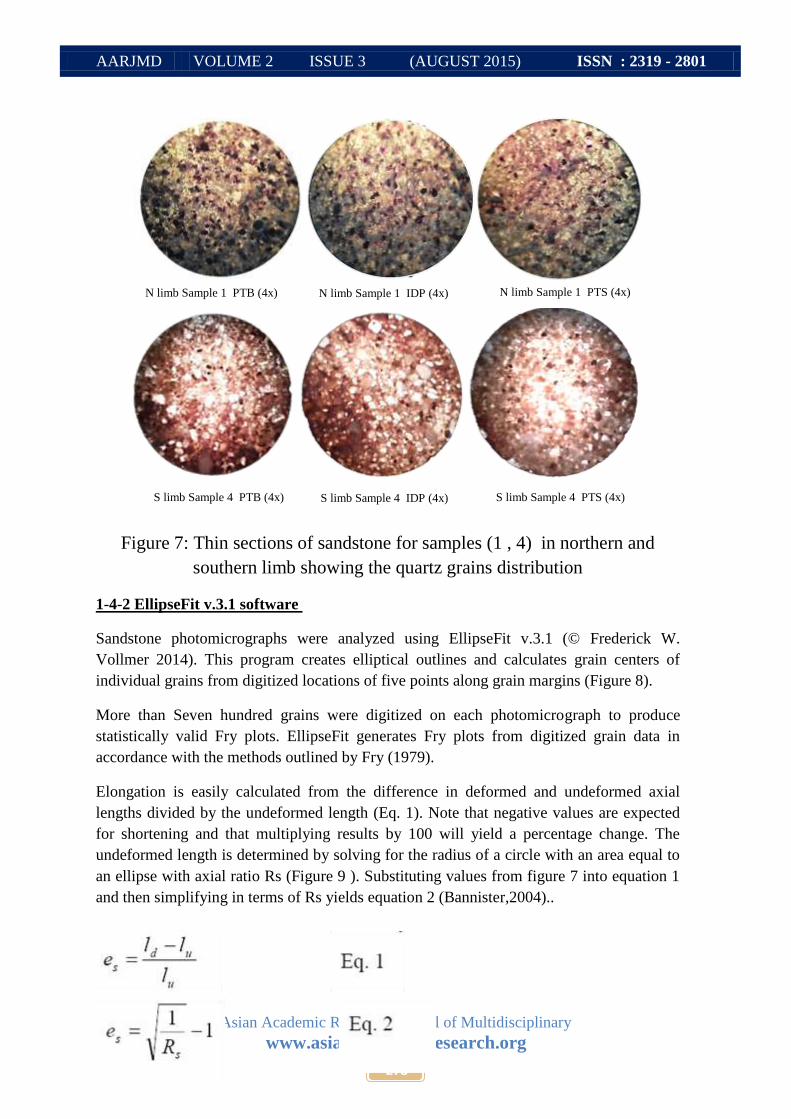
illustrates the spatial relationship between these slabs(Digital photomicrographs were taken
of each thin section through a 4X objective lens with the upper and lower polars set
parallel using a Sony 1080 digital camera to produce 9.1 megapixel images (Figure 7).

AARJMD VOLUME 2 ISSUE 3 (AUGUST 2015) ISSN : 2319 - 2801
Asian Academic Research Journal of Multidisciplinary
www.asianacademicresearch.org
276
Figure 4 : The construction of a fry plot. (A) the position of an overlay centered on point1
with all other points located relative to point 1. (B) The overlay centered over point 2 and
all points located relative to point 2 . (C) The final diagram once every point has been used
as the center for the overlay . The central void defines the shape and orientation of the
strain ellipse (Ramsay and Huber 1983)
Figure 3 : Diagram showing how the distance between grain centers change with direction
when strain develops. (A) unstrained grains, (B) strained grains. (Ramsay and Huber,
1983)

AARJMD VOLUME 2 ISSUE 3 (AUGUST 2015) ISSN : 2319 - 2801
Asian Academic Research Journal of Multidisciplinary
www.asianacademicresearch.org
277
Figure 5 : Sample 4 -Southern limb in Ber Bahar anticline.
Figure 6 : (A) schematic diagram showing mutually perpendicular slabs cut
from field oriented samples. slabs are oriented parallel to bedding ( PTB),
bedding normal / parallel to strike ( PTS), and bedding / in dip plane ( IDP).
(B) slabs were prepared as oriented petrographic thin sections (Bannister,
2004).
AARJMD VOLUME 2 ISSUE 3 (AUGUST 2015) ISSN : 2319 - 2801
Asian Academic Research Journal of Multidisciplinary
www.asianacademicresearch.org
278
S limb Sample 4 PTB (4x) S limb Sample 4 IDP (4x) S limb Sample 4 PTS (4x)
N limb Sample 1 PTB (4x) N limb Sample 1 IDP (4x) N limb Sample 1 PTS (4x)
Figure 7: Thin sections of sandstone for samples (1 , 4) in northern and
southern limb showing the quartz grains distribution
1-4-2 EllipseFit v.3.1 software
Sandstone photomicrographs were analyzed using EllipseFit v.3.1 (© Frederick W.
Vollmer 2014). This program creates elliptical outlines and calculates grain centers of
individual grains from digitized locations of five points along grain margins (Figure 8).
More than Seven hundred grains were digitized on each photomicrograph to produce
statistically valid Fry plots. EllipseFit generates Fry plots from digitized grain data in
accordance with the methods outlined by Fry (1979).
Elongation is easily calculated from the difference in deformed and undeformed axial
lengths divided by the undeformed length (Eq. 1). Note that negative values are expected
for shortening and that multiplying results by 100 will yield a percentage change. The
undeformed length is determined by solving for the radius of a circle with an area equal to
an ellipse with axial ratio Rs (Figure 9 ). Substituting values from figure 7 into equation 1
and then simplifying in terms of Rs yields equation 2 (Bannister,2004)..

AARJMD VOLUME 2 ISSUE 3 (AUGUST 2015) ISSN : 2319 - 2801
Asian Academic Research Journal of Multidisciplinary
www.asianacademicresearch.org
279
Figure 6 : Screen shots from
EllipseFit v.3.1 (A). Parameters
for each digitized grain are
recorded in a data table. (B) Fry
graph setting (C) Fry plots
produced from the strain data.
Figure 8 : Screen shots from EllipseFit v.3.1 (a). Parameters for each digitized grain are
recorded in a data table. (b) Fry graph setting (c) Fry plots produced from the strain data.
Figure 9 : Example of a strain ellipse illustrating relationships between axial ratio (Rs),
undeformed circle radius (r), principle stress (σ1), deformed ellipse axes (a and b), ellipse
orientation (Φ), deformed and undeformed axis lengths (ld and lu), and area of each ellipse
(A). (A) Shape before deformation. (B) Shape after 25% strain (Bannister, 2004).
AARJMD VOLUME 2 ISSUE 3 (AUGUST 2015) ISSN : 2319 - 2801
Asian Academic Research Journal of Multidisciplinary
www.asianacademicresearch.org
280
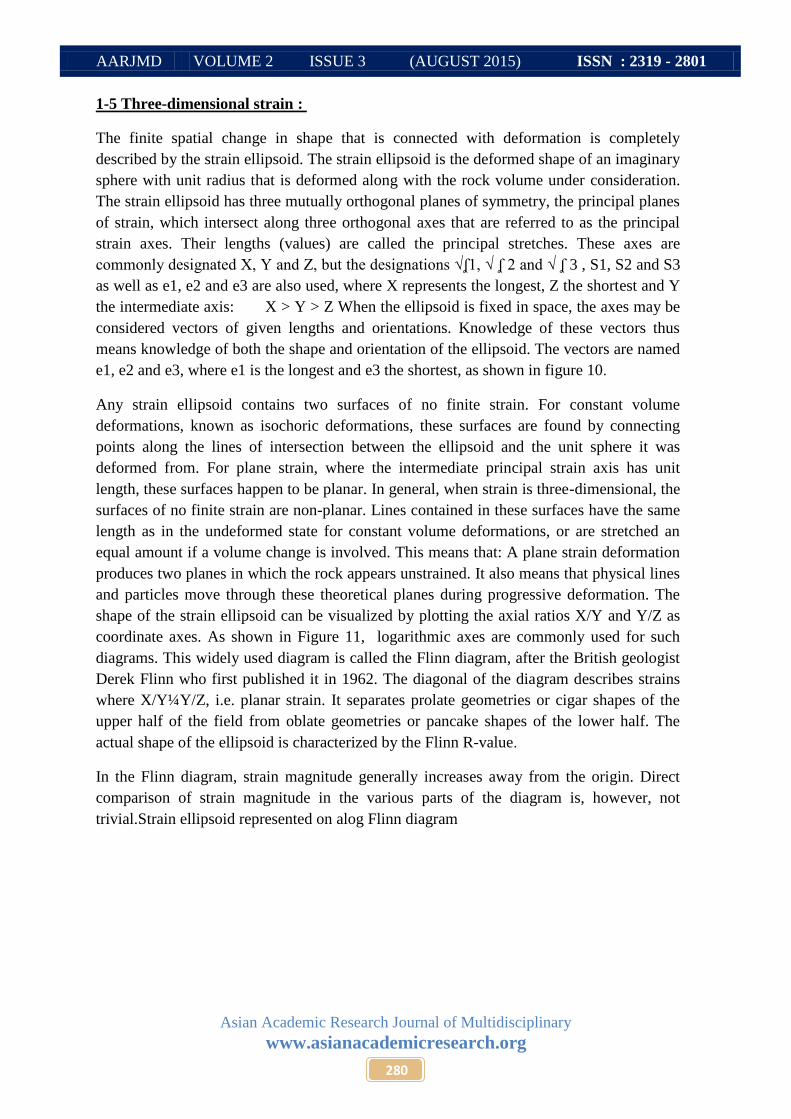
1-5 Three-dimensional strain :
The finite spatial change in shape that is connected with deformation is completely
described by the strain ellipsoid. The strain ellipsoid is the deformed shape of an imaginary
sphere with unit radius that is deformed along with the rock volume under consideration.
The strain ellipsoid has three mutually orthogonal planes of symmetry, the principal planes
of strain, which intersect along three orthogonal axes that are referred to as the principal
strain axes. Their lengths (values) are called the principal stretches. These axes are
commonly designated X, Y and Z, but the designations √ʆ1, √ ʆ 2 and √ ʆ 3 , S1, S2 and S3
as well as e1, e2 and e3 are also used, where X represents the longest, Z the shortest and Y
the intermediate axis: X > Y > Z When the ellipsoid is fixed in space, the axes may be
considered vectors of given lengths and orientations. Knowledge of these vectors thus
means knowledge of both the shape and orientation of the ellipsoid. The vectors are named
e1, e2 and e3, where e1 is the longest and e3 the shortest, as shown in figure 10 .
Any strain ellipsoid contains two surfaces of no finite strain. For constant volume
deformations, known as isochoric deformations, these surfaces are found by connecting
points along the lines of intersection between the ellipsoid and the unit sphere it was
deformed from. For plane strain, where the intermediate principal strain axis has unit
length, these surfaces happen to be planar. In general, when strain is three-dimensional, the
surfaces of no finite strain are non-planar. Lines contained in these surfaces have the same
length as in the undeformed state for constant volume deformations, or are stretched an
equal amount if a volume change is involved. This means that: A plane strain deformation
produces two planes in which the rock appears unstrained. It also means that physical lines
and particles move through these theoretical planes during progressive deformation. The
shape of the strain ellipsoid can be visualized by plotting the axial ratios X/Y and Y/Z as
coordinate axes. As shown in Figure 11, logarithmic axes are commonly used for such
diagrams. This widely used diagram is called the Flinn diagram, after the British geologist
Derek Flinn who first published it in 1962. The diagonal of the diagram describes strains
where X/Y¼Y/Z, i.e. planar strain. It separates prolate geometries or cigar shapes of the
upper half of the field from oblate geometries or pancake shapes of the lower half. The
actual shape of the ellipsoid is characterized by the Flinn R-value.
In the Flinn diagram, strain magnitude generally increases away from the origin. Direct
comparison of strain magnitude in the various parts of the diagram is, however, not
trivial.Strain ellipsoid represented on alog Flinn diagram
AARJMD VOLUME 2 ISSUE 3 (AUGUST 2015) ISSN : 2319 - 2801
Asian Academic Research Journal of Multidisciplinary
www.asianacademicresearch.org
281
Sample 1 Sample 2 Sample 3
Sample 4 Sample 5 Sample 6
Figure 10: The 3D strain ellipsoid for six sample of Northern and southern limbs showing
the strain axes
Figure 11: Strain ellipsoid represented on a log Flinn diagram. Using the Fry method , set
of ellipsoid fall in the biaxial positive field, the strain ellipsoids are determine from
sandstonebeds

AARJMD VOLUME 2 ISSUE 3 (AUGUST 2015) ISSN : 2319 - 2801
Asian Academic Research Journal of Multidisciplinary
www.asianacademicresearch.org
282
Figure 12 : The relationship between axial plane and the orientation of the principal axes of
the fry strains. long, intermediate and short axes show by circles , diamonds and triangles
respectively
Figure 13: Three dimensional strain axes and strain ellipsoids found by the Fry method
across the fold.

AARJMD VOLUME 2 ISSUE 3 (AUGUST 2015) ISSN : 2319 - 2801
Asian Academic Research Journal of Multidisciplinary
www.asianacademicresearch.org
283
PTB of N limb Sample2 IDP of N limb Sample2 PTS of
N limb Sample2
PTB of N limb Sample1 IDP of N limb Sample1 PTS of
N limb Sample1
PTB of N limb Sample3 IDP of N limb Sample3 PTS of N limb
Sample3
1-6 Results
Normalized Fry Method used For sandstone (18 thin sections) (Erslev,1988), which
quantifies anticlustering in distributions of clast centers, to estimate the strain ellipse for
each sample. The Normalized Fry Method is an improved version of the Fry Method (Fry,
1979; Ramsay and Huber, 1983), and allows more precise determination of bulk strain than
the older technique by correcting for the effects of variable sorting and packing (Erslev,
1988 (.
Strain ellipses were obtained for three mutually perpendicular sections for all six samples
from normalized Fry plots (Figure 13 and 14 ) generated by EllipseFit. Ellipse orientation
(phi), axial ratio (Rs), and calculated percent shortening for each ellipse are summarized in
table 1 and 2.
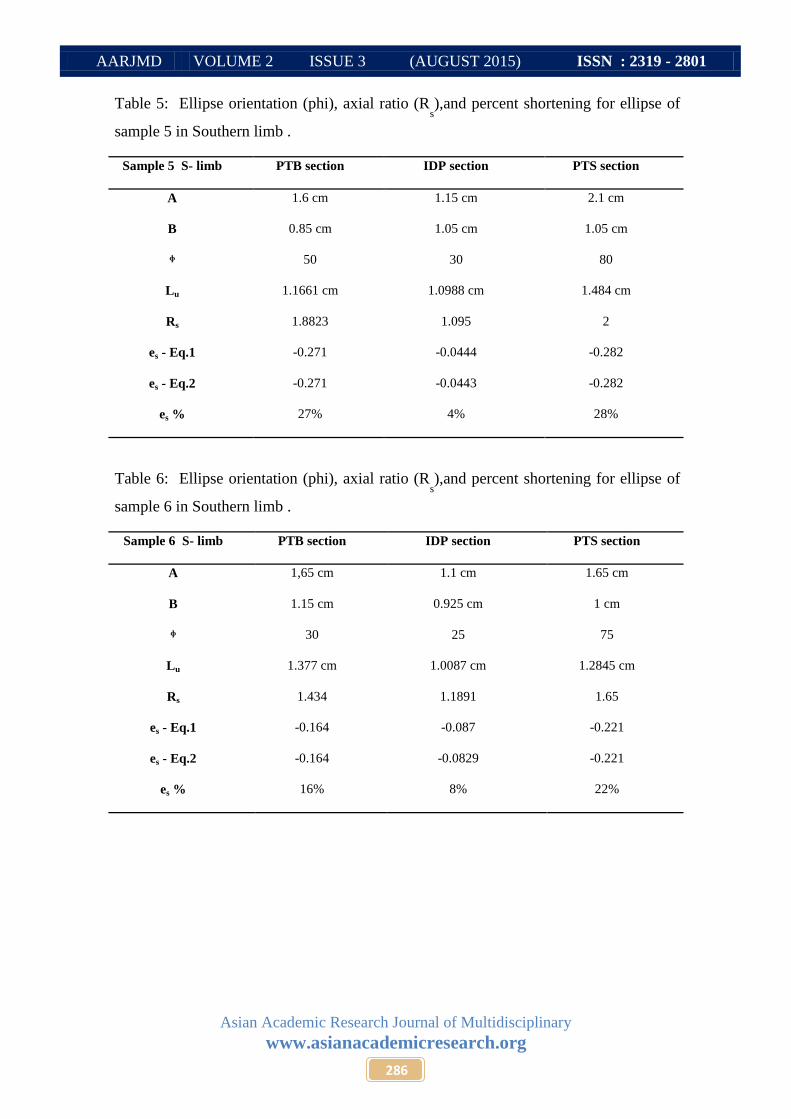
Ellipse orientations range from 0° to 80°. The average value for parallel to strike sections
is 69°, 19° for sections in the dip plane, and 36° for parallel to bedding sections. Strain
magnitudes are ranging from 0 % to 28% shortening. The majority of samples have strain
between 16% and 27% (table 1 ,2 ,3 ,4, 5 and 6), with an average of 20.7% shortening.
Figure 14: Fry Plots of Northern limb

AARJMD VOLUME 2 ISSUE 3 (AUGUST 2015) ISSN : 2319 - 2801
Asian Academic Research Journal of Multidisciplinary
www.asianacademicresearch.org
284
1-7 Comparison of Zgrous strain data to other orogens:
According to table 7, the study area is located in low tectonic deformation relative to the
other areas
Table 1: Ellipse orientation (phi), axial ratio (Rs),and percent shortening for ellipse of
sample1 in Northern limb .
Table 2: Ellipse orientation (phi), axial ratio (Rs),and percent shortening for ellipse of
sample 2 in Northern limb .
PTS section IDP section PTB section Sample 1 N- limb
1.75 cm 2.05 cm 1.65 cm A
1.15cm 1.75 cm 1.05 cm B
75 15 35 ᶲ
1.4186 1.894 cm 1.316 cm Lu
1.5217 1.171 1.523 Rs
-0.1889 -0.074 -0.202 es - Eq.1
-0.1893 -0.075 -0.2 es - Eq.2
18% 7.5% 20% es %
PTS section IDP section PTB section Sample 2 N- limb
2.05 cm 1.6 cm 2.7 cm A
1.30cm 1.4 cm 1.7 cm B
65 20 35 ᶲ
1.576 1.142 cm 1.588 cm Lu
1.632 1.4966 1.7 Rs
-0.203 -0.064 -0.206 es - Eq.1
-0.203 -0.0641 -0.2063 es - Eq.2
20% 6.4% 20% es %

AARJMD VOLUME 2 ISSUE 3 (AUGUST 2015) ISSN : 2319 - 2801
Asian Academic Research Journal of Multidisciplinary
www.asianacademicresearch.org
285
Table 3: Ellipse orientation (phi), axial ratio (Rs),and percent shortening for ellipse of
sample 3 in Northern limb .
Table 4: Ellipse orientation (phi), axial ratio (Rs),and percent shortening for ellipse of
sample 4 in Southern limb .
PTS
section
IDP section PTB section Sample 4 S- limb
2.05 cm 1 1.7 cm A
1.35 cm 1 1.1 cm B
45 0 33 ᶲ
1.663 cm 1 1.367 cm Lu
1.518 1 1.545 Rs
-0.1884 0 -0.195 es - Eq.1
-0.188 0 -0.195 es - Eq.2
18% 0% 19% es %
PTS section IDP section PTB section Sample 3 N- limb
2.65cm 1.25cm 1.4 cm A
1.65cm 1.05 cm 0.9 cm B
75 25 35 ᶲ
2.091 1.1456 cm 1.122 cm Lu
1.606 1.190 1.555 Rs
-0.210 -0.083 -0.197 es - Eq.1
-0.210 -0.0825 -0.197 es - Eq.2
21% 8.2% 19.7% es %
AARJMD VOLUME 2 ISSUE 3 (AUGUST 2015) ISSN : 2319 - 2801
Asian Academic Research Journal of Multidisciplinary
www.asianacademicresearch.org
286
Table 5: Ellipse orientation (phi), axial ratio (Rs),and percent shortening for ellipse of
sample 5 in Southern limb .
PTS section IDP section PTB section Sample 5 S- limb
2.1 cm 1.15 cm 1.6 cm A
1.05 cm 1.05 cm 0.85 cm B
80 30 50 ᶲ
1.484 cm 1.0988 cm 1.1661 cm Lu
2 1.095 1.8823 Rs
-0.282 -0.0444 -0.271 es - Eq.1
-0.282 -0.0443 -0.271 es - Eq.2
28% 4% 27% es %
Table 6: Ellipse orientation (phi), axial ratio (Rs),and percent shortening for ellipse of
sample 6 in Southern limb .
PTS section IDP section PTB section Sample 6 S- limb
1.65 cm 1.1 cm 1,65 cm A
1 cm 0.925 cm 1.15 cm B
75 25 30 ᶲ
1.2845 cm 1.0087 cm 1.377 cm Lu
1.65 1.1891 1.434 Rs
-0.221 -0.087 -0.164 es - Eq.1
-0.221 -0.0829 -0.164 es - Eq.2
22% 8% 16% es %

AARJMD VOLUME 2 ISSUE 3 (AUGUST 2015) ISSN : 2319 - 2801
Asian Academic Research Journal of Multidisciplinary
www.asianacademicresearch.org
287
Table 7 : The calculated magnitudes of the axila ratio for different studies in different
orogenies
1-8 Discussion and conclusion
The Calculated axial ratio are shown in figure 8 which is equivalent to the log flinn
diagram normally used for plotting strain ellipsoids . all classify as biaxial positive they
passes porlates indicators ( ∞ < R < 1 ). The calculated three dimensional orientations of
the axes show different relationship with folding (figure 12 and figure 13). The directions
of maximum axes are close in orientation of the axis of the fold from which the sample
was taken. The minimum axes is perpendicular to axial plain.
The comparison between the present fabric and strain results and other results in high
folded zone in Iraq is difficult because there has not been much research work entirely
devoted to the strain measurement .
The comparission between the present strain results and other results in other belts (table 7)
shows that the study area is located within low deformation. According to these results the
elongation is nearly parallel to fold axes . these results of strain analysis shown that the
regional finite strain os heterogeneous and generally increases northwards Never the less
the average orientation of e3 in a direction which is normal to the axial planes of folds
agree with that found by Hower & Davis (1981) and Salih & Lisle (1988(.In general the
final geometry is the end product of complex strain history, but the evolution may be
Orogens Axial ratio Rs Reference
NW-Zgrous in Iraq (study area ) 1.5 – 1.8 Authors
Glarus Thrust in Switzerland 1.5 -2 Ring et al. ,2001
Willard thrust of the Idaho -Wyoming- Utah fold-thrust
belt
2-4 Yonkee, 2005
Moine thrust in Scotland ˜ 50 Sanderson ,1982
Northern Appenines in Italy 5-10 Kligfield et al. , 1981
South walles 1.2-1.3 Salih and Lisle 1988
Orogens LPS ( layer-parallel
shortening )
Reference
NW- Zarous in Iraq (study area ) 16-27% Authors
The foreland parts of the of the Pennsylvania
salient of the Appalachian orogen,
13-20% Nickelsen, 1963, 1983;
Engelder, 1979; Gray and
Mitra, 1993; Faill and
Nickelsen, 1999
In exterior thrust sheets of the Idaho
Wyoming Utah salient of the Sevier fold-
thrust belt
5-30% Crosby, 1969; Gockley,
1985; Craddock, 1992;
Mitra, 1994; McNaught and
Mitra, 1996; Mukul and
Mitra, 1998; Yonkee
andWeil, 2009

AARJMD VOLUME 2 ISSUE 3 (AUGUST 2015) ISSN : 2319 - 2801
Asian Academic Research Journal of Multidisciplinary
www.asianacademicresearch.org
288
PTB of S limb Sample 6 IDP of S limb Sample 6 PTS of
S limb Sample 6
PTB of S limb Sample 4 IDP of S limb Sample 4 PTS of S
limb Sample 4
PTB of S limb Sample 5 IDP of S limb Sample 5 PTS
of S limb Sample 5
viewed in simplified fashion as potentially consisting of three sequential steps 1) pre
tectonic vertical loading , 2) incipient tectonic compression (prior to folding) and 3) strong
tectonic compression accompanied by folding and thrust faulting (figure.15)
Figure 15: Fry Plots of Southern limb
Figure 16: Suggested origin of prolate strain, A-The initial compaction, B-Tectonic
strain associated with folding parallel to the axial plane of the fold, C-final prolate
resulting from super imposition
AARJMD VOLUME 2 ISSUE 3 (AUGUST 2015) ISSN : 2319 - 2801
Asian Academic Research Journal of Multidisciplinary
www.asianacademicresearch.org
289
1-9 References
Bannister, R. A., 2004, Normalized Fry Strain Analysis of the Binnewater Sandstone,
Central Hudson Valley, Thesis for the Degree of Bachelor of Science In Geology , New
York.
Crespi, J.M., 1986, Some guidelines for the practical application of Fry’s method of strain
analysis: Journal of Structural Geology, 8(7), p. 799-808.
Dunne, W.M., Onasch, C.M., and Williams, R.T., 1990, The problem of strain-marker
centers and the Fry method: Journal of Structural Geology, 12(7), p. 933-938.
Erslev, E.A., 1988, Normalized center-to-center strain analysis of packed aggregates:
Journal of Structural Geology, 10(2), p. 201-209 .
Fossen, H., 2010. Structural Geology: United States of America, Cambridge University
Press, 450p.
Fry, N., 1979, Random point distributions and strain measurement in rocks:
Tectonophysics, 60, p. 89-105 .
Hamza, N.M., 1997. Geomorphological Map of Iraq, scale 1: 1 000 000, GEOSURV, Int.
rep.. Baghdad, Iraq .
Hower J.C and Davis A. (1981) application of Vitrimite reflectanec anisotropy in the
evaluation of coal metamorphism .Geol .Soe Am Bull .,m 92 350 -466
Jassim, S. Z., and Goff, J. C., 2006. Geology of Iraq, Published by Dolin, Pragh and
Moravian Mueseum, Brno, 302 p.
Mulchrone, K.F., 2013. Fitting the void: Data boundaries, point distributions and strain
analysis. Journal of Structural Geology 46, 22-33.
Ramsay, J.G., and Huber, M.I., 1983, The Techniques of Modern Structural Geology –
Volume 1: Strain Analysis, Academic Press, London, 307p.
Salih M.R and Lisle, R., 1988, Optical fabrics of vitrinite and their relation to tectonic
deformation at Ffos ,Las ,South Wales Coalfield, Annales Tectonicae, vol. 2, n 2, p98-106.
Shan, Y., and Xiao, W., 2011. A statistical examination of the Fry method of strain
analysis. Journal of Structural Geology, v. 33, p. 1000-1009.
Sisakian, V. K., 1995. The geology of Al-Mosul quadrangle sheet NJ-38-13, Scale
1:250000. GEOSURV, Int. Rep. No. 2314 ,Baghdad, Iraq
Vollmer F. W. , 2014, User Manual of EllipseFit 3.1, p 60.
Waldron, J.W.F., and Wallace, K.D., 2011. Objective fitting of ellipses in the centre-to-
centre (Fry) method of strain analysis. Journal of Structural Geology 29, p.1430-1444.