
Fingering instability in combustion: An extended view · PDF fileFingering instability in...
14
Fingering instability in combustion: An extended view Ory Zik and Elisha Moses Department of Physics of Complex Systems, The Weizmann Institute of Science, Rehovot 76100, Israel ~Received 29 October 1998! We detail the experimental situation concerning the fingering instability that occurs when a solid fuel is forced to burn against a horizontal oxidizing wind. The instability appears when the Rayleigh number for convection is below criticality. The focus is on the developed fingering state. We present direct measurements of the depletion of oxygen by the front as well as new results that connect heat losses to the characteristic scale of the instability. In addition, we detail the experimental system, elaborate ~qualitatively and quantitatively! on the results that were previously presented, and discuss new observations. We also show that the same phe- nomenological model applies to electrochemical deposition. @S1063-651X~99!05007-2# PACS number~s!: 47.20.Ma, 82.40.Py, 47.20.Hw I. INTRODUCTION We all encounter and use combustion on a daily basis, from the lighting of a match to the engine of a car. Still, we maintain a primal fascination with flames, exemplified by the dancing motion of a bonfire. This has origins that go beyond the complexity and beauty of the phenomenon itself, ‘‘where you have such beauty and brightness as nothing but combus- tion or flame can produce’’@1#. Fortunately, perhaps, our un- derstanding of the flame is still poor, leaving that mysterious fascination intact @1#. We turn instead to forms of combustion in which the complicated nonequilibrium chemical process can be re- strained and controlled, aiming for an accuracy that is com- parable to the degree of control of more conventional front propagation systems. A flame is fundamentally determined by the availability of fuel, oxidant, and heat, and its dynam- ics can be localized to the region of interaction. This realiza- tion leads us to the study of the combustion front, and to limit it to a slow burning regime. We can further simplify the dynamics by the use of a thin gap ~Hele-Shaw! geometry, which provides a crucial constraint and subsequent simplifi- cation. We have recently shown that a thin solid, burning against an oxidant wind, develops a steady fingering state @2#. Con- ceptually the effect is like a ‘‘print-out’’ of the thermal dif- fusion instability. It appears in a well defined regime of the Rayleigh and Pe ´ clet numbers ~below the threshold of vertical convection and with prevailing molecular diffusion in the horizontal plane!. The characteristic length ~finger width! is determined by the ability of the front to release heat, while the distance between fingers is determined by the availability of oxygen. The quality of experimental control reveals a new state which has an applicational significance; a sole finger of fire can slowly propagate in an oxygen-rich environment, remaining below the threshold of conventional detection. The current paper elaborates on the experimental and phe- nomenological findings as well as presenting new results. Interfacial instabilities have been extensively studied in simpler, less reactive, growth systems @3–7#. The pattern is typically characterized by one length scale—the fastest growing wavelength in the linear spectrum @8#. Notable ex- amples are solidification @9#, nematic-isotropic transition in liquid crystals @10#, and viscous fronts @11#. These systems are usually treated within the framework of the Stefan prob- lem, where the front is a solution of one or more Laplacian fields ~e.g., pressure or temperature! satisfying some bound- ary conditions on the interface. The characteristic scale is determined by various system properties, e.g., the gradient of the field that drives the instability ~as in solidification @9# and liquid crystals @10#!, the system scale ~as in viscous fronts @7#!, or the front velocity ~as in eutectic growth @12#!. In principle, more than one characteristic scale can be expected, depending on the number of fields that govern the front @13#. Our previous paper @2# described two decoupled length scales that correspond directly to the two different fields: the transport of reactants and transport of heat. Previous works on combustion have already revealed a number of interfacial instabilities @14#. The most notable is the thermal-diffusion instability in ‘‘premixed’’ flames ~i.e., the oxygen and ‘‘fuel’’ are mixed before burning!. This in- stability has two fields, based on two competing transport processes @15#. The transport of reactants has a destabilizing effect, while the transport of heat has a stabilizing effect. To see this, consider a bump in the interface. It is protruding into a colder region of fresh oxygen. The higher availability of oxygen promotes the propagation of the bump, while the excessive heat losses impede it. The thermal-diffusion instability was first reported in 1882 on a Bunsen burner @16# and has been extensively stud- ied ever since @14#. The rich behavior exhibited by this sys- tem includes interesting modes like ‘‘rotation’’ and ‘‘ratch- eting’’ @17#. Flame propagation over thin solid fuels has also been previously studied. The main focus was the flame spread rate @18–20#. A cellular structure observed in this system was recently related to the thermal-diffusion instabil- ity @21#. From the theoretical side, recent work predicts a connection between the Saffman-Taylor instability and two- dimensional filtration combustion @22#~see also Ref. @3# and references therein!. Our system combines the two-dimensional ~2D! ‘‘Hele- Shaw’’ geometry @11# with combustion ~not in a filtration regime!. The measurements are performed in the compara- tively slower and experimentally convenient combustion re- gime termed smoldering @23#. This is a nonflaming mode ~i.e., the emitted gas does not ‘‘glow’’ in the visible light! PHYSICAL REVIEW E JULY 1999 VOLUME 60, NUMBER 1 PRE 60 1063-651X/99/60~1!/518~14!/$15.00 518 ©1999 The American Physical Society
Transcript of Fingering instability in combustion: An extended view · PDF fileFingering instability in...

PHYSICAL REVIEW E JULY 1999VOLUME 60, NUMBER 1
Fingering instability in combustion: An extended view
Ory Zik and Elisha MosesDepartment of Physics of Complex Systems, The Weizmann Institute of Science, Rehovot 76100, Israel
~Received 29 October 1998!
We detail the experimental situation concerning the fingering instability that occurs when a solid fuel isforced to burn against a horizontal oxidizing wind. The instability appears when the Rayleigh number forconvection is below criticality. The focus is on the developed fingering state. We present direct measurementsof the depletion of oxygen by the front as well as new results that connect heat losses to the characteristic scaleof the instability. In addition, we detail the experimental system, elaborate~qualitatively and quantitatively! onthe results that were previously presented, and discuss new observations. We also show that the same phe-nomenological model applies to electrochemical deposition.@S1063-651X~99!05007-2#
PACS number~s!: 47.20.Ma, 82.40.Py, 47.20.Hw
sie
henr
bu-u
erem
onnemzat
e
lifi
ns
-hele
ililiewrnonph.in
te
b-an-
ist of
ted,
hthe
d a
ortingToingitythe
ind---somesbil-
ao-
ra-re-
t
I. INTRODUCTION
We all encounter and use combustion on a daily bafrom the lighting of a match to the engine of a car. Still, wmaintain a primal fascination with flames, exemplified by tdancing motion of a bonfire. This has origins that go beyothe complexity and beauty of the phenomenon itself, ‘‘wheyou have such beauty and brightness as nothing but comtion or flame can produce’’@1#. Fortunately, perhaps, our understanding of the flame is still poor, leaving that mysteriofascination intact@1#.
We turn instead to forms of combustion in which thcomplicated nonequilibrium chemical process can bestrained and controlled, aiming for an accuracy that is coparable to the degree of control of more conventional frpropagation systems. A flame is fundamentally determiby the availability of fuel, oxidant, and heat, and its dynaics can be localized to the region of interaction. This realition leads us to the study of the combustion front, andlimit it to a slow burning regime. We can further simplify thdynamics by the use of a thin gap~Hele-Shaw! geometry,which provides a crucial constraint and subsequent simpcation.
We have recently shown that a thin solid, burning agaian oxidant wind, develops a steady fingering state@2#. Con-ceptually the effect is like a ‘‘print-out’’ of the thermal diffusion instability. It appears in a well defined regime of tRayleigh and Pe´clet numbers~below the threshold of verticaconvection and with prevailing molecular diffusion in thhorizontal plane!. The characteristic length~finger width! isdetermined by the ability of the front to release heat, whthe distance between fingers is determined by the availabof oxygen. The quality of experimental control reveals a nstate which has an applicational significance; a sole fingefire can slowly propagate in an oxygen-rich environmeremaining below the threshold of conventional detectiThe current paper elaborates on the experimental andnomenological findings as well as presenting new results
Interfacial instabilities have been extensively studiedsimpler, less reactive, growth systems@3–7#. The pattern istypically characterized by one length scale—the fasgrowing wavelength in the linear spectrum@8#. Notable ex-amples are solidification@9#, nematic-isotropic transition in
PRE 601063-651X/99/60~1!/518~14!/$15.00
s,
des-
s
--td--o
-
t
ety
oft,.e-
st
liquid crystals@10#, and viscous fronts@11#. These systemsare usually treated within the framework of the Stefan prolem, where the front is a solution of one or more Laplacifields ~e.g., pressure or temperature! satisfying some boundary conditions on the interface. The characteristic scaledetermined by various system properties, e.g., the gradienthe field that drives the instability~as in solidification@9# andliquid crystals@10#!, the system scale~as in viscous fronts@7#!, or the front velocity~as in eutectic growth@12#!. Inprinciple, more than one characteristic scale can be expecdepending on the number of fields that govern the front@13#.Our previous paper@2# described two decoupled lengtscales that correspond directly to the two different fields:transport of reactants and transport of heat.
Previous works on combustion have already revealenumber of interfacial instabilities@14#. The most notable isthe thermal-diffusioninstability in ‘‘premixed’’ flames~i.e.,the oxygen and ‘‘fuel’’ are mixed before burning!. This in-stability has two fields, based on two competing transpprocesses@15#. The transport of reactants has a destabilizeffect, while the transport of heat has a stabilizing effect.see this, consider a bump in the interface. It is protrudinto a colder region of fresh oxygen. The higher availabilof oxygen promotes the propagation of the bump, whileexcessive heat losses impede it.
The thermal-diffusion instability was first reported1882 on a Bunsen burner@16# and has been extensively stuied ever since@14#. The rich behavior exhibited by this system includes interesting modes like ‘‘rotation’’ and ‘‘ratcheting’’ @17#. Flame propagation over thin solid fuels has albeen previously studied. The main focus was the flaspread rate@18–20#. A cellular structure observed in thisystem was recently related to the thermal-diffusion instaity @21#. From the theoretical side, recent work predictsconnection between the Saffman-Taylor instability and twdimensional filtration combustion@22# ~see also Ref.@3# andreferences therein!.
Our system combines the two-dimensional~2D! ‘‘Hele-Shaw’’ geometry@11# with combustion~not in a filtrationregime!. The measurements are performed in the compatively slower and experimentally convenient combustiongime termedsmoldering@23#. This is a nonflaming mode~i.e., the emitted gas does not ‘‘glow’’ in the visible ligh!
518 ©1999 The American Physical Society

asT
he
otatootl
wing
ue
twrtn
eatho
letices
arefc-r
m
ns
hesta-
pro-
es.ol-
ithofrmdare
latey of
duc-
easeutnd-
ws.
ofof
ndthethe
theingtdif-icalhe
xes
x
-thereey
an
,l
d
;
b
PRE 60 519FINGERING INSTABILITY IN COMBUSTION: AN . . .
where oxygen interacts with solid fuel to produce char, geous products and the heat that sustains the process.oxidizing gas is supplied in a uniform flow, opposite to tdirection of the front propagation~i.e., the fuel and oxygenare fed to the reaction from the same side!. This configura-tion enhances the destabilizing effect of reactant transpwhich plays the same role as in the thermal-diffusion insbility. The reduction to two dimensions is critical in ordersuppress the effect of convection and plumes near the frInterestingly, a 3D version of our experiment has recenbeen conducted onboard the space shuttle@24#. A simpleestimation of the Rayleigh number in our experiment shothe equivalence of quasi-2D and microgravity in neutralizgravitational effects.
In this configuration the front exhibits adirectional fin-gering instabilitywith two decoupled length scales~the fin-ger width and the spacing between fingers! @2#. The nondi-mensional control parameter is the Pe´clet number Pe whichmeasures the relative importance of advection and molecdiffusion @25#. The instability appears below a critical valuof Pe. The two length scales correspond directly to thekey transport mechanisms: transport of heat and transporeactants. The distance between fingers is self-consistedetermined by Pe. Although heat transport plays a key rolthe instability, we show with a phenomenological model threactant transport alone determines the front velocity andspacing between fingers. The agreement between the mand measurements is remarkable~no free parameters!. Thebehavior of the spacing between fingers is analogous to etrodeposition@26,27#. On the other hand, the characterisscale ~finger width! is effectively independent of Pe. Wshow that it depends on the ability of the front to releaheat.
The origin of the instability should ultimately yield fromlinear theory. At this stage such a theory is lacking andmains an open challenge. Our preliminary derivation oMullins-Sekerka type analysis shows that the main obstato deriving such a theory lies in translating the far-fromequilibrium moving flame front into an adequate boundacondition.
II. SETUP
The cell is shown schematically in Fig. 1. It has a te
FIG. 1. Schematic representation of the setup. 1, glass topvariable gap between top and bottom platesh; 3, outflow of com-bustion products; 4, spacers to controlh; 5, ignition wire; 6, heatconducting boundaries; 7, flame front; 8, fuel; 9, interchangeabottom plate; 10, uniform flow of O2 /N2; 11, gas diffuser; 12, gasinlet.
-he
rt,-
nt.y
s
lar
ooftlyinte
del
c-
e
-ale
y
-
pered glass top for visualization~1 in Fig. 1!. The spacinghbetween the sample plane and glass top is adjustable~2 and4 in Fig. 1!. The fuel is a rectangular sheet of dimensio20320 cm2 ~8 in Fig. 1!. Our ‘‘fuel’’ is mainly filter paper.However, the effect is fuel independent. It occurs in all tcombustible materials that we examined, from standardtionery paper to polyethylene sheets~see Sec. VII!. Ourquantitative measurements were conducted on the paperduced by Whatman~mostly grade no. 2!. Its main advantagesare its uniformity and the available data on its propertiAnother advantage of using this paper is the fact that it smders at a relatively low temperature~about 600 °C), allowingus to work in small gap sizes~down to 0.2 cm! withoutcracking the glass.
The fuel sample is stretched on the bottom of the cell wuniform tension. The uniformity is achieved with a systemsprings against which the paper is stretched. The unifostretching is able to prevent the ‘‘crumpling’’ of the burnepaper that can arise in some of the regimes. The springsrecessed into the bottom plate. The part of the bottom pwhich touches the sample can be changed to allow a studthe effect of ambient heat conductivity~9 in Fig. 1!. Alumi-num adhesive strips are used to create uniform heat contive lateral boundary conditions~6 in Fig. 1!. These stripesare 0.025 cm higher than the sample. This serves to decrthe supply of oxygen from the sides of the sample. Withothese boundary conditions, the propagation along the bouaries prevails and the front is not uniform.
The emphasis of the experimental design was as follo~i! Creating a uniform 2D gas flow~10 in Fig. 1!; ~ii ! Creat-ing a uniform 1D ignition~5 in Fig. 1!. The uniform flowwas achieved with a gas diffuser consisting of an arrayorifices which was designed to produce a laminar windoxygen and nitrogen~11 in Fig. 1!. The diffuser consists ofan array of 80 cylindrical holes of diameter 0.06 cm alength 0.8 cm. To avoid the inhomogeneities produced bysides, we limited the experiment to the central part offlow channel.
We used two other diffusers to check the influence onresults: a diffuser with a parabolic shape and a diffus‘‘slot’’ (0.07 330 cm2). Both changed the flow slightly, budid not have any influence on the results. The parabolicfuser was designed to produce a uniform hydrodynamresistance~by varying both the length and the diameter of tholes!.
We use two systems of rotatometers to control the fluof oxygen (FO2
) and nitrogen (FN2) that are fed into the
diffuser ~12 in Fig. 1!. The velocity is calculated as the fludivided by the effective system cross section,VO2,N2
5FO2,N2/S with S5253h cm2. We used smoke visualiza
tion for calibration and independent measurements ofgas-flow velocity. The measured smoke velocities agwithin 610% with the calculated velocities. The uniformitof the flow was also verified with this technique~Fig. 2!. Thevisualization agent was cigarette smoke. We pumpedN2/O2 mixture through a ‘‘matrix’’ of 12 cigarettes. Moreconventional smoke production methods~e.g., using resinspowders, or water vapors! did not work due to the smalorifice dimensions of the diffusers.
Uniform ignition was achieved with a resistively heate
2,
le

ar
. Iheemththn
is
tuon/
xth
n is
city
tec-
itync-et
ady
es
n
ceaft
typt.
n-resth
at-
r-
from
520 PRE 60ORY ZIK AND ELISHA MOSES
thin (R555 mm) tungsten wire, which was placed alongline at the fuel edge~5 in Fig. 1!. The ignition can be eithein the downwind part of the sample~counterflow regime! orat the upwind part~coflow regime!. The wire is recessed intothe bottom plate so that it does not interfere with the flowhas a spring to maintain tension as the wire undergoes tmal expansion. In Fig. 3 we show a time sequence that donstrates the initial evolution of a fingering state, afterwire was heated. The arrow in the bottom picture marksheated ignition wire. The initial nonuniformity in the ignitiois erased as the front propagates.
Creating uniform ignition along the width of the sampleespecially difficult near extinction (VO2
,1 cm/s). We over-came this problem by coating the ignition zone with a sarated solution of nitrocellulose in acetone, letting the acetevaporate and applying an initial pulse of oxygen at 12 cmThe evolution near extinction is shown in Fig. 4~from bot-tom to top!. The front is initially smooth due to the high fluof oxygen. The second picture from the bottom shows
FIG. 2. Flow visualization with cigarette smoke is used to chethe uniformity of the gas flow, as well as for an independent msurement of the gas velocity. The smoke flows from right to leThe rectangular frame marks the region where the sample iscally placed. The uniformity of the flow in this region is evidenThe image was taken with reflected light.
FIG. 3. A time sequence~the images are 1.2 s apart, time icreases upwards! showing the initial evolution of the front afteignition, in the tip splitting regime. The sinusoidal pattern evolvsoon after ignition. The peaks of the sine wave grow towardsoxygen source. The arrow in the bottom image marks the heignition wire. The initial small nonuniformity in the ignition is recovered by the pattern.
tr--
ee
-e
s.
e
sinusoidal pattern that develops after the supply of oxygecut. The steady state of sparse fingers~top! is achieved aftera selection process. This has no effect on the front velo~see the following!.
A test for the experimental design@especially for points~i! and~ii ! above# is that the growth will attain a steady staand will maintain it. Figure 5 shows the position as a funtion of time for various values ofVO2
. The system attains asteady state immediately after ignition. The front veloc~slope! remains unchanged throughout the run. Near extition we see that the transition from the initial ‘‘boost’’ to thsteady-state condition~shown in Fig. 4! has a short transieneffect. The sharp transition~indicated by the arrow in Fig. 5!shows how the system immediately recovers to its stestate.
Following is the list of control parameters and the rangthat we covered.
~i! Gas flow velocityVgas(5VO2if a51 and VO21N2
if
aÞ1): 022560.2 cm/s.~ii ! Relative N2 content in the gasa5 f O2
/( f O21 f N2
),
where f O2,N25FO2,N2
/S: 0.6<a<1. ~Note that as long as
a51, we will useVO25 f O2
for the specific oxygen flux.!
~iii ! Gap between cell top and bottomh: (0.221.4)60.04 cm.~The small gap inhibits natural convection —ainexpensive alternative to turning off gravity.!
~iv! Fuel ~composition, thickness, density, ash content!.~v! Heat conductivity of the bottom platel: 107*l
*103 ergs/cm s K.Most of the experiments were performed witha51,
Whatman paper no. 2,h50.5 cm, aluminum bottom plate(l52.43107 erg/cm s K!. The molecular diffusion coeffi-
k-.i-
eed
FIG. 4. Initial evolution near extinction. The sinusoidal pertubation appears immediately after we cutVO2
~from 15 to 0.33 cm/s!and then develops into a steady state of sparse fingers. Timesignition are~bottom to top! 1, 5.3, 8.6, 35.8, and 193.5 s.

-
heibld1.e-tts
ne
as
ffu-meseeir
tedon
l-ng.
ntopcaleg-
e
.ea
hin
g.-
e-
PRE 60 521FINGERING INSTABILITY IN COMBUSTION: AN . . .
cient is taken to beD50.25 cm2/s. We ignore its temperature dependence.
The measured quantities are~with the typical systematicerror! as follows.
~i! Front velocityu (60.05 cm/s).~ii ! Finger widthw (60.05 cm).~iii ! Distance between fingersd (60.05 cm).~iv! Density, thickness, and composition of products.~v! Oxygen content of the gaseous products (610%).u, d, andw were measured through CCD images of t
front ~we used a Sony XC-75CE camera, peaks in the visrange, digitization matrix of 7363512, and with geometricadistortion less than 2%!. The front velocity was measurewith a code that we added to the software NIH Image@28#. It automatically identifies the propagating front in prdetermined steps. The accuracy in resolving the fronabout five pixels. The composition of the solid produc~char! was measured with gas chromatography@29#. Theoxygen content was measured by an electrochemical se~we used ‘‘Emproco’’ 020697 with a typical response timof 5 s and probe diameter of 0.3 cm!. The sensor is fed by aslow suction pump~at 0.1 LPM!. The temperature of thefront was measured to be 600640 °C ~using a nitrogencooled IR camera!.
III. THEORETICAL AND PHENOMENOLOGICALPICTURE
The instability is controlled by the Pe´clet number, definedas Pe5VO2
h/D. At Pe greater than some critical value Pec ,the uniformly fed front is smooth@Fig. 6~a!#. As Pe isslightly decreased, small bumps that exist along the interfbegin to compete over the oxygen, and the front developstructure which marks the onset of instability@Fig. 6~b!#.
FIG. 5. Typical x2t data for measurements ofu. VO2
58.6 cm/s, empty circles~connected front, no fingering!; VO2
52 cm/s, full circles~fingering and tip splitting!; VO250.2 cm/s
~verge of extinction, fingering, without tip splitting!, full squares.The respective front velocities areu50.41, 0.21, and 0.045 cm/sThe lines represent the linear fits from which the velocity is msured. The small arrow marks the point at which the transient~ini-tial boost! of the propagation near extinction (VO2
50.2 cm/s) endsand the measurement begins~see Fig. 4!. The transition from theignition stage to the steady state is sharp.x is defined as the positionof the foremost finger. Similar results are obtained whenx is de-fined as the average finger position.
le
6
is
sor
cea
When the oxygen supply is further decreased, lateral dision currents become important and the structure becoperiodic @Fig. 6~c!#. As the supply is further decreased, thpeaks of the periodic structure deplete the oxygen in thvicinity, and separate into fingers@Fig. 6~d!#. This transitionoccurs at different number Pec1. The narrow band Pec1<Pe<Pec is the onset regime. It is characterized by a connecfront with a cellular structure. The focus of this paper isthe developed fingering state Pe,Pec1.
Figure 6~d! shows a typical fingering pattern in the deveoped regime. The pattern develops by recurrent tip splittiCombustion occurs only in the limited vicinity of the tips~inall the regimes! and there is no reaction behind the front~oralong the fingers!. Fingers that are closer to the oxygesourcescreenneighboring fingers. The screened fingers sgrowing and the tips of the screening fingers split. The lodynamic mechanism for tip splitting is as yet unknown. Wexpect that the widening of the finger prior to the tip splittinwill give some insight into this problem. The splitting maintains constant both the average finger widthw and the spac-ing between fingersd.
As Pe is decreased,d grows. At a certain stage,d is suf-ficiently large to allow fingering without screening and w
-
FIG. 6. Steady-state patterns in counterflow combustion of tsolid fuel as a function of oxygen flowVO2
@decreasing from~a! to~e!#. ~a! Stable front,~b! irregular front, ~c! periodic pattern,~d!fingering pattern with tip splitting,~e! fingering without tip split-ting. In all regimes, a bright spot~like the one at the tip of thecentral finger! typically appears just before the tip stops growinThe charred area~black! propagates from bottom to top. The fingering pattern defines two length scales: the finger widthw and thespacing between fingersd. The scale bars are 1 cm. The gap btween plates ish50.5 cm. The oxygen flow velocityVO2
is directeddownwards and the front velocityu is directed upwards@arrows in~d!#. The values are~top to bottom! VO2
511.4, 10.2, 9.2, 1.3, 0.1cm/s andu50.5, 0.48, 0.41, 0.14, 0.03560.01 cm/s.

ea
osm
don
ct
fg
r-
-
a
-
tal
s-toort
eshexi-
, is
etenter to
u-
em-ef--
dris
byhe
522 PRE 60ORY ZIK AND ELISHA MOSES
obtain sparse fingers without tip splitting@Fig. 6~e!#. While wdepends very weakly on Pe~for given h, it depends onhthrough the heat transport mechanisms!, d is a rapidly de-creasing function of it. The maximal value ofd is compa-rable to the system size,d;L. The minimal value ofd ~zero!occurs at Pe5Pec1. Tip splitting is observed atw*d.
A. Mass conservation
Since oxygen is the limiting factor, we expect all thavailable oxygen to be consumed by the front. We compthe mass of reacting gas per unit timeGO2
to the mass of
reacting solid per unit timeGsolid. If all the oxygen is con-sumed, then we haveGO2
5mGsolid. The proportionality fac-
tor m is the stoichiometric coefficient, defined as the massreactant gas consumed by reacting with one unit massolid.GO2
can be written in terms of the experimental para
eters GO25*0
LrO2Vgasa(h2dub)dx, where rO2
(x) and
Vgas(x) are the gas density and velocity, respectively, anais the fraction of oxygen in the gas mixture. The integratiis over the width of the sampleL. Gsolid is a function of themeasured quantitiesGsolid5*0
Lu(rubdub2rbdb)dx, whered(x) and r(x) are the fuel thickness and density, respetively. The subscriptsb andub stand for burnt and unburnsolid, respectively. We thus expect that
E0
L
rO2Vgasa~h2dub!dx5mE
0
L
u~rubdub2rbdb!dx.
~3.1!
In the ‘‘fingering’’ regime the integral~per finger! is overw1d in the left-hand side~LHS! and overw in the right-hand side~RHS! and we can approximate
rO2Vgasa~h2dub!5m
w
w1d~rubdub2rbdb!u. ~3.2!
A similar approach to Eq.~3.2! is used in the combustion oporous media@23#. With respect to the experimental drivinparameterVO2
, Eq. ~3.2! can be written as
uw
w1d5AVO2
, ~3.3!
where the constantA ~discussed in Sec. IV B below! repre-sents the stoichiometry.
B. Lateral diffusion
In the perpendicular direction we expect diffusion curents, driven by the concentration gradients~see Fig. 7!,given by j x5D¹xCO2
, whereCO2is the oxygen concentra
tion. The gradient is typically over a distance ofd1w. Atsteady state, the lateral current satisfiesj x5uCO2
up to aproportionality constant of order unity. This yields an eqution for the velocity of the diffusion limited growth@12#
u5D
~w1d!. ~3.4!
re
fof-
-
-
The two growth conditions yield the following two nondimensional equations for the three quantitiesd, w, andu:
d5Aw
APe21/22w, ~3.5!
u5AA
wPe21/2, ~3.6!
wherew5w/h, d5d/h, andu5u/VO2.
Equations~3.5! and~3.6! describe the growth with respecto the two horizontal directions. Experimentally the verticdirection ~namelyh) dictatesw in a linear manner,
w;1. ~3.7!
This enables a self-consistent evaluation of Eqs.~3.5! and~3.6!. Equations~3.6! and~3.5! were experimentally verifiedto very good accuracy, assumingw51 and without any fit-ting parameters@2#.
C. Vertical convection
While there is no theory as yet for the role of heat tranport away from the front, a number of observations pointits crucial role. We shall show later that the heat transpdetermines the width of the fingerw. Equally important, wefind that the occurrence of the fingering instability coincidwith the arrest of free convection of gas in the gap. Tflame tip is a heat source with a temperature of appromatelyTf5720 K.
Convection at the tip, while extremely inhomogeneousdetermined by the Rayleigh number Ra5gb(Tf2Ttop)h
3/na. Ttop'450 K is calculated by comparing thheat that is produced by the burning to the heat losses, laheat of evaporation, and the heat needed to bring the papits evaporation temperature@2#. n50.5 cm2/s and a50.5 cm2/s are the kinematic viscosity and thermal diffsivity, respectively, at the estimated gas temperatureTgas'585 K ~estimated as the average of the top and flame tperatures!. For an ideal gas, the volumetric expansion coficient is b'1/Tgas. The onset of natural convection is expected at Rac'1700 ~neglecting the applied wind annonuniform heating!. Experimentally, fingering occurs foh<1 cm, i.e., Ra>1810. The rough numerical agreement
FIG. 7. The schematic flow field. The flow lines are divertedlateral diffusion which is driven by the deficiency of oxygen at ttips.

la
alechiurre
see
ohethe
, s
ns
t
ll
on
itin
e
o
o-
th
e
r
eex-d.
or
s
e-er-
oben it ise
0%
PRE 60 523FINGERING INSTABILITY IN COMBUSTION: AN . . .
an indication that fingering appears in theabsence of naturaconvection. It also explains why the same phenomenon hbeen observed in a microgravity experiment in space@24#.
IV. OXYGEN DEPLETION AND MASS CONSERVATION
In Ref. @2# we quantitatively verified Eq.~3.3! by compar-ing the influx of oxygen with the amount of reacted materiIn the first subsection, we supplement this result with dirmeasurement of the percentage of oxygen in the gas bethe front. In the second subsection we detail the measments of Ref.@2# and discuss other features of this measument.
For additional results that concern oxygen depletion,Sec. VII B on the ‘‘coflow’’ regime and Sec. VI B on the rolof the nonreacting gas.
A. Direct measurement of oxygen content
In Fig. 8 we show a typical curve of the percentageoxygen in the gas behind the front. Initially we placed tprobe at the side of the sample to avoid interference withgrowth @arrow in Fig. 8~a!#. As soon as the front passed thprobe, we moved the probe to a position behind the frontthat the inlet is fed by the combustion products@arrow in Fig.8~b!#. The results are shown in Fig. 8~c!. Figure 8~d! showsthe calibration curve for the probe. It shows the respotime of the device~see caption for details!. The experimentalerror is 610% mainly because of the slow~5 s! responsetime of the detector. The same results are obtained whenmeasurement is done behind a finger~and not in the spacingbetween fingers!. This measurement explicitly shows that athe oxygen is depleted by the front~within our 10% error!.This result verifies the ‘‘mass conservation’’ Eq.~3.3!.
B. Comparing the fluxes
The verification of the ‘‘mass conservation’’ is basedmeasuring the LHS of Eq.~3.3! as a function ofVO2
@2#. Theresults are shown in Fig. 9. The corresponding front velocu is shown in the inset. Below a critical value correspondto Pec1 ~arrow in the figure!, u is proportional to (VO2)
1/2 aspredicted by Eq.~3.6!. At Pec1 there is a crossover to thlinear dependence predicted by Eq.~3.3! with d50. Equa-tion ~3.3! predicts a linear dependence of the quantityburnt material per unit timeuw/(w1d) on VO2
with theslope being the stoichiometric factorA, given by
A5arO2
~h2dub!
m~rubdub2rbdb!. ~4.1!
In the following we detail the evaluation of the stoichimetric factorA. The values that we used area51 ~99.99%oxygen!, rO2
51.37631023 g/cm3 @30#; paper thickness and
density are dub50.01860.001 cm and rub50.6660.05 g/cm3 ~direct measurement over 10 samples,manufacturer’s data aredub50.019 cm,rub50.54 g/cm3).The thickness and density of burnt paper aredb50.0160.003 cm andrb50.360.03 g/cm3. These values ofdbandrb represent averages over 10 runs.
s
.tnde--
e
f
e
o
e
he
yg
f
e
It is interesting to point out thatdb and rb are not con-stant. Both depend weakly onVO2
. Both quantities increase
in theVO2range of 0.5215 cm/s but do not change by mor
than 20% over thatVO2range~this adds some error to ou
measurement ofA). At higher flow rates the burning is morefficient and both quantities significantly decrease. Neartinction the burning is slow but more material is converteThereforedb andrb decrease. The minimum is obtained fVO2
50.06 cm/s, where full conversion is reached, i.e.,db
50 andrb50.
FIG. 8. Direct measurement of the relative oxygen content~us-ing an electrochemical sensor! shows the depletion of oxygen~within 10% resolution!. The probe’s inlet is shown by the arrowin ~a! ~upstream the front! and~b! ~downstream the front!. ~c! showsthe relative oxygen content~in %!: ~1! ignition, ~2! the front passesthe probe, and~3! the front approaches the end of the sample. Btween~1! and ~2!, the probe is near the boundaries, to avoid intference with the growth. At~2! the probe is moved to its positionbehind the front. This measurement was performed with the prplaced between the fingers. The same results are obtained wheplaced on the fingers.d shows a calibration curve for the relativoxygen content in the gas~no flame!: I, initial flow of 100% N2
(a50, f N253 cm/s). The response to an abrupt change to 10
O2 (a51, f O253 cm/s) is shown inII ~increase! and III ~stable
part!. IV shows the transition back to 100% N2.

f
ppec
th
nd
he
e
nit-it
te
ur
w
ew
the
-
n
524 PRE 60ORY ZIK AND ELISHA MOSES
We calculate a stoichiometric coefficientm51.18 for theinteraction of oxygen and cellulose~which comprises 98% othe paper!. We used (C6H10O5)n16nO2→(6CO215H2O)n. The above calculation is based on the assumtion that the chemical composition of the parts of the pathat is left unburnt does not change significantly. To chethis assumption we analyzed the CH composition ofcharred and unburnt paper@29#. For unburnt paper we found44.78%~C!, 6.22%~H!, and 49.4%~O1others! ~as expectedfrom 98%3C6H10O5). For burnt paper we found 42.56%~C!, 6.38%~H!, and 51.1%~O1others!, i.e., the assumptionis justified.
Combining the above numbers we obtainA50.05160.005. Given the complications of this calculation ameasurement, the numerical agreement~within experimentalerror! with the measured slopeA50.04360.005 in Ref.@2#is satisfactory. It shows that the system is well within toxygen deficient regime.
V. THE SPACING BETWEEN FINGERS: COMBININGDRIFT WITH LATERAL DIFFUSION
A. The effect of Pe
In Sec. III ~Fig. 6! we have shown the behavior of thpattern as a function of Pe at (0<Pe<Pec). In this subsec-tion we focus on the fingering regime 0<Pe<Pec1 @~d! and~e! in the figure#. The variation ofd as a function of Pe inthis regime is exemplified in Fig. 10.~a! shows the minimumvalue (d50) at the onset (Pe;Pec1). ~b! shows the minimaldetectable nonzero value ofd. The tip splitting regime startsat Pe,Pec1 @~c!–~f! in Fig. 10#. In ~g! the distance betweefingers is large enough to allow fingering without tip splting. The value ofd increases as we decrease Pe untilmaximal value, which is comparable to the size of the sysL @Fig. 10~i!#.
The above results are quantified in Fig. 11. The figshows the dependence ofd andw on Pe. The continuous lineshows the theoretical prediction@Eq. ~3.5!#. It is in very goodagreement with the data points. These measurementsperformed by varyingVO2
at h50.5 cm. Other values ofh
FIG. 9. Mass conservation, as predicted by Eq.~3.3! ~solid line!.The inset showsu as a function ofVO2
. The arrow corresponds toPec1 ~onset of separated fingers!. The molecular diffusion coeffi-cient of oxygen isD50.25 cm2/s ~neglecting its temperature dependence!.
-rke
sm
e
ere
~in the range 0.2 cm<h<1 cm) show the same qualitativdependence ofd on Pe. The finger width shows a very slo~linear! increase with Pe~at fixedh).
Figures 10 and 6 show that the value of Pe determinesratio betweenw andd, which characterizes the pattern.
~i! Sparse fingers~fingering without tip splitting! are ob-served atd/w@1, which corresponds to 0.1&Pe&2.6.
FIG. 11. The distance between fingersd ~full circles! and fingerwidth w ~empty circles! as a function of Pe.d is determined by thedriving parameter, whilew is only weakly influenced by it. Thecontinuous line is a plot of the RHS of Eq.~3.5! with A50.043~seeFig. 9! and the dashed line isw50.5610.01Pe~in cm!.
FIG. 10. Collage of patterns showing the full variation ofd (0,d&L) as a function of Pe@decreasing from~a! to ~i!#: ~a! near theonset (Pe'Pec) d50, ~b! slightly below the onset (Pe&Pec1) d→0, ~c!–~f! fingering with tip-splitting,~g!–~i! fingering withouttip-splitting. The values of Pe@~a!–~i!# are 18, 15, 14, 11, 961,560.5, 1.560.25, 0.4560.2, 0.0760.02. The spacing betweeplates ish50.5 cm in all the figures except~c! and ~e!, whereh50.6 cm.

.
r ahilalt
it
n-yan
tu
reheee
u
en-
trs,all
mallsive
ms
-
n-
-icesion
PRE 60 525FINGERING INSTABILITY IN COMBUSTION: AN . . .
~ii ! Tip splitting is observed at14 <d/w& 54 , which corre-
sponds to 2.6,Pe&Pec1.~iii ! The onset of fingering~breakage of a ‘‘connected
front’’ ! is observed for Pe,Pec1. Experimentally Pec151761. The predicted value@obtained from Eq.~3.5!# is Pec151/Aw'21 @2#.
~iv! A connected front is observed at Pec1<Pe<Pec . Inthis regimed50 and w is the characteristic ‘‘cusp’’ sizeExperimentally Pec52261 @31#.
~v! w andd are not defined for Pe>Pec .
B. A fundamental relation with another diffusion-limitedsystem: Electrochemical deposition
The dependence ofd on Pe was obtained from Eqs.~3.3!and~3.4!, which describe quite generally the growth undelimited supply of reactants. It is reasonable to expect tsimple consideration to apply to other systems with simconditions. In this section we describe preliminary resu~analyzing previous experiments of ours@26,27#!, whichshow that the distance between branches in electrodeposbehaves as the distance between fingers in combustion.
Electrodeposition is a well known example of diffusiolimited growth @26,27,32,33#. The experiments are usuallconducted in a quasi-two-dimensional cell, filled withionic solution ~usually zinc or copper! of concentrationC.The growth is controlled by the electric current densityj.
Our experiments show decoupling between the strucof a single branch~microstructure! and the macroscopicstructure. The microstructure can be dendritic or disorde~tip splitting!, depending mainly on the concentration. Tmacroscopic structure consists of sparse or dense fingdepending mainly onj. At low currents the fingers are spars~larged), while at high currents the fingers are dense~smalld). Figure 12 shows three pictures that illustrate this res~near the dense regime in electrodeposition of zinc!.
It is straightforward to apply the phenomenological modof Eqs. ~3.3! and ~3.4! to electrodeposition. The mass coservation equation reads
uw5V~w1d!, ~5.1!
whereV is the velocity of the ions andz the ion charge. Thelateral diffusion equation is exactly as in Eq.~3.4!. We ob-tain the same square root dependence:
d5Awh
Pe2w. ~5.2!
The calculation of Pe is based on the relationsJ5sE andV5mE, wheres is the electric conductivity,E is the electricfield, andm is the ion mobility. We obtain
Pe5Vh/D5m
s
h
DJ. ~5.3!
To find m/s we measuredu(w/w1d) as a function ofJ andobtainedm/s50.01860.005 cm3/Coulomb. The diffusionconstant was taken to beD51.331025 @30#.
In Fig. 13 we show a measurement ofd andw as a func-tion of Pe. The continuous line is the prediction of Eq.~13!,which we wrote asd5aAwh/Pe2w with a as a fitting pa-
isrs
ion
re
d
rs,
lt
l
rameter. In Fig. 13,a53.5. In the combustion experimenthe agreement was good without any fitting parametewhile here the results are only indicatory due to the smstatistical sample. These results show that the complex sscale processes are decoupled from the large scale diffutransport that determines the distance between fingers.
This result can be generalized to include other systethat are diffusion limited and supplied by constant flux.
FIG. 12. Diffusion limited growth in electrodeposition. The figure shows the influence of current densityJ, at a fixed ionic con-centration (C50.03 M) on the density of fingers. The current desities~bottom to top! areJ513.3, 116, and 197 mA/cm2. The figureshows the decrease of spacing between fingersd as a function ofJ.
FIG. 13. The behavior ofd and w as a function of Pe in electrodeposition is similar to what we obtained in combustion. Notthat the front is not connected (d.0) even at high current densitieJ ~and Pe!. We conjecture that this result is related to the depletof ions. The fitting parameter for the continuous line isa53.5.
-
th
re
.hae
.ityo
t
peAa
the
eTheeing
in
eat:
her
ot-(
of
Thisate
thine-this
ing
ve ain-
t
b-
s o
the
526 PRE 60ORY ZIK AND ELISHA MOSES
VI. THE FINGER WIDTH: HEAT LOSSES
We have shown thatd is determined by the flux of reactants~through Pe! and thatw is almost independent of Pe.wis a feature of the individual finger that is determined byability of the front to release heat. We now show thatw isrelated to the heat losses in the system.
A. The role of two dimensionality
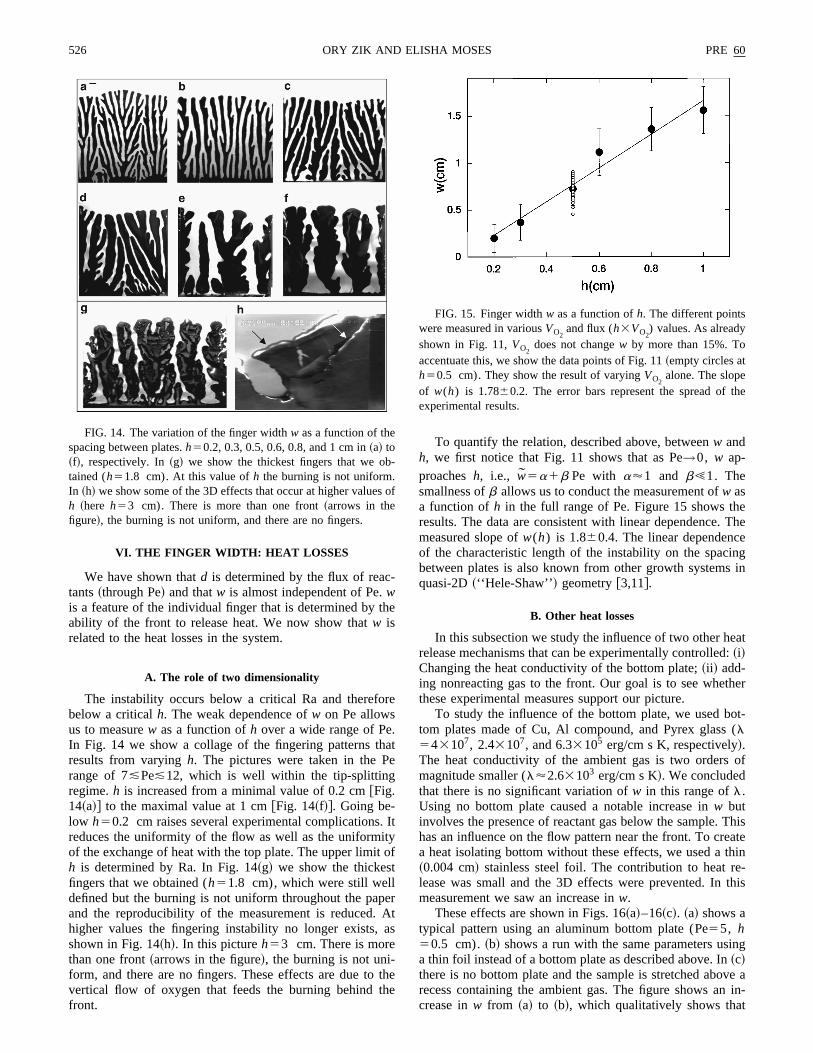
The instability occurs below a critical Ra and therefobelow a criticalh. The weak dependence ofw on Pe allowsus to measurew as a function ofh over a wide range of PeIn Fig. 14 we show a collage of the fingering patterns tresults from varyingh. The pictures were taken in the Prange of 7&Pe&12, which is well within the tip-splittingregime.h is increased from a minimal value of 0.2 [email protected]~a!# to the maximal value at 1 cm@Fig. 14~f!#. Going be-low h50.2 cm raises several experimental complicationsreduces the uniformity of the flow as well as the uniformof the exchange of heat with the top plate. The upper limith is determined by Ra. In Fig. 14~g! we show the thickesfingers that we obtained (h51.8 cm), which were still welldefined but the burning is not uniform throughout the paand the reproducibility of the measurement is reduced.higher values the fingering instability no longer exists,shown in Fig. 14~h!. In this pictureh53 cm. There is morethan one front~arrows in the figure!, the burning is not uni-form, and there are no fingers. These effects are due tovertical flow of oxygen that feeds the burning behind tfront.
FIG. 14. The variation of the finger widthw as a function of thespacing between plates.h50.2, 0.3, 0.5, 0.6, 0.8, and 1 cm in~a! to~f!, respectively. In~g! we show the thickest fingers that we otained (h51.8 cm). At this value ofh the burning is not uniform.In ~h! we show some of the 3D effects that occur at higher valueh ~here h53 cm). There is more than one front~arrows in thefigure!, the burning is not uniform, and there are no fingers.
e
t
It
f
rt
s
he
To quantify the relation, described above, betweenw andh, we first notice that Fig. 11 shows that as Pe→0, w ap-proachesh, i.e., w5a1b Pe with a'1 and b!1. Thesmallness ofb allows us to conduct the measurement ofw asa function ofh in the full range of Pe. Figure 15 shows thresults. The data are consistent with linear dependence.measured slope ofw(h) is 1.860.4. The linear dependencof the characteristic length of the instability on the spacbetween plates is also known from other growth systemsquasi-2D~‘‘Hele-Shaw’’! geometry@3,11#.
B. Other heat losses
In this subsection we study the influence of two other hrelease mechanisms that can be experimentally controlled~i!Changing the heat conductivity of the bottom plate;~ii ! add-ing nonreacting gas to the front. Our goal is to see whetthese experimental measures support our picture.
To study the influence of the bottom plate, we used btom plates made of Cu, Al compound, and Pyrex glassl543107, 2.43107, and 6.33105 erg/cm s K, respectively!.The heat conductivity of the ambient gas is two ordersmagnitude smaller (l'2.63103 erg/cm s K!. We concludedthat there is no significant variation ofw in this range ofl.Using no bottom plate caused a notable increase inw butinvolves the presence of reactant gas below the sample.has an influence on the flow pattern near the front. To crea heat isolating bottom without these effects, we used a~0.004 cm! stainless steel foil. The contribution to heat rlease was small and the 3D effects were prevented. Inmeasurement we saw an increase inw.
These effects are shown in Figs. 16~a!–16~c!. ~a! shows atypical pattern using an aluminum bottom plate (Pe55, h50.5 cm).~b! shows a run with the same parameters usa thin foil instead of a bottom plate as described above. In~c!there is no bottom plate and the sample is stretched aborecess containing the ambient gas. The figure shows ancrease inw from ~a! to ~b!, which qualitatively shows tha
f
FIG. 15. Finger widthw as a function ofh. The different pointswere measured in variousVO2
and flux (h3VO2) values. As already
shown in Fig. 11,VO2does not changew by more than 15%. To
accentuate this, we show the data points of Fig. 11~empty circles ath50.5 cm). They show the result of varyingVO2
alone. The slopeof w(h) is 1.7860.2. The error bars represent the spread ofexperimental results.
e
i
.
e
ge
ue
tin
-
oes
f-
te
as.
r
ithf
ur
n
ts
f
dply
im
ed
PRE 60 527FINGERING INSTABILITY IN COMBUSTION: AN . . .
the ability to release heat narrowsw. The result shown in~c!involves the 3D effects of gas flow, which should be takinto account when comparing~c! with ~a! and ~b!.
A more controlled way to study the effect of heat lossesby adding cooling~nonreacting! gas to the flow. We foundthat adding nitrogen to the flow~at fixed f O2
) has two main
effects: ~i! w decreases, and~ii ! tip splitting is suppressedThese effects are shown in Figs. 16~d!–16~g!. In ~d! and~e!we see two runs with the same values of Pe (1461, definedfor the combination of oxygen and nitrogen P5V(O21N2)h /D). In ~d! we added 20% nitrogen (a50.83),
while in ~e! a51. The figure shows that the result of addinN2 is a decrease inw. To some extent it also shows thsuppression of tip splitting. Figure 16~f! shows a run withPe55.8 anda50.76. We have already shown that this valof Pe ~and d/w) is well within the tip-splitting regime fora51. The figure shows that an effect ofaÞ1 is the suppres-sion of tip splitting.
The abrupt addition of nonreacting gas has an interestransient effect. This is shown in Fig. 16~g!. The values ofVO2
anda were varied within the run in the following man
ner: 1→2 ignition (VO2515 cm/s,a51), 2→3 only oxy-
gen (VO256 cm/s, a51), 3→4 oxygen1nitrogen (VO2
58 cm/s,a56/8).
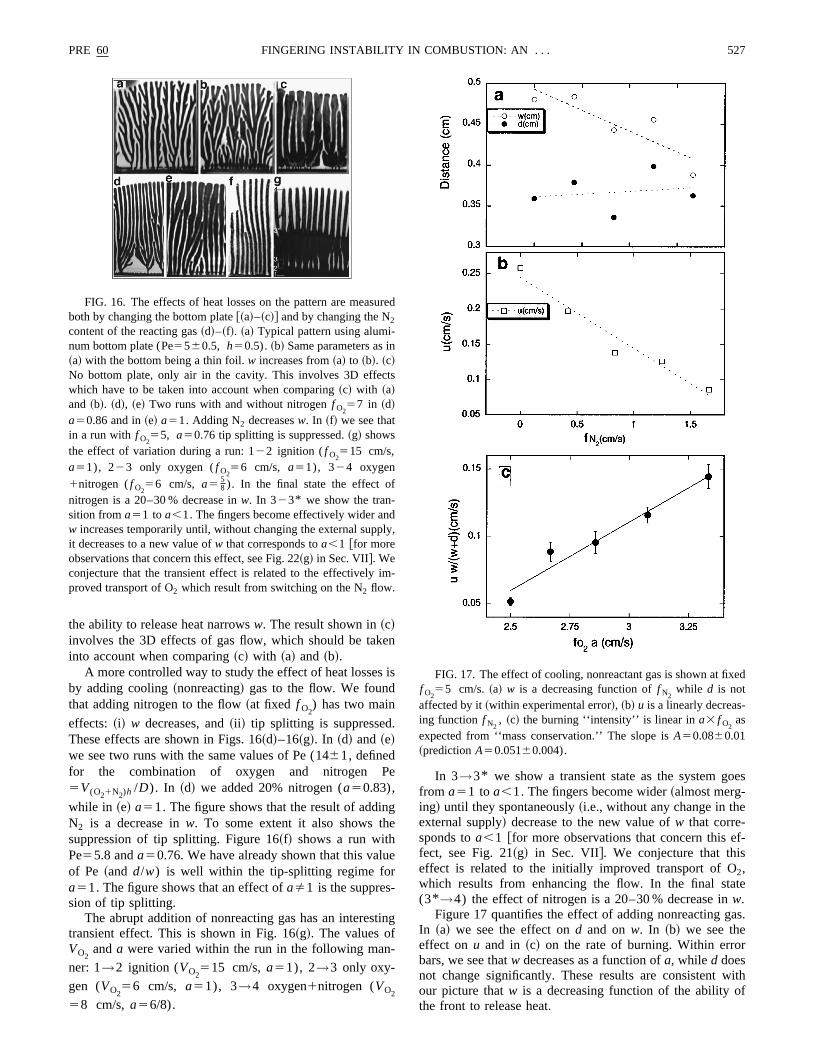
FIG. 16. The effects of heat losses on the pattern are measboth by changing the bottom plate@~a!–~c!# and by changing the N2content of the reacting gas~d!–~f!. ~a! Typical pattern using alumi-num bottom plate (Pe5560.5, h50.5).~b! Same parameters as i~a! with the bottom being a thin foil.w increases from~a! to ~b!. ~c!No bottom plate, only air in the cavity. This involves 3D effecwhich have to be taken into account when comparing~c! with ~a!and ~b!. ~d!, ~e! Two runs with and without nitrogenf O2
57 in ~d!
a50.86 and in~e! a51. Adding N2 decreasesw. In ~f! we see thatin a run with f O2
55, a50.76 tip splitting is suppressed.~g! showsthe effect of variation during a run: 122 ignition (f O2
515 cm/s,a51), 223 only oxygen (f O2
56 cm/s, a51), 324 oxygen
1nitrogen (f O256 cm/s, a5
58 ). In the final state the effect o
nitrogen is a 20–30 % decrease inw. In 323* we show the tran-sition froma51 to a,1. The fingers become effectively wider anw increases temporarily until, without changing the external supit decreases to a new value ofw that corresponds toa,1 @for moreobservations that concern this effect, see Fig. 22~g! in Sec. VII#. Weconjecture that the transient effect is related to the effectivelyproved transport of O2 which result from switching on the N2 flow.
n
s
g
In 3→3* we show a transient state as the system gfrom a51 to a,1. The fingers become wider~almost merg-ing! until they spontaneously~i.e., without any change in theexternal supply! decrease to the new value ofw that corre-sponds toa,1 @for more observations that concern this efect, see Fig. 21~g! in Sec. VII#. We conjecture that thiseffect is related to the initially improved transport of O2,which results from enhancing the flow. In the final sta(3*→4) the effect of nitrogen is a 20–30 % decrease inw.
Figure 17 quantifies the effect of adding nonreacting gIn ~a! we see the effect ond and onw. In ~b! we see theeffect onu and in ~c! on the rate of burning. Within errobars, we see thatw decreases as a function ofa, while d doesnot change significantly. These results are consistent wour picture thatw is a decreasing function of the ability othe front to release heat.
ed
,
-
FIG. 17. The effect of cooling, nonreactant gas is shown at fixf O2
55 cm/s.~a! w is a decreasing function off N2while d is not
affected by it~within experimental error!, ~b! u is a linearly decreas-ing function f N2
, ~c! the burning ‘‘intensity’’ is linear ina3 f O2as
expected from ‘‘mass conservation.’’ The slope isA50.0860.01~predictionA50.05160.004).
-ti
e-
dyer
nhe
the
atedure-
y to
theract
nt
c-nd
dt
cti
,ingfin-f the
tern
528 PRE 60ORY ZIK AND ELISHA MOSES
The linear decrease ofu and of the amount of burnt material can be compared to the mass conservation equa@Eq. ~3.3!#. We write this equation as
uw
w1d5Aa. ~6.1!
Figure 17~c! shows a plot ofu(w/w1d) as a function off O2
a at fixed f O253 cm/s. The linear behavior is as pr
dicted. The slope isA50.0860.01 ~prediction from sto-ichiometric considerations:A50.05160.004). The discrep-ancy may be due to other effects of the addition of N2 thatwe may be missing.
We point out that the highest percentage of N2 that al-lowed flame propagation in our system was 40%~at h50.6 cm). This result is expected to be relevant for stuing the occurrence of the fingering effect under atmosphconditions.
There is at present no theoretical framework that accoufor the experimentally observed connection between thelosses and finger width. A first step is to derivew by com-paring the heat losses from an isolated finger to the heatis released by the combustion of that finger. The main hloss channels that should be taken into account are~i! advec-tion of hot gases by the wind,~ii ! conduction from the hot
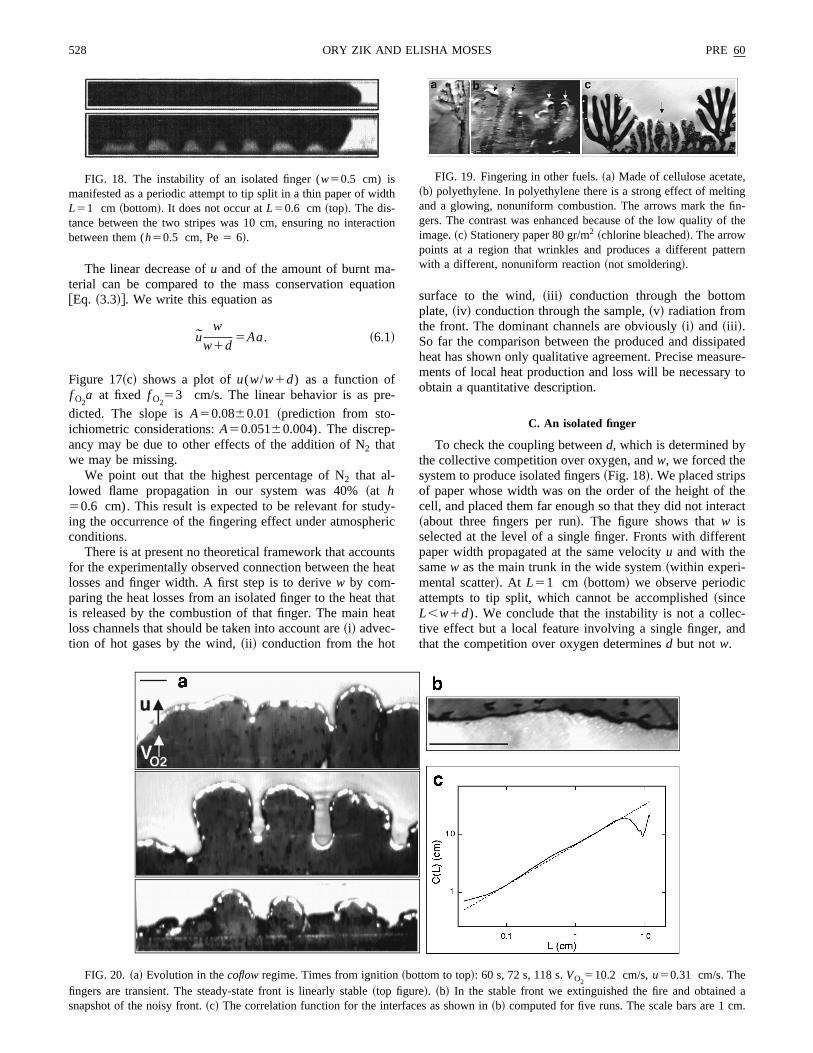
FIG. 18. The instability of an isolated finger (w50.5 cm) ismanifested as a periodic attempt to tip split in a thin paper of wiL51 cm ~bottom!. It does not occur atL50.6 cm~top!. The dis-tance between the two stripes was 10 cm, ensuring no interabetween them (h50.5 cm, Pe5 6!.
on
-ic
tsat
atat
surface to the wind,~iii ! conduction through the bottomplate,~iv! conduction through the sample,~v! radiation fromthe front. The dominant channels are obviously~i! and ~iii !.So far the comparison between the produced and dissipheat has shown only qualitative agreement. Precise measments of local heat production and loss will be necessarobtain a quantitative description.
C. An isolated finger
To check the coupling betweend, which is determined bythe collective competition over oxygen, andw, we forced thesystem to produce isolated fingers~Fig. 18!. We placed stripsof paper whose width was on the order of the height ofcell, and placed them far enough so that they did not inte~about three fingers per run!. The figure shows thatw isselected at the level of a single finger. Fronts with differepaper width propagated at the same velocityu and with thesamew as the main trunk in the wide system~within experi-mental scatter!. At L51 cm ~bottom! we observe periodicattempts to tip split, which cannot be accomplished~sinceL,w1d). We conclude that the instability is not a colletive effect but a local feature involving a single finger, athat the competition over oxygen determinesd but notw.
h
on
FIG. 19. Fingering in other fuels.~a! Made of cellulose acetate~b! polyethylene. In polyethylene there is a strong effect of meltand a glowing, nonuniform combustion. The arrows mark thegers. The contrast was enhanced because of the low quality oimage.~c! Stationery paper 80 gr/m2 ~chlorine bleached!. The arrowpoints at a region that wrinkles and produces a different patwith a different, nonuniform reaction~not smoldering!.
d am.
FIG. 20. ~a! Evolution in thecoflowregime. Times from ignition~bottom to top!: 60 s, 72 s, 118 s.VO2510.2 cm/s,u50.31 cm/s. The
fingers are transient. The steady-state front is linearly stable~top figure!. ~b! In the stable front we extinguished the fire and obtainesnapshot of the noisy front.~c! The correlation function for the interfaces as shown in~b! computed for five runs. The scale bars are 1 c

the
w
ctngaw
pe
.ithy
-endn
th
tuor
heope.tne
as
he
et
ndoifi21
w.
ple.thee
lytal
to
d
-n,ls
le
efttslly
un
-
PRE 60 529FINGERING INSTABILITY IN COMBUSTION: AN . . .
VII. OTHER OBSERVATIONS
In this section we present a number of observationshighlight some of the unique features of this system, as was providing additional information on the issues thatdiscussed above.
A. The effect of changing fuel
It is essential for practical implications to know the effeof different fuels. We have checked various materials raing from stationery paper to plastics. All the materials thwe checked exhibited the fingering effect. Figure 19 shofingering patterns in a dialysis bag~a!, in a polyethylenesheet~b!, and in stationery (80 g /m2) paper~c!.
Our measurements were mostly performed with paproduced by Whatman. We mostly used grade no. 2~thick-nessd50.019 cm, ash%50.06!. We also studied grades no1, 2, 3, 40, and 91. Grade no. 3 is similar to no. 2 but wd50.039 cm. The change of paper thickness had onlminor effect on our results ofd, w, andu. Grade no. 40 is‘‘ashless’’ ~ash%5 0.007!. This affects the color of the pattern, which tends to be more ‘‘brown’’ than ‘‘black.’’ Gradno. 91 is highly anisotropic. This reduces the uniformity areproducibility but otherwise did not have any significaeffect on the pattern.
B. The coflow regime
Our setup allows us to perform measurements whenfront propagates with the wind~coflow regime!. In this re-gime the front is slower and more stable. This counterintive result is related to the fact that the combustion is mintense and all the fuel is consumed~no char is left!. Figure20 shows the typical evolution in the coflow regime. Tfront is initially unstable. However, the fingers that develare a transient state. After the transient the fingers merg
Stable or marginally stable fronts sometimes exhibiroughness exponent that characterizes the growth mecha@34,35#. In Fig. 20~b! we show a picture of the front in thdeveloped state. The height-height correlation functionC(L)is shown in~c!. It extends over two decades, showing thC(L);Lx with x50.66 ~average over five measurement!.Correlations in coflow flames~parallel to gravitational con-nection! were measured previously in the context of tKardar-Parisi-Zhang~KPZ! model @34,36#.
We checked that mass conservation@Eq. ~3.3!# holds alsoin the coflow regime~with w/w1d51 anddb50). That is,u5AVO2
, where A5rO2(h2dub)/(mrubdub). With the
above data,A50.039. Our measurements in the coflow rgime yield a slope ofA50.04560.05, in rough agreemenwith the calculation.
C. Other features of the pattern
There are many qualitative observations that we havedescribed previously. These observations were performeruns that had nonuniformities or ‘‘defects’’ and were nused for the quantitative analysis. Yet they contain signcant information on various features of this effect. In Fig.we show a collage of these observations.~a! and~b! show theeffect of nonuniformity on the pattern.~a! shows the effect ofnonuniformity in the initial conditions~arrow in the figure!.
atll
e
-ts
r
a
t
e
i-e
aism
t
-
otin
t-
The result is a concave front with a ‘‘defect’’ line.~b! showsthe convex pattern that results from a nonuniform gas floThe experimental parameters for~a! and ~b! were Pe5 8,h50.6, and Whatman paper no. 3.~c! shows the growth oftwo clusters that were ignited at the two ends of the sam~d! shows a pattern near the onset that was ignited inmiddle and grew in a nonuniform flow field. The ‘‘sidbranching’’ is due to the nonuniformity.~e! shows how thereis screening of ‘‘clusters’’ in a nonuniform field and not onof fingers.~f! shows a run in which we attached a horizongrid of stick tape to the bottom plate. The pattern is seeninteract with the underlying grid.~g! shows a run in whichwe changed the supply abruptly from 100% O2 to 100% N2:w initially increases andd decreases, due to the improvetransport of O2 @see Fig. 16~g!#. Then the fingers narrowdown until extinction. In~h! we show the transition that occurs by cutting Pe abruptly to 0.08 in the middle of a ruwith nonuniform ignition. The single finger that prevaipropagates horizontally at the edge of the sample. In~i!, ~j!,and ~k! we show two fingers that evolve from a singbranch, after nonuniform ignition near extinction~Pe 51!.They slowly grow together until a fluctuation causes the lfinger to prevail, driving tip splitting. Notice the bright spoon the tips. In the tip-splitting regime these spots typicaappear before the extinction of a finger@see also Fig. 6~e!#.In ~l! we show propagation slightly above onset. In this rwe did not use our ‘‘normal’’ boundary conditions~whichare heat conductive and slightly elevated!, but left the bound-
FIG. 21. Qualitative observations with nonuniformities.~a! Adefect line with a concave front,~b! convex pattern from a nonuniform gas flow,~c! ‘‘merging’’ of clusters,~d! nonuniform ignitionand flow near the onset,~e! ‘‘cluster screening,’’~f! interaction witha horizontal grid,~g! response to a change from 100% O2 to 100%N2, ~h! changing from Pe5 6 to Pe5 0.08,~i!–~k! two fingers tipsplit near extinction,~l! above onset with free boundaries,~m! theextinction of ~l!, ~n!–~p! ‘‘secondary’’ finger with largeh, ~q!–~s!growing past an obstacle.

thpe
l
inatstas
ity
itit
Th
ic
o
eat
ita-nsity
av-aveherher
ac-ni-
edoned
erg,y,
arecal
530 PRE 60ORY ZIK AND ELISHA MOSES
aries free. Consequently, we observe a glowing flamepropagates inwards from the lateral boundaries of the pa~arrows in the figure!. ~m! shows the same pattern after thoxygen was cut and nitrogen fed in~after about 5 s!. Thecutting of oxygen~from Pe5 18 to Pe5 0! causes a graduadecrease ofw and selection ofd. Then we fed 100% of N2(a50) andw grew until extinction.~n!, ~o!, and~p! show a3D effect: propagation of a finger with a glowing flamethe char, in a system with a very large gap between the pl(h53 cm).~q!, ~r!, and~s! show how the pattern grows paan obstacle. The obstacle is a part in the paper that h‘‘crumple’’ that blocks the oxygen flow.
VIII. SUMMARY AND CONCLUSIONS
We detailed the previously reported fingering instabilin combustion, which occurs when a solid fuel~e.g., paper!is forced to burn against an oxygen-rich wind, below a crcal Ra. The nondimensional control parameter of the effecthe Peclet number.
The two length scales of the system are decoupled:spacing between fingers is determined by the Pe´clet number.This dependence quantitatively verifies a phenomenologmodel which we base on reactant transport~without any fitparameters!. The same model qualitatively applies to electrchemical deposition.
i-
-
d
ys
. A
oR
ater
es
a
-is
e
al
-
Within the phenomenological model that disregards hlosses, the finger width is independent of the Pe´clet number.It is linearly dependent on the system height. This quanttive dependence is in line with qualitative observatiowhich show that the finger width is determined by the abilof the front to release heat.
For further experimental research we point out the behior near the onset, where our preliminary observations halready shown interesting spatiotemporal modes. Anotexperimental challenge is to expand our analysis to otgrowth systems.
From the theoretical viewpoint, there is still a need forlinear theory of the instability. The analogy between eletrodeposition and combustion opens the possibility for a uversal description of some aspects in diffusion limitgrowth. This should go along with a theoretical identificatiof the class of instabilities that exhibit the behavior describin this paper.
ACKNOWLEGMENTS
We take pleasure in thanking J.-P. Eckmann, J. FinebB. Greenberg, T. Kashiwagi, B. Matkowsky, G. Sivashinskand V. Steinberg for fruitful discussions. Special thanksdue to Z. Olami who collaborated on the phenomenologimodel in combustion.
ys.
tion
rg,
ol.
V.
tz,
ter,
. E
at
@1# M. Faraday,The Chemical History of a Candle, edited by W.Crookes~Chatto & Windus, London, 1882!.
@2# O. Zik, Z. Olami, and E. Moses, Phys. Rev. Lett.81, 3868~1998!; O. Zik, Ph.D. thesis, The Weizmann Institute of Scence, 1998~unpublished!; O. Zik and E. Moses,Proceedingsof the 27th International Symposium on Combustion~TheCombustion Institute, Boulder, 1998!, pp. 2815–2820.
@3# P. Pelce,Dynamics of Curved Fronts~Academic Press, Boston, 1988!.
@4# J. Krug and H. Spohn,Solids Far From Equilibrium~Cam-bridge University Press, Cambridge, 1992!.
@5# A.-L. Barabasi and H. E. Stanley,Fractal Concepts in SurfaceGrowth ~Cambridge University Press, Cambridge, Englan1995!.
@6# T. Halpin-Healey and Y.-C. Zhang, Phys. Rep.254, 215~1995!.
@7# Y. Couder, inChaos, Order and Patterns, edited by R. Artuso,P. Cvitanovic, and G. Casati~Plenum Press, New York, 1991!,p. 203.
@8# W. W. Mullins and R. F. Sekerka, J. Appl. Phys.35, 444~1964!.
@9# J. S. Langer, Rev. Mod. Phys.52, 1 ~1980!.@10# J. M. Flesseles, A. J. Simon, and A. J. Libchaber, Adv. Ph
40, 1 ~1991!.@11# P. G. Saffman and G. I. Taylor, Proc. R. Soc. London, Ser
245, 312 ~1958!.@12# For a similar dependence of spacing between fingers
growth velocity in eutectic growth, see V. Seetharaman andTrivedi, Metall. Trans. A19, 2956~1988!.
,
.
n.
@13# J.-P. Eckmann~private communication!.@14# G. I. Sivashinsky, Annu. Rev. Fluid Mech.15, 179 ~1983!.@15# P. Pelce and P. Clavin, J. Fluid Mech.124, 219 ~1982!.@16# S. Smithells and K. Ingle, J. Chem. Soc.61, 204 ~1882!.@17# M. Gorman, M. el-Hamdi, B. Pearson, and K. A. Robins, Ph
Rev. Lett.76, 228 ~1996!.@18# J. de-Ris,Proceedings of the 12th Symposium on Combus
~The Combustion Institute, Pittsburgh, 1969!.@19# A. E. Frey and J. S. T’ien, Combust. Flame36, 263 ~1979!.@20# A. E. Frey and J. S. T’ien, Combust. Flame26, 257 ~1976!.@21# Y. Zhang, P. D. Ronney, E. V. Roegner, and J. B. Greenbe
Combust. Flame90, 71 ~1992!.@22# A. P. Aldushin and B. J. Matkowsky, Combust. Sci. Techn
133, 293 ~1998!.@23# A. C. Fernandez-Pello, B. J. Matkowsky, D. A. Schult, and
A. Volpert, Combust. Flame101, 471 ~1995!.@24# T. Kashiwagi and S. L. Olson, Proceeding of USMP-3~Na-
tional Academy of Science, Washington, DC, 1997!.@25# For the definition of Pe, see L. D. Landau and E. M. Lifshi
Fluid Mechanics209 ~Pergmanon Press, London, 1976!. For adiscussion on the role of Pe in smoldering, see J. BuckmasIMA J. Appl. Math. 56, 87 ~1996!.
@26# O. Zik and E. Moses, Phys. Rev. E53, 1760~1995!.@27# O. Zik, Physica A224, 338 ~1996!.@28# O. Zik, T. Kustanovich, E. Moses, and Z. Olami, Phys. Rev
58, 689 ~1998!.@29# The Micro Analysis Laboratory, the Hebrew University, Giv
Ram, Jerusalem, Israel.@30# CRC Handbook of Chemistry and Physics, 73rd ed., edited by
e- tt.
n,
PRE 60 531FINGERING INSTABILITY IN COMBUSTION: AN . . .
D. R. Lide ~CRC Press, Boca Raton, 1993!.@31# We expect Pec , as well as the characteristic lengthw, to be
explicitly given by a linear stability analysis of the onset rgime ~which must include an analysis of the heat transport!.
@32# V. Fleury, J. H. Kaufman, and D. B. Hilbert, Nature~London!367, 435 ~1994!.
@33# A. Kuhn and F. Argoul, Phys. Rev. E49, 4298~1994!.
@34# M. Kardar, G. Parisi, and Y.-C. Zhang, Phys. Rev. Lett.56,889 ~1986!.
@35# O. Zik, E. Moses, Z. Olami, and I. Webman, Europhys. Le38, 509 ~1997!.
@36# J. Zhang, Y. C. Zhang, P. Alstrom, and M. T. LevinsoPhysica A189, 383 ~1992!.


![Combustion Noise S. Moreau in Modern Aero- · PDF fileTsien [52] in a rocket engine combustion instability ... forward to conclude that an unsteady heat release q' of ... Predicting](https://static.fdocuments.in/doc/165x107/5a95a53a7f8b9adb5c8c8d7a/combustion-noise-s-moreau-in-modern-aero-52-in-a-rocket-engine-combustion-instability.jpg)

