1990 The application of granulation to fine coal preparation

©2017 GAI CONSULTANTS, INC. transforming ideas into reality®
Fine Coal Refuse – 25 Years of
Field and Laboratory Testing
Data and Correlations
October 1, 2018
Blaise E. Genes
Gonzalo Castro, Ph.D., P.E.
Thomas O. Keller, P. E.
Fatma Ciloglu, Ph.D., P. E.

©2017 GAI CONSULTANTS, INC. transforming ideas into reality®
1. Introduction
2. Upstream-Constructed Coal Refuse
Impoundments and Key Design Aspects
3. Fine Coal Refuse (FCR) In-Situ Field and
Laboratory Testing
4. FCR Field and Laboratory Data Application
Summary
5. FCR Data Correlations
6. FCR Undrained Strength Analyses Examples
Presentation Outline

©2017 GAI CONSULTANTS, INC. transforming ideas into reality®
Evaluated FCR tailings at numerous WV, KY and IL
impoundment sites since 1991 – 10 WV, 2 KY, 3 IL.
Amassed a database of field and laboratory data
from 15 large, high-hazard upstream-constructed
impoundments.
CPT-based evaluations and undrained strength
analyses performed to evaluate:
Material characteristics;
Liquefaction triggering;
Post-earthquake stability; and
Construction loading rate.
Introduction

©2017 GAI CONSULTANTS, INC. transforming ideas into reality®
02
03
Oldhouse Branch
02
03
Delta
Delta
Stage J Embankment
Upstream-Constructed Coal Refuse Impoundments
Some of the tallest earth
structures in the world;
Unique characteristics;
FCR hydraulically-
deposited and used as
foundation for subsequent
embankment construction;
FCR requires sufficient
time to settle and excess
pore pressure to dissipate;
Undrained conditions
control upstream pushout
and seismic loading;

©2017 GAI CONSULTANTS, INC. transforming ideas into reality®
Key design aspects:
Developing and implementing risk-appropriate
in-situ field and laboratory testing;
Evaluating FCR material characteristics, i.e., does
FCR behave more sand-like or clay-like;
Estimating undrained shear strength and Su/s’v ratio;
Evaluating if strength loss is triggered due to
undrained loading event;
Evaluating post-earthquake stability with appropriate
Su and corresponding safety factor; and,
Evaluating incremental Su required vs. Su gained due
to excess pore pressure and consolidation.
Upstream-Constructed Coal Refuse Impoundments

©2017 GAI CONSULTANTS, INC. transforming ideas into reality®
Field Testing Methods
In-Situ Field Testing Methods:
Cone Penetration Testing
(CPT);
Shear wave velocity
measurements;
Pore-pressure dissipation
and vane shear testing;
Fixed-piston undisturbed
sampling; and,
In-situ/in-tube void ratio.

©2017 GAI CONSULTANTS, INC. transforming ideas into reality®
PS-CPT Field Testing Data
FP
FP
FP
FP
FP
FP
©2017 GAI CONSULTANTS, INC. transforming ideas into reality®
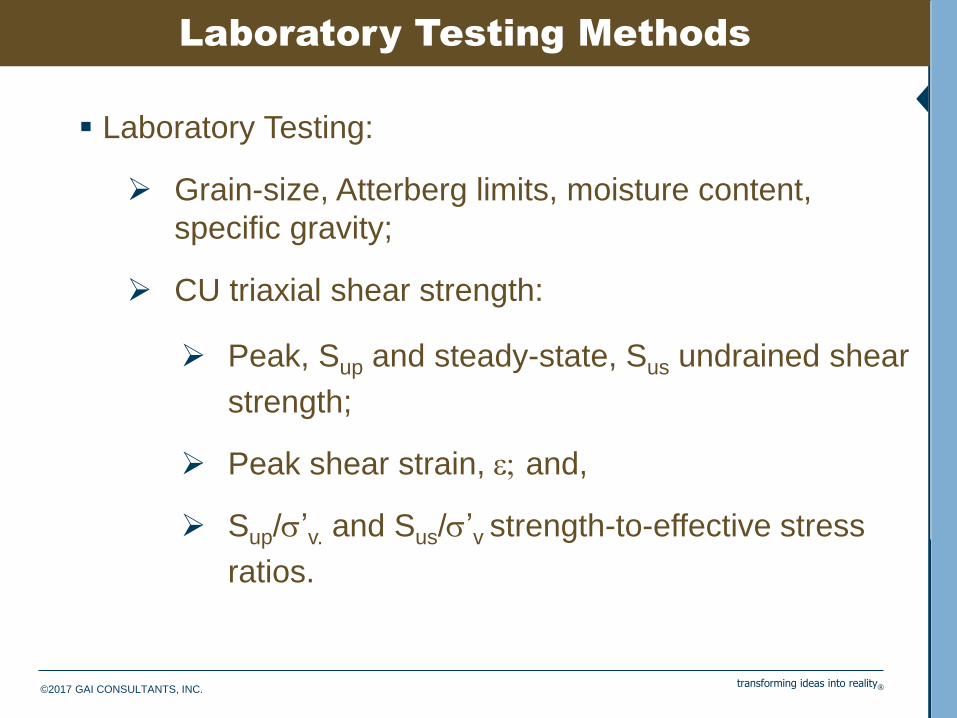
Laboratory Testing Methods
Laboratory Testing:
Grain-size, Atterberg limits, moisture content,
specific gravity;
CU triaxial shear strength:
Peak, Sup and steady-state, Sus undrained shear
strength;
Peak shear strain, e; and,
Sup/s’v. and Sus/s’v strength-to-effective stress
ratios.

©2017 GAI CONSULTANTS, INC. transforming ideas into reality®
Characterizing FCR From Lab Testing
Key Differences – Sand-like or Clay-like Behavior:
Strain at peak undrained shear strength
Abruptness of the drop-off in shearing resistance
Material characterization depends on laboratory data
(% passing #200, plasticity, peak strain), which
influence behavior.
MSHA. 2009

©2017 GAI CONSULTANTS, INC. transforming ideas into reality®
P. K. Robertson and C. E. (Fear) Wride, (1998).
Characterizing FCR From CPT
Site 6
Site 7
Site 8
Site 9
Site 10
Site 12
Site 13
Site 14
Site 15
After MSHA. 2009
©2017 GAI CONSULTANTS, INC. transforming ideas into reality®
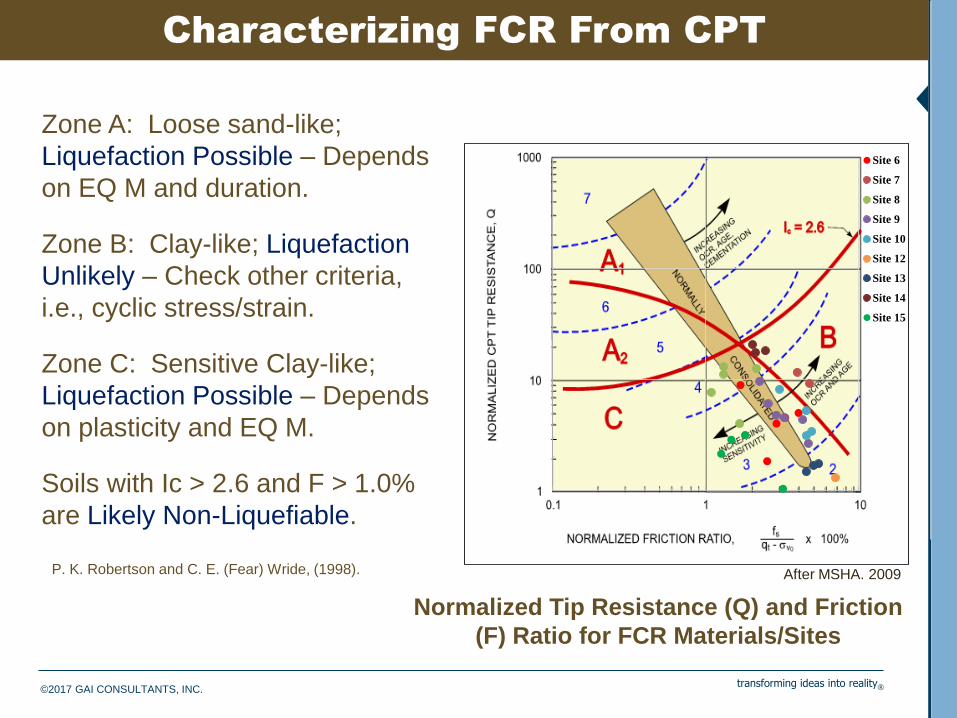
Characterizing FCR From CPT
P. K. Robertson and C. E. (Fear) Wride, (1998).
Zone A: Loose sand-like;
Liquefaction Possible – Depends
on EQ M and duration.
Zone B: Clay-like; Liquefaction
Unlikely – Check other criteria,
i.e., cyclic stress/strain.
Zone C: Sensitive Clay-like;
Liquefaction Possible – Depends
on plasticity and EQ M.
Soils with Ic > 2.6 and F > 1.0%
are Likely Non-Liquefiable.
Site 6
Site 7
Site 8
Site 9
Site 10
Site 12
Site 13
Site 14
Site 15
Normalized Tip Resistance (Q) and Friction
(F) Ratio for FCR Materials/Sites
After MSHA. 2009

©2017 GAI CONSULTANTS, INC. transforming ideas into reality®
Peak Undrained Strength vs. Shear Strain
0
1
2
3
4
5
6
7
8
9
10
0 2 4 6 8 10 12 14 16 18 20 22 24 26 28 30 32 34 36
Pea
k U
nd
rain
ed S
hea
r S
tren
gth
, S
up, k
sc
Shear Strain at Peak Strength, %
Peak Undrained Shear Strength vs Shear Strain
Site 1
Site 2
Site 3
Site 4
Site 5
Site 6
Site 7
Site 8
Site 9
Site 10
Site 12
Site 13
Site 15
Sand-Like Clay-Like
Summary of Shear Strain Range for Laboratory Tested FCR Samples

©2017 GAI CONSULTANTS, INC. transforming ideas into reality®
Characterizing FCR
High quality undisturbed samples used to measure
Sus and Sup.
Sus measured in the laboratory will be higher than in-
situ.
Disturbance accounted for by correcting laboratory
Sus back to the in-situ Sus , which requires:
1. Careful measurement of void ratio during
sampling and handling; and,
2. Estimating slope of the Steady-State Line
(De/DlogSus).
Laboratory-Derived Undrained Strength

©2017 GAI CONSULTANTS, INC. transforming ideas into reality®
Laboratory-Field Undrained Strength
Correction of Sus from Laboratory to In-Situ Void Ratio
MSHA. 2009
©2017 GAI CONSULTANTS, INC. transforming ideas into reality®
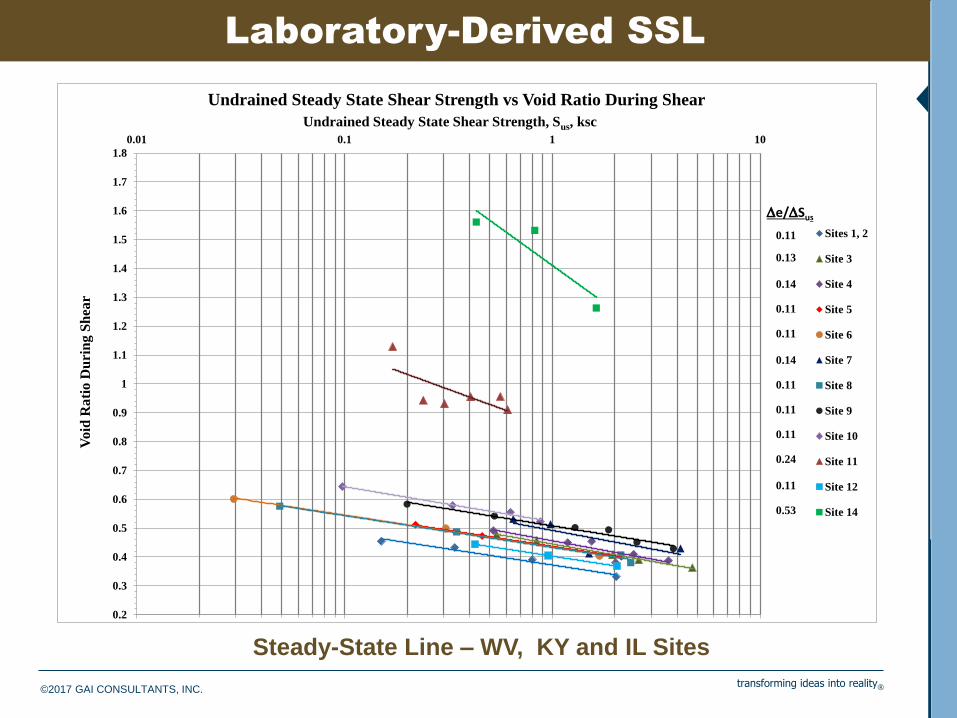
Laboratory-Derived SSL
0.2
0.3
0.4
0.5
0.6
0.7
0.8
0.9
1
1.1
1.2
1.3
1.4
1.5
1.6
1.7
1.8
0.01 0.1 1 10
Vo
id R
ati
o D
uri
ng
Sh
ear
Undrained Steady State Shear Strength, Sus, ksc
Undrained Steady State Shear Strength vs Void Ratio During Shear
Sites 1, 2
Site 3
Site 4
Site 5
Site 6
Site 7
Site 8
Site 9
Site 10
Site 11
Site 12
Site 14
0.11
0.13
0.14
0.11
0.11
0.14
0.11
0.11
0.11
0.24
0.11
0.53
De/DSus
Steady-State Line – WV, KY and IL Sites

©2017 GAI CONSULTANTS, INC. transforming ideas into reality®
Characterizing FCR
CPT data and Sup/s’v or Sus/s’v used in engineering
analyses to evaluate:
Liquefaction…will the undrained loading trigger
a strength loss in FCR?
Yes…Use Sus/s’v
No…Use Sup/s’v
Post-earthquake stability factors of safety; and,
Pushout strength required for 1.3 safety factor
in construction stability.
Applications for Testing Data
©2017 GAI CONSULTANTS, INC. transforming ideas into reality®
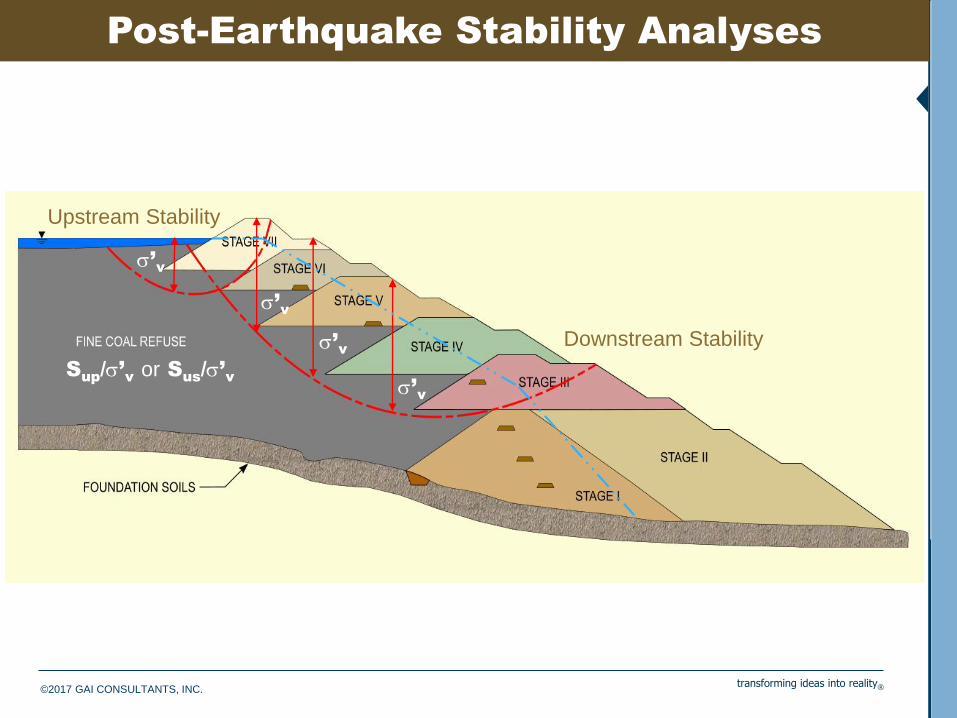
Post-Earthquake Stability Analyses
Sup
/s’v
or Sus
/s’v
s’v
s’v
s’v
s’v
Downstream Stability
Upstream Stability

©2017 GAI CONSULTANTS, INC. transforming ideas into reality®
Laboratory-Derived FCR Sus
0
1
2
3
4
5
6
7
8
9
10
11
12
0.0 0.5 1.0 1.5 2.0 2.5 3.0 3.5 4.0 4.5 5.0 5.5 6.0
Est
ima
ted
Ver
tica
l E
ffec
tiv
e S
tres
s, k
sc
Undrained Steady State Shear Strength In-Situ, Sus, ksc
Undrained Steady State Shear Strength In-Situ vs Estimated Vertical Effective Stress
Site 1
Site 2
Site 3
Site 4
Site 5
Site 6
Site 7
Site 8
Site 9
Site 10
Site 12
Sus = 0.16 s'v
Sus min = 0.03 s'v Sus max = 0.27 s'v
Undrained Steady-State Shear Strength to Effective Stress Strength Ratio

©2017 GAI CONSULTANTS, INC. transforming ideas into reality®
Laboratory-Derived Undrained Strength
Literature Correlations of Sus/s’v from Failure Cases
Sus
/s’v
Correlations - References
MSHA. 2009

©2017 GAI CONSULTANTS, INC. transforming ideas into reality®
Laboratory-Derived FCR Sup
0
1
2
3
4
5
6
7
8
9
10
11
12
0.0 0.5 1.0 1.5 2.0 2.5 3.0 3.5 4.0 4.5 5.0 5.5 6.0
Est
imate
d V
erti
cal
Eff
ecti
ve
Str
ess,
ksc
Peak Undrained Shear Strength In-Situ, Sup ksc
Peak Undrained Shear Strength In-Situ vs Estimated Vertical Effective Stress
Site 1
Site 2
Site 3
Site 4
Site 5
Site 6
Site 7
Site 8
Site 9
Site 10
Site 12
Site 13
Site 14
Site 15
Sup = 0.24 s'v
Sup min = 0.19 s'v Sup max = 0.35 s'v
Peak Undrained Shear Strength to Effective Stress Strength Ratio

©2017 GAI CONSULTANTS, INC. transforming ideas into reality®
Laboratory-Derived Undrained Strength
Sus vs. Soil Behavior Index, Ic Sus vs. Laboratory Fines Content
0
0.5
1
1.5
2
2.5
3
3.5
4
0.0 0.5 1.0 1.5 2.0 2.5 3.0 3.5 4.0 4.5 5.0
Su
s, k
sc
Ic, dim
Sus vs. Ic
Site 6
Site 7
Site 8
Site 9
Site 10
Site 12
Site 13
y = 0.589x - 1.0939
R² = 0.0995
0
0.5
1
1.5
2
2.5
3
3.5
4
0 10 20 30 40 50 60 70 80 90 100
Su
s, k
sc
Fines Content, %
Sus vs. FC Lab
Site 6
Site 7
Site 8
Site 9
Site 10
Site 12
Site 13
y = 0.0111x
R² = -0.328
Fines Data Correlations – Sus

©2017 GAI CONSULTANTS, INC. transforming ideas into reality®
Laboratory-Derived Undrained Strength
Sus vs. N1,60 Relationship Sup vs. N1,60 Relationship
0
0.5
1
1.5
2
2.5
3
3.5
4
0 5 10 15
Su
s, k
sc
N1,60, bpf
Sus vs. N1,60
Site 6
Site 7
Site 8
Site 9
Site 10
Site 12
Site 13
y = 0.2715e0.1003x
R² = 0.2872
Lower Bound,
Seed & Harder
Lower Bound, GEI
0
0.5
1
1.5
2
2.5
3
3.5
4
0 5 10 15
Su
p,
ksc
N1,60, bpf
Sup vs. N1,60
Site 6
Site 7
Site 8
Site 9
Site 10
Site 12
Site 13
y = 0.6601e0.0697x
R² = 0.4033
Lower Bound,
Seed & Harder
Lower Bound, GEI
Data CorrelationsN1,60
Data Correlations – Sus
and Sup

©2017 GAI CONSULTANTS, INC. transforming ideas into reality®
Laboratory-Derived Undrained Strength
Undrained Steady-State Shear Strength, Sus vs. Shear Wave Velocity, Vs
0
0.5
1
1.5
2
2.5
3
3.5
4
4.5
5
5.5
6
0 100 200 300 400 500 600 700 800 900 1000
Un
dra
ined
Ste
ad
y-S
tate
Sh
ear
Str
eng
th, S
us,
ksc
Shear Wave Velocity, Vs, m/s
Undrained Steady-State Shear Strength vs Shear Wave Velocity
Site 3
Site 4
Site 6
Site 7
Site 8
Site 9
Site 10
Site 12
y = 0.0044x
R² = -0.049
Vs
Data Correlations – Sus
©2017 GAI CONSULTANTS, INC. transforming ideas into reality®
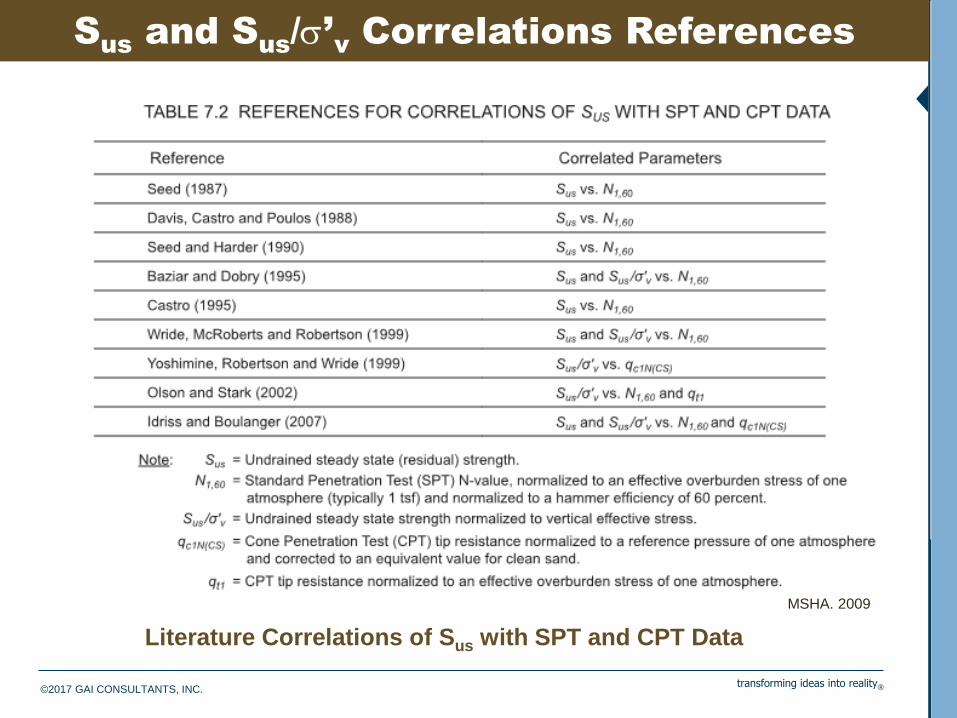
Laboratory-Derived Undrained Strength
Literature Correlations of Sus with SPT and CPT Data
Sus
and Sus
/s’v
Correlations References
MSHA. 2009

©2017 GAI CONSULTANTS, INC. transforming ideas into reality®
Staged Construction Stability Analysis
Su required for stability FS=1.3

©2017 GAI CONSULTANTS, INC. transforming ideas into reality®
Staged Construction Stability Analysis
Su required for stability FS=1.3Su required for stability FS=1.3

©2017 GAI CONSULTANTS, INC. transforming ideas into reality®
Staged Construction Stability Analysis
Su required for stability FS=1.3Su required for stability FS=1.3

©2017 GAI CONSULTANTS, INC. transforming ideas into reality®
Staged Construction Stability Analysis
Su required for stability FS=1.3

©2017 GAI CONSULTANTS, INC. transforming ideas into reality®
Staged Construction Stability Analysis
Su required for stability FS=1.3

©2017 GAI CONSULTANTS, INC. transforming ideas into reality®
Upstream-constructed impoundments must endure
high level of scrutiny particularly for seismic and push-
out construction undrained loading conditions.
25+ years of consistent field and laboratory testing of
FCR yielded a significant volume of high quality data.
FCR data and correlations present ranges to evaluate
peak and steady-state undrained shear strength in
absence of, or for data comparison.
Risk-appropriate site-specific testing should be
performed to estimate undrained shear strengths.
Site-specific FCR strength ultimately control
undrained strength analyses.
Conclusions
©2017 GAI CONSULTANTS, INC. transforming ideas into reality®
Fine Coal Refuse – 25 Years of
Field and Laboratory Testing
Data and Correlations
October 1, 2018
Blaise E. Genes
Gonzalo Castro, Ph.D., P.E.
Thomas O. Keller, P. E.
Fatma Ciloglu, Ph.D., P. E.
Questions??