Findings of a Student Retention Study University of Saskatchewan Overview of Findings: June 12, 2007...
52
Findings of a Student Retention Study University of Saskatchewan Overview of Findings: June 12, 2007 CACUSS 2007 Conference
-
Upload
magnus-ross -
Category
Documents
-
view
213 -
download
0
Transcript of Findings of a Student Retention Study University of Saskatchewan Overview of Findings: June 12, 2007...

Findings of a Student Retention Study
University of Saskatchewan
Overview of Findings: June 12, 2007
CACUSS 2007 Conference

Process
• 2003: University’s Enrolment Plan called for a study of retention patterns, degree completion, and explanations
• 2004: Planning and consultation • Winter 2005: Established an Advisory Group that
identified questions of interest, seconded a Computer Analyst to project
• Spring 2005: Narrowing of scope of cohort analysis, defining terms, realization of data limitations
• Summer 2005: Based on preliminary results & Identification of student-based studies
• Fall 2005: Hiring Retention Research Coordinator & Presentations of initial findings
• Winter 2006: Conducting student-based studies & Regular consultations/check-ins with Advisory Group
• Spring/Summer 2006: Final cohort based analysis• Fall 2006: Interpretation of findings, development of
presentations• Winter 2007: Presentations, drafting of final report• Spring 2007: Now….

Purpose of the Study
1. To conduct a cohort-based study of retention, attrition, and degree completion rates over the past few years
2. To better understand the reasons why students choose (or are required) to leave the University

Design
• Cohort-based longitudinal analysis:– What are the rates and patterns of student retention,
attrition and degree completion at the U of S?– Method: Longitudinal cohort-based analysis of data
held in the Student Information System
• Student-based studies:– What are the underlying reasons for student attrition
at the U of S and what factors promote student success, persistence and degree completion?
– Method: In-depth interviews, focus groups and surveys

Cohort-based analysisWhat are the rates and patterns of student retention,
attrition and degree completion at the U of S?
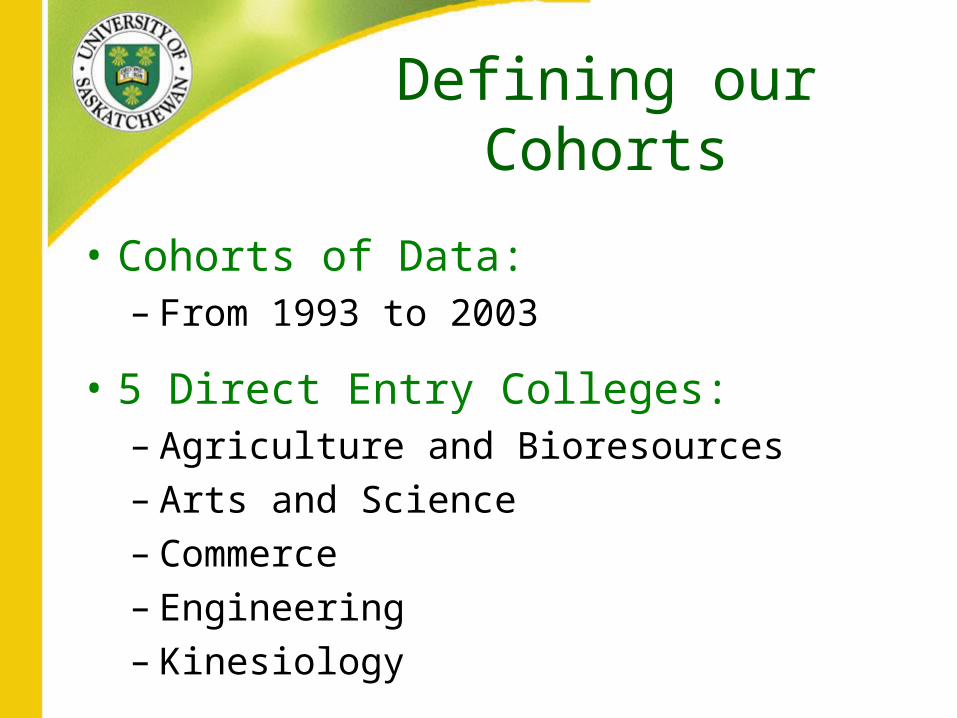
Defining our Cohorts
• Cohorts of Data:– From 1993 to 2003
• 5 Direct Entry Colleges:– Agriculture and Bioresources– Arts and Science– Commerce– Engineering– Kinesiology

Defining our Outcomes
• Retention Outcomes:– Degree completion (received degree)– Continued registration (current student)– Internal transfer (transferred to other U of S College)
• Attrition Outcomes:– Discontinued registration (academically eligible to
return)– Withdrawn registration (in midst of term)– Required to discontinue (by the institution)

Overall Retention and Attrition (All 5 Colleges Combined)
68.0 65.8 67.7 67.7 67.6 67.7 66.8 68.165.2
68.6
32.0 34.2 32.3 32.3 32.4 32.3 33.2 31.9 34.8 31.4
0
10
20
30
40
50
60
70
80
90
100
1993 1994 1995 1996 1997 1998 1999 2000 2001 2002
Cohort Year
Pe
rce
nta
ge
of
Stu
de
nts
Retention Attrition

Year to YearRetention Rates for
Each Cohort

70 69 70 72 71 72 7377
75 76 75
0
10
20
30
40
50
60
70
80
90
100
1993 1994 1995 1996 1997 1998 1999 2000 2001 2002 2003
Cohort Year
Pe
rce
nta
ge
of
Stu
de
nts
After 1 Year
Retention Rate for Each Cohort (After 1 Year)

Student OutcomesAfter 1 Year
0.5
62.69.4
11.9
8.8
6.8
Degree Completion
Continued Registration
Internal Transfer
Discontinued Registration
Withdrawn Registration
Required to Discontinue
1st Year Attrition ~27.5%

70 69 70 72 71 72 7377
75 76
6460
63 63 64 66 6770
67 69
0
10
20
30
40
50
60
70
80
90
100
1993 1994 1995 1996 1997 1998 1999 2000 2001 2002
Cohort Year
Pe
rce
nta
ge
of
Stu
de
nts
After 1 Year After 2 Years
Retention Rate for Each Cohort (After 2 Years)

70 69 70 72 71 72 7377
75
6460
63 63 64 66 6770
6764
60 62 63 6467 66
6965
0
10
20
30
40
50
60
70
80
90
100
1993 1994 1995 1996 1997 1998 1999 2000 2001
Cohort Year
Per
cen
tag
e o
f S
tud
ents
After 1 Year After 2 Years After 3 Years
Retention Rate for Each Cohort (After 3 Years)
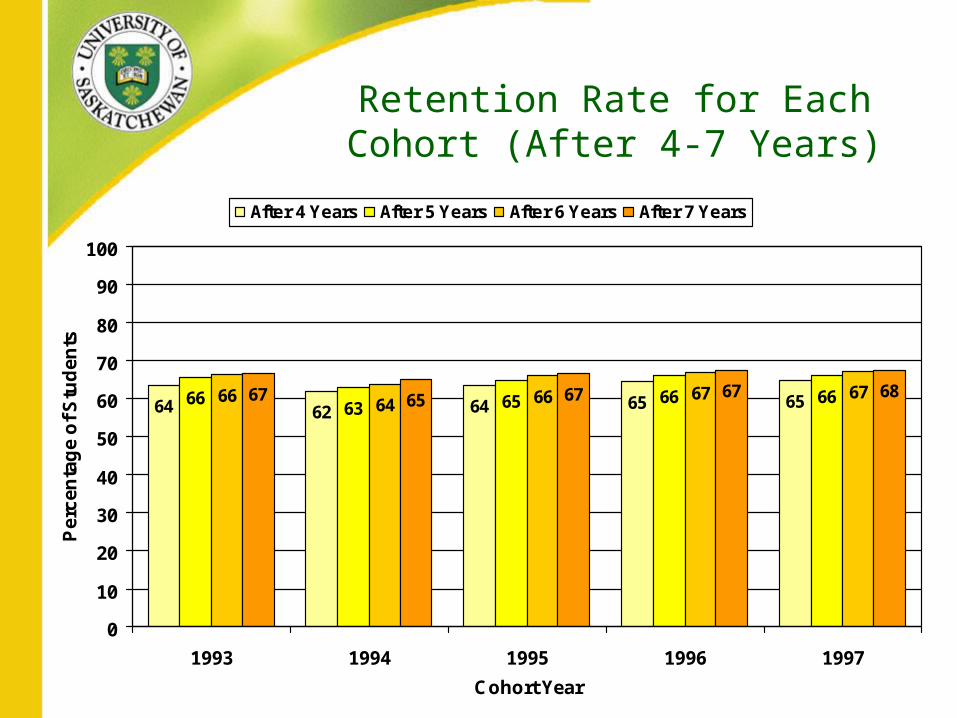
64 62 64 65 656663 65 66 6666 64 66 67 6767 65 67 67 68
0
10
20
30
40
50
60
70
80
90
100
1993 1994 1995 1996 1997
Cohort Year
Pe
rce
nta
ge
of
Stu
de
nts
After 4 Years After 5 Years After 6 Years After 7 Years
Retention Rate for Each Cohort (After 4-7 Years)

Retention Rates forEach College

Overall Retention by College
0
10
20
30
40
50
60
70
80
90
100
1993 1994 1995 1996 1997 1998 1999 2000 2001 2002
Cohort Year
Per
cen
tag
e o
f S
tud
ents
Agriculture Arts & Science Commerce Engineering Kinesiology

79
70
8177 7876
60
7875
7277
58
79 7673
0
10
20
30
40
50
60
70
80
90
100
Agriculture &Bioresources
Arts & Science Commerce Engineering Kinesiology
U of S College
Pe
rce
nta
ge
of
Stu
de
nts
After 1 Year After 2 Years After 3 Years
Retention Rate for Each College (After 1-3 Years)

77
59
8177
7379
59
8177
7379
60
8278
7478
60
8278
74
0
10
20
30
40
50
60
70
80
90
100
Agriculture &Bioresources
Arts & Science Commerce Engineering Kinesiology
U of S College
Pe
rce
nta
ge
of
Stu
de
nts
After 4 Years After 5 Years After 6 Years After 7 Years
Retention Rate for Each College (After 4-7 Years)

Degree Completion
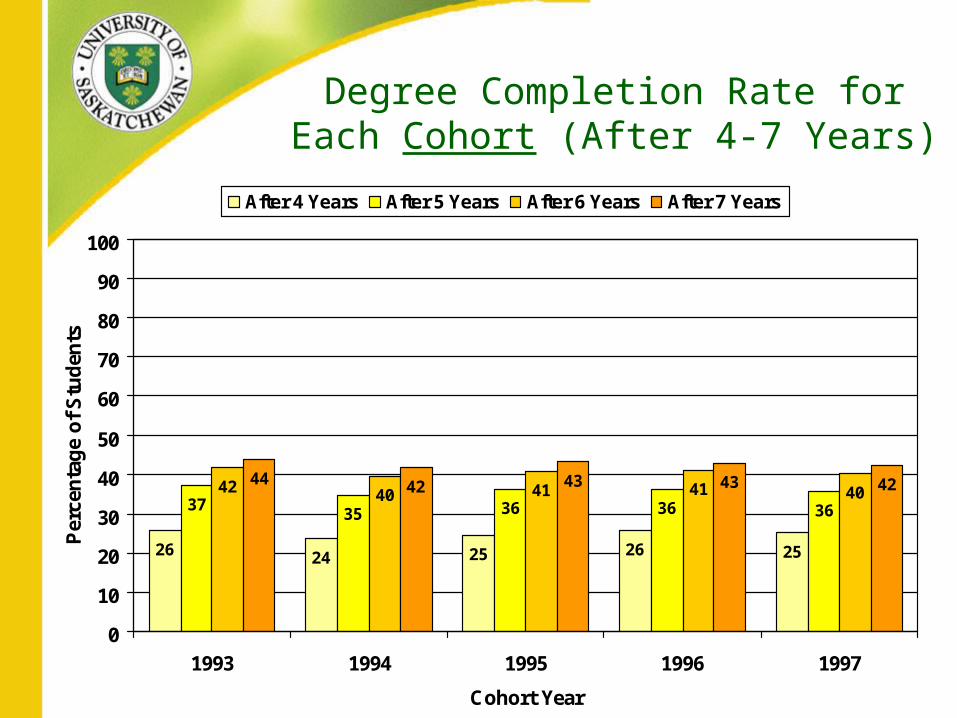
26 24 25 26 25
3735 36 36 36
42 40 41 41 4044 42 43 43 42
0
10
20
30
40
50
60
70
80
90
100
1993 1994 1995 1996 1997
Cohort Year
Per
cen
tag
e o
f S
tud
ents
After 4 Years After 5 Years After 6 Years After 7 Years
Degree Completion Rate for Each Cohort (After 4-7 Years)

Overall “Degree Completion”by College
0
10
20
30
40
50
60
70
80
90
100
1993 1994 1995 1996 1997
Cohort Year
Per
cen
tag
e o
f S
tud
ents
Agriculture Arts & Science Commerce Engineering Kinesiology

44
18
55
18
27
57
27
68
4542
59
31
71
5350
59
33
72
5550
0
10
20
30
40
50
60
70
80
90
100
Agriculture &Bioresources
Arts & Science Commerce Engineering Kinesiology
U of S College
Per
cen
tag
e o
f S
tud
ents
After 4 Years After 5 Years After 6 Years After 7 Years
Degree Completion Rate for Each College (After 4-7 Years)

Adjusted “Degree Completion”by College
0
10
20
30
40
50
60
70
80
90
100
1993 1994 1995 1996 1997
Cohort Year
Per
cen
tag
e o
f S
tud
ents
Agriculture Arts & Science Commerce Engineering Kinesiology

Adjusted “Degree Completion” by College (Average: 1993-1997)
59.7
35.2
73.1
56.7 51.6
6.9
16.3
4.3
11.413.3
0
10
20
30
40
50
60
70
80
90
100
Agriculture Arts & Science Commerce Engineering Kinesiology
Cohort Year
Pe
rce
nta
ge
of
Stu
de
nts
Additional Degree Completion After Transferring to Another U of S College
Degree Completion in College of Entry

• Origin of Student (entering point):– High school– Break after high school– Transferred from other post-secondary institution– Transferred from other U of S College
Defining our Students

0
10
20
30
40
50
60
70
80
90
100
1993 1994 1995 1996 1997 1998 1999 2000 2001 2002
Cohort Year
Per
cen
tag
e o
f S
tud
ents
High School Break After High School Other Post-Secondary Institution Other U of S College
Overall Retention byStudent Origin

Overall “Degree Completion”by Student Origin
0
10
20
30
40
50
60
70
80
90
100
1993 1994 1995 1996 1997
Cohort Year
Pe
rce
nta
ge
of
Stu
de
nts
High School Break After High School Other Post-Secondary Institution Other U of S College
Student-based Studies:
What are the underlying reasons for student attrition at the U of S
and what factors promote student success, persistence and degree completion?

Three Student-based Studies
• Phone survey of early leavers
• Focus groups with current students
• Interviews with RTD students who have returned and are succeeding

Phone Surveyof Early Leavers

Definition of Early Leavers
• Discontinued registration– Students who completed a term(s) and were
academically eligible to return but did not register
• Withdrawn registration– Students who withdrew registration in the midst of a term

Characteristics of Voluntary Leavers
• Withdrawn Registration: Female 55%: Male 45%• Discontinued Registration: Female 64%: Male 36%• 23-24 years of age • School of matriculation
– Urban = 53%– Rural = 31%– Out of Province = 12%
• Admission average = 77-78%• GPA is about 61-64%

• Main reason for attending university:1. Prepare for a specific job/career 36.0%2. General education 24.5%3. Get a ‘good job’ 18.9%
• Main reason for choosing the U of S:1. Close to family 76.0%2. Program availability 8.6%3. Reputation 6.2%
Reasons for attending university and choosing
the U of S

Unsure4.7%
Intended to pursue a degree79.7%
Did not intend to pursue a
degree15.6%
Majority of early leavers intended to pursue a degree at the U of S.
Did early leavers intendto pursue a degree?

Not at all sure32%
Very sure30%
Somewhat sure38%
70.4% of early leavers were ‘not at all sure’ or only ‘somewhat sure’ of what area/major they wanted to pursue at the U of S.
How sure were early leaversabout what area/major they
wanted to pursue?

How prepared did earlyleavers feel when they enrolled at
the U of S?
8.8
11.2
14.5
21.5
23.3
27.7
29.8
32.0
0 5 10 15 20 25 30 35 40
Campus/Community Environment
Social Challenges
Skills Required
Academic Standards
Learning Environment
Financial Costs
External Demands
Workload
Percentage of Students
• 71% felt unprepared for at least one of the following:

21.2
24.2
35.1
36.3
37.8
42.2
0 10 20 30 40 50
Financial Difficulties
Academic Difficulties
Personal Circumstances
Change in Career Plans
U of S Not a Good Fit
Transferred to Other Institution
Percentage of Students
What influenced early leavers’ decision to leave?
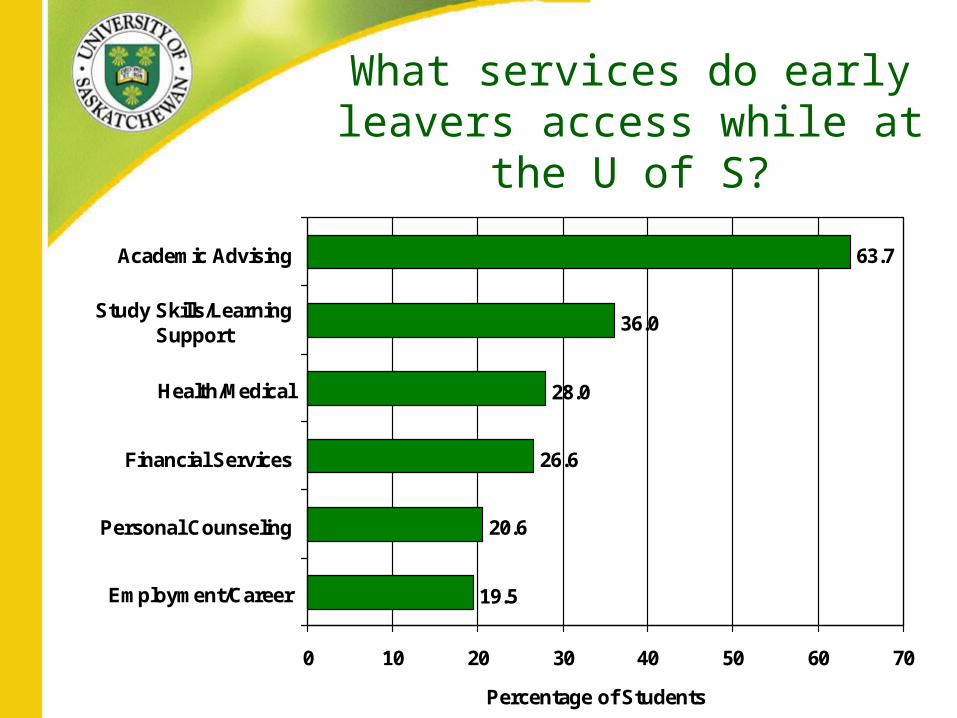
What services do early leavers access while at the
U of S?
19.5
20.6
26.6
28.0
36.0
63.7
0 10 20 30 40 50 60 70
Employment/Career
Personal Counseling
Financial Services
Health/Medical
Study Skills/LearningSupport
Academic Advising
Percentage of Students

College Outside SK
14.8%
University outside SK
16.7%
Other1.9%
University in SK18.5%
College in SK48.1%
• 48% have attended or are now attending another post-secondary institution
• Majority of early leavers stay in SK (67%) • Majority attend college (63%)
Where do early leavers go?

• SIAST 31.3%• University of Regina 16.6%• A University in Alberta 6.1%
– U of Alberta– U of Calgary– U of Lethbridge
• University of Manitoba 1.8%
What institutions dothey attend?

Very likely16.2%
Unsure3.8%
Somewhat likely10.0%
Not at all likely70.0%
Majority of early leavers are ‘not at all likely’ to return to the U of S in the next year.
Likelihood of Returning tothe U of S in the Next Year

Focus GroupsWith Current U of S Students

What are the key challenges you have faced in your studies
at the U of S?
All Students:1. Challenges involving professors2. Adjustment from high school to university (expectations)3. Academic skill development
Aboriginal Students:1. Feeling marginalized2. Financial issues3. Balancing school with other responsibilities

InterviewsRTD students who have returned
and are succeeding

RTD students reported a common path to attrition
• Began in first year
• Lack of a goal low investment in time/effort poor study habits poor performance academic failure

RTD students reported a common path to a successful return
• Identifying an “academic/career” goal
• Making a conscious commitment to getting a degree

• Benchmark data exists for comparison purposes• ‘Proceduralization’ of the collection of retention
and attrition data within the University• Follow up studies may be pursued • Strategic development of structures, services,
and programs that foster and promote retention
Next Steps

• Understand retention as a vital component of effective enrollment management, setting targets for improved retention as well as for attracting voluntary leavers back
• Take an intentional, comprehensive, and institution-wide approach to enhancing the first year experience
Recommendations

• Create spaces, services and systems that allow students to connect with other students and that allow students to interact with faculty
• Adopt proven models (e.g., Learning Communities) and develop our own models (e.g., University Life 101) to better engage students and assist in transition
Recommendations

• The quality of teaching is of prime importance to students. The recommendations of the forthcoming Teaching and Learning Foundational document should be implemented.
• Increase the availability and quality of integrated academic-career advising services on our campus. Advising for students who are undecided or interested in changing colleges should be made available to a greater degree.
Recommendations

• Change structures and systems to facilitate decision-making and intentionality among students
• Identify students who are at greater risk for attrition early and improve and develop services to meet their needs
• Conduct future research that uses these findings as benchmark data.
Recommendations

Thank you