Finding the Tools--and the Questions--to Understand Dynamics in Many Dimensions R. Stephen Berry The...
29
Finding the Tools--and the Questions--to Understand Dynamics in Many Dimensions R. Stephen Berry The University of Chicago TELLURIDE, APRIL 2007
-
date post
20-Dec-2015 -
Category
Documents
-
view
213 -
download
0
Transcript of Finding the Tools--and the Questions--to Understand Dynamics in Many Dimensions R. Stephen Berry The...
Finding the Tools--and the Questions--to
Understand Dynamics in Many Dimensions
R. Stephen BerryThe University of
ChicagoTELLURIDE, APRIL 2007
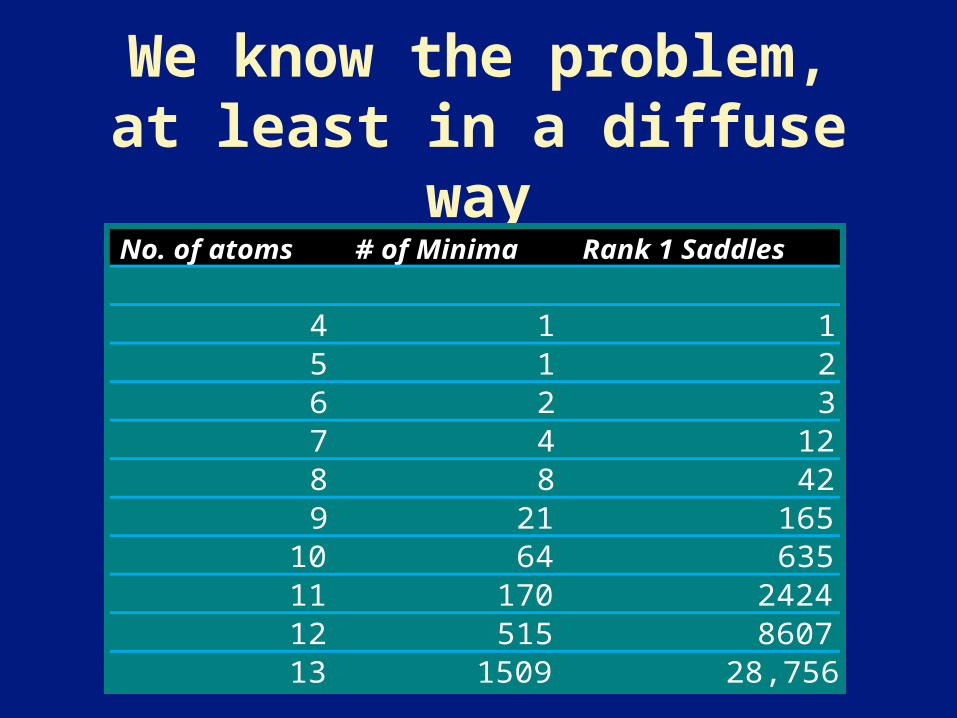
We know the problem, at least in a diffuse way
No. of atoms # of Minima Rank 1 Saddles
4 1 15 1 26 2 37 4 128 8 429 21 165
10 64 63511 170 242412 515 860713 1509 28,756

But what should we do with this? Too much
information!• We must decide what
questions are the most important, and then
• Decide how little information we need to answer those questions
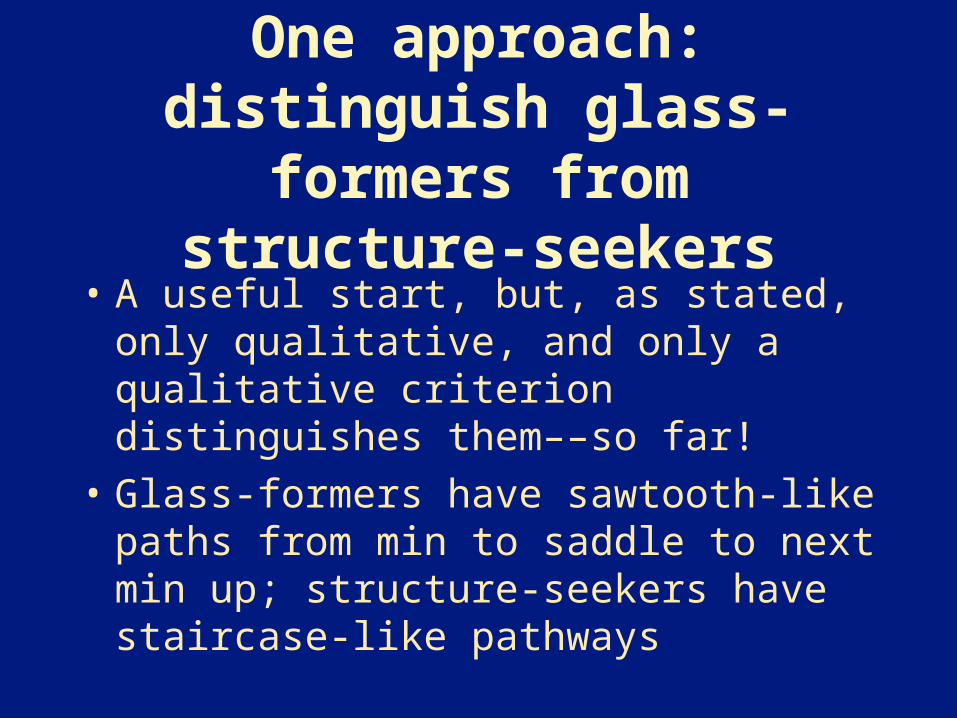
One approach: distinguish glass-
formers from structure-seekers
• A useful start, but, as stated, only qualitative, and only a qualitative criterion distinguishes them––so far!
• Glass-formers have sawtooth-like paths from min to saddle to next min up; structure-seekers have staircase-like pathways
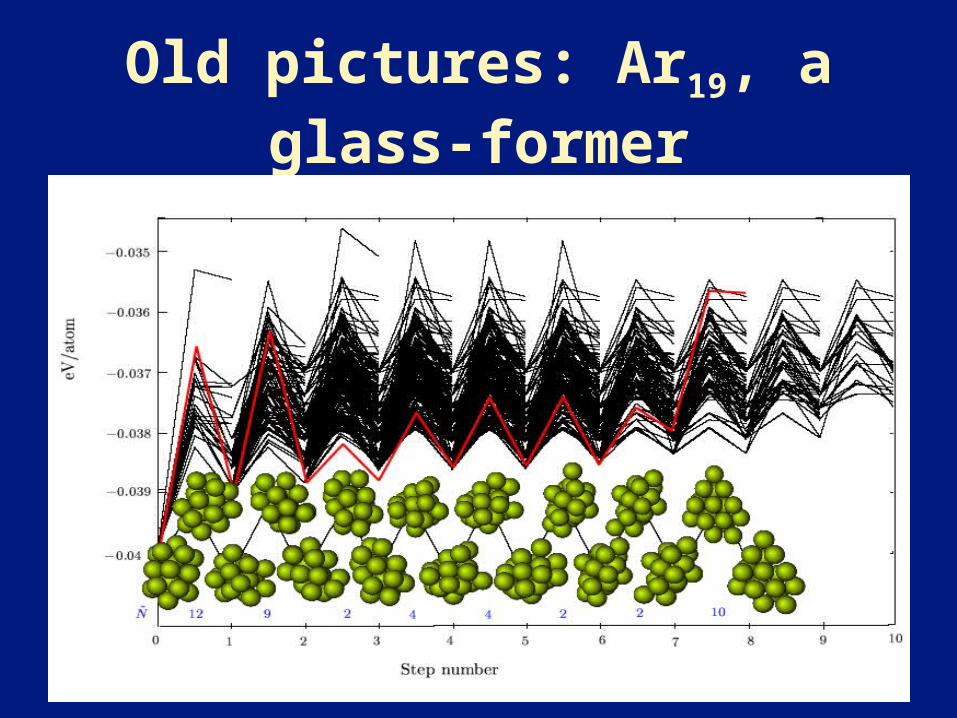
Old pictures: Ar19, a glass-former
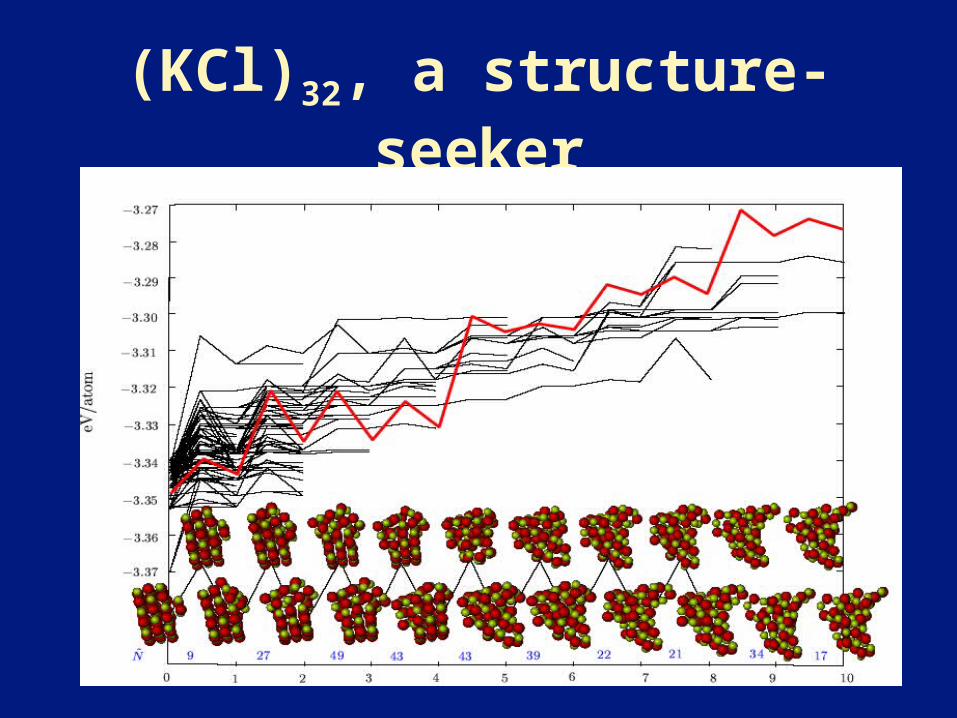
(KCl)32, a structure-seeker
Some easy inferences• Short-range interparticle forces
lead to glass-formers; long-range forces, to structure-seekers
• Effective long-range forces, as in a polymer, also generate structure-seekers sometimes -- compare foldable proteins with random-sequence non-folders
Can we invent a scale between extreme structure-seekers and extreme glass-
formers? • Some exploration of the
connection between range of interaction and these limits, but not yet the best to address this question; that’s next on our agenda
Another Big Question: Can we do useful kinetics to
describe behavior of these systems?
• The issue: can we construct a Master Equation based on a statistical sample of the potential surface that can give us reliable eigenvalues (rate coefficients), especially for the important slow processes?
• How to do it? Not a solved problem!
Some progress: Some sampling methods are
better than others• Assume Markovian well-to-well
motion; justified for many systems
• Use Transition State Theory (TST) to compute rate coefficients
• But which minima and saddles should be in the sample?
Two approaches: 1) various samplings & 2)
autocorrelations• Jun Lu: invent a simple model
that can be made more and more complex
• Try different sampling methods and compare with full Master Equation
• One or two methods seem good for getting the “slow” eigenvalues
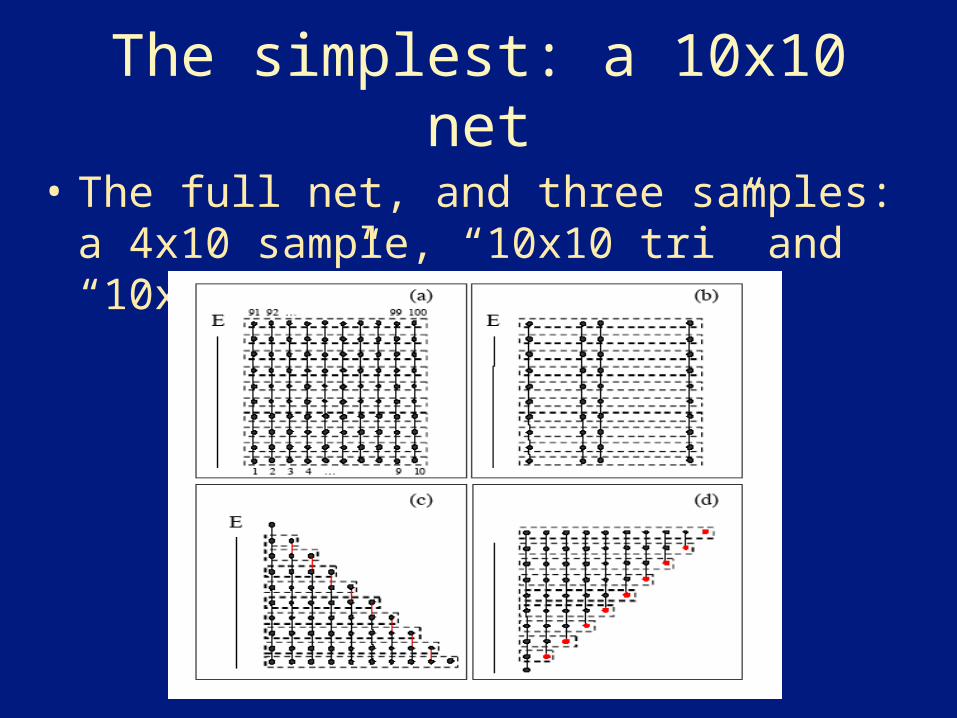
The simplest: a 10x10 net
• The full net, and three samples: a 4x10 sample, “10x10 tri” and “10x10 inv”
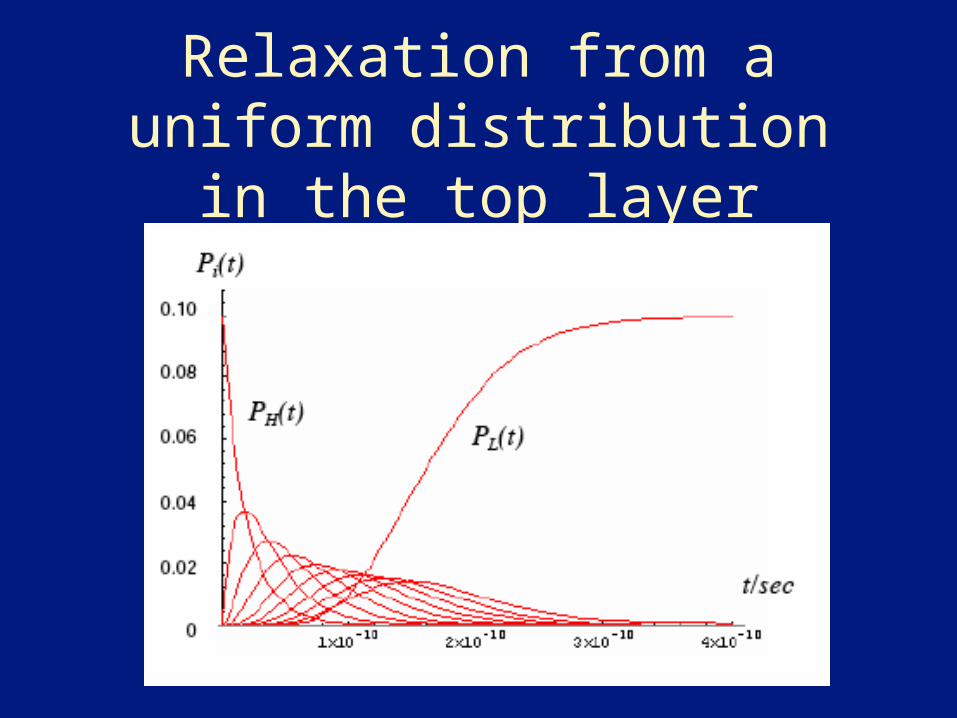
Relaxation from a uniform distribution in the top
layer
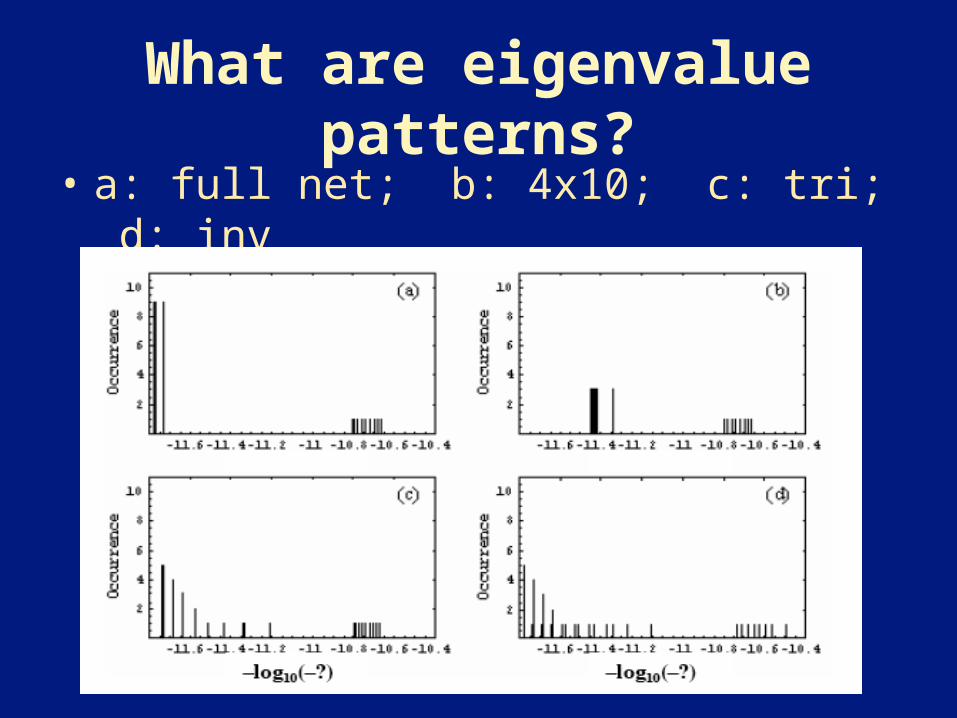
What are eigenvalue patterns?
• a: full net; b: 4x10; c: tri; d: inv
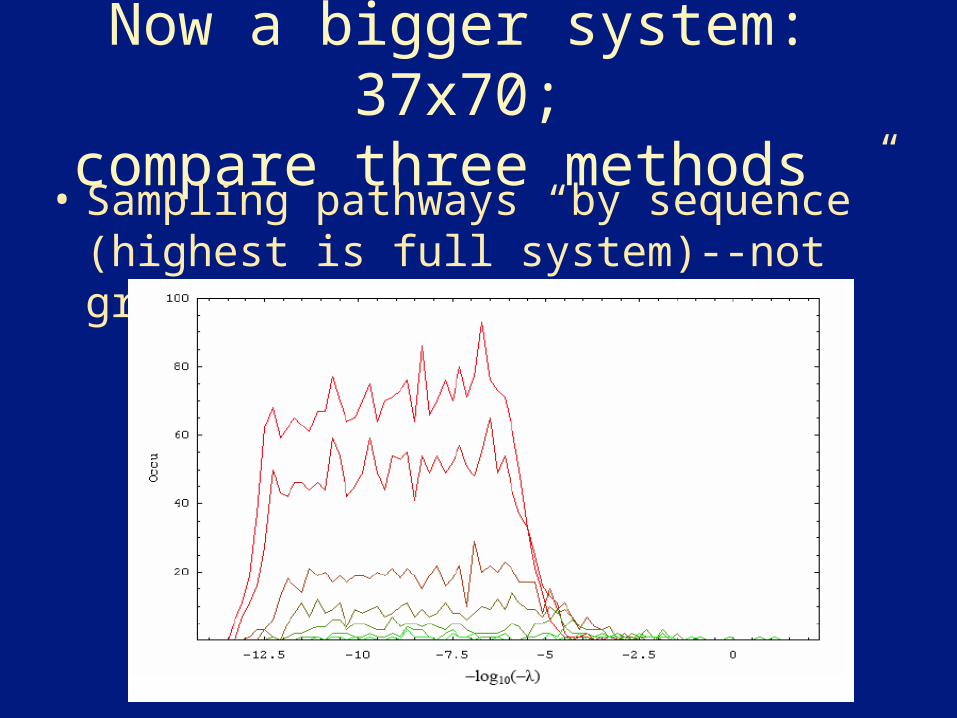
Now a bigger system: 37x70;
compare three methods • Sampling pathways “by sequence”
(highest is full system)--not great.

Sampling by choosing “low barrier” pathways
• Also not so good; slowest too slow!
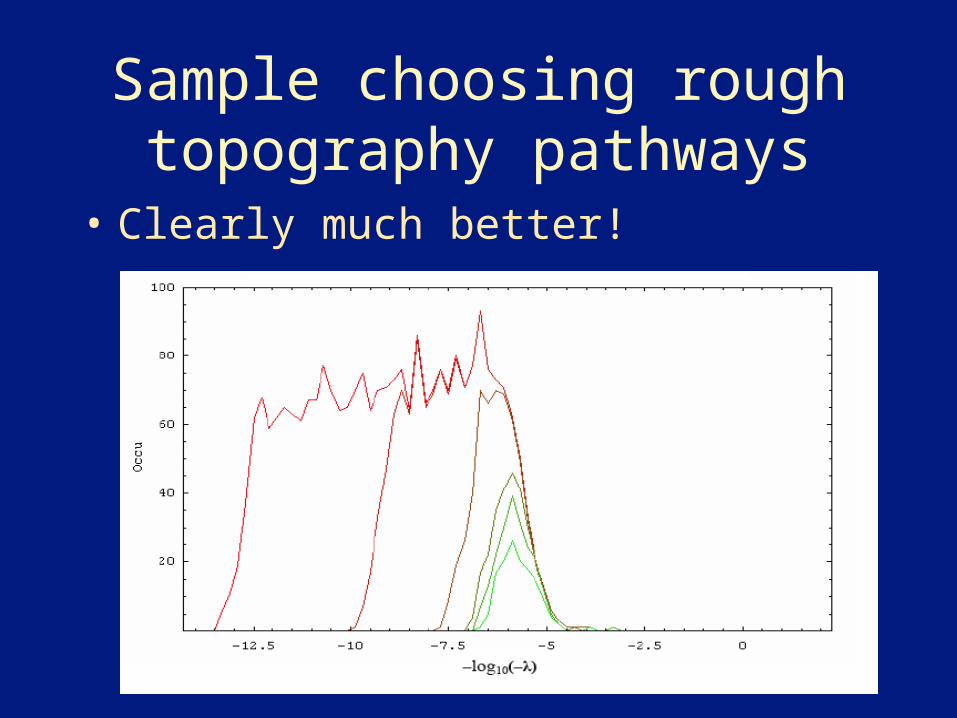
Sample choosing rough topography pathways
• Clearly much better!
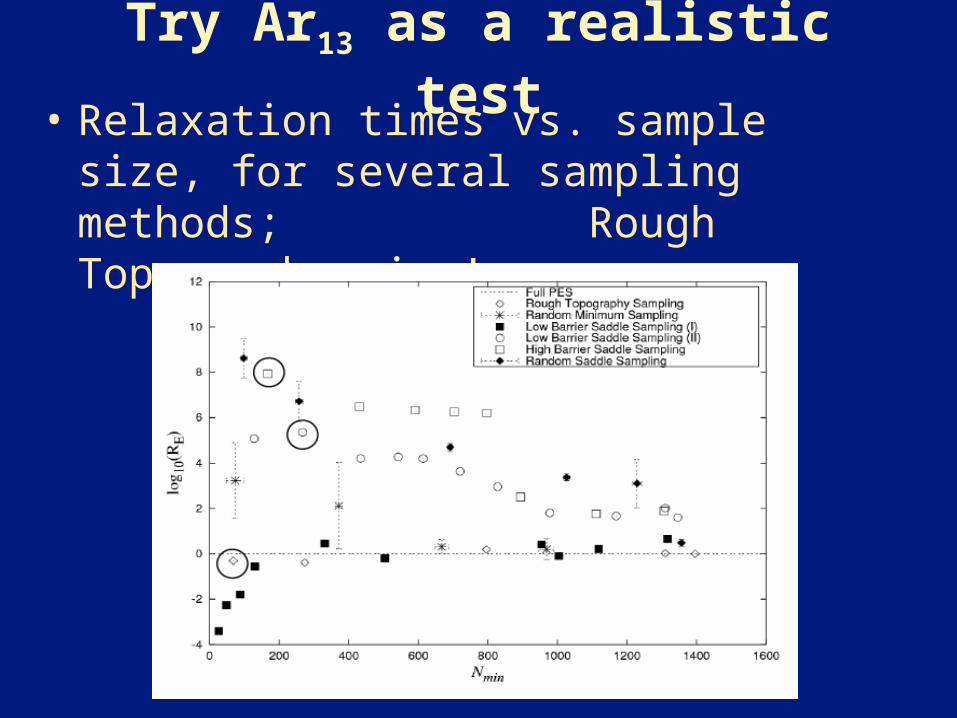
Try Ar13 as a realistic test• Relaxation times vs. sample size, for
several sampling methods; Rough Topography wins!
Big, unanswered questions:
•What is the minimum sample size to yield reliable slow eigenvalues?
•How can we extend such sampling methods and tests to much larger systems, e.g. proteins and nanoscale particles?
Another Big Question: How does local topography guide
a system to a structure?• How does the distribution of
energies of minima influence this?
• How does the distribution of barrier energies influence this?
• How does the distribution of asymmetries of barriers influence this?
One question with a partial answer: How does
range affect behavior?• Long range implies smoother
topography and collective behavior
• Short range implies bumpier topography and few-body motions
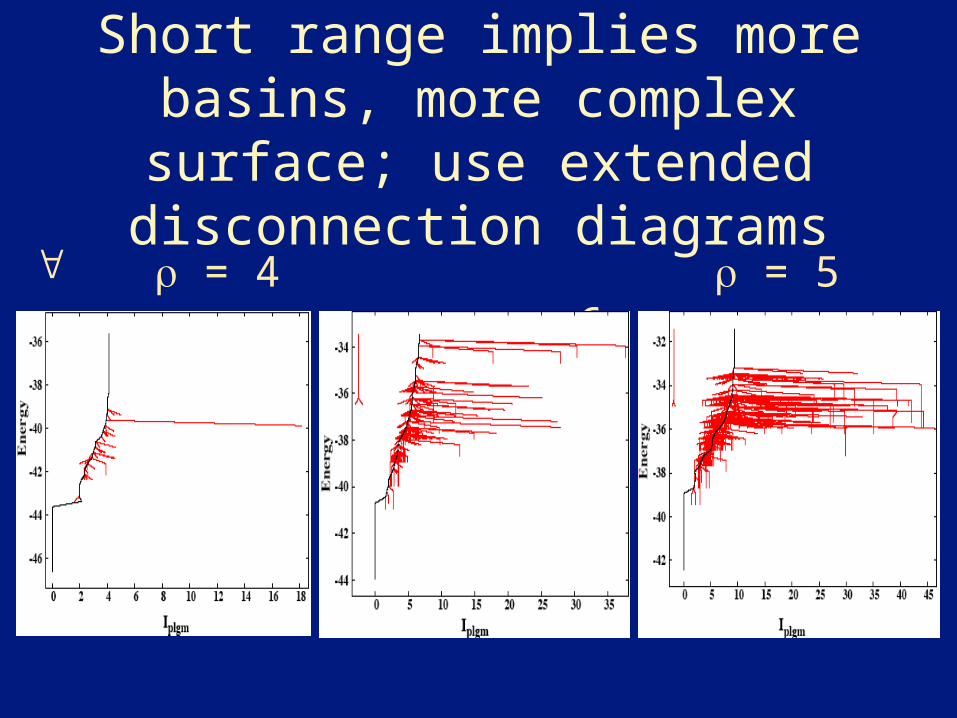
Short range implies more basins, more complex surface;
use extended disconnection diagrams
= 4 = 5 = 6
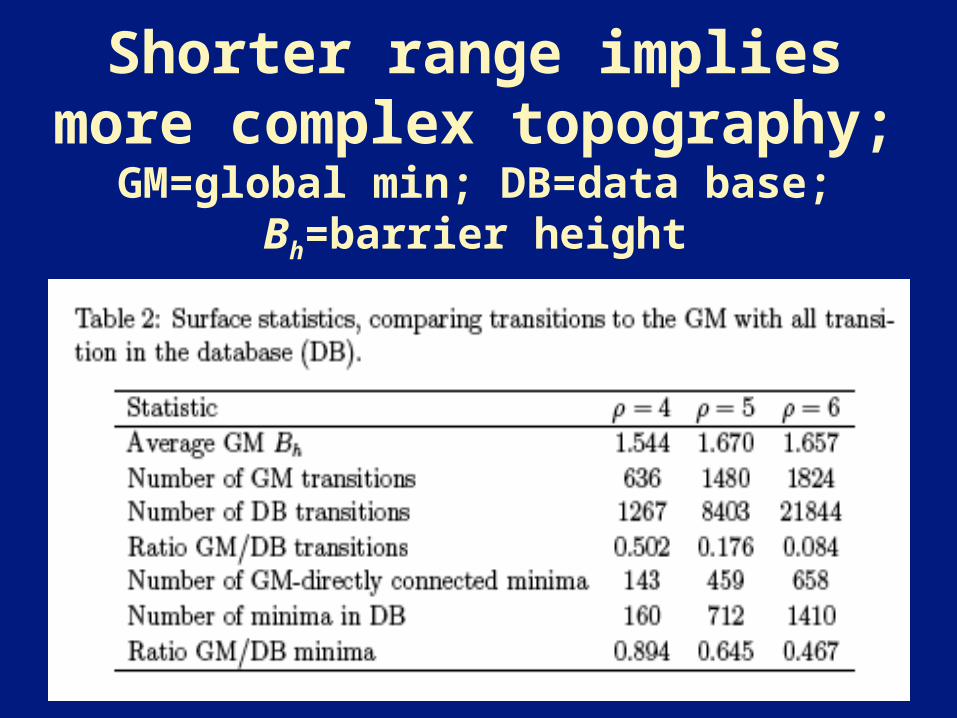
Shorter range implies more complex
topography; GM=global min; DB=data base; Bh=barrier height
Consider barrier asymmetries
• The 13-atom Morse cluster, with = 4, 5, 6
= 4 is the longest range and the most structure-seeking
• Examine asymmetries using Ehighside/Elowside = Bh/Bl = Br
where low Br means high asymmetry
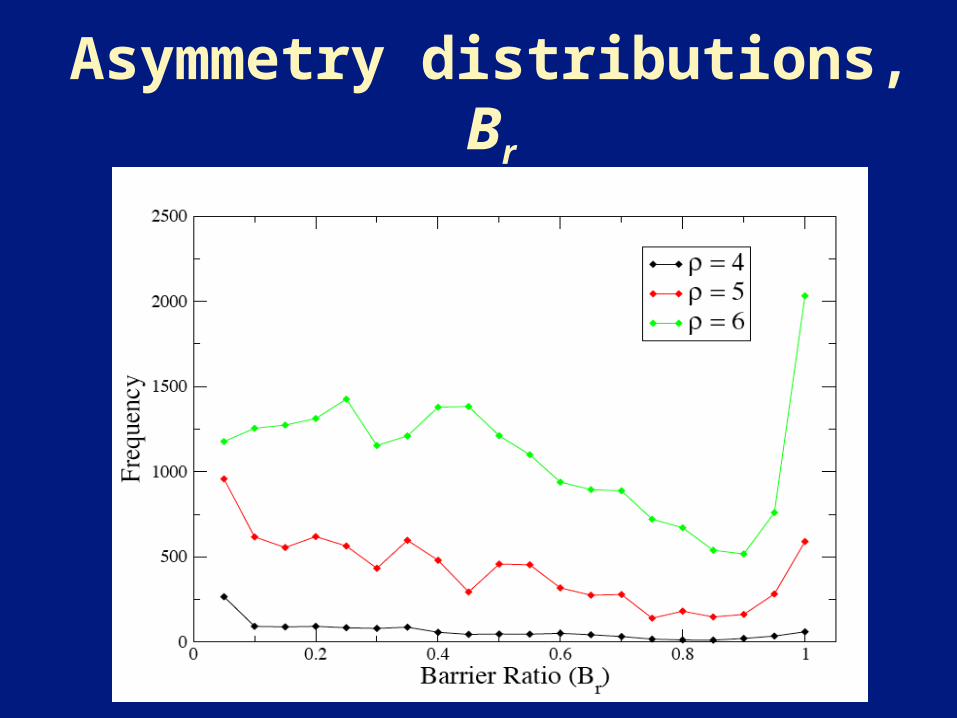
Asymmetry distributions, Br
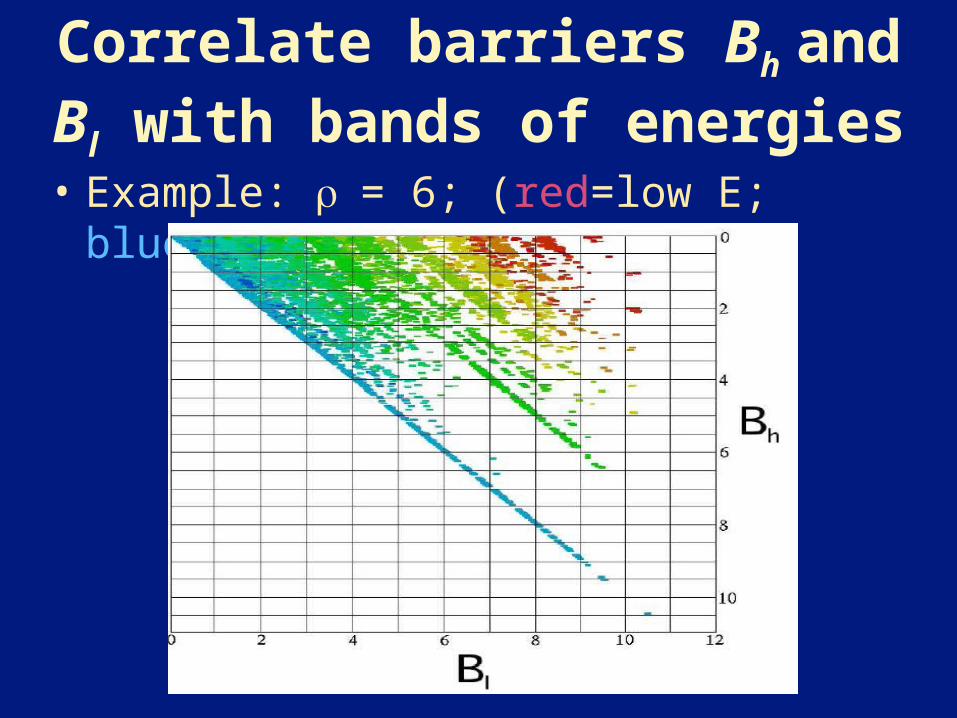
Correlate barriers Bh and Bl with bands of energies• Example: = 6; (red=low E;
blue=high E)
A pattern emerges
• Deep saddles are the most asymmetric
• High levels have many interlinks; low levels, fewer
• For a system this small, bands of energy minima are clearly distinguishable
More questions ahead• Can we make a quantifying scale
between extremes of glass-forming and structure-seeking?
• What role do multiple pathways play? What difference does it make if they are interconnected?
• Should we focus on big basins or are the detailed bumps important?
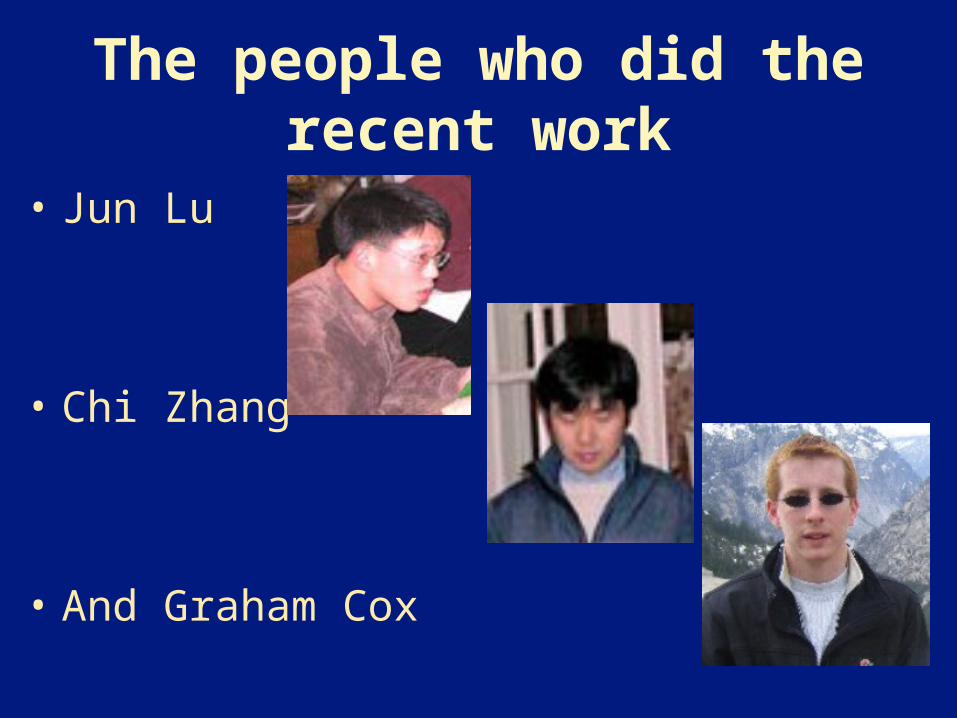
The people who did the recent work
• Jun Lu
• Chi Zhang
• And Graham Cox