Financing waste infrastructure in Indonesia
103
Financing waste infrastructure in Indonesia September 2020 Commissioned by
Transcript of Financing waste infrastructure in Indonesia

Financing waste infrastructure in Indonesia
September 2020
Commissioned by

Contents
Foreword 3
About this report 4
Acknowledgements 5
Executive summary 7
1. Introduction 10
1.1 The challenge of plastics 11
1.2 Green finance is a strategic solution for the region 18
1.3 Solving the global plastics pollution challenge starts in South East Asia 25
1.4 Report outline and approach 26
2. A vision for Indonesia: plastic is a resource 27
2.1 Scale of the challenge and costs of mismanaged waste 28
2.2 Building on Indonesia’s strengths 30
2.3 Indonesia’s investment landscape 38
2.4 Waste is a resource: unlocking economic opportunities 44
3. Plastic production, management and financing 54
3.1 Understanding the waste journey 55
3.2 Containment and collection 58
3.3 Sorting 62
3.4 Recycling 66
3.5 Waste to Energy 72
3.6 Landfills 75
3.7 Dumping, leakage and plastic pollution 77
3.8 Downstream markets for recycled plastics 78
4. Key challenges and solutions 83
Theme 1: Building capability to plan for and manage waste 86
Theme 2: Developing supportive frameworks for attracting investments 91
Theme 3: Connecting supply chains 92
Theme 4: Expanding end markets 96
A note on currency risk 98
Recommendations for phase 2 99
Disclaimer 101
Contacts 103

Page 3
Foreword As countries around the world start to emerge from COVID-19-induced lockdown, investors and governments are radically reappraising their aspirations and assumptions for 2020 and beyond. Charting a pathway to recovery will be challenging. Yet our shared goal of building back better is creating a unique opportunity to align investor action with government-led policy direction. This is our time to forge a consensus to deliver sustainable and resilient growth.
Momentum behind sustainable finance is only accelerating, driven by increasing clarity of the financial risks posed by climate change. More and more institutional investors are declaring net zero and Paris-aligned targets, resulting in a rapidly expanding pool of capital seeking sustainable projects. But change in the real economy is not keeping pace. There is still a significant and persistent financing gap for the infrastructure we need for our future.
Closing this sustainable financing gap is an urgent priority. It is urgent for governments, who need private investment, particularly in infrastructure, to rekindle growth. It is urgent for investors, who must find new investments to rebalance their portfolios to account for climate risk. It is urgent for our planet and people.
The urgency of action is not in question. The challenge is how we can mobilise private capital at scale into opportunities aligned with a low carbon and climate resilient future.
I strongly believe that to overcome the challenges, the public and private sectors need to work together to find solutions. We need to bridge the gap between mainstream investment practice and public policy. Private financiers are increasingly working to support governments to mobilise sustainable investment, through groups such as the Climate Finance Leaders Initiative. But these efforts must be put into practice by developing sector-level investment pathways. Only with these policy pathways in place can financiers and policymakers enable investment at scale, unlock sustainable growth, and create new jobs.
The opportunity for financiers is to work with open, growth focused governments to identify and develop these sector-level investment pathways. Indonesia is one such government.
Indonesia has shown tremendous leadership in tackling a critical environment challenge - plastic waste. Their objective is clear and ambitious - Indonesia aims to be plastic pollution free by 2040. To support these efforts, we in the City of London Corporation have worked with Green Investment Group to set out a roadmap to mobilise mainstream capital into waste infrastructure in Indonesia.
In what follows, we set out clear and implementable actions for private investors, for the UK Government, and the Government of Indonesia. This is the first step in moving towards an investable transition pathway for Indonesia’s waste sector.
I hope this analysis will be the start of a deeper partnership with Indonesia. There are immense opportunities associated with the circular economy and the transition to a low carbon future. Unlocking the opportunity and unlocking capital will require significant cooperation between governments and the private sector.
These unprecedented times offer us a chance to change. Building back better is both the challenge and our goal. It is one we must strive for together.
William Russell Lord Mayor, City of London

Page 4
1 For more information, visit www.greeninvestmentgroup.com and www.macquarie.com
About this report
The City of London Corporation commissioned Green Investment Group, a pioneering green finance institution, to conduct a study to explore solutions to accelerate private financing for waste infrastructure in Indonesia.
The City of London Corporation is the governing body of the Square Mile dedicated to a vibrant and thriving City, supporting a diverse and sustainable London within a globally successful UK. The Corporation aims to contribute to a flourishing society, support a thriving economy and shape outstanding environments. It does this by strengthening the connections, capacity and character of the City, London and the UK for the benefit of people who live, work and visit here. The City of London Corporation’s reach extends far beyond London’s Square Mile’s boundaries and across private, public and voluntary sector responsibilities. This, along with their independent and non-party political voice and convening power, enables the Corporation to promote the interests of people and organisations across London and the UK and play a valued role on the world stage.
Macquarie’s Green Investment Group (GIG) is a specialist in green infrastructure principal investment, project development and delivery, green impact advisory and the management of portfolio assets. Its track record, expertise and capability make it a global leader in green investment and development, dedicated to accelerating the transition to a greener global economy. One of the world’s largest teams of specialist green infrastructure developers and investors, the business and its operating platforms have investments or operations in over 25 markets, more than 400 staff and a global development pipeline of more than 20GW.
Macquarie Group Limited (Macquarie) is a diversified financial group providing clients with asset management and finance, banking, advisory and risk and capital solutions across debt, equity and commodities. Founded in 1969, Macquarie employs over 15,700 people in 31 markets. As of the 30th September 2019, Macquarie had assets under management of £309.2 billion.
This report is intended as a basis for discussion only. Whilst every effort has been made to ensure the accuracy and completeness of the material in this report, the City of London Corporation give no warranty in that regard and accept no liability for any loss or damage incurred through the use of, or reliance upon, this report of the information contained herein. © City of London Corporation PO Box 270, Guildhall London EC2P 2EJ

Page 5
Acknowledgements
This report has been informed by insights from stakeholders from across the waste industry, many of whom are active in Indonesia. Green Investment Group is grateful for their support during the drafting of this report. Their participation does not necessarily imply their full endorsement of the report’s contents and conclusions. We are greatly thankful for their contributions.
City of London Corporation and Green Investment Group would like to recognise the valuable insights shared with us by these experts.
Carlos Montreal Chief Executive Officer Plastic Energy
Jane Beasley Director Beasley Associates
Tiza Mafira Associate Director Climate Policy Initiative
Machua Acharya Director, Asia Climate Policy Initiative
Zoë Lenkiewicz Head of Programmes and Engagement Waste Aid
Paul Davidson Challenge Director – Smart Sustainable Plastics Packaging UK Research & Innovation
Stephen Peters Senior Energy Specialist (Waste-to-Energy) Asia Development Bank
Christine Po Chan Senior Investment Specialist Asia Development Bank
Kin Wai Chan PPP Transaction Advisory Division Asia Development Bank
Yuichiro Yoi Unit Head of Infrastructure for Indonesia/Malaysia Asia Development Bank
David Dovan Investment Specialist Asia Development Bank
Sakshi Suri Principal Investment Specialist Asia Development Bank
Matthew Mulcahy Head of Corporate Development Covanta
Deborah Saks Waste and Resources Specialist Department of International Trade
Steven Weber Vice President Business Development Covanta
Richmond Young Senior Director, Corporate Development Covanta
Eline Spek Program Manager The Ocean Cleanup
John Murray Head of Public Affairs The Ocean Cleanup
Katherine Stodulka Programme Director, Blended Finance Taskforce SYSEMIQ
Catharina Dyvik Project Manager, Sustainable Finance SYSEMIQ
Stuart Hayward-Higham Technical Development Director Suez Recycling and Recovery UK Ltd
Y Bayu Wirawan Head of Product Development Division Indonesia Infrastructure Finance

Page 6
Maharani Sahara Subandi Team Leader Product Development Division Indonesia Infrastructure Finance
Irman Boyle Director, Advisory Group Indonesia Infrastructure Finance
Cynthia Hendrayani President Director Oligo Infrastructure
Keni Atika Project Development Executive Oligo Infrastructure
Darwin T Djajawinata Director PT SMI
Adi Pranasatrya Head of Sustainable Finance Division PT SMI
Indar Barung Executive Vice President PT SMI
Ekha Yudha Pratama Team Leader Sustainable Financing PT SMI
Rizky Hariseputra Relationship Manager PT SMI
Puti Faraniza Project Development and Advisory PT SMI
Neil Gillies Senior Vice President Macquarie Asset Management
Stephen Ray Senior Vice President Macquarie Capital
Paul Mitchener Executive Director Macquarie Asset Management
Yanssen Tandy Infrastructure Adviser British Embassy, Jakarta
Adam Bonner Business Development Lead Centre for Environment Fisheries and Aquaculture Science
Tim McNeill Head of Building Markets, Sustainable Trade and Green Finance Department for International Development
Bertrand Van Ee Chairman AWECT
Marcus Steinig Financial Director AWECT
Bas Hamers Investment Manager AWECT
Julia Watsford Managing Director, UK Wheelabrator Technologies
Helena Wright Vice President, Sustainable Infrastructure and Energy Finance WWF
Ted Kin Chen Assistant Vice President WWF
Simon Horner Head of Policy and Innovation City of London Corporation
James Boyle Senior Policy Adviser, International Projects City of London Corporation
Amy Herford Policy Adviser, Asia City of London Corporation

Page 7Executive Summary
2 World Economic Forum, Ellen MacArthur Foundation, McKinsey & Company (2016) The New Plastic Economy
Plastics have become one of the most versatile materials in the world. Plastics use has increased twenty-fold in the past 50 years and is expected to double again in the next 20.2
Plastic waste management infrastructure, from sorting, recycling and recovery, has not kept up with the rise in plastic production around the world, leading to plastic polluting the natural environment and local communities, with devastating effects on environmental and human health as well local livelihoods. The same can be said about the investment needed to scale up waste management infrastructure, with green private capital being concentrated on clean energy and transport infrastructure.
Indonesia has been particularly impacted by this. As developed countries saw their own plastic use explode, they have started to export their plastic waste to other countries – mainly China, until it closed its borders to plastic exports in 2018. Indonesia is one of the main recipients of this plastic waste, with no infrastructure to process this waste properly. On top of this, domestic plastic waste is on the rise and is not well managed – especially in rural and remote areas where waste is rarely collected, let alone processed.
Indonesia is home to one of the most biodiverse marine environments. With rapid urbanization, population growth and economic development, the level of pollution entering and destroying these ecosystems from mismanaged Municipal Solid Waste (MSW) will also increase; further exacerbating the current situation. The costs to people’s health, ecosystem health, fishing and tourism industries are mounting and can only increase if the situation doesn’t improve. Local municipalities responsible for building waste management infrastructure lack the funds and capability to tackle the issue at scale.
At the same time, the market for recycled plastics is taking off. Consumers and companies alike, increasingly aware of the impacts of mismanaged plastic waste, are taking action to reduce their use of single-use plastic, increase the proportion of plastic items made from recycled content, and increasing their recyclability so that they can retain value after they are discarded.
Indonesia faces a strong imperative to scale up its waste management, in particular to tackle increasing plastic waste generation from its own households – and it has already put in place strong policies to achieve this. At the same time, Indonesia can tap into this new opportunity that is the growing global market for recycled plastics. Unlocking private capital to support Indonesia’s political priorities in waste management will be key to success.
The investment required to achieve appropriate levels of waste collection, sorting, recycling, recovery and disposal is estimated to be $18.4 billion between 2017 and 2040. Indonesia’s public sector will not be able to cover these costs alone; it will be imperative that Indonesia takes action to attract private actors to invest in its waste management sector.
Our recommendations are summarised in the following pages, with full details provided in Chapter 4.
Executive summary

Executive Summary Page 8
Recommendations
Building capability
Local officials in Indonesia are responsible for delivering waste management projects, yet they often lack the capability to design and procure waste management solutions.
Creating opportunities for international partnerships
The absence of waste management and recycling companies with strong and transparent track records of profitability can be a challenge for international investors and developers, who often look for local partners when they enter new markets.
Enforcing laws and regulations
Investors will look for evidence that organisations that have not met regulations have been prosecuted before making a move to a new market – making regulatory enforcement extremely important to attract investors in a new market.
Closing municipalities’ funding gap
Waste management is underfunded; municipalities often face competing priorities for funding, and municipalities often rely on subsidies from the federal government to pay for waste collection.
The Government of Indonesia should set up a new Waste Management Authority. This could be done inside one of the government departments with existing waste management responsibilities, such as the Ministry of Maritime and Investment Affairs.
Government of Indonesia could work with other governments to organise trade missions and trade shows.
Indonesia’s waste regulations and specific responses should be made publicly available and accessible to investors.
Government of Indonesia could develop a Waste Management Development Fund concept in order to bridge the support municipalities in development of waste.
01
03
08
07
02
04
09
0506
The UK should consider how it might support Indonesia in developing more integrated approaches to developing waste. This could include technical assistance in policy and project finance to help set up a new Waste Management Authority.
City of London Corporation should prioritise waste management as part of its broader clean growth and green finance agenda, recognising this is an essential sector contributing to economic growth, health, wellbeing, and environmental protection.
The UK’s Environment Agency could provide support to Indonesia, sharing its own experience in enforcing and publishing information about waste prosecutions in the UK.
Waste should form an important part of the UK’s Economic and Financial Dialogues in South East Asia.
UK Export Finance (UKEF), the UK Export Credit Agency, should work with City of London Corporation and UK stakeholders to explore how it could support UK investment into Indonesian Waste Infrastructure.

Executive Summary Page 9
Connecting supply chains
Without infrastructure dedicated to sorting waste, there is no guarantee over the composition, quality or quantity of the waste feedstock, which impairs the development of recycling as well as other types of waste management activities.
Waste management is not well distributed across Indonesia, with more concentrated activities around mega-cities like Java, and practically no formal waste management in rural and remote communities.
Integrating the informal sector into a larger waste management system
This report, along many others, recommends that Indonesia significantly scales up and diversifies its waste management system, developing sorting MRFs and recycling plants alongside new WTE plants and sanitary landfills. This will have an impact on the informal waste sector, in particular waste pickers, who currently form the backbone of Indonesia’s waste industry.
Growing the downstream market for recycled plastics
While recycled plastics often struggle to compete with virgin plastics, increasing demand for recycled plastics starting the change market dynamics and is creating a premium for recycled materials.
Government of Indonesia, with the support of others, should commission a feasibility study to analyse the potential to deploy a fleet of distributed, small scale sorting material recovery facilities (MRFs) and larger, more centralised recycling plants.
Indonesia should create new standards and training for informal waste pickers, helping create safer conditions for existing waste pickers. This could be handled by the new Waste Management Authority.
The UK Government can provide information on how the UK’s own regulatory changes impacted its own waste management and recycling market, and lessons learnt from that process.
10
12
15
11
13
16
14
17
1819
So far the Government of Indonesia has emphasised its intention to support waste to energy (WTE) projects. He government could also signal that it will support MRF and recycling projects.
The UK’s could provide technical assistance, support and insights to Indonesian stakeholders, based on its own health and safety regulations, on how to develop new standards for the informal economy.
The Government of Indonesia could reach out to the World Bank and OECD to build on their extensive work on EPR design to support government in implementing EPR policies in its market, with the need to grow demand for recycled contents as a key element to the design.
Private waste firms should work with civil society, local government and development finance institutions to explore how waste infrastructure projects could create formal jobs for waste pickers, and whether and how they might make the transition into the formal waste economy over the long term.
The UK Departments and public bodies responsible for designing and running the UK’s Extended Producer Responsibility (EPR) policies (Department for Environment, Food and Rural Affairs, Environment Agency and the Environment Exchange) could consider how they can provide support to Indonesian officials in delivering a successful EPR scheme.
Indonesia should convene a corporate Taskforce with the firms involved in the manufacturing and use of plastic packaging in Indonesia to identify a set of voluntary and regulatory targets and best practice which could drive private sector action in Indonesia. This could be coordinated by the new Waste Management Authority.
The UK’s City of London Corporation and Green Finance Institute could share their experience in setting up and running the UK’s Green Finance Taskforce, which is recognised as a model for managing public-private sector collaboration internationally.
Introduction

Million tonnes
Page 11Introduction
3 World Economic Forum, Ellen MacArthur Foundation, McKinsey & Company (2016) The New Plastic Economy 4 Geyer, Jambeck and Lavender Law (2017) ‘Production, use, and fate of all plastics ever made’ Science Advances, Vol.3 no.7 5 Ref: as above. Based on Compound Annual Growth Rate of 8.4% 6 Municipal Solid Waste represents all type of waste generated by households and from other sources where it is similar in nature and composition.
In this section we will introduce the main themes of this report: plastics and finance. This section introduces some important terminology to help readers with a policy background think about waste infrastructure from both a technical and a finance point of view. We will continue to bring both aspects of waste together throughout the report.
This introduction sets out why plastics have become a major challenge globally – from a waste management and an environmental perspective – and why they will be the focus of this report.
It will also explain, in broad terms, how private financiers think about waste management infrastructure: how deals are typically structured and what criteria investors tend to consider before committing to financing waste infrastructure.
The introduction will briefly explain why South East Asia and Indonesia are key to solving this global challenge.
1.1 The challenge of plasticsSince the 1950s, plastics have emerged as some of the most versatile materials in the world, prized for their durability, versatility and relatively low cost. Their use has increased twenty-fold in the past half-century and is expected to double again in the next 20 years.3 Global production of resins and fibres increased from 2 Mt in 1950 to 380 Mt in 2015; the total amount of resins and fibres manufactured from 1950 to 2015 was 7800 Mt, half of this (3900 Mt) was produced in the last 13 years4 alone.
Today plastics are used by nearly everyone, everywhere and every day.
Global production of resins and fibres5
Increasing plastic production has not however been matched with a corresponding increase in recycling of plastic waste streams, despite, in some cases, comprehensive waste management systems in place for Municipal Solid Waste6 (MSW) and regulation and policy driving recycling.
One of the challenges to effectively manage this waste stream is the complexity of plastics, specifically the wide range of polymers that are in use in our products. They each have their own physical and chemical characteristics, which lend themselves perfectly to the role that they have (whether it is packaging or the product itself), but this also means that providing the most effective management solutions for different polymers is not straightforward either practically or economically.
The main polymer types found in MSW can be seen in the table below. Their current use and what they can potentially be recycled into is also identified; it’s worth noting that at present mechanical recycling is the main process in use commercially, but chemical recycling is considered to be a growing sector. This is discussed in more detail in section 3.4.
Roland Geyer, Jenna R. Jambeck and Kara Lavender Law
20152010200520001995199019851980197519701965196019551950
400
350
300
250
200
150
100
50
0

Page 12Introduction
7 In theory all polymers have the potential to be recycled in some form but the issue is whether they can be collected and contained in sufficient quantities, sorted appropriately and then processed cost effectively for recycling to be commercially viable.
Main Polymers in MSW
Polymer Acronym Category Use Commercial recycling potential7
Polyethylene Terephthalate
PET 1 Bottles for water, soft drinks, juices (tend to be clear), salad domes, biscuit trays, salad dressing and peanut butter containers.
Established processes in place.
Examples of potential uses:
• Food grade and non-food grade packaging depending on the input material.
• Many options for non-packaging uses such as fibre, carpet, clothing, furniture for example.
High Density Polyethylene
HDPE 2 Bottles for milk, detergents, shampoos (tend to be white or coloured), bags, freezer bags, dip tubs, crinkly shopping bags, ice cream containers, juice bottles, chemical and detergent bottles.
Established processes in place.
Examples of potential uses:
• Food grade and non-food grade packaging depending on the input material.
• Many options for non-packaging uses such as infrastructure, wood replacement, furniture, floor tiles for example.
Polyvinyl Chloride
PVC 3 Window frames, profiles, floor and wall covering, pipes, cable insulation, garden hoses, inflatable pools, cosmetic containers, commercial cling wrap.
Established routes do exist for some products, but overall can be challenging to recycle.
Examples of potential uses:
• Outdoor furniture, infrastructure, and other non-packaging uses.
Low Density Polyethylene
LDPE 4 Cling-film, sandwich bags, plastic grocery bags, trays and containers, squeeze bottles, shrink wrap, rubbish bags.
Established routes for some products but can be challenging to recycle.
Examples of potential uses:
• Non packaging uses such as plastic lumber, bin bags, furniture, waste containers.
Polypropylene PP 5 Food packaging, sweet and snack wrappers, hinged caps, microwave containers, automotive parts, margarine containers, yogurt pots, prescription bottles, plastic bottle caps microwave dishes, ice cream tubs, crisp bags, pipes, bank notes.
Some products can be recycled more readily but challenges remain
Examples of potential uses:
• Non-food grade packaging.
• Non packaging uses such as pallets, waste containers, outdoor furniture.
Polystyrene PS/EPS 6 Disposable coffee cups, plastic food boxes, CD/video cases, water station cups, plastic cutlery, imitation ‘crystal glassware’, packing foam.
Difficult to recycle in general.
Example of potential uses:
• Insulation and packing materials for example.
Other n/a 7 Catch all category includes multi-layer items, less commonly used groups of polymers.
Difficult to recycle in general– very varied range of potential inputs which impact on recycling options.

98% Virgin feedstock
78 million tonnes (annual production)
14% Incineration and/or Energy recovery
40% Landfilled
32% Leakage
14% Collected for recycling
2% Closed loop recycling1 8% Cascaded recycling2 4% Process losses
Page 13Introduction
8 World Economic Forum, Ellen MacArthur Foundation, McKinsey & Company (2016) The New Plastic Economy 9 Geyer, Jambeck and Lavender Law (2017) ‘Production, use, and fate of all plastics ever made’ Science Advances, Vol.3 no.7 10 World Economic Forum, Ellen MacArthur Foundation, McKinsey & Company (2016) The New Plastic Economy
Plastic products are restricted in the number of times they can be mechanically recycled and if they are downcycled then the number of times may be limited to once or twice. Chemical processes, which recycle the plastic into monomer resins or which use solution to extract the polymer, can extend the number of times plastic can be recycled but these processes are not widely commercially available at present. This is very different to glass, steel and aluminium which can be recycled multiple times without impacting on the integrity or viability of the product. In addition, paper, depending on its quality to start with, can also be recycled multiple times however each time it is recycled the fibres are shortened and the quality is therefore reduced, so it has a finite number of times it can go through this process.
1.1.1 Problems caused by plastics: legacy and new plastics
Looking specifically at plastic packaging, after a short first-use cycle, 95% is thrown away and its value is lost.8 Globally, between $80 and 120 billion worth of plastic packaging is lost to the economy every year as packaging is discarded after its first use. It is thought that only 9% of the world’s plastic produced since 1950 has been recycled.9
Around 32% of plastic packaging escapes collection systems, generating significant economic, environmental and health costs. There are currently 150 million tons of plastics in the world’s oceans, and another 250 million will be added if current trends continue, so that by 2050 there will be more plastic than fish by weight in our oceans.10
The Ellen MacArthur Foundation estimates that the cost of externalities for plastic packaging and of greenhouse gas emissions from its production are around US$40 billion annually — exceeding the plastic packaging industry’s profit pool.
Global flows of plastic packaging materials, 2013
Plastics that are not contained and managed can cause blight and disamenity when littered on land and can find their way into our waterways and oceans. This is certainly the experience globally whereby the harm caused by plastic pollution as well as the economic impact and loss of intrinsic value of plastic waste are becoming more widely known. The varying ages of the different products, the range of plastic polymers used (not always easy to identify), and the extent of contamination of items that have been lost from the system, coupled with varying stages of degradation and fragmentation poses a real challenge for dealing with this legacy waste in terms of its containment, collection and subsequent management.
It is also evident that there can be significant compositional differences in terms of legacy waste and waste generated daily, such as Municipal Solid Waste (MSW). The figures below illustrate the variations that can exist, showing typical composition of MSW in England and Indonesia. They also show waste composition in waterways in Indonesia.
Ellen MacArthur Foundation
1. Closed-loop recycling: Recycling of plastics into the same or similar-quality applications 2. Cascaded recycling: Recycling of plastics into other, lower-value applications

30+27+7+4+12+4+1+4+11+A21+44+4+1+16+5+9+A
63+9+1+1+13+2+7+4+APage 14Introduction
11 WRAP (2020) National MSW Composition England 2017 12 World Bank Group (April 2018) Indonesia Marine Debris Hotspot Rapid Assessment Synthesis Report 13 World Bank Group (April 2018) Indonesia Marine Debris Hotspot Rapid Assessment Synthesis Report
MSW Composition in England11
Waterway waste composition in Indonesia13
MSW Composition in Indonesia12
WRAP
World Bank
World Bank
In Indonesia, while plastic dominates waterway waste, it is evident from its composition that plastic bottles (which are generally easier to recycle than some plastic products) make up only a small percentage of this plastic waste. This variation is attributed to their ‘value’ and residents therefore containing and collecting these items and preventing their loss into the environment. This can impact on management options for legacy waste, and is considered in more detail in section 3.4. New plastic waste is the waste that is being generated daily that has the potential to be contained and collected at source, rather than a later date following its exposure to the environment.
The waste hierarchy can be applied to this waste stream and there is the potential for more market opportunities to be realised depending upon the quality, tonnage and range of polymers that can be contained, collected and sorted for onward processing.
Organic30%
Diapers21%
Misc11%
Other plastics9%
Wood4%
Electronics1%
Textiles4%
Plastic 12%
Plastic bags 16%
Plastic packaging 5%
Metal4%
Plastic bottles1%
Glass7%
Glass & Metal4%
Paper/Card7%
Other organic
waste7%
Organic63%
Other4%
Wood7%
Textiles2%
Plastic 13%
Paper9%
Glass1%
Metal1%

PreventionRedesign goods, packaging, products and services to prevent loss of resources from the process and reduce resource use overall. Change behaviour and patterns of consumption to prevent waste generation.
Minimisation / ReuseMinimise generation of waste products by changing consumption habits (using refills for example) and by retaining products for longer, reusing for the same function, or repurposing without loss of value.
Prepare for reuseRepair, test, clean products or dismantle to their component parts so they can be reused in the future.
RecyclingProcess material so it can be used as feedstock to make the same or another product. Includes Anaerobic Digestion and composting provideing the soil conditioner or compost meets quality protocols.
RecoveryEnergy may be extracted from the product and/or utilised in a range of different ways. Includes Incineration and Energy Recovery, AD where the output does not meet quality protocols, gasification, pyrolysis.
DisposalThis effectively represents the end of a products life. There will be no value retained. It is assumed that disposal is regulated. It includes landfill and incineration with no energy recovery.
Pre
ferre
d op
tion
Page 15Introduction
1.1.2 Applying the waste hierarchy
Plastic products have a lifespan of anywhere from 1 year to 100 years depending on the nature or purpose of the product. Plastic packaging tends to be designed for single use; its purpose is to protect the integrity of the product. This is very different to items such as a kitchen appliance, where the plastic component makes up the product itself and its appearance, durability and functionality are integral to the operation of the product. Management options for these products can therefore be very different.
The waste hierarchy has long been used by waste management experts and policymakers as a way to minimise the environmental impacts of waste, by reducing generation at source and emphasising the reuse, recycling and recovery options for a particular waste stream (see figure below). The waste hierarchy is used to structure thinking about how waste can be “pushed up” the pyramid, so that disposal (illegal dumping or landfill) is only considered the very last option for waste.
While Indonesia’s waste is largely landfilled at present, as the next chapters describe, Indonesian policy-makers have made moves to encourage options higher up the waste hierarchy, including waste-to-energy (described as ‘recovery’ in the figure below) as an alternative to landfill. This report will also argue that it is important to consider recycling and other treatment methods in order to keep waste away from the lower layers of the hierarchy.
The waste hierarchy
As illustrated by the waste hierarchy, preventing waste from occurring in the first place is the ideal scenario. Most, if not all, ambitious waste strategies and policies are aiming for this although it is extremely challenging to achieve. Much work has been done in some sectors to redesign products and processes to prevent wastage but other sectors such as packaging are constantly under scrutiny for not doing enough. On an individual level, waste prevention also requires changes in consumption habits and attitudes, and it is usually the case that as disposable income increases this becomes more challenging.
Minimisation and reuse/preparing for reuse does require consumers to change their habits and their mindsets but much can be done with the right systems in place. While charity shops have always provided a reuse outlet for some secondhand goods, we are starting to see the emergence of Repair Cafés and package-free/refill shops, however these tend to be niche activities at present. Changing behaviour can take time. For example, in the UK the drive towards moving away from single use cups and bottles and using refillables instead has achieved some, albeit limited, success to date but there is some way to go before this becomes the norm.
Adapted by Green Investment Group

Page 16Introduction
14 House of Commons Environmental Audit Committee (2017) Disposable Packaging: Coffee Cups. Second Report of Session 2017-19
CASE STUDY
Reusable Coffee Cups
Coffee-on-the-go culture in the UK has meant that 2.5 billion single use cups are used each year; however only 0.25% are recycled and half a million cups are littered every day.14 Over the last few years coffee shops increased their efforts to encourage customers to use re-usable drinks containers, by offering incentives such as discounts.
Many brands have brought out new designs of reusable coffee cups and sales of these has been increasing significantly, however the impact on the use of disposable cups has been minimal to date.
Recent research has indicated that rather than offering a discount on drinks for those with a reusable cup, as has been the standard approach by most, adding a charge on the use of disposable coffee cups appears to be more effective and this is now being rolled out by a number of larger brands.
It is worth noting that despite the apparent public support for the use of reusable cups there is a significant way to go before we can see behaviour change on any scale which will have an impact on single use cups.
Recycling on the other hand is well established, particularly for waste streams such as paper, glass and metals. Glass and metals can be recycled multiple times and made into new products without loss of functionality or value. Paper has more limitations in the number of times it can be reprocessed and it is more vulnerable to quality issues than glass and metal. Plastics in theory can be recycled but there are challenges for some plastics which are discussed in more detail in Section 3.4. Currently recycling of plastic bottles into other products is reasonably established, but the recycling of pots tubs and trays and film is much less so.
For food and garden waste, anaerobic digestion or composting deliver a recycling solution, providing the soil conditioner or fertiliser meets quality protocols.
DEFINITION
Recyclable
When considering whether plastic is recyclable, the definition adopted by the UK Plastics Pact and based on the Ellen Macarthur Foundation definition under the Global Plastics Commitment provides the most clarity.
A product is recyclable when it can be collected, sorted, reprocessed and manufactured into a new product or packaging, at scale and economically.
Recovery options include:
• Incineration with energy recovery,
• Anaerobic digestion - where the output does not meet quality protocols,
• Gasification and pyrolysis when producing energy (fuels, heat and power).
These options tend to be effective for residual waste streams or for recyclables for which there is no market including where they are considered to be too contaminated/poor quality for the recycling process.
The final option of disposal is to be used when all the other preferred management options have been exhausted and there is considered to be no value left in the product. Disposal in this case refers to regulated landfill or incineration with no energy recovery. Regulated in this case refers to landfill sites and incinerators which are engineered and have systems in place to control emissions and prevent loss to the environment. Sanitary or controlled landfill is also a term that is used to indicated that the site has been engineered to accept the waste and it is not simply open dumping.

Feedstock Collection
Raw material production
Consumption of product
Littering / dumping
Virgin
LandfillEnergy recovery
Plastic production
Mechanical and chemical recycling
Product manufacture
Sorting
Page 17Introduction
15 https://wrap.org.uk/sites/files/wrap/Polymer-Choice-and-Recyclability-Guidance.pdf 16 Closed Loop Partner (2019) Accelerating Circular Supply Chains for Plastics and World Economic Forum, Ellen MacArthur Foundation, McKinsey
& Company (2016) The New Plastic Economy
Applying the principles of the hierarchy to such a diverse waste stream is a challenge.
When considering the top tiers of the waste hierarchy, specifically prevention, minimisation and reuse, there is significant room for improvement in relation to plastics.
Recycling levels of plastic waste remains relatively low, particularly in comparison with other materials such as paper, glass or metals. Whilst some plastic such as rigid plastic packaging (PP, HDPE, LDPE and PET) can be readily recycled15 there are other polymers which have proved to be problematic in terms of establishing consistent market opportunities including for example plastic film.
One single product can contain many different polymer types, additives, dyes and pigments, and other materials such as metal or paper. This complexity can make identifying the most appropriate recycling process challenging. Also, the colour, weight, size and transparency can impact on the suitability of sorting systems and processing.
For some products, such as PET and HDPE bottles processes are very well established and there is a market available, however, it is worth noting that half of PET sold is never collected to be recycled and only 7% of the bottles collected are turned into new bottles.16 This is in stark contrast to aluminium for example, where it is considered that 75% of the metal ever made is still in use today.17 Composite plastics, which are often layered with different polymers and metals are very difficult to economically recycle at scale, and plastics with additives can be a challenge.
Plastic processing: applying circular economy principles to reduce use of virgin plastic
Packaging plays a functional role and is important in protecting the product and ensuring longer shelf life where appropriate, however some brands and organisations repeatedly receive criticism for over packaging of products and generating additional waste. Designers also come under scrutiny in terms of how much consideration is given to options higher up the waste hierarchy. A recent New Plastics Economy survey of more than 200 global members, including six of the ten biggest plastic packaging producers, revealed that only 3% of businesses’ packaging is designed for reuse.18
However, steps have been made in refining designs so that fewer materials are being used, minimising waste and maximising the potential for recycling. For example, many brands have replaced heavy pigmented paper labels with plastic shrink wrap labels, thereby reducing the different types of material being used in a single item. This opens up the potential options in terms of recycling processes, also reducing the potential for contamination from the presence of other materials during the recycling process. In addition, ‘light-weighting’ of products wherever possible is the new norm for most brands.
Green Investment Group
17 https://alupro.org.uk/consumers/how-is-aluminium-recycled/ 18 Ellen MacArthur Foundation, McKinsey & Company (2019) The New Plastic Economy Progress Report

Page 18Introduction
19 Coca-Cola New Release (2019) ‘Sprite to launch ‘Clear is the new Green’ campaign’
CASE STUDY
Sprite and Coca-Cola re-designing for recyclability19
Some brands are taking the initiative and re-designing their products to increase their potential recycling market value. Coca-Cola, who have made a commitment to double the amount of recycled PET used in its plastic bottles across all 20 brands, have relaunched Sprite in a clear bottle.
Sprite was sold in its iconic green plastic bottles, which although recyclable, attracted a lower value and less demand. In order to support recycling efforts the product is now sold in clear bottles and the advertising campaign that accompanied the relaunch focused on increasing its recycling potential.
1.2 Green finance is a strategic solution for the regionWe will see in Chapter 2 that Indonesia faces a great challenge of scaling up and diversifying its waste management infrastructure. This will allow Indonesia to move the way its plastic waste is managed up the waste hierarchy. Achieving this transition will take a mix of regulation, policy, infrastructure development, investment and behavioural changes. We set out some of these aspects in the next sections of the report, with a focus on accelerating investment in waste infrastructure.
Financing waste infrastructure is a formidable challenge that will require the right enabling environment and capability, both in the public and private sectors. In this section we will show how waste financing typically takes place, and how this can be considered in the Indonesian context.
1.2.1 Anatomy of a public waste deal
Where new markets are being created, the vast majority of infrastructure deals for MSW treatment are led by the public sector. These take the form of public-private partnerships (PPPs) or private finance initiatives (PFIs).
In Indonesia, waste collection is handled by municipalities – making it more likely that waste deals will be led by the public sector rather than merchant deals, which would be led by the private sector.
PPPs and PFIs are designed to build infrastructure even where the investment needed surpasses the amount of public finance available. A government body or local authority will typically design a project and launch a competitive tender. A consortium of private firms will be asked to deliver a project (that is financing, designing, building, operating and maintaining the asset) and will receive a guaranteed level of revenue in exchange. In Indonesia’s case, the government will pay a tipping fee. In most cases, there is an element of risk sharing whereby the public body guarantees construction permits and some certainty in terms of policy and regulation. In exchange, the consortium will guarantee that the asset will be built and operated to the expected standard.
Public-private partnerships (PPPs)
Green Investment Group
Plugging the public finance gapGovernments can ask private firms
to deliver new infrastructure projectsPublic and private partners
share the risks
Public budget Infrastructure investment needs
Governments stay accountable for the for provision of public services
Competitive tender
The firm recovers its investment through service fees from users and governments
The private firm takes responsibility for
financing, designing, building, operating
and maintaining the asset
Permits, legal frameworks, changes in jurisdiction, regulations
Design, cost efficiencies, operations, technology
Sufficient demand, force majeure

01
03
05
02
04
06
Page 19Introduction
Public-led infrastructure deals, including for waste, take place through competitive tenders. Given the complexity of infrastructure design, construction and operation, the procurement process itself is also relatively long, often taking 12-18 months. This helps the local authority ensure it is getting the best technical solution and the best possible price for the project it wants to achieve.
Indicative process for a public tender
Soft market test
Public body engages with market players to discuss a specific project
• Includes finance, developers, equity sponsors, equipment suppliers, waste companies, EPC contractors
Invitation to submit a solution
Government asks bidders to produce outline of the proposed project
• Government sends bidders more detail on what it is looking for and request more detailed bids
• Government will look to capture strong technical bids
• Once the best technical proposals are identified, focus turns on finding the best price
Final negotiations
Government awards the contract and negotiates the final product
• The final terms of the financial, technical and legal solutions are agreed
Expression of interest
Also known as pre-qualification questionnaire (PQQ)
• Government publishes 1 page description of the project and 3-4 criteria based on which it will select a contractor
• Companies form consortiums
• Typically 20-30 organisations apply and 6-10 make it through to next stage
Final tender
Usually, 2 firms compete to win the contract
• Project consortiums begin negotiating terms with debt banks to finalise the financing model
• Consortiums put together detailed term sheets and start shaping final contract
Final close
Construction begins
Green Investment Group
Page 20Introduction
In the UK and in many other countries, the local authority, local government or public body puts together a project outline, a legal contract and assesses the bids it receives. As part of this process it is extremely common that it will receive support from specialist legal, engineering and financial consultancies.
• The soft market test serves as initial advertising that a local authority or public body is asking for feedback from specialist firms about a specific project. This could be in the form of a mass bidders’ day and/or closed-door meetings with investors and companies to gather more nuanced feedback. The companies typically involved in this process include finance providers and investors (especially equity sponsors); developers; equipment suppliers; waste companies; and engineering, procurement and construction (EPC) contractors. On the back of this soft market test, some companies may start to engage each other and test appetite to form consortium that will take part in the bid. After this, local authorities will design the contract, including by securing budget internally, setting out the waste specifics (tonnage and composition) that a waste plant should be able to process, and for what price.
• The formal procurement process starts with a pre-qualification questionnaire or expression of interest. This is often a short description of the project and an outline of a few criteria which the local authority will be looking for in consortiums or waste companies. At this stage this usually focuses on experience (e.g. having delivered similar projects), rather than price of demonstrating a certain level of turnover. This process is only to help the local authority disqualify any non-credible bidders. If around 20 to 30 organisations will apply – only 6 to 10 will be invited to tender. The organisations that have not formed consortiums yet will likely be invited to join forces with other organisations that pre-qualified separately for later stages. A consortium will be typically led by a waste company, who will bring in technical advisors, a specialist bid-writing team, legal firm, EPC contractor, equity investors and others. Later in the process, this consortium can be formalised into a joint-venture (JV) or into a special purpose vehicle (SPV), to be owned by equity investors. All the contracts, from operations and managements to debt agreements, will sit under the SPV.
• The local authority will run the tender process in several stages, starting with an invitation to submit an outline solution, then an invitation to submit a detailed solution and invitation to submit final tender. The objective of running several phases is first to capture strong technical bids, introducing competition on a price later on. So, the marking scores will overly weigh technical solutions in the first stages, then put more weight on pricing in the final stage.
• Once the tender closes and a consortium has won, they will enter a longer period of negotiated dialogue with the local authority where the final contract is negotiated, and final legal, technical and financial points are agreed upon. The project reaches financial close once the agreement is signed and the financiers are on board.
1.2.2 Anatomy of a merchant waste deal
While it is arguable that Indonesia’s waste market isn’t yet ready for purely merchant deals, it is helpful for policy-makers to keep in mind some principles which investors use for merchant deals.
For most countries looking to expand their infrastructure base, the strategy is often to shift deals towards increasingly commercial models, so that governments can reduce pressures on public balance sheets. We will see in the next chapter that this consideration is important in Indonesia’s context. The UK has made this gradual shift in sectors such as waste and power generation over the past decades, while other sectors such as transport and science funding remain largely publicly funded.

Page 21Introduction
20 Infrastructure and Projects Authority (2016) National Infrastructure Delivery Plan 2016-2021
CASE STUDY
The UK’s transition from public to private-led infrastructure finance models
Since 2010, the UK publishes a National Infrastructure Plan, updated annually which provides investors with detailed information on the UK’s priority investments, what the government is doing to improve infrastructure (such as reducing costs and planning delays) to help attract private finance.
In the 2016-2021 UK National Infrastructure Pipeline, the mix of public versus privately funded infrastructure is around 47-47%, with the remaining 5 or 6% being a mix of public and private. In the waste sector, around 97% of waste infrastructure will be privately funded.20
The UK model for transitioning from public to privately funded infrastructure, and how this applies to waste infrastructure
Financing Waste sector Funding
Upfront investment made by public capital
Public industry Commercial waste operations by local authorities
Paid for by taxpayers
Conventional capital procurement
Municipal waste facilities
Upfront investment made by private finance
PPP/PFI Municipal waste treatment Paid for by taxpayers
Economically regulated private industry
Paid for by users
Other private industry Commercial waste disposal
UK’s Department for International Trade
Merchant deals (i.e. projects initiated by private sector companies) tend to be much more fluid and do not follow a specific process. We have outlined below a generic flow chart describing how a merchant deal might evolve from initial concept to financial close.
In most cases, private firms will focus on solving a specific challenge for a location or a client – an energy off-taker for waste to energy, or a buyer of recycled plastics such as a petrochemical plant or packaging manufacturer.
The main company (typically a waste company) will then bring together a consortium of complementary organisations, similarly to public-led waste deals, to put together a technical proposal which it will put forward to a local government body for approval. Typically, these public sector institutions still need to be involved to ensure issues such as land use, planning and construction permits are made available for the project to go ahead.
An indicative process for how a merchant deal might unfold is described in the figure overleaf.

01
03
05
07
02
04
06
Identify the challenge
Waste firm determines a challenge and possible solution
• Identify a gap in the waste journey (collection, sorting, management) and a technical solution
• Identify end product and user (e.g. plastic manufacturer, petrochemical company)
Identify specifications
The waste firm will determine what it needs to ensure success
• Accessible and suitable site
• Feedstock: tonnage and composition
• Access to water and energy
Agree contract with public body
The consortium approaches local authority or Government body
• Consortium agrees contract with the public body
• Will also require agreements in terms of use of land, construction approvals etc
Construction begins
Understand the market
Carry out market analysis to ensure the project fits investment criteria
• The firm will ensure they have full understanding of the local market, policy and how it is enforced before going ahead
Consortium formation
Waste firm will identify local and international partners
• Typically will include equity investors, waste suppliers, offtakers, EPC contractor
• Will sometimes publish the project’s specifications and ask market players to bid in for parts of the work
• Consortium often set up as a joint venture or special purpose vehicle
Finalise financing structure
• Agree equity and debt terms
• Agree exit strategy (equity exit, refinancing etc)
Green Investment Group
Page 22Introduction
Indicative process for a merchant waste deal

Green Investment Group and Macquarie Group
Page 23Introduction
1.2.3 How do investors think about waste infrastructure?
From our stakeholder interviews with the private sector (including waste developers and investors), it was clear that each firm uses several selection criteria which helps them decide whether to move into a new market, and to vet a waste project idea.
The most important thing for any financiers will be that the project will deliver one or several measurable and predictable revenue streams. This will be discussed in more detail in the following chapter.
What makes a project bankable?
From the perspective of a waste developer, here are some of the most important considerations:
• Rule of law:
− There must be laws and regulations in place, with certainty that they will be in place over the long-term,
− They must be enacted and have enforcement mechanisms, including penalties,
− Regulators have appropriate enforcement powers,
− Government must have strong governance processes in place. This includes a strong, transparent and reliable procurement process, which reduces risks of disputes and gives investor confidence,
− Willingness for a public body to enter binding agreements on the provision of waste or on feed-in-tariffs. This can be conditional on the consortium fulfilling its part of the contract but cannot be done on a voluntary basis from government’s side.
• Waste data: clarity on incoming tonnage and waste composition. For waste to energy, this helps determine the calorific value of the waste and design the right capacity and technical solution. Consistent feedstock is key to provide certainty about revenue stream and return on investment, especially for certain types of waste treatment technologies where waste composition is key to the process being able to operate effectively. The same applies to recycling technologies:
− Is there enough waste in the area to supply to the plant?
− Are there competing plants in the area?
• Land and logistics:
− Is the local authority providing land and supporting the project in securing the necessary consents, such as building permits and environmental permits?
− Is there access to water, to the electricity grid?
− Can the waste be safely and effectively transported to the plant?
− Are there telecoms such as phone lines and internet which could allow remote monitoring of some of the activities?
Measurable and predictable revenue stream
Risk sharing Yield and return
Governance Development stage
Local and national policy alignment
Resilient to future changes
InfrastructureTransaction size
Replicable

Page 24Introduction
• Climate risks: what is the project’s exposure to extreme weather events such as typhoons?
• A designed pathway for waste management in the long-term
• Support for research and development, innovation and industrialization
• Competitive markets
• Low levels of crime and fraud
• Trained and skilled workforce
From the perspective of investors, similar considerations matter:
• Local partners: a waste consortium can involve one or several local waste firms (which could include consultants, EPC companies or others) which can help investors better understand local market dynamics, who to engage in government, how legislation and regulation works, what future policies might be expected, etc. Characteristics of good local partners for international firms typically include:
− Local insights: knowledge of where to get information, how regulation works, who decision-makers are.
− Tender-writing: understanding of how to write public tenders, how to pitch to governments, and which Ministries are important.
− Influence: without engaging in lobbying or unlawful activities, being able to be a recognised voice when governments consult with the waste management sector and requests feedback, helping to develop policies that create the right enabling environment for the market.
• Understanding costs: these will typically include due diligence, research, construction, long-term operational costs (such as training for local labour or chemicals required for maintenance).
• Understanding revenue: as shown in the infographic on the previous page, measurable and predictable revenue is key to any infrastructure project. In waste, this can be driven by tipping fees, energy revenue or revenue from recycled products.
• Guaranteed payments: even if waste tonnage and composition changes over time, are the payments to the waste plant guaranteed by government? This is typically covered by national rather than local government, as is often the case in Indonesia.
• Exit strategy: equity investors will look to make a return before the project comes to an end – sometimes before the project has finished construction. If an early stage equity investor takes on more risk by providing financing before construction, it might consider selling some of its equity of refinancing its equity into debt with higher interest rates.
For many investors entering new markets such as Indonesia, pipeline will also be a central consideration. Some interviewees told us that they would not enter new markets for a single project, but rather need visibility that there are opportunities to finance and develop multiple projects, which justify the cost of initial research and due diligence.

European Union
India
Thailand
% of global total, 2015
Philippines
Vietnam
Indonesia
China
United States
35302520151050
Jambeck, Geyer, Wilcox, Seigler, Perryman, Andrady, Narayan and Lavender Law (2015) ‘Plastic waste inputs from land into the ocean’
Page 25Introduction
1.3 Solving the global plastics pollution challenge starts in South East AsiaSouth East Asian countries face a dual challenge: building infrastructure that can both tackle ‘legacy’ waste, which manifests largely as plastic pollution, and also manage increasing waste generation over the long-term, as ASEAN countries continue to grow their economies. Achieving this can improve health and safety of local communities, reduce ocean pollution and shift consumption towards more sustainable products, and bring further economic benefits such as creating better jobs, attracting infrastructure investment and exporting recycled materials.
Existing waste infrastructure in the region is struggling to keep up with domestic waste collection as well as plastic imports from developer markets, with over 140,000 tonnes coming to Indonesia in 2018 alone.21 The region is not equipped to deal with the influx of plastic exports that have dramatically increased since China closed its borders for plastics imports in 2018. As a result, more than half of land-based plastic pollution in the oceans originates from five countries, four of which are in Southeast Asia.22
Origins of plastic debris entering the ocean
21 Financial Times (2018) ‘Why the world’s recycling system stopped working’ 22 Jambeck, Geyer,Wilcox, Seigler, Perryman, Andrady, Narayan and Lavender Law (2015) ‘Plastic waste inputs from land into the ocean’ 23 World Bank (2018) Indonesia Marine Debris Hotspot: Rapid Assessment, Synthesis Report 24 Ocean Conservancy and McKinsey Center for Business and Environment (2015) Stemming the tide: land-based strategies for a plastic-free ocean
The World Bank recently commented that “[t]he waste management challenges facing Indonesia are formidable, but they are by no means insurmountable. The [g]overnment... is addressing its marine debris challenge head on and can help turn the tide for East Asia. The bulk of Indonesia’s challenge to halt marine debris involves addressing its inadequate municipal waste management service provision.”23
A 2015 McKinsey study identified the two main drivers of plastics leakage as uncollected waste and the low value of certain types of plastics. This study found that 75% of land-based leakage sources originate from uncollected waste and 25% from formal municipal solid waste management systems. And, that recycling is insufficient to reduce plastics leaking to the ocean, as only 20% of plastics have enough value to be recycled. Also, for every metric ton of uncollected waste near waterways, 18 kilograms of plastics enter the ocean and that for every metric ton of plastic waste collected, 7 kilograms are leaked to the ocean between collection and disposal; underscoring the importance of primary collection and highlighting the fact that, although ocean plastics pollution is a global challenge, its solution requires local action.24

Page 26Introduction
1.4 Report outline and approach
1.4.1 Report structure
Chapter 1 aims to create an ambitious vision for waste management in Indonesia. We will provide a detailed review of the current policy drivers, barriers to investments, the costs of mismanaged waste and the economic opportunities that come with managing it better.
Chapter 2 follows the standard ‘waste journey’, from collection, sorting, recycling, energy recovery and landfill. For each of these steps, we will cover three themes:
• How does the journey typically take place, in particular for plastics?
• How is this phase typically financed, and where do revenue streams come from?
• What is the state of the market in Indonesia?
Chapter 3 identifies several specific challenges for financing waste in Indonesia, and explores three types of interventions:
• Public policy interventions, at local and national level
• Public finance interventions, which include funding from the Government of Indonesia, development finance institutions, or other bilateral support
• Private finance interventions, i.e. actions which can be delivered by the private sector, both local and international.
Chapter 4 provides recommendations for turning this report into action
1.4.2 Methodology
This report was written on the back of detailed literature review from academic, civil society, development finance and think tank experts.
We also conducted in-depth, semi-structure interviews with the people listed in the acknowledgement sections – ranging from development banks, local business, civil society and international investors. This allowed us to capture a broad range of perspectives on the issues described below. We have many stakeholders to thank for introducing us to their own contacts and helping us capture a diverse set of expertise.
This report bases its findings on this research, combined with our own investment experience in waste infrastructure and emerging markets, including in South East Asia. Our ambition is that this report and its recommendations represents a single ‘voice’ for the finance sector and what this rich and varied industry would look for in order to invest in waste infrastructure in Indonesia.
1.4.3 Managing internal conflicts
Green Investment Group has investment activities in waste infrastructure, including live deals in the ASEAN region at time of writing this report. The GIG advisory team responsible for putting this report together has worked with the investment team; for example, they accessed their expertise to support the report, in particular on how the investment team typically structures deals and how they consider investments in new markets. A lot of the infographics presented in this report were made with the help of the specialist investment team. The advisory team also relied on the networks of clients and other investors to arrange some of the stakeholder interviews upon which this report is based.
In order to manage any potential conflicts of interest arising out of the investment team’s involvement in ASEAN waste deals, governance processes are in place to ensure that the investment team did not disclose any sensitive deal information to the GIG advisory team. The investment team were not directly involved in the research and drafting processes for this report and did not attend stakeholder interviews and was not involved in the shaping or drafting of the recommendations.

A vision for Indonesia: plastic is a resource

WasteAid analysis
Page 28A vision for Indonesia: plastic is a resource
25 OECD (2018) Improving Plastics Management: Trends, policy responses, and the role of international co-operation and trade 26 WasteAid and CWIM (2017) Making waste work: a toolkit 27 UNEP (2015) Pollution is the largest cause of death in the world, SDG fact sheet; World Health Organisation (2017) Global Health Observatory
data on malaria mortality
2.1 Scale of the challenge and costs of mismanaged wastePlastics pollution warrants considerable attention for two reasons. Firstly, because of the longevity of plastics: plastic waste accumulates in the natural environment will decompose over hundreds or thousands of years, during which time they decompose into microplastics and nano plastics – meaning they are likely to have an impact on ecosystems for long periods of time. Secondly, plastics’ effects on human health remains uncertain. Significant quantities of plastic have only been introduced into the natural environment relatively recently. The full impact on marine and terrestrial ecosystems and on human health may only emerge in the longer term.25
Some consequences of plastic mismanagement and pollution are already evident today. They are difficult to disentangle from the effects of waste as a whole, so this section will often refer to waste more broadly.
Environmental, health and economic costs of unmanaged waste
Pollution of... Economic costs of... Health risks...
• Farmland
• The air we breath
• Drinking water
• Lakes, rivers & canals
• Wildlife areas & tourist attractions e.g. beaches
• Social ill-health & unrest
• Cleaning polluted areas
• Flooding due to blocked drains
• Climate change emissions
• Damage to livestock & wildlife
• Loss of business & tourism
• Children’s growth stunted
• Cholera & diarrhoea
• Eye & skin infections
• Respiratory & reproductive health problems
• Polluted air, water & food
2.1.1 Health
Uncollected waste creates unsanitary conditions and causes serious risks to public health, particularly for children. Dumped waste attracts birds, rats, dogs and other animals, which can spread disease. It also attracts flies and gives them a place to breed. Mosquitoes breed in pools of water, in blocked drains, old tyres and pots, and spread diseases like malaria, cholera, dengue fever and yellow fever. Scavenging and contact with waste can lead to increased cases of dysentery, diarrhoea and cholera.26
Each year approximately 9 million people die of diseases linked to mismanagement of waste and pollutants, 20 times more than die from malaria.27
Broken glass and sharp metal can also cut feet and cause open wounds. Medical waste and needles that have been in contact with sick people can transmit diseases.28
Livestock that eats waste often become ill: studies have found up to a third of cattle and half of goats have consumed significant amounts of plastic, and that those that consume more plastic tend to be more emaciated and prone to disease.29
Waste is unsightly. It smells unpleasant and lowers the morale of communities.
Legacy plastics pollution specifically poses risks for human health. The presence of plastic in seafood and livestock and their consumption by people has led to concerns about chemical bio-accumulation in the food chain. However, research on the effects of plastic ingestion on humans remains limited to date.30
As we will see later, nearly half of plastic waste is burned by households. Waste burning releases harmful substances into the atmosphere, often close to where people live. Plastic burning also emits several tonnes of heavy metals (like lead, nickel, chromium and zinc) each year. These substances are carcinogenic and prolonged exposure increases the risk of cardiovascular diseases.31
28 WasteAid and CWIM (2017) Making waste work: a toolkit 29 WasteAid and CWIM (2017) Making waste work: a toolkit 30 OECD (2018) Improving Plastics Management: Trends, policy responses, and the role of international co-operation and trade 31 World Economic Forum (2020) Radically Reducing Plastic Pollution in Indonesia: A Multi-stakeholder Action Plan National Plastic Action Partnership
Page 29A vision for Indonesia: plastic is a resource
32 Ocean Conservancy and Trash Free Seas Alliance (2019) Plastics Policy Playbook: Strategies for a Plastic-Free Ocean 33 OECD (2018) Improving Plastics Management: Trends, policy responses, and the role of international co-operation and trade 34 World Economic Forum (2020) Radically Reducing Plastic Pollution in Indonesia: A Multi-stakeholder Action Plan National Plastic Action Partnership 35 World Economic Forum (2020) Radically Reducing Plastic Pollution in Indonesia: A Multi-stakeholder Action Plan National Plastic Action Partnership 36 World Bank (2018) Indonesia Marine Debris Hotspot: rapid assessment 37 GAIA (2019) Discarded: communities on the frontlines of the global plastic crisis 38 World Bank (2018) Indonesia Marine Debris Hotspot: Rapid Assessment, Synthesis Report 39 World Bank (2018) Indonesia Marine Debris Hotspot: Rapid Assessment, Synthesis Report 40 World Economic Forum (2020) Radically Reducing Plastic Pollution in Indonesia: A Multi-stakeholder Action Plan National Plastic Action Partnership 41 World Economic Forum (2020) Radically Reducing Plastic Pollution in Indonesia: A Multi-stakeholder Action Plan National Plastic Action Partnership
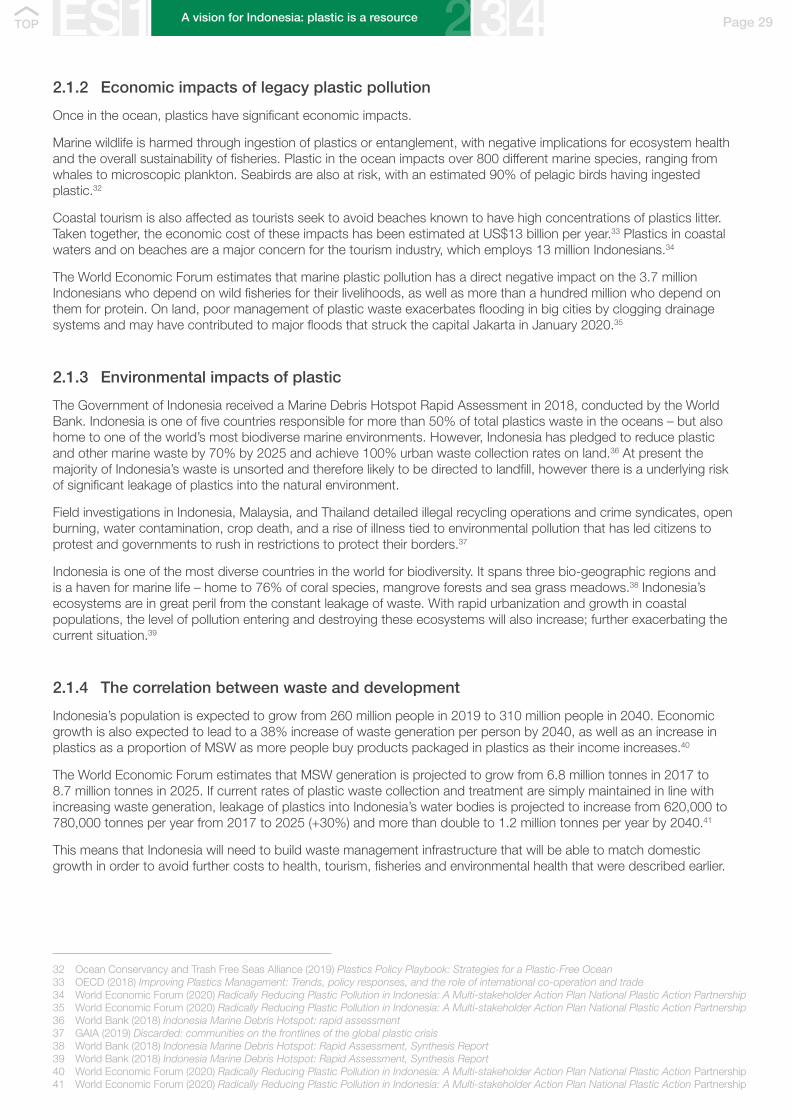
2.1.2 Economic impacts of legacy plastic pollution
Once in the ocean, plastics have significant economic impacts.
Marine wildlife is harmed through ingestion of plastics or entanglement, with negative implications for ecosystem health and the overall sustainability of fisheries. Plastic in the ocean impacts over 800 different marine species, ranging from whales to microscopic plankton. Seabirds are also at risk, with an estimated 90% of pelagic birds having ingested plastic.32
Coastal tourism is also affected as tourists seek to avoid beaches known to have high concentrations of plastics litter. Taken together, the economic cost of these impacts has been estimated at US$13 billion per year.33 Plastics in coastal waters and on beaches are a major concern for the tourism industry, which employs 13 million Indonesians.34
The World Economic Forum estimates that marine plastic pollution has a direct negative impact on the 3.7 million Indonesians who depend on wild fisheries for their livelihoods, as well as more than a hundred million who depend on them for protein. On land, poor management of plastic waste exacerbates flooding in big cities by clogging drainage systems and may have contributed to major floods that struck the capital Jakarta in January 2020.35
2.1.3 Environmental impacts of plastic
The Government of Indonesia received a Marine Debris Hotspot Rapid Assessment in 2018, conducted by the World Bank. Indonesia is one of five countries responsible for more than 50% of total plastics waste in the oceans – but also home to one of the world’s most biodiverse marine environments. However, Indonesia has pledged to reduce plastic and other marine waste by 70% by 2025 and achieve 100% urban waste collection rates on land.36 At present the majority of Indonesia’s waste is unsorted and therefore likely to be directed to landfill, however there is a underlying risk of significant leakage of plastics into the natural environment.
Field investigations in Indonesia, Malaysia, and Thailand detailed illegal recycling operations and crime syndicates, open burning, water contamination, crop death, and a rise of illness tied to environmental pollution that has led citizens to protest and governments to rush in restrictions to protect their borders.37
Indonesia is one of the most diverse countries in the world for biodiversity. It spans three bio-geographic regions and is a haven for marine life – home to 76% of coral species, mangrove forests and sea grass meadows.38 Indonesia’s ecosystems are in great peril from the constant leakage of waste. With rapid urbanization and growth in coastal populations, the level of pollution entering and destroying these ecosystems will also increase; further exacerbating the current situation.39
2.1.4 The correlation between waste and development
Indonesia’s population is expected to grow from 260 million people in 2019 to 310 million people in 2040. Economic growth is also expected to lead to a 38% increase of waste generation per person by 2040, as well as an increase in plastics as a proportion of MSW as more people buy products packaged in plastics as their income increases.40
The World Economic Forum estimates that MSW generation is projected to grow from 6.8 million tonnes in 2017 to 8.7 million tonnes in 2025. If current rates of plastic waste collection and treatment are simply maintained in line with increasing waste generation, leakage of plastics into Indonesia’s water bodies is projected to increase from 620,000 to 780,000 tonnes per year from 2017 to 2025 (+30%) and more than double to 1.2 million tonnes per year by 2040.41
This means that Indonesia will need to build waste management infrastructure that will be able to match domestic growth in order to avoid further costs to health, tourism, fisheries and environmental health that were described earlier.

Circulate Capital
In Indonesia, delineation is drawn between the collection, transfer and disposal pathway responsibilities of local government and communities:42
• City and district governments are ultimately responsible for solid waste management (Waste Management Act (No.18/2008). Local government regulations do not always uphold national government laws & policies.
• The Municipal Planning Agency and Cleansing Services Unit are the main local government agencies responsible for planning and implementation of solid waste management.
Responsibilities for specific stages of waste service provision are as follows:43
• Collection and transport of household waste to Temporary Disposal Sites (TPS) or Intermediate Transfer Facilities (TPST) are the responsibility of the neighbourhood and community organisations.
• Transport of waste from the TPS/TPST to the Landfill (TPA) is the responsibility of local government.
• Collection and transport of estate waste from source to the TPS/TPST, or directly to the TPA, is the responsibility of the estate management (residential, commercial or industrial). Collection and transport of waste from public and social facilities is the responsibility of local government.
In Indonesia, the issue of plastic waste is governed by several pieces of legislation and policies:
• Long-Term National Urban Development Plan, 2015-2045, sets targets of urban service standards and city waste management, demanding high sector performance. Solid waste management is high on the national agenda, as exemplified by the “100-0-100” target of eliminating all slums and providing universal access to water and sanitation, including solid waste.44
Page 30A vision for Indonesia: plastic is a resource
42 World Bank (2018) Indonesia Marine Debris Hotspot: Rapid Assessment, Synthesis Report 43 World Bank (2018) Indonesia Marine Debris Hotspot: Rapid Assessment, Synthesis Report 44 World Bank (2018) Indonesia Marine Debris Hotspot: Rapid Assessment, Synthesis Report
2.2 Building on Indonesia’s strengthsIndonesia has already shown ambition to tackle legacy plastic pollution as well as new MSW. In this section, we describe where we see Indonesia’s greatest strengths and have provided several case studies to highlight where other countries are taking a comparable approach.
2.2.1 Strong policy environment
The Introduction section makes it clear that policy certainty is a central consideration for investors. When asked why they had chosen to do business in Indonesia, our interviewees consistently mentioned Indonesia’s strong policy suite as well as clear objectives in the short and long term.
The management of solid waste generally involves a complex interaction between, and often overlapping administrative responsibilities of, four principal central government agencies.
There are multiple ministries associated with waste management in Indonesia, as described in the table below.
Ministry of Environment and Forestry
Ministry of Public Works and Housing
Ministry of Development
Coordinating Ministry of Maritime Affairs
• Develops policies and formulates regulations
• Coordinates efforts in waste collection and recycling
• Provision of technical advice
• Promotion of pilot projects
• Construction and supervision of waste infrastructure and landfills
• Infrastructure development with development finance support
• Ownership of National Marine Debris Action Plan

• Solid Waste Management Act (No. 18/2008), required the closure of all open dumping by 2013 and requires all three levels of government (national, provincial, city) to contribute to financing the sector.45 This sets an ambitious goal for improvement of public service delivery. This law covers household solid waste; waste from commercial, industrial and special areas, and social and public spaces; and specific waste, including hazardous, construction and demolition waste.
• Environmental Protection and Management Law (Law No. 32/2009) requires systemic and integrated efforts to preserve the environment and provides for the development of a national Environmental Protection Plan and the management of hazardous and toxic waste that might directly or indirectly endanger or destroy the environment.
• The National Waste Management Policy and Strategy championed by the Coordinating Ministry of Economic Affairs proposes a target of 30% waste reduction and recycling by 2025.
• Solid waste management is included as the third most important sector in Indonesia’s Nationally Determined Contribution (INDC) prepared for the 2015 Paris Climate Change Conference (COP 21).
• National legislation and government policies that are supportive of investment, particularly foreign capital.46
To address the issue of ocean plastic mismanagement, the Government of Indonesia has developed the National Marine Debris Action Plan, 2017-2025 that commits Indonesia to the goal of reducing marine plastic debris by 70% by 2025. The national government also pledged to invest up to US $1 billion a year in cleaning up its rivers and seas. The Plan comprises five pillars:
• Improving behavioural change
• Reducing land-based leakage
• Reducing sea-based leakage
• Reducing plastic production and use
• Enhancing funding mechanisms, policy reform and law enforcement
The implementation of India’s Plastic Waste Management Rules in 2016 has had a measurable impact upon the waste plastics market. According to stakeholders, there has been some expansion in the variety of plastics that informal collectors are willing to collect – beyond PET into HDPE, Tetra Pak and even laminates.47
The Global Plastics Action Partnership (GPAP), led by the World Economic Forum in collaboration with governments, business and communities, is helping to translate these commitments into action with a focus on Indonesia, Africa and the Pacific. GPAP brings together policymakers, businesses, civil society advocates and entrepreneurs to design common solutions. In April 2020, GPAP published its report Radically Reducing Plastic Pollution in Indonesia: A Multi-stakeholder Action Plan, which provides insights and new analysis for reducing plastic leakage by 70% by 2025 and make a transition towards a more circular economy by 2040.
Stakeholders and specialist reports often note the prominence of Waste to Energy (WTE) in Indonesia’s policy environment. Most notably in Thailand and Indonesia, there have been recent legislative and/or regulatory changes that reflect the growing focus of South East Asian governments on WTE projects. Recent Presidential Regulation intends to provide a more comprehensive framework for WTE project development. This reflects the Government of Indonesia’s (GoRI’s) commitment to converting plastic waste into energy captured in its National Marine Debris Action Plan, 2017-2025.
One much talked about scheme is the support announced by central Government to help build 12 new WTE plants. According to a February 2019 energy ministry statement, 12 waste-to-energy power plants are due to be operating by 2022 and combined should create up to 234 megawatts48 of electricity using 16,000 tons of waste a day.49
Some cities are tackling this with ‘B2B’ (business-to-business) or ‘B2G’ (business-to-government) models, while others have focused on a PPP model. The B2B model has been carried out with local state-owned enterprises as well as larger foreign companies.
Some tenders were awarded to private companies but to date, no project has been implemented.50 We will explore this in section 2.3.1 in more detail.
Page 31A vision for Indonesia: plastic is a resource
45 World Bank (2018) Indonesia Marine Debris Hotspot: Rapid Assessment, Synthesis Report 46 Circulate Capital (2019) Investing to reduce plastic pollution in South & Southeast Asia: A Handbook For Action 47 Circulate Capital (2019) Investing to reduce plastic pollution in South & Southeast Asia: A Handbook For Action 48 For scale, Indonesia’s final electricity consumption was 235 TWh in 2018. (IEA data) 49 For scale, Indonesia is estimated to generate around 190,000 tonnes of waste per day, the majority of which is organic matter. (Jakarta Post) 50 GIG stakeholder interviews

The importance of implementing policies and enforcing regulations
All stakeholders who were interviewed, from waste developers to investors, unanimously cited policy and regulatory implementation as core criteria for deciding whether to expand activities in new markets.
One way that corporations test that regulations are being implemented is by checking whether infringements have been prosecuted and punished.
In Indonesia, there have been high profile cases of prosecutions focused on unlawful exports of waste from other countries into Indonesia. In 2019 for example, Indonesia returned 19 waste containers to the UK, after they were found to contain a combination of rubbish, plastic waste and hazardous materials that did not meet import rules. Indonesian authorities have been seen to ramp up activities in testing incoming waste from other countries and following strict return policies when this waste does not meet regulations.
However, we did not find information on cases where Indonesian authorities prosecuted firms for violations on Indonesian soil, such as illegal dumping.
A vision for Indonesia: plastic is a resource Page 32
CASE STUDY
UK prosecutions for waste-related prosecutions
In the UK, the Environment Agency was set up to act as a regulator and enforcer of all environmental regulations, including waste-related rules. Prosecutions are listed on the official UK Government website, and in the Environmental Agency’s Annual Report and Accounts, which are published every year.
Over the year 2018-19, the Environment Agency brought 77 successful waste crime prosecutions, resulting in 8 prison sentences and fines of £440,000.
The list of standard offences with regards to waste management and specific responses (including warnings, formal caution and prosecution) are listed here: https://www.gov.uk/government/publications/offence-response-options-environment-agency/waste-offences

A vision for Indonesia: plastic is a resource Page 33
CASE STUDY
Policy enforcement in the European Union
In order to encourage compliance, governments across Europe use a ‘carrot and stick’ approach to establish incentives and enforcement mechanisms for local governments responsible for service delivery.
New EU member states have gone further, adopting a policy where the central governments promote the desired sector investments through financial incentives. For instance, capital grants are made available where municipalities partner together to establish regional treatment and disposal facilities and operations rather establish individual municipal projects.
Similarly, central governments often require mandatory, sometime centrally organised, waste accounting and reporting systems which is the basis for regulatory oversight and enforcement.
Thanks to a mix of good policies and strong enforcement, Europe has achieved a gradual reduction in the proportion of waste going to landfill, an increase in waste recovery (WTE) and even greater increases in material recycling and composting, following the principles of the waste hierarchy.
Municipal waste treated, EU-28, 1995-2010
300
50
0
250
100
150
1995 2000 2005 2010 2015 2018
200
Landfill Incineration Composting OtherMaterial recycling
Million tonnes
The role of waste management targets
The role of targets for improving waste collection, management and recycling is often debated in Europe and the UK. In the UK as in many other countries, targets are adopted at national level but not enforced at local level. Rather, local authorities are consulted and given independence to decide which strategies work best to help reach national targets.
In this approach, it is important to:
• Put in place a detailed and transparent consultation exercise with local authorities in order to:
-61%
+117%
+201%
+202%
-44%
Eurostat data, Green Investment Group analysis

Page 34A vision for Indonesia: plastic is a resource
51 UK Parliament inquiry (2017) Waste Strategy: Implications for local authorities
− Create buy-in from local authorities that they should proactively seek to meet national targets at the local level.
− Consult local authorities on the implications of reaching new targets, in particular in terms of budgeting and tax rates.
• Create consistency over what is collected rather than how it is collected. Large-scale recycling facilities will benefit from accessing similar waste streams across local authorities, while local government should retain the ability to design collection systems that work for their own circumstances.
CASE STUDY
The UK’s Government approach to waste targets51
The UK is bound by European Union waste targets, waste laws (until if formally exits the European Union) and overall approach such as respecting the waste hierarchy; at the same time, it has responsibility for developing and implementing its own national policies in order to meet these targets. The UK’s latest waste strategy includes proposals for greater consistency in waste collection and management across the country, as well as more ambitious targets for collection, recycling and reducing waste going to landfill.
However, the UK has not imposed specific targets on municipalities. Instead, it is encouraging a flexible yet ambitious approach:
• The law already requires local authorities to collect certain recyclable materials where that is technically, economically or environmentally practicable (TEEP).
• Existing regulations require local authorities to collect at least two types of recyclable material and separately collect plastics, metal, paper and glass for recycling.
• Local authorities are able to determine locally which of these materials should be collected and can cite a ‘TEEP exemption’ where they do not believe a material is practicable to collect. More recently, the Government has proposed that local authorities collect a more consistent set of materials for recycling and has amended legislation to require all English local authorities to collect at least the following dry materials from 2023:
− glass bottles and containers–including drinks bottles, condiment bottles, jars;
− paper and card–including newspaper, cardboard packaging, writing paper;
− plastic bottles–including clear drinks containers, High Density Polyethylene (HDPE) (typically milk) containers, detergent, shampoo and cleaning products;
− plastic pots tubs and trays;
− steel and aluminium tins and cans.
2.2.2 Strong ecosystem of actors
Indonesia’s waste market is rich with local and international firms, including Engineering, Procurement and Construction (EPC) companies, waste management companies, engineering firms and consultancies, who can offer deep expertise into the Indonesian waste market.
We highlighted the importance of strong local partners for international investors, and Indonesia is well placed, with the right ecosystem of firms with strong track records in waste management.
Some of the best recognised players in Indonesia are highlighted on the following page.
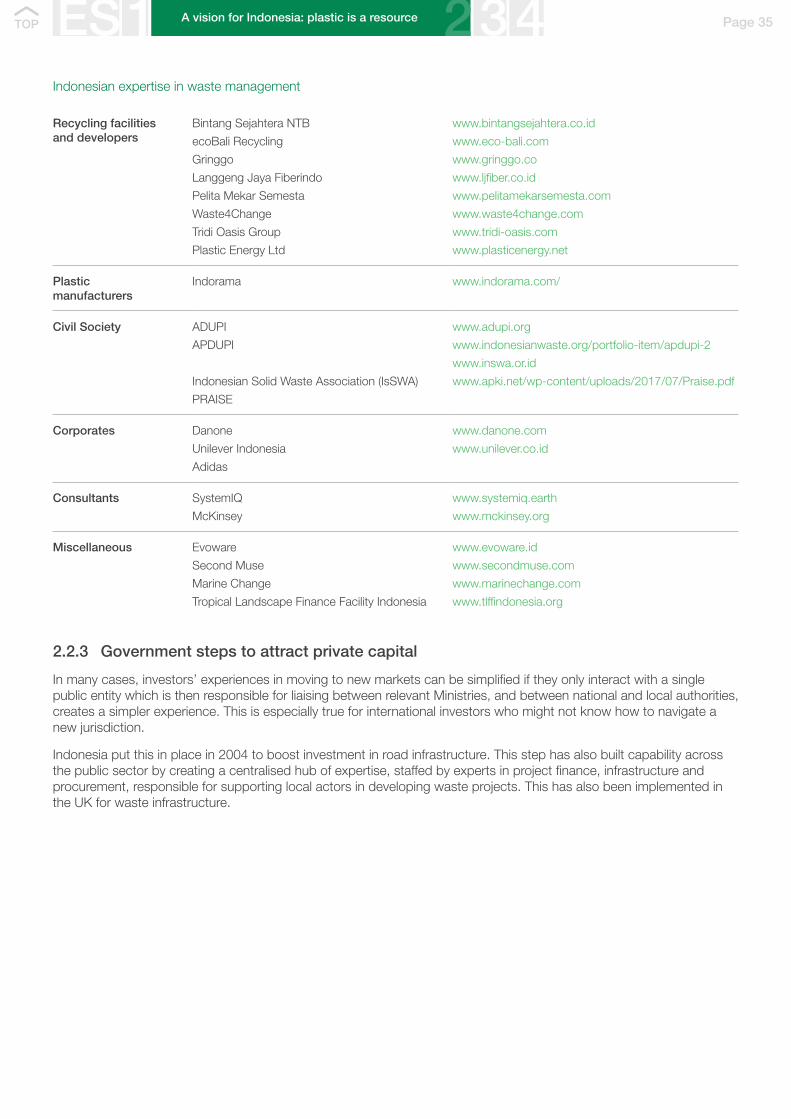
A vision for Indonesia: plastic is a resource Page 35
Indonesian expertise in waste management
Recycling facilities and developers
Bintang Sejahtera NTB
ecoBali Recycling
Gringgo
Langgeng Jaya Fiberindo
Pelita Mekar Semesta
Waste4Change
Tridi Oasis Group
Plastic Energy Ltd
www.bintangsejahtera.co.id
www.eco-bali.com
www.gringgo.co
www.ljfiber.co.id
www.pelitamekarsemesta.com
www.waste4change.com
www.tridi-oasis.com
www.plasticenergy.net
Plastic manufacturers
Indorama www.indorama.com/
Civil Society ADUPI
APDUPI
Indonesian Solid Waste Association (IsSWA)
PRAISE
www.adupi.org
www.indonesianwaste.org/portfolio-item/apdupi-2
www.inswa.or.id
www.apki.net/wp-content/uploads/2017/07/Praise.pdf
Corporates Danone
Unilever Indonesia
Adidas
www.danone.com
www.unilever.co.id
Consultants SystemIQ
McKinsey
www.systemiq.earth
www.mckinsey.org
Miscellaneous Evoware
Second Muse
Marine Change
Tropical Landscape Finance Facility Indonesia
www.evoware.id
www.secondmuse.com
www.marinechange.com
www.tlffindonesia.org
2.2.3 Government steps to attract private capital
In many cases, investors’ experiences in moving to new markets can be simplified if they only interact with a single public entity which is then responsible for liaising between relevant Ministries, and between national and local authorities, creates a simpler experience. This is especially true for international investors who might not know how to navigate a new jurisdiction.
Indonesia put this in place in 2004 to boost investment in road infrastructure. This step has also built capability across the public sector by creating a centralised hub of expertise, staffed by experts in project finance, infrastructure and procurement, responsible for supporting local actors in developing waste projects. This has also been implemented in the UK for waste infrastructure.

Page 36A vision for Indonesia: plastic is a resource
52 JICA (2007) Study on the Public-Private Partnership Scheme for Trans-Java Toll Road in the Republic of Indonesia 53 For more information, visit BPTJ official website http://bptj.dephub.go.id/ and BPJT official website http://bpjt.pu.go.id/
CASE STUDY
BPTJ and the Indonesian Toll Road Authority
Throughout the 1990s the island of Java was making a pronounced transition from an agricultural to a manufacturing industry and service-based economy, resulting in the rapid socioeconomic growth and development of the region – creating pressures on roads and transport infrastructure.
Compared with other Southeast Asian countries, Indonesia had a low density of road networks. Java accommodates the highest population density and economic activity in Indonesia and the use of its road network has been increasing at a greater rate than its expansion. The result was a rapid increase in crowding on the roads. By 2007 the congestion level of trunk roads has reached the critical limit in terms of physical capacity and network function.52
In 2004 the Ministry of Transport set up the BPTJ (Badan Pengelola Transportasi Jabodetabek)– referred to in English as the Toll Road Authority or Transport Management Agency, following the Presidential Regulation No. 38/2004 and Government Regulation No. 15/2005. Its formal mandate included:
• Implementing regulations;
• Supervising toll road operators; and
• Project preparation and supervising the tender and implementation process for toll road PPPs.
BPTJ is also responsible for developing, managing and improving integrated transportation services in the Jakarta, Bogor, Depok, Tangerang and Bekasi regions.
BPTJ coordinates road and budget planning with ministries and regional governments. It provides regional governments with technical expertise with regards to technical planning, finance, procurement, budget planning and developing new transport programmes. The Indonesian government exercises their management of the PPPs and enforcement of contractual terms and legal regulations through BPTJ.
Working alongside the BPTJ, the Indonesia Toll Road Authority (BPJT) is an authorized agency that can implement part of the Government’s authority in the operation of toll roads which includes regulating, operating and supervising Toll Road Business Entities so that they can provide benefits to the community. The existence of BPJT is mandated by Law No. 38 of 2004 concerning Roads, regulated in Government Regulation No. 15 of 2005.
Today the BPTJ and BPJT are widely recognised as having played a central role in helping Indonesia increase toll road construction projects and improvements in transport infrastructure.53
Simplifying investors’ experience
From the perspective of policy makers, setting up a new agency to oversee specific work is often regarded as burdensome, over-complicating the public sector landscape rather than simplifying it. It can also be challenging for officials responsible for waste infrastructure in other Ministries to give up their responsibilities in favour of a new public body.
While these concerns are valid, the overwhelming view from investors is that interacting with one public entity which is then responsible for liaising between relevant Ministries, and between national and local authorities, creates a simpler experience. This is especially true for international investors who might not know how to navigate a new jurisdiction. Given the success of the Indonesian Toll Road Authority, it is important that Indonesia considers how this model could work for waste management – arguably one of its greatest infrastructure challenges.
One way to achieve success, from the perspective of the public sector, is to leverage existing staff with waste management experience into a new Agency, to be complemented with staff with private sector (development, finance etc) experience. This Agency can also be managed by the Ministry responsible for waste management, or be operated as a joint unit – for example, this could be run between Indonesia’s Coordinating Ministry of Maritime and Investment Affairs and the Ministry of Energy and Mineral Resources. While the new Agency or joint unit should have independence and responsibility for implementing waste regulations and supporting local authorities, it can report on progress to senior officials and Ministers from relevant Ministries.

Page 37A vision for Indonesia: plastic is a resource
54 National Audit Office (2009) Department for Environment, Food and Rural Affairs: Managing the PFI Programme, report by the Controller and Auditor General
CASE STUDY
The UK’s Waste Infrastructure Delivery Programme (WIDP)54
In 2006, the UK established a delivery unit, the Waste Infrastructure Delivery Programme (WIDP), to accelerate the delivery of waste infrastructure and to provide greater support to local authorities undertaking the projects. WIDP comprises staff from the UK Department for the Environment, Food and Rural Affairs (Defra), Partnerships UK and 4ps, who are managed as a single unified team led by the Defra Programme Director.
The WIDP team has made considerable progress since 2006 in developing the market, including an increasing focus on energy from waste solutions. It has also sought to achieve value for money through agreeing the market PFI contract terms relevant to waste projects and by improving oversight of the projects. The actions implemented by WIDP have accelerated the rollout of new, larger projects with more contractors interested in bidding for these projects. Nine new contracts were signed in the two years to March 2008.
The WIDP has been seen as a success having played a part in delivering about 24 local authority led waste management projects since launch.
CASE STUDY
The UK’s Global Infrastructure Programme55
The Global Infrastructure Programme (GIP) is a technical cooperation scheme in infrastructure funded by the UK Government’s Prosperity Fund and implemented by the Infrastructure and Projects Authority (IPA), Foreign and Commonwealth Office and the UK’s Department for Business, Energy and Industrial Strategy.
The GIP’s offer follows three steps:
• Tools development and adaptation: for the preparation, appraisal, initiation, delivery and management of infrastructure programmes and projects.
• Personnel capacity building and certification: for the adaptation, adoption, implementation and wider use of the tools in-country
• Pathfinder project: to showcase the benefits of using these tools in real projects, the IPA will work with partner countries and relevant government bodies (local and national) to implement one infrastructure project from start to finish
This model of a dedicated waste infrastructure agency building on existing public sector staff has been implemented in the UK:
This could form a part of the UK’s aid programmes in climate change, green finance and sustainable infrastructure.
55 Information provided by the UK’s Infrastructure and Projects Authority

Page 38A vision for Indonesia: plastic is a resource
56 GIG stakeholder interviews
2.3 Indonesia’s investment landscape
2.3.1 Indonesia’s pipeline is not translating into deals
Stakeholders confirmed that there is strong pipeline of waste management projects, the majority of which are waste to energy projects. We will dive into the detail of why these projects are not being realised in Chapter 4. However, having both a pipeline and Government backing is a crucial issue in building confidence among investors and developers that there is demand for projects and that there will be financial and policy support from public bodies.
Circulate Capital’s review of investment opportunities in South East Asian countries early in 2018 revealed opportunities divided into three broad categories:
• Medium-to-large project financing, particularly of WTE projects and associated activities often with some credit exposure to a public sector entity, with ticket sizes of US$30+ million and lead times of about two years.
• Small-to-medium project financing, notably for plastic processing expansion or greenfield developments, each with US$10+ million ticket sizes and lead times of about one to two years.
• Early stage investments, generally in the form of equity, with ticket sizes ranging from US$250,000 to US$10 million, subdivided into businesses requiring financing of:
− less than US$1 million that tend to be concentrated in the upstream collection and sorting segment of the plastic value chain, often requiring ancillary technical assistance that is likely to be the preserve of certain impact investors that incubate investment and development funds from bilateral development agencies; and
− US$5+ million that are poised for growth and able to accelerate more rapidly.
We will suggest in future sections, especially section 2.4.1, that Indonesia can develop a more comprehensive waste management solution beyond WTE, into improved collection and sorting. As a minimum this will be required to keep up with increasing waste generation, however it can also help to grow its recycling sector to capture opportunities in the sector internationally.
We believe that in addition to the current and planned provision of WTE, there will need to be an increased focus on developing sorting and reprocessing MRFs, and other recycling facilities. Modelling the requirement for such facilities will necessitate more economic analysis being undertaken, which is one of recommendations for Phase 2.
More should also be done to ensure the pipeline of waste projects is aligned to Indonesia’s waste composition, including legacy waste and plastic pollution, and matches the principles set out by the waste hierarchy. While we are aware of further (though very few) projects being planned in recycling, stakeholders did not mention plans to build sorting MRFs.56
We also note in section 3.4.3 that the planned recycling plants are primarily focused on chemical recycling. While these plants will plug crucial gaps in recycling low quality plastics, these will not meet Indonesia’s overall need for mechanical recycling to recycle higher quality plastics.
Waste management pipeline in Indonesia
No Project name Classification Source
1 Bakung Waste Management (Bali)
ITF/Waste to Energy Bappenas PPP Project Pipeline July 2019
2 Waste to Energy Jatibarang Semarang (Central Java)
ITF/Waste to Energy Bappenas PPP Project Pipeline July 2019 / MOF PDF PPP Business Plan 2020-2024
3 Waste to Energy Tangerang Selatan (Banten)
ITF/Waste to Energy Bappenas PPP Project Pipeline July 2019 / MOF PDF PPP Business Plan 2020-2024
4 Waste to Energy Legok Nangka Regional (West Java)
ITF/Waste to Energy Bappenas PPP Project Pipeline July 2019 / MOF PDF PPP Business Plan 2020-2024

A vision for Indonesia: plastic is a resource Page 39
No Project name Classification Source
5 Waste to Energy Sidoarjo ITF/Waste to Energy East Java Acceleration Economic Development PerPres No 80/2019
6 TPA regional and Waste to Energy in Mojokerto
ITF/Waste to Energy East Java Acceleration Economic Development PerPres No 80/2019
7 Waste to Energy Sarbagita Suwung Bali
ITF/Waste to Energy MOF PDF PPP Business Plan 2020-2024
8 Waste to Energy Palembang ITF/Waste to Energy http://indonesiabaik.id/infografis/pltsa-siap-hadir-di-12-kota-indonesia
9 Waste to Energy / ITF Jakarta ITF/Waste to Energy http://indonesiabaik.id/infografis/pltsa-siap-hadir-di-12-kota-indonesia
10 Waste to Energy Solo ITF/Waste to Energy http://indonesiabaik.id/infografis/pltsa-siap-hadir-di-12-kota-indonesia
11 Waste to Energy Surabaya ITF/Waste to Energy http://indonesiabaik.id/infografis/pltsa-siap-hadir-di-12-kota-indonesia
12 Waste to Energy Makassar ITF/Waste to Energy http://indonesiabaik.id/infografis/pltsa-siap-hadir-di-12-kota-indonesia
13 Waste to Energy Manado ITF/Waste to Energy http://indonesiabaik.id/infografis/pltsa-siap-hadir-di-12-kota-indonesia
14 Waste to Energy Bekasi ITF/Waste to Energy http://indonesiabaik.id/infografis/pltsa-siap-hadir-di-12-kota-indonesia
15 Waste Management Project Piyungan (Yogyakarta)
ITF/Waste to Energy Bappenas PPP Project Pipeline July 2019
16 Ciayumajakuning Regional (“Greater Cirebon”) Waste to Energy Project
ITF/Waste to Energy PTSMI
17 Regional TPA Development in Probolinggo
Landfill East Java Acceleration Economic Development PerPres No 80/2019
18 Regional TPA Development in Kediri
Landfill East Java Acceleration Economic Development PerPres No 80/2019
19 Regional TPA Development in Blitar
Landfill East Java Acceleration Economic Development PerPres No 80/2019
20 TPA Development in Kab Demak
Landfill Central Java Acceleration Economic Development PerPres No 79/2019
21 TPA Development in Rembang
Landfill Central Java Acceleration Economic Development PerPres No 79/2019
22 Landfill in Borobodur, Magelang
Landfill Central Java Acceleration Economic Development PerPres No 79/2019
23 Regional Landfill in Magelang Landfill Central Java Acceleration Economic Development PerPres No 79/2019

Page 40A vision for Indonesia: plastic is a resource
57 World Bank Group (2018) What a Waste 2.0: A Global Snapshot of Solid Waste Management to 2050 58 World Bank Group (2018) What a Waste 2.0: A Global Snapshot of Solid Waste Management to 2050 59 GIZ (2018) Country Profile Indonesia: Managing Municipal Solid Waste and Packaging Waste 60 The Guardian Datablog (2009) How much does your council spend on waste disposal? 61 GIG stakeholder interviews 62 World Bank (2018) Indonesia Marine Debris Hotspot: Rapid Assessment, Synthesis Report 63 GIG stakeholder interviews
No Project name Classification Source
24 TPA Development in Tegal Landfill Central Java Acceleration Economic Development PerPres No 79/2019
25 Landfill in Pekalongan Central Java Acceleration Economic Development PerPres No 79/2019
26 Development of Toxic and Hazardous Waste Facilities
Hazardous Waste Disposal
RPJMN 2020-2024 Major Project
27 Sumatera and Sumapapua Hazardous Waste Treatment Facilities
Hazardous Waste Disposal
Bappenas PPP Project Pipeline July 2019
28 Development of Toxic and Hazardous Waste Facilities in Mojokerto
Hazardous Waste Disposal
East Java Acceleration Economic Development PerPres No 80/2019
Courtesy of the UK’s Infrastructure and Projects Authority
2.3.2 The investment gap
Conducting an analysis of the investment space for waste infrastructure, several investment gaps can be noted across the investment chain, from public to private and from local and international.
2.3.2.1 Local government finance
Regencies and municipal governments are ultimately responsible for implementing solid waste management policies. As the World Bank notes, solid waste management is often the largest single-budget item for many local governments in low-income countries, comprising about 20% of municipal budgets.57 This is also the case in most developed countries, including the UK.
However, local government bodies in South East Asia are often challenged by underfunded waste management budgets, either as a result of insufficient central government financial allocations or a lack of revenue for such services from the relevant populations, or both.58 The finances available to local governments are insufficient to cover the high recurrent expenditures associated with collection and landfill maintenance. It amounts to about 2% of provincial budgets in Indonesia.59 Of this allocation, municipalities spend 50-80% on collection. For comparison, most local authorities in the UK spend around 10-30% of council tax raised per year on waste services, sometimes reaching as high as 50 or 80%.60
Local government allocations in South East Asia are small at $5-6 per capita/per annum – a rate that compares poorly to international benchmarks ($15-20 per capita/per annum). Waste management systems are heavily subsidised by the Indonesian national government.61 The lack of investment in the sector leads to severe inefficiencies and much higher operating costs.62
Stakeholders also noted that local authorities also lack the resourcing and technical capabilities to help develop waste infrastructure projects, though we will see that knowledge gaps in the public sector can be plugged.63

Page 41A vision for Indonesia: plastic is a resource
64 Circulate Capital (2019) Investing to reduce plastic pollution in South & Southeast Asia: A Handbook For Action 65 GIIN (2018) The Landscape for Impact Investing in Southeast Asia 66 Circulate Capital (2019) Investing to reduce plastic pollution in South & Southeast Asia: A Handbook For Action 67 GG stakeholder interview 68 GIIN (2018) The Landscape for Impact Investing in Southeast Asia 69 Circulate Capital (2019) Investing to reduce plastic pollution in South & Southeast Asia: A Handbook For Action
2.3.2.2 Development finance
The pool of development investors active in the MSW and recycling space is currently small. Among the Development Finance Institutions (DFIs), most have been focused primarily on opportunities that create energy from waste or building landfills, rather than MRFs or recycling.64
Over the last decade, DFIs’ impact investment activity in Southeast Asia has tended to focus on the energy and financial services sectors, and not on waste management infrastructure.65 Interviewees from development banks noted that this could be caused by the fact that waste rarely constitute its own ‘theme’ within DFIs activities: WTE projects are often labelled as energy project, while recycling is often labelled as an environmental or urban activities.
2.3.2.3 Private finance
Stakeholders told us that most private investors backing waste projects in Indonesia are equity investors from the ASEAN region. Even then, the Top 100 Asian institutional investors have only allocated around 0.3% (US$65 bn) of their assets under management to the infrastructure sector in general – let alone waste infrastructure.66 One asset manager based in the US specified that each of their infrastructure funds held at least one waste investment, with waste often representing over 20% of their dedicated infrastructure funds.67 This indicated significant investor appetite in the sector if the right opportunities are created.
While the Indonesia has an investment regime that is generally welcoming of foreign investment in the MSW and recycling space, as we saw in the section on policy, the avenues for doing so can vary.
In the absence of foreign institutional participation, much of the private capital invested in the MSW and recycling sector in the past decade has come from local sources. In the processing segment of the plastic value chain, investment has generally been made by individuals or families in businesses they own and operate. In contrast, in the collection and sorting segment, much of the local funding has come from impact investment funds or High Net Worth Individuals, with generally modest ticket sizes – less than US$2.5 million – directed to early stage ventures.
2.3.2.4 Local vs international investors
Recent research suggests that investors – at least in the impact investment space – with offices in the countries where they invest are much more successful at sourcing and managing investments than those located offshore.68 Partnerships with local companies similarly offer access to intelligence and insights not readily available to investors offshore.
Indonesia’s impact investing ecosystem has been identified as the most mature in Southeast Asia, with a range of local, regional and global players.69
CASE STUDY
Circulate Capital, a new investment management firm dedicated to incubating and financing companies and infrastructure that remediate ocean plastic leakage, was launched in July 2018 in order to address that need. In October 2018, Circulate Capital announced it had received more than US$100 million in commitments toward the creation of funding structures that blend concessionary and philanthropic monies with market rate private capital to invest in waste management and recycling companies and infrastructure in South and Southeast Asia.
It put forth a series of policy and practice recommendations that were formally endorsed by APEC trade and foreign ministers in their 2016 annual statement, with APEC leaders calling for additional work on waste management. Circulate Capital has recently launched a blended finance partnership with USAID for a 50% guarantee on up to US $35m in loans made by Circulate Capital’s Ocean Fund. Bilateral monies, such as the US $800,000 that Denmark provided to Indonesia, will continue to be integral in developing effective solid waste management infrastructure.

Page 42A vision for Indonesia: plastic is a resource
70 Circulate Capital (2019) Investing to reduce plastic pollution in South & Southeast Asia: A Handbook For Action 71 GIG stakeholder interviews 72 World Bank Group (2018) What a Waste 2.0: A Global Snapshot of Solid Waste Management to 2050 73 Ocean Conservancy and Trash Free Seas Alliance (2019) Plastics Policy Playbook: Strategies for a Plastic-Free Ocean 74 Ocean Conservancy and Trash Free Seas Alliance (2019) Plastics Policy Playbook: Strategies for a Plastic-Free Ocean
Circulate Capital’s analysis of the impact investments made from 2007 to 2017 reveals a division between investors that have a local presence and those that do not, with the former dominating seed and early stage investments with a ticket size of less than US$500,000.70
2.3.2.5 The extended producer responsibility model
Indonesia recently announced that it would roll out an extended producer responsibility (EPR) policy, though this has not been implemented yet.71
As the World Bank notes, EPR is “[a] unique form of private sector participation [in which] the cost for the final recycling or disposal of materials is borne by the producer of the good. Producers may pay the municipality directly for the cost of collection and disposal or develop a system for citizens to return the product. In either case, producers will often price the cost of disposal into the product so that consumers ultimately bear the disposal cost. Therefore, both producers and consumers are financially and logistically responsible for their resource usage.”72
We also note that this model is being explored across South and South East Asia. Given the urgency of the plastic waste challenge across ASEAN countries, governments have started to adopt measures to engage the private sector and plug gaps in public sector funding. EPR is one such measure and, with over 65 models of packaging EPR currently in operation, it is gaining momentum. Around 400 EPR models exist globally, 70% of which have been implemented since 2001. The EPR model has so far been largely limited to developed economies. This presents an opportunity for developing economies, to design innovative systems that leapfrog the challenges of EPR in developed economies. EPR is viable for a wide variety of materials, including plastic in products other than packaging, glass, paper, aluminium and other recyclable materials. Given the focus of this report on ocean plastics and the fact that EPR is typically implemented on waste streams separately (e.g., packaging, electronics, end-of life vehicles), only plastic packaging is discussed in greater detail.73
The Plastics Policy Playbook, published by the Ocean Conservancy and Trash Free Seas Alliance, provides extensive advice on making EPR work in the SE Asia context and has put together the following calculations for Indonesia:
“Packaging material fees could provide an additional source of funding for financing waste management over and above government spending. For example, Indonesia produced and imported 4.5 million tons of plastic in 2015. Assuming 40% of this is plastic packaging and using a Belgian-style EPR fee of €0.096/kg—an amount converted after taking into account Indonesia’s purchasing power parity of 3.4 in 2018)—this could provide €173 million (US $191 million) in revenues for waste management. Although no official sources for waste management budgets are available for [ASEAN] countries, estimates for Indonesia suggest that US $500-1,400 million in revenue can be generated per year based on available data.”74
Our report does not provide further analysis of whether the EPR model is likely to plug the funding gap for MSW management, given the complexity of the matter, but we suggest that further research is done on this.

Page 43A vision for Indonesia: plastic is a resource
CASE STUDY
The UK’s Extended Producer Responsibility regulation and trading scheme
The UK adopted the EPR concept in its 1995 Environment Act. The government then passed the Producer Responsibility Obligations (Packaging Waste) Regulations in 1997 and the Packaging (Essential Requirements) Regulations in 1998.
The UK established separate targets set for each material in terms of total recovery and recycling.
The regulations divide producer responsibility into four categories –manufacturer, converter, packer/filler, and seller – and then apportion recycling obligations to each group.
The UK began bringing in obligated companies in 1998, beginning with the largest companies – those with annual turnover more than £5 million – and later, in 2000, incorporating companies with an annual turnover more than £2 million. The £2 million threshold includes 88.6% of all packaging handled by UK companies. Obligated companies in the UK can either show that they have met recycling obligations themselves – usually by contracting with a reprocessor – or they can join a “compliance scheme” which will fulfill the obligations for them. For a fee, a scheme takes on all a company’s requirements including agency fees, data submission, recycling/recovery, and certificates of compliance.
Compliance schemes and obligated companies demonstrate compliance with the regulations by showing that they hold enough Packaging Waste Recovery Notes (PRNs) to meet their recycling obligations. These notes are generated every time a tonne of packaging material is recycled. PRNs are material-specific; there are PRNs for glass, paper, aluminium, steel, plastics, wood, general recycling and energy recovery. PRNs are traded among obligated companies, reprocessors, and compliance schemes on the dedicated trading platform Environment Exchange.
Accredited reprocessors must submit quarterly reports to the government that state how many tonnes of packaging were reprocessed in the quarter.75
According to Environment Exchange data, where PRNs are traded in the UK, trading volumes have soared in the last decade.76
PRN trading volume on Environment Exchange, 2006-2019
75 OECD (2006) EPR Policies and Product Design: Economic Theory and Selected Case Studies 76 The Environment Exchange, www.t2e.co.uk
Environment Exchange
2006 2007 2008 2009 2010 2011 2012 2013 2014 2015 2016 2017 2018 2019
300,000
250,000
200,000
150,000
100,000
50,000
0
Tonnes

A vision for Indonesia: plastic is a resource Page 44
2.4 Waste is a resource: unlocking economic opportunitiesLandfill and waste to energy should be measures of last resort in waste management. Tackling existing plastic pollution will involve finding better ways to remove existing debris from coastlines, especially where no formal solid waste management exists. New management systems need to be able to safely discard, repurpose or recycle this degraded plastic so that it can provide economic value again.
It is therefore essential that different means by which waste plastics can be put back into the value chain are considered, and economic opportunities are fully realised.
2.4.1 Growing Indonesia’s waste management sector
We can describe Indonesia’s opportunities as two-fold:
• Scale up waste management infrastructure and divert as much waste as possible away from landfill. This is to work around Indonesia’s shortage of available land and projections that Indonesia’s MSW generation will keep growing as the economy grows.
Scaling up waste management infrastructure, including collection, sorting, WTE and other elements of the waste journey, will be essential is Indonesia is to keep up with the expected increase in municipal waste generation – and the likely proportional increase in plastics relative to organic matter as Indonesia continues to develop, as described in section 2.1.4.
Achieving this may result in a net cost for Indonesia, as is often the case with building new waste infrastructure. In the next sections we will demonstrate revenues and costs for each type of waste infrastructure. They largely rely on municipal funding and local taxes, which is already a challenge for Indonesia.
However, there is still an important economic case for scaling up waste infrastructure. Section 2.1 discusses in detail the current costs of mismanaged waste on health, tourism and fishery industry. Any calculations of the costs and benefits of investment in waste management should account for these wider social costs.
• Scale up and develop the recycling sector, which could help position Indonesia as a supplier of quality recycled plastics globally.
As we will see in more detail in section 3.4, Indonesia’s recycling industry is very small-scale, most likely working with the informal economy to access recyclable plastics.
As we saw earlier, some international firms told us that they would not enter new markets for a single project, but rather need visibility that there are opportunities to finance and develop multiple projects, which justify the cost of initial research and due diligence.
Investment requirements to scale up Indonesia’s waste sector
Our research found only one report which estimates the scale of the investment needed to scale up waste management infrastructure in Indonesia; that recently published by the World Economic Forum, in collaboration with the Global Plastic Action Partnership and the Indonesia National Plastic Action Partnership (NPAP).
These numbers were compiled by the Pew Charitable Trusts and Systemiq. The numbers are based on a “System Change Scenario” with a costed package of system changes that could collectively reduce ocean plastic leakage in Indonesia by 70% from 2017 to 2025.
We have outlined below the main elements of their analysis. These numbers do not account for the informal parts of waste management, including waste pickers, private collection etc.

Page 45A vision for Indonesia: plastic is a resource
77 UNCTAD (2018) ASEAN Investment Report 78 UNCTAD (2018) ASEAN Investment Report 79 UNCTAD (2019) World Investment Report
Capital expenditure required to meet Indonesia’s objectives
Years State-managed collection and controlled disposal
systems for all waste
Collection and disposal – allocated to plastic waste
Collection equipment attributed to plastic waste
Plastic recycling
facilities
Safe disposal
facilities attributed
to plastic waste
2017-2025 $4.0 billion $1.2 billion $0.4 billion $1.1 billion $0.8 billion
2025-2040 $11.8 billion $4.2 billion $2.0 billion $1.5 billion $2.2 billion
Pew Charitable Trusts and Systemiq analysis
In total, $5.1 billion is required to realise this scenario from 2017 to 2025. From 2025 to 2040, additional investments of $13.3 billion are required. These figures represent the costs to run government-run collection, sorting and disposal of both plastics and non-plastics. They also include incentives to the private sector to supplement the value of post-use plastics and increase collection rates.
No analysis, to date, has been done to estimate the potential revenue to be captured by exporting recycled materials at a greater scale.
Economic and social benefits of scaling up waste management
Section 2.1 demonstrates the costs associated with poor plastic management.
Meeting the scenario outlined in the World Economic Forum report would, according to their analysis, result in:
• 16 million tonnes of avoided ocean plastic between 2017 and 2040
• 128 million tonnes of avoided mismanaged waste polluting the environment more generally
• 10 million tonnes of greenhouse gas emissions avoided every year until 2025, and 20 million tonnes per year in 2040
• Net creation of 150,000 direct jobs in the plastic waste and recycling sectors, most of them in waste collection
More analysis would be required to estimate avoided health costs and downstream impacts on fishing and tourism industries.
2.4.2 Attracting FDI
The ASEAN region is already well regarded as a destination for international investors, having become one of the most attractive investment locations in the developing world. FDI flows to ASEAN rose to a record level, from $123 billion in 2016 to $137 billion in 2017. As a result, ASEAN’s share of FDI flows to developing economies rose from 18% in 2016 to 20% in 2017.77
Indonesia is the largest recipient of intraregional investment, absorbing more than 45% of intra-ASEAN investments last year. ASEAN investments into Indonesia rose by 20% to $11.9 billion in 2017, buoyed by a 28% rise in investment from Singapore (the largest investor in Indonesia) to $10.7 billion.78
In Indonesia, domestic investment far outstrips foreign direct investment (FDI), as shown in the graph below.
FDI flows into Indonesia have grown and their base has been expanding in recent years. In 2018, FDI investment in Indonesia reached USD 21 billion, an increase from 2017 (+6.8%).79
Sectors with the highest levels of FDI include machinery and equipment and electricity, gas and water supply. Given investors’ interest in industry processes as well as utilities, it seems waste infrastructure would be well placed to capture the attention of international investors.

70000000
60000000
50000000
40000000
30000000
20000000
10000000
0
Food
crop
s, pla
ntatio
n, live
stock
Fores
try
Fishe
ry
Mining
Food
indu
stries
Texti
le ind
ustrie
s
Leath
er go
ods a
nd fo
otwea
r
Woo
d ind
ustrie
s
Paper
and
ing in
dustr
ies
Chemica
l and
pha
rmac
eutic
al ind
ustrie
s
Rubbe
r and
plas
tic in
dustr
ies
Non-m
etallic
mine
ral in
dustr
ies
Basic
metal in
dustr
ies
Machin
ery, e
lectro
nics,
medica
l equ
ipmen
t
Motor
ised
vehic
le an
d tra
nspo
rtatio
n ind
ustrie
s
Other in
dustr
ies
Electric
ity, g
as an
d wate
r
Constr
uctio
n
Trade
and
repara
tion
Hotels
and
restau
rants
Trans
porta
tion,
storag
e and
telec
oms
Housin
g, ind
istria
l esta
tes an
d off
ice b
uildin
gs
Other s
ervice
s
BKPM (Badan Koordinasi Penanaman Modal)
A vision for Indonesia: plastic is a resource Page 46
This is also likely to be the case with domestic investors who show strong interest in utilities, construction and transportation. Given the possible uses of waste outputs for the primary sector, such as fertiliser, there is also potential for other types of investors to support waste infrastructure projects.
We note however that waste infrastructure FDI isn’t tracked. More granular data on waste infrastructure-related investments, both foreign and domestic, would prove useful information in the coming years for investors and policy-makers alike.
Domestic Direct Investment in Indonesia, 2018
Primary sectors Secondary sectors Tertiary sectors
Rp billions
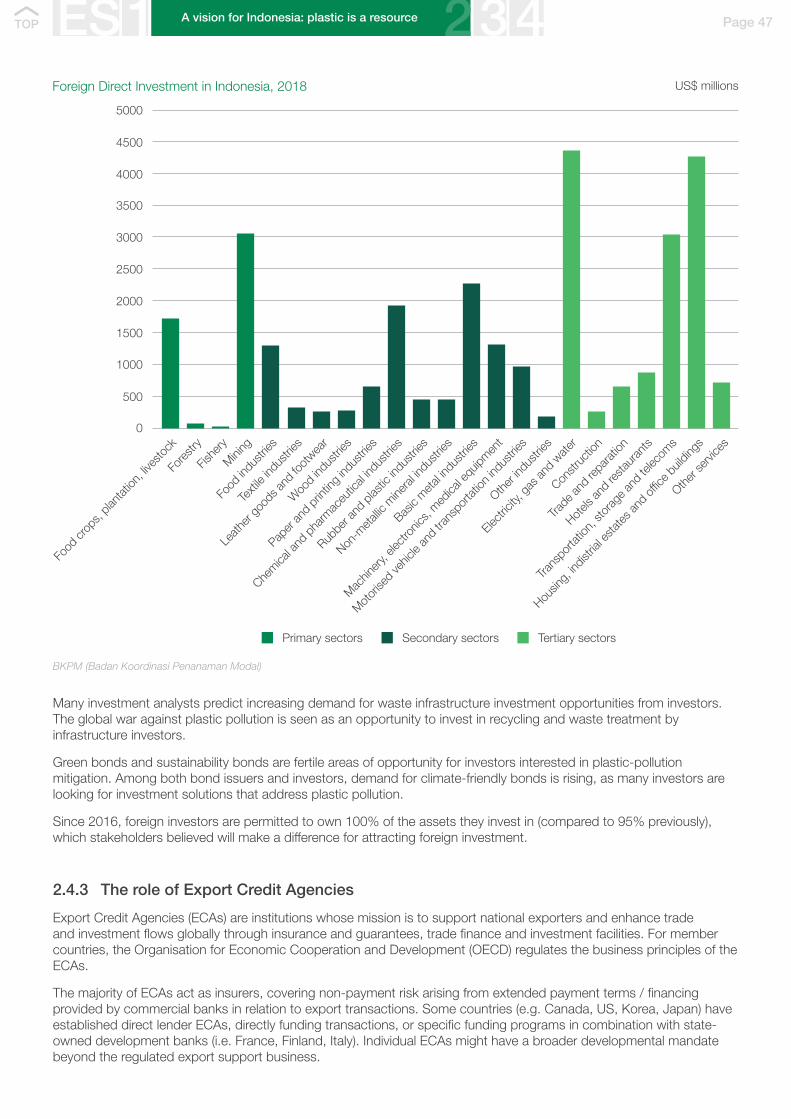
A vision for Indonesia: plastic is a resource Page 47
5000
0
500
1000
1500
2000
2500
3000
3500
4000
4500
Food
crop
s, pla
ntatio
n, live
stock
Fores
try
Fishe
ry
Mining
Food
indu
stries
Texti
le ind
ustrie
s
Leath
er go
ods a
nd fo
otwea
r
Woo
d ind
ustrie
s
Paper
and
ing in
dustr
ies
Chemica
l and
pha
rmac
eutic
al ind
ustrie
s
Rubbe
r and
plas
tic in
dustr
ies
Non-m
etallic
mine
ral in
dustr
ies
Basic
metal in
dustr
ies
Machin
ery, e
lectro
nics,
medica
l equ
ipmen
t
Motor
ised
vehic
le an
d tra
nspo
rtatio
n ind
ustrie
s
Other in
dustr
ies
Electric
ity, g
as an
d wate
r
Constr
uctio
n
Trade
and
repara
tion
Hotels
and
restau
rants
Trans
porta
tion,
storag
e and
telec
oms
Housin
g, ind
istria
l esta
tes an
d off
ice b
uildin
gs
Other s
ervice
s
BKPM (Badan Koordinasi Penanaman Modal)
Primary sectors Secondary sectors Tertiary sectors
Foreign Direct Investment in Indonesia, 2018
Many investment analysts predict increasing demand for waste infrastructure investment opportunities from investors. The global war against plastic pollution is seen as an opportunity to invest in recycling and waste treatment by infrastructure investors.
Green bonds and sustainability bonds are fertile areas of opportunity for investors interested in plastic-pollution mitigation. Among both bond issuers and investors, demand for climate-friendly bonds is rising, as many investors are looking for investment solutions that address plastic pollution.
Since 2016, foreign investors are permitted to own 100% of the assets they invest in (compared to 95% previously), which stakeholders believed will make a difference for attracting foreign investment.
2.4.3 The role of Export Credit Agencies
Export Credit Agencies (ECAs) are institutions whose mission is to support national exporters and enhance trade and investment flows globally through insurance and guarantees, trade finance and investment facilities. For member countries, the Organisation for Economic Cooperation and Development (OECD) regulates the business principles of the ECAs.
The majority of ECAs act as insurers, covering non-payment risk arising from extended payment terms / financing provided by commercial banks in relation to export transactions. Some countries (e.g. Canada, US, Korea, Japan) have established direct lender ECAs, directly funding transactions, or specific funding programs in combination with state-owned development banks (i.e. France, Finland, Italy). Individual ECAs might have a broader developmental mandate beyond the regulated export support business.
US$ millions

Page 48A vision for Indonesia: plastic is a resource
80 https://rmid-oecd.asean.org/bilateral-agencies/ 81 https://www.gov.uk/government/news/permanent-5-billion-boost-to-ukef-lending-capacity 82 GIG stakeholder interviews
The major advantage of ECA support lies in their potential to address liquidity problems and restrictions to lending from the commercial banking sector, as well as in the reduction of the all-in price of transactions.
ECAs such as China’s SINOSURE, Japan’s NEXI and Korea’s KUSRE are especially active in Southeast Asian countries,80 including Indonesia, however the UK’s ECA, UK Export Finance is also focused on developing its activities in the region.
CASE STUDY
UK Export Finance (UKEF)
Founded in 1919, UKEF, the world’s oldest ECA, is the operating name of the Export Credits Guarantee Department (ECGD). UKEF is a UK government department that reports to Secretary of State for International Trade. It is the UK’s official export credit agency and a founder member of the Berne Union which is the International Union of Credit & Investment Insurers.
UKEF’s statutory purpose is to support UK companies that export and investment overseas. It does so by providing various types of products such as loans, guarantees, insurance and reinsurance.
In the 2020 budget, UKEF’s direct lending facility was significantly increased to £8 billion, with £2 billion allocated for clean growth projects.81
UKEF recently provided £230 million of project finance guarantees for one of Asia’s largest offshore wind farms in Taiwan and a £47 million facility for two solar plants in Spain, securing export opportunities for the UK renewable sector. To date, no support has been given to waste management investments.
Given the scale of the investment opportunity, further discussion with the ECA community, including UKEF, would be merited to discuss whether and how they could support increased investment in waste infrastructure in Indonesia.
2.4.4 Working with corporates
The private sector, including producers, manufacturers and brand owners, has demonstrated significant commitment to improving plastic manufacturing and the management of plastic waste in recent years. Over 400 organisations have signed the Ellen MacArthur Foundation’s Global Commitment to eliminate plastic pollution at its source, including many leading multinationals.
Many interviewees told us that as a result of these corporate commitments, there is now more demand for recycled plastics than there is supply globally. This creates a unique opportunity for Indonesia to place itself at the centre of the recycled material economy.82
The lack of supply in recycled plastics is causing large corporates to lock in the capacity by entering long-term contracts with recycled plastic manufacturers. This helps shield them from volatile prices for recycled products and create certainty of supply.

RecyclersSorting, dismantling and processing facilities
Middle level junk shops
Legal and illegal small junk shops
Itinerant waste buyers
Waste pickers
Ocean Conservancy and Trash Free Seas Alliance
Page 49A vision for Indonesia: plastic is a resource
83 Greenpeace (2019) Throwing Away the Future: How companies still have it wrong on plastic pollution “solutions” 84 Unilever Press Release (2018) ‘Our solution for recycling plastic sachets takes another step forward’ 85 Ocean Conservancy and Trash Free Seas Alliance (2017) The Next Wave: Investment Strategies for a Plastic-Free Ocean 86 GIG stakeholder interview
CASE STUDY
Unilever
Sachets present a significant challenge in South East Asia, representing 50% of the global market.83 They provide a vital role for those on lower incomes in accessing food and healthcare products that normally are outside of their budget, however the packaging is multi layered and difficult to manage and the lack of value attached means there is little or no incentive to residents to contain and collect this waste stream.
Unilever, a major player in the South East Asia sachet market has made a commitment to develop and implement a sustainable business model for handling all their sachet waste streams by 2025 through a closed loop system. A pilot plant opened in Indonesia in 2018,84 which uses a solvent based process to recover the polyethylene layer, which accounts for 60% of the product. The polyethylene can then be used to make new products.
They report that the process allows for the recovery of six kilos of pure polymers using the same energy as it would take to produce one kilo of virgin polymer. The facility has processed around three tonnes of discarded sachets per day; raising the potential for upscaling the technology to develop a commercial plant capable of processing up to 30 tonnes of material a day. This would require an increased volume in the flexible plastics collection and Unilever have stated an ambition to capture 1,500 tonnes in 2019 and 5,000 tonnes in 2020. To do this they have identified the potential to leverage the network of Community Waste Bank programmes and have a pilot project in East Java to collect the sachets. To ensure support from the community’s they have attached a value to the sachets, buying them for a market price from intermediaries and informal waste collectors.
Indonesia is already home to many factories, such as those owned by Yue Yuen Industrial who produces one sixth of all sport shoes made in the world each year for major sportswear brands including Nike, Adidas and Puma. Many of the corporates involved in manufacturing in Indonesia have signed up to pledges with regards to plastic pollution and increasing their use of recycled plastics. There is an opportunity for the Government of Indonesia to form partnerships with these industries and act as their supply chain for recycled products coming from both household waste and ocean plastics.
2.4.5 Quality job creation
Better jobs for the informal sector
As we will see in Chapter 2, informal collectors are the foundation of the informal collection and sorting segments of the plastic value chain, especially for PET as their activities result in high collection rates. As The Next Wave report noted, “any proposed integrated waste system strategy should be designed [in] meaningful consultation with waste pickers and the non-profit institutions that support them to ensure that their interests are protected and the project implementation is holistic.”85
One stakeholder indicated that around 3-4 million people work in the informal waste economy in Indonesia.86
The informal waste economy

Waste pickers face many health risks and are often part of vulnerable communities. Their inclusion and empowerment, along with recognition of their working conditions and long-term plans to upgrade those conditions, should be an explicit goal of any solution.87
Waste pickers generally operate in extremely hazardous conditions, surrounded by waste that spontaneously combusts in extreme heat, and they are highly exposed to disease agents. There is substantial research suggesting that the life expectancy of waste-picker communities is significantly below the population average.88
The need to grow the waste industry
Plastic-waste growth rates will likely exceed any estimates of the growth rate of waste pickers,89 so it is unlikely that waste pickers will have any incentive to start extracting low-residual-value plastics – making waste pickers of limited use to capture greater varieties of plastic and achieving sorting at scale.
Further, waste picking is characterised by low wages and poor working conditions, and many organisations advocate that encouraging the informal waste management sector is not a viable long-term solution.90
As Indonesia sees more waste plants come into operation, be it WTE, MRFs or recycling, this growth will create more job opportunities in operations and management. Waste pickers could form an attractive pool of workers for these new plants.
Creating better jobs for the informal sector can create benefits for people which include:
• Diverting children away from working with their parents in waste and towards formal schooling.
• A more regular payroll which provides long-term certainty of income.
• Pension contributions, allowing people to retire and creating more pools of capital for the Indonesian finance sector.
• Some estimated that waste workers could make 4-8 times more money working for the formal sector than for themselves – creating incentives to send children to school and contribute to a pension plan.
Page 50A vision for Indonesia: plastic is a resource
87 Ocean Conservancy and McKinsey Center for Business and Environment (2015) Stemming the tide: land-based strategies for a plastic-free ocean 88 Ocean Conservancy and McKinsey Center for Business and Environment (2015) Stemming the tide: land-based strategies for a plastic-free ocean 89 Ocean Conservancy and McKinsey Center for Business and Environment (2015) Stemming the tide: land-based strategies for a plastic-free ocean 90 Ocean Conservancy and McKinsey Center for Business and Environment (2015) Stemming the tide: land-based strategies for a plastic-free ocean
CASE STUDY
Size of the UK’s waste market
The UK’s environmental goods and services sector (EGSS) contributed £62.5 billion of output to the UK economy in 2015, growing 27% between 2010 and 2015 (without adjusting for inflation). Waste management accounted for the single largest proportion of total EGSS output (around 20%) and employment (around 30%) in every year from 2010 to 2015.
In the UK’s calculations, waste management activities include the collection, treatment and disposal of various forms of waste, such as solid or non-solid industrial or household waste but does not include recycling activity.
Waste management output grew by 38% over this period to £14.2 billion in 2015 (see graph below), whereas employment in waste management remained relatively stable, growing by 5% to around 101,000 in 2015. Until 2015, waste management still produced more output for the UK than renewable energy.
Continued

A vision for Indonesia: plastic is a resource Page 51
Outputs of UK’s waste and renewable activities
WasteProduction of renewable energy
Charcoal BiomassBiodieselBioethanolLiquid bio-fuels
Landfill gas Sewage gas WoodStrawMunicipal solid waste (MSW)
UK’s Office for National Statistics
Total exports from the environmental goods and services sector (EGSS) were £5.0 billion in 2015 and £6.2 billion in 2014. Almost 90% of all exports from the EGSS in both 2014 and 2015 came from recycling and waste management activities.
Energy recovery from waste (e.g. WTE and landfill gas) has grown exponentially since 1990 in the UK, with MSW energy growing more than 10-fold in the period – from providing 0.2 Mtoe in 1990 to 2.6 Mtoe in 2017.
Energy from waste in the UK
£ billion
Gross calorific values, Million tonnes of oil equivalent (Mtoe)
16
2010
14.000
12.000
10.000
8.000
6.000
4.000
2.000
0.000
1990
1991
1992
1993
1994
1995
1996
1997
1998
1999
2000
2001
2002
2003
2004
2005
2006
2007
2008
2009
2010
2011
2012
2013
2014
2015
2016
2017
2011 2012 2013 2014 2015
14121086420
UK’s Office for National Statistics
Number of firms Employees Turnover (£’000s)
Collection of non-hazardous waste 2,685 59,250 8,957,963
Collection of hazardous waste 125 1,090 275,181
Recovery of sorted materials 1,605 22,320 7,788,706
Wholesale of waste and scrap 1,630 9,750 3,549,411
In terms of recycling, the UK is home to a rich ecosystem of firms employing tens of thousands of people and generating billions in turnover.
The UK’s waste market firms
UK’s Office for National Statistics

Page 52A vision for Indonesia: plastic is a resource
91 https://europeanplasticspact.org/ 92 These are: disposable plastic cutlery; polystyrene packaging at the household level; cotton buds with plastic stems; plastic stirrers; plastic straws;
oxydegradable that break down into micro particles; PVC packaging; disposal plastic plates and bowls.
2.4.6 Export opportunities: the global supply chain for recycled plastics
The demand for recycled content is being driven in part by brands and organisations as globally there is increasing pressure on corporates to reduce plastic manufacturing in order to retain their social licence to operate. Section 2.4.4 discussed the Ellen MacArthur Foundation’s Global Commitment, which has had great influence in the sector. Similar commitments have been put in place at European91 and country level. In the UK for example signatories to the UK Plastic Pact have pledged to eliminate by the end of 2020 8 plastic items92 which are considered to be presenting an environmental challenge. The beauty of these pledges and commitments is it provides a vehicle for brands and organisations to exchange ideas, expertise and resources and through the setting of targets and goals speed up change.
Products which are typically made from recycled plastics are wide ranging including packaging such as bottles, containers, bags, household goods, fibre-based products such as clothing, carpets, insultation, and also infrastructure items. Concerns along the value chain of the viability of recycled plastic as a feedstock in relation to product performance, particularly in premium products, have been challenged by the significant number of trial projects and products brought to market, however this remains a barrier for some. In many non-packaging products, recycled content can be ‘hidden’ within the structure of the product and not necessarily promoted to the consumer so it can be difficult to judge the size of the recycled plastic market.
In Europe, collection rate targets are rapidly increasing to reach 90% by 2030 and the mandated recycled content in packaging is also going up – 30% of recycled PET in bottles by 2030 for example. Estimates for the investment needed to keep pace with this likely increase in demand will be a further 750,000 million tonnes of recycling capacity in Europe and for PET bottles alone. If the world follows a similar trend, we can expect investor-led demand for investment opportunities in recycling around the world. Indonesia has an opportunity to be a first mover and capture this growing demand ahead of others.
CASE STUDY
Size of the UK’s plastics industry
The Plastics Industry employs around 220,000 in the UK across 6000 businesses and 97% are SMEs. The total value of the processing sector is estimated to be £12.4 billion.93
Between 2017 and 2025, the UK organisation WRAP estimates that the benefits to the UK of increasing recycling rates and improving the consistency of local recycling include:
• £430 million potential increase in revenue from sales of recovered materials
• 4.5 million tonnes reduction in greenhouse gas emissions
• £240 million potential increase in renewable energy sales
• £30 million savings to reprocessors and the recycling industry from lower contamination through greater consistency94
93 UK’s Health & Safety Executive 94 http://www.wrap.org.uk/collections-and-reprocessing
2.4.7 Avoided costs: reducing costs to healthcare, reducing plastic leakage, and lost tourism revenue
Economic opportunities, from the perspective of governments, can also be measured in avoided costs elsewhere in the economy. Whilst no detailed studies were identified on the costs of mismanaged waste and plastic pollution for Indonesia’s healthcare system and tourism industries, these numbers can be expected to be significant.
It is important for the public sector to take a comprehensive approach and understand how waste issues can have impacts on other aspects of the economy. When appraising policy approaches and estimating value for money, policy makers can take these broader costs into account and better understand how investing in waste management can create savings in other parts of the public balance sheet.

Page 53A vision for Indonesia: plastic is a resource
95 World Bank Press Release (2019) ‘Cleaning Up Indonesia’s Urban Solid Waste’ 96 Data from Hong Kong’s Environmental Protection Department
2.4.8 Waste management is at the heart of a country’s development
Waste management is often seen as a proxy for the development of a country. Managing waste properly is essential for building sustainable and liveable cities, but it remains a challenge for many countries and cities. Operating this essential municipal service requires integrated systems that are efficient, sustainable, socially supported and properly funded.
While In Indonesia, cities and municipalities generate an estimated 105,000 tons of solid waste a day – a number that is expected to increase to 150,000 tons per day by 2025 – 40% of the country’s 142 million urban residents still do not have access to basic waste collection services.95
CASE STUDY
Sorting MSW in Hong Kong96
Hong Kong, like many developed places, has seen its waste loads grow as its economy has grown. Municipal waste loads have in general been increasing since 1986, mirroring Hong Kong’s rapid economic expansion over the same period. At the same time, the population has grown by more than one million people with each person throwing away more waste.
Landfills, which are essential elements of any waste management chain, need notable land resource – which is very limited in Hong Kong. For this reason, Hong Kong authorities regarded landfill space as one of the city’s most precious assets, and therefore put in place measures so that landfills were more prudently used as a last resort.
In 1986, Hong Kong set up the Environmental Protection Department (EPD) to oversee waste infrastructure development.
The EPD created a comprehensive Waste Disposal Plan which cost more than $10 billion in total to build. The landfills initially were intended to last until 2020, with possibilities to overflow if other policies did not have their intended effect.
Hong Kong’s waste infrastructure today:
• Three strategic landfills are located in the New Territories. Liners, leachate collection and treatment systems, landfill gas management systems, and surface and ground water management systems are in place to control air and water impacts.
• Thirteen closed landfills in Hong Kong are being restored to minimise potential safety and health risks.
• Seven refuse transfer stations are located in different areas in Hong Kong. These are centralised collection points for the transfer of waste to strategic landfills and other processing plants. This network handles around 77% of total MSW generated in Hong Kong.
• Locally, waste is collected from smaller refuse collection trucks and stations.
• WEEE·PARK and T·PARK: Treatment facilities target specific types of waste. WEEE·PARK opened in March 2018 to support the implementation of the producer responsibility scheme on electronic waste. The waste is dismantled, detoxified and recycled into reusable materials. T·PARK was fully commissioned in 2016 and uses waste-to-energy technology to reduce the bulk of sewage sludge by up to 90%.
Hong Kong’s future infrastructure plans:
• Integrated Waste Treatment Facility (IWMF): The IWMF is the centrepiece of Hong Kong’s waste treatment plans and it will be built on an artificial island to treat up to 3,000 tonnes of municipal solid waste each day with high-temperature incineration. The process will generate electricity to be used by the IWMF, with the surplus exported to the power grid each year (expected to amount to about 480 million kilowatt hours). This project is expected to complete by 2024.

Plastic production, management and financing

36+9+24+14+12+5+AIndonesia’s Ministry of Environment and Forestry
Plastic production, management and financing Page 55
3.1 Understanding the waste journeyThroughout this report, we will talk about the ‘waste journey’: that is, what happens to waste (with a focus on plastic) once it is thrown away. Typically, this journey will include collection, sorting, recycling, recovery and landfilling. The ideal waste journey reflects the waste hierarchy principles: the majority of the waste should be recycled or reused after it is thrown away, with the waste that cannot be recycled turned into energy, and the residual waste landfilled.
This chapter covers the waste journey, setting out what typically happens to plastic waste at each step, how different types of technology and waste infrastructure are financed, and what we found to be happening in these areas in Indonesia. This will help identify what works well and where there are gaps, thus informing our recommendations in the following chapter.
3.1.1 Municipal Solid Waste (MSW)
‘Waste’ is generally regarded as products or materials that are unwanted, or are considered to have little or no value, at a point in time. Waste is generated through every stage of a product’s life cycle, whether this is during production, manufacture or consumption. The focus of this report is Municipal Solid Waste (MSW); waste that is generated during and post consumption of products and materials. While we focus on plastics within this group, we will also show that it is sometimes inevitable that other types of waste should be taken into consideration. MSW is largely under the direction of government authorities, through national or regional policies and local municipality implementation; we saw in the previous chapter that Indonesia is no exception.
MSW can be a challenging waste stream to address as it is complex, including waste from food preparation and left-over meals, packaging waste and other single use items, used or broken products, and items no longer required or desirable. The actual composition of MSW can vary considerably, depending on many factors including: geographical location; economy; regulation and policy; culture; climate; and consumer attitudes and awareness. Generally, MSW will include a mix of the following organic and inorganic waste streams:
• Food • Garden • Plastics • Paper & card • Glass
• Metals • Wood • Textiles • Other
Commonly the organic fractions (food and garden waste) form the largest component of MSW, though in recent years the proportion of plastics in MSW has increased significantly, largely as a result of packaging, and this is certainly the case in Indonesia.
As can be seen from the diagram below, most of the Indonesia’s municipal solid waste comes from households, followed by different types of commercial activities.
Sources of solid waste (2016)
Other5%
Shopping centres 14%
Public areas 12%
Traditional markets24%
Offices9%
Households36%
Once it is generated, waste is either contained and collected for reuse, repair, onward processing for recycling, treatment or regulated disposal, or it is not contained in any formal regulated sense and as a consequence can be lost from the system and cause environmental and ecological problems on land or in water.

Page 56Plastic production, management and financing
97 World Economic Forum (2020) Radically Reducing Plastic Pollution in Indonesia: A Multi-stakeholder Action Plan National Plastic Action Partnership 98 World Economic Forum (2020) Radically Reducing Plastic Pollution in Indonesia: A Multi-stakeholder Action Plan National Plastic Action Partnership
In a recent report from the World Economic Forum, in collaboration with the Global Plastic Action Partnership and the Indonesia National Plastic Action Partnership (NPAP) an analysis is provided on the full waste journey in Indonesia, which is presented below.
Where Indonesia’s plastic waste ends up today (percentage of total plastic waste generated)
MSW represents around 50-70% of total plastics consumption in Indonesia. Plastic MSW makes up the bulk of plastic waste generation. The remaining 30-50% of plastics have a longer use period and consist of plastics used in cars and motorcycles, tyres, electronic appliances, textiles, industrial processes, agriculture, fishing and aquaculture and construction.97
We must also acknowledge the regional differences in waste management across Indonesia. Average plastic waste-collection rates are dramatically higher in mega-cities such as Jakarta: 74% compared to 20% and 16% in rural and remote areas respectively. Informal sector workers are most active in and around large cities, as this is where recycling plants are concentrated and population density is highest. In contrast, in remote areas of Indonesia, they play a very limited role in waste management.98
The fate of all Indonesia’s plastic waste, in each archetype (million tonnes per year, 2017)
NPAP analysis
Indonesia National Plastic Action Partnership analysis
Mega
Formal collection
Recycling
Managed disposal
Dumpsites
Open Burning
Dumping on land
Other plastic polution 4.2m tonnes
Managed waste 2.0m tonnes
620,000 tonnesLeakage into sea, lakes and rivers
Informal recovery
Destination
Medium Rural Remote
1.6Mt 1.8Mt 2.5Mt 0.9Mt 6.8Mt
24% 26% 37% 13%
9%13%12%7%
45%
21%
51%
20%
29%
12%
8%
61%
14%
5%
8%
64%
15%
5%
48%
9%
20%
10%
Leakage into sea, lakes and rivers
Medium & rural: ~72% of mismanaged waste
Dumping on land
Open burning
Official dumpsites
Managed disposal
Recycling
Informal collection
Formal collection
No collection
Collection
6.8Mt
61%
24%
8%
7%
Landfill recovery
6.8Mt
9%5%
47%
9%
20%
10%

Collection
Indicative waste journey for plastics within municipal solid waste
Green Investment Group
Green Investment Group
Indicative waste journey in Indonesia
Collection Sorting Plastic recycling Recovery
Plastic waste from MSW
Formal collection trucks
Waste pickers capture high value plastics
Small-scale mechanical
recycling plants
Incineration with energy recovery
Waste banks Waste banks
Private sector-led recycling plants
(e.g. Unilever, Plastic Energy)
Informal collection trucks Disposal
Landfill (sanitary and uncontrolled)
Dumping
Open burning
Informal and small-scale processesFormal process Illegal activities
Thermoplastics
Plastic recycling Recovery
Residual plastics and dirty cardboard,
some organics
Range of polymers
Residual plastics and dirty cardboard, some
organics, stone
Food waste, organic materials
Mechanical plastic recycling
Sorting / waste transfer station
Municipal solid waster
Incineration with energy recovery
Chemical plastic recycling
Landfill
Anaerobic digestion & composting
Recycled polymer
Electricity and ash
Residue
Feedstock / Fuel
Landfill gas
Biogas, compost, fertiliser
Residue
Collection
Plastic production, management and financing Page 57
ProcessWaste input Output

Page 58Plastic production, management and financing
99 The Guardian Datablog (2009) How much does your council spend on waste disposal? 100 OECD (2019) Waste Management and the Circular Economy in Selected OECD Countries : Evidence from Environmental Performance Reviews
3.2 Containment and collection
3.2.1 General principles
For waste to be managed effectively, its journey must start with containment and regular collection. Collection can range from provision and regular servicing of bins at designated locations within a community, incentive-based approaches such as deposit refund systems for specific waste items, door to door collections targeting individual waste streams or a combination of those.
Whichever system is adopted, residents need to be provided with information on how to participate and also receive regular motivational and awareness-raising messages to change behaviours and maximise good practice.
CASE STUDY
Waste collection in the UK
In the UK, a comprehensive kerbside (edge of the householders property) collection service is in place, targeting a range of recyclables such as paper and card, glass, plastics, metal, garden waste but also potentially including food waste and other items such as cartons, textiles, waste electrical and electronic items. Residual waste (all the other items that are generated by the householder, but which cannot be recycled) is also collected from the kerbside.
Policy has been set at a national level stipulating a minimum service requirement and local government has responsibility for ensuring this is delivered. Payment for collection is not made directly by the householders to the service provider but is paid for in local taxation.
CASE STUDY
Funding waste collection in the UK
In the UK, local authorities, or councils, are responsible for funding waste disposal and collection. This is paid for via the council taxes they raise from households and businesses.
Out of 389 local authorities, most authorities spend around £5-10 million per year on collection and disposal. This represents 10-30% of council tax raised per year, sometimes reaching as high as 50 or 80%.99
3.2.2 Financing waste collection
Collection around the world is largely finance by municipalities and local government bodies, via local taxes.
In cases where municipalities cannot afford to cover these costs, other sources of finance have been found. In the case of the European Union, funds were created to support lower income countries such as Estonia, Hungary, Slovenia and the Czech Republic to cover the costs of collecting MSW and pay for waste facilities. Several countries used these funds to create national funds which were not only responsible for spending the money, but also to manage waste management programmes overall.100 There could be a similar role for public finance in Indonesia, where donors from either multilateral or bilateral sources could create a fund to support the development of a good waste management provision in the country.
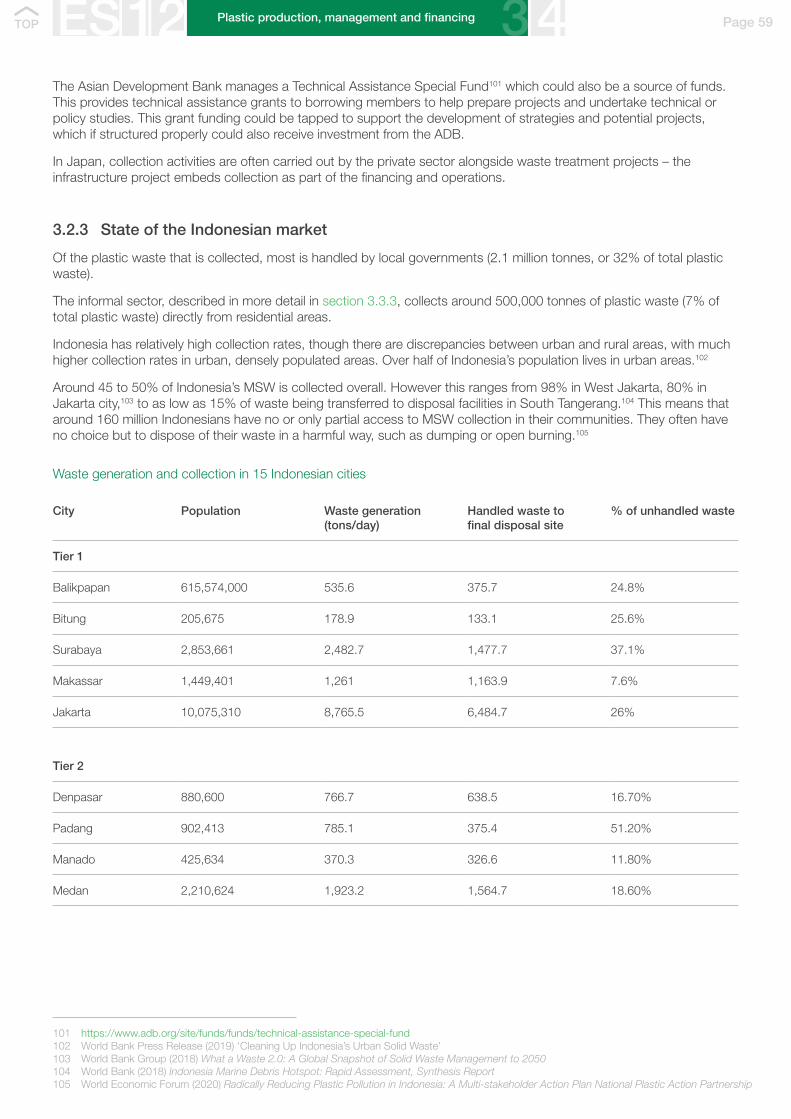
Page 59Plastic production, management and financing
101 https://www.adb.org/site/funds/funds/technical-assistance-special-fund 102 World Bank Press Release (2019) ‘Cleaning Up Indonesia’s Urban Solid Waste’ 103 World Bank Group (2018) What a Waste 2.0: A Global Snapshot of Solid Waste Management to 2050 104 World Bank (2018) Indonesia Marine Debris Hotspot: Rapid Assessment, Synthesis Report 105 World Economic Forum (2020) Radically Reducing Plastic Pollution in Indonesia: A Multi-stakeholder Action Plan National Plastic Action Partnership
The Asian Development Bank manages a Technical Assistance Special Fund101 which could also be a source of funds. This provides technical assistance grants to borrowing members to help prepare projects and undertake technical or policy studies. This grant funding could be tapped to support the development of strategies and potential projects, which if structured properly could also receive investment from the ADB.
In Japan, collection activities are often carried out by the private sector alongside waste treatment projects – the infrastructure project embeds collection as part of the financing and operations.
3.2.3 State of the Indonesian market
Of the plastic waste that is collected, most is handled by local governments (2.1 million tonnes, or 32% of total plastic waste).
The informal sector, described in more detail in section 3.3.3, collects around 500,000 tonnes of plastic waste (7% of total plastic waste) directly from residential areas.
Indonesia has relatively high collection rates, though there are discrepancies between urban and rural areas, with much higher collection rates in urban, densely populated areas. Over half of Indonesia’s population lives in urban areas.102
Around 45 to 50% of Indonesia’s MSW is collected overall. However this ranges from 98% in West Jakarta, 80% in Jakarta city,103 to as low as 15% of waste being transferred to disposal facilities in South Tangerang.104 This means that around 160 million Indonesians have no or only partial access to MSW collection in their communities. They often have no choice but to dispose of their waste in a harmful way, such as dumping or open burning.105
Waste generation and collection in 15 Indonesian cities
City Population Waste generation (tons/day)
Handled waste to final disposal site
% of unhandled waste
Tier 1
Balikpapan 615,574,000 535.6 375.7 24.8%
Bitung 205,675 178.9 133.1 25.6%
Surabaya 2,853,661 2,482.7 1,477.7 37.1%
Makassar 1,449,401 1,261 1,163.9 7.6%
Jakarta 10,075,310 8,765.5 6,484.7 26%
Tier 2
Denpasar 880,600 766.7 638.5 16.70%
Padang 902,413 785.1 375.4 51.20%
Manado 425,634 370.3 326.6 11.80%
Medan 2,210,624 1,923.2 1,564.7 18.60%

63+7+13+9+2+1+1+4+A 21+44+4+1+16+5+9+A
Page 60Plastic production, management and financing
106 World Bank (2018) Indonesia Marine Debris Hotspot: Rapid Assessment, Synthesis Report. Cities with higher GDP per capita and higher growth have a lower organic composition of about 55-60%, while cities with lower GDP per capita and slower growth have a higher organic composition of about 65-75%.
City Population Waste generation (tons/day)
Handled waste to final disposal site
% of unhandled waste
Others
Pontianak 607,438 528.5 371.5 28.80%
Semarang 1,595,267 1,387.9 1,087.2 21.70%
Yogyakarta 412,704 359.1 267.2 17.10%
Batam 1,037,187 902.4 798 11.20%
Mataram 450,226 391.7 230.6 40.50%
Bandar Lampung 979,287 852 789.1 7.20%
World Bank analysis
Collection is not well funded, from both a capital expenditure (capex) and an operational expenditure (opex) perspective. There is insufficient investment in collection infrastructure and low municipal management budgets aren’t enough to cover the operating costs of waste management.
The World Bank estimates that organic waste represents around 63% of municipal solid waste in Indonesia. Cities with higher GDP per capita tend to have lower organic proportions.106 We also note that waterway (i.e. dumped) waste composition has much greater proportions of low-value plastics than municipal waste, suggesting that low-value plastic is more likely to be discarded outside of the formal waste management system. High value plastics such as PET are normally intercepted by waste pickers, explaining the low proportion of plastic bottles found in rivers (around 1%).107 We explore the role of waste pickers in more detail in the following section on waste sorting.
From this, it is worth noting that as Indonesia continues to develop and grow its economy, we can expect not only waste generated per capita to increase, but the proportion of plastics relative to organic content to increase as well.
107 World Bank (2018) Indonesia Marine Debris Hotspot: Rapid Assessment, Synthesis Report
Average municipal waste composition in Indonesia Waterway waste composition for target cities in Indonesia
World Bank Hotspot report World Bank Hotspot report
Organic63%
Others4%
Metal1%
Textiles2%
Textiles2%
Paper9%
Plastic 13%
Wood7%
Diapers21%
Other organic
waste44%
Other plastic9%Plastic
packaging5%
Plastic bags 16%
Glass, metal4%
Plastic bottles1%
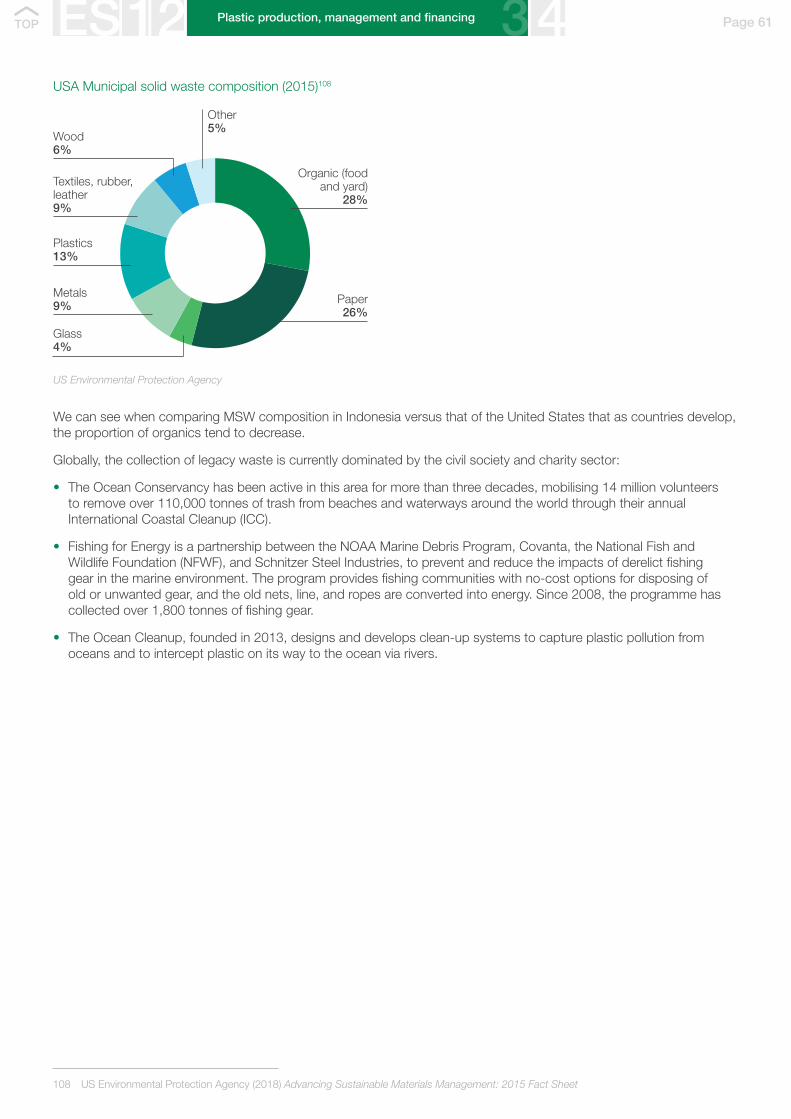
Page 61Plastic production, management and financing
108 US Environmental Protection Agency (2018) Advancing Sustainable Materials Management: 2015 Fact Sheet
28+26+4+9+13+9+6+5+AUSA Municipal solid waste composition (2015)108
US Environmental Protection Agency
Other5%
Wood6%
Organic (food and yard)
28%
Paper 26%
Textiles, rubber, leather9%
Plastics 13%
Metals9%
Glass4%
We can see when comparing MSW composition in Indonesia versus that of the United States that as countries develop, the proportion of organics tend to decrease.
Globally, the collection of legacy waste is currently dominated by the civil society and charity sector:
• The Ocean Conservancy has been active in this area for more than three decades, mobilising 14 million volunteers to remove over 110,000 tonnes of trash from beaches and waterways around the world through their annual International Coastal Cleanup (ICC).
• Fishing for Energy is a partnership between the NOAA Marine Debris Program, Covanta, the National Fish and Wildlife Foundation (NFWF), and Schnitzer Steel Industries, to prevent and reduce the impacts of derelict fishing gear in the marine environment. The program provides fishing communities with no-cost options for disposing of old or unwanted gear, and the old nets, line, and ropes are converted into energy. Since 2008, the programme has collected over 1,800 tonnes of fishing gear.
• The Ocean Cleanup, founded in 2013, designs and develops clean-up systems to capture plastic pollution from oceans and to intercept plastic on its way to the ocean via rivers.

Plastic production, management and financing Page 62
3.3 Sorting
3.3.1 General principles
If not sorted at the kerbside (‘at source sorting’), MSW may be taken to centralised premises, such as transfer stations or material recovery facilities (MRF) for sorting and/or processing. The waste stream can be sorted into various constituent components (e.g. paper, plastics, glass, metals and residual material) depending on the set-up at each MRF. Commercially derived waste is treated in much the same manner. Irrespective of the complexity of the MRF there are usually manual picking lines incorporated at various stages of the process to remove unwanted or rogue materials.
Typical steps for materials sorting in a Materials Recovery Facility
1 The collected material is delivered to a Materials Recovery Facility (MRF) and tipped into the loading area.
2 It is then fed onto loading conveyors by mechanical shovel. The purpose of using conveyors is to provide a controlled, constant flow of material to the system.
3 The material is transferred onto an elevating conveyor, which in turn feeds the material to the pre-sort conveyors. The elevating conveyor operates at a faster speed to thin out the material depth for delivery to the pre-sort area.
4 Once in the pre-sort area the non-recyclable material is manually picked out and discharged into the storage bays below.
5 The mixed material flowing from the pre-sort area enters two trommel screens which then separate into several components
6 The materials are further processed using disc screens and conveyors. MRFs are typically equipped with sophisticated automatic recognition and sorting of products. This system is used in three separate locations within each facility and works on an optical identification and separation using air jets.
7 Following the automated process of separation, the product lines are monitored manually and any non-recyclable material is picked off and goes into a residual storage bay.
8 A magnetic separator removes steel cans automatically and transfers them to a storage bunker. An eddy current-separator is used to extract the aluminium cans which are stored in another bunker.
Veolia
Materials typically separated in a MRF include:
• Plastics • Aluminum and ferrous metal cans • Newspapers, pamphlets and magazines
• Mixed paper • Cardboard
There are, broadly, two types of sorting MRFs:
• A clean MRF accepts recyclable materials that have already been separated at the source from municipal solid waste generated by either residential or commercial sources. The most common are single stream where all recyclable material is mixed, or dual stream MRFs, where source-separated recyclables are delivered in a mixed container stream. Material is sorted to specifications, then baled, shredded, crushed, compacted, or otherwise prepared for shipment to market.
• A mixed-waste processing system, sometimes referred to as a dirty MRF, accepts mixed solid waste streams and then proceeds to separate out designated recyclable materials through a combination of manual and mechanical sorting. The sorted recyclable materials may undergo further processing required to meet technical specifications established by end-markets while the balance of the mixed waste stream is sent to a disposal facility such as a landfill.
A dirty MRF recovers between 5% and 45% of the incoming material as recyclables, then the remainder is sent to a WTE plant or landfilled. Recovering data on the waste feedstock coming out of the MRF can improve certainty for a WTE plant.

Green Investment Group
Municipal government
Material recovery facility (sorting)
LandfillWaste pickers
Waste banks
Population
Packaging companies
Material recovery facility (reprocessing)
Recycling facility
Local taxation
Waste destinationWaste collection
Access to recyclable materials
Tipping fee
EPR fees
Pay for access to clean recyclable materials
Waste collection
Waste residuals
Gate fee
CostsWaste flows Revenue
Page 63Plastic production, management and financing
109 GIG stakeholder interview
However, it’s important to note that dirty MRFs are not an ideal solution. Recyclables in the incoming waste can be so contaminated with organic waste that the outputs might not be suitable for recycling plants. This is especially true for paper and card. They can be helpful to ensure that MSW is subjected to a sorting process and as much waste as possible can be pushed up the waste hierarchy.
3.3.2 Financing waste sorting
Like collection, waste sorting is typically financed by municipalities. Implementing ‘at source’ sorting (i.e. asking households and businesses to sort their waste) can help reduce these costs and improve the quality of recyclables.
Some stakeholders mentioned that there are MRFs currently being designed so that they can operate without funding from municipalities. These projects are commercially sensitive, and we did not obtain further details on the business models being explored to achieve this. Revenue streams for a typical sorting MRF are including in the diagram below.
In Indonesia, stakeholders felt that small-scale sorting MRFs feeding into larger scale recycling plants would be a good model, which we explore in more detail in our recommendations. More work needs to be done on whether to promote small and medium-sized MRFs versus large-scale facilities. While large-scale MRFs are cheaper to run; service costs are high, and they may also make less economic sense for an island nation such as Indonesia.
Small MRFs require more staff relative to their size but have lower transport costs and might be able to have cheaper agreements with local waste providers, as well as better relationships with the informal sector.
Setting up smaller sorting MRFs in greater numbers than aggregating their outputs for larger processing MRFs, recycling plants or WTE also helps create resilience in the system, ensuring larger facilities are not subject to a single point of failure paralysing the entire waste journey.109
Revenue streams for a sorting material recovery facility

3.3.3 State of the Indonesian market
Of the waste collected by local governments, nearly all of this waste is combined with other household waste streams and goes directly to landfills or official dumpsites without sorting of waste at households or in the collection system.110
When asked, stakeholders operating in Indonesia were not aware of any formal sorting activities, aside from the waste bank model, covered later in this section. This activity is currently largely driven by the informal sector.
Public awareness of the residual value of waste
In Indonesia, waste is not sorted ‘at-source’ – which means households and businesses do not clean and separate their waste into individual bins before it is collected. This is partly because there is little awareness among the general population that waste can hold some financial value and is instead seen as a financial burden. A recent survey recorded that just under 7% of households in Jakarta are aware that PET bottles have a residual value after use.111
The Government of Indonesia’s ambitious plans for improved solid waste management to achieve a 30% reduction in waste collected will rely heavily on household participation (through reduction, reuse and recycling, or “the 3R policy”). With only 1.6% of households exhibiting active participation in 3R activities, and of this, less than 0.5% attributed to plastics recycling and reuse, achieving the target will require greater engagement at the household level.112 We will explore this further in the recommendations section.
Since MSW isn’t sorted at scale, dry waste is generally contaminated by organic matter – making it much more difficult to segregate for recycling. As a result, the vast majority of Indonesia’s waste is taken to landfills or open dumps. Dirty MRFs are attracting renewed interest as a way to address low participation rates for source-separated recycling collection systems, though their output is not always of the right quality to enable recycling to take place.
The role of waste pickers
South East Asian countries often rely on an informal sector of collectors and recyclers, comprised of workers often referred to as waste pickers. Many of these informal collectors are poorly educated women, who in some instances have formed cooperatives or similar such groupings.113
Waste pickers might go door-to-door to collect higher value plastics, or pick them out a few hours before waste trucks collect household waste.114 In other cases, waste pickers intervene after unsorted waste is taken to landfills or illegal dumps, where they extract higher value plastics.115 Waste pickers collect around 560,000 tonnes of plastics (8% of total plastic waste) from collected waste that is in transit to and from landfills.116 Over 85% of plastic extraction for recycling in South East Asia takes place after the waste is deposited in landfills, rather than within individual households.117
This informal sorting and collection of plastics (especially PET), and its subsequent recycling, is relatively efficient. In some cases, extraction rates for polyethylene bottles reach 90%. Low-residual-value plastics, in contrast, are neglected due to their low density and low economic value; collection rates by the informal economy are close to 0%. Waste pickers simply cannot generate enough wages from these types of plastics to warrant the time spent collecting them.118
Page 64Plastic production, management and financing
110 World Economic Forum (2020) Radically Reducing Plastic Pollution in Indonesia: A Multi-stakeholder Action Plan National Plastic Action Partnership 111 GA Circular, Study of Plastic Leakage in Jakarta, referenced in Circulate Capital (2019) Investing to reduce plastic pollution in South & Southeast Asia:
A Handbook For Action112 World Bank (2018) Indonesia Marine Debris Hotspot: Rapid Assessment, Synthesis Report 113 Circulate Capital (2019) Investing to reduce plastic pollution in South & Southeast Asia: A Handbook For Action 114 GIG stakeholder interviews 115 GIG stakeholder interviews 116 World Economic Forum (2020) Radically Reducing Plastic Pollution in Indonesia: A Multi-stakeholder Action Plan National Plastic Action Partnership 117 Ocean Conservancy and McKinsey Center for Business and Environment (2015) Stemming the tide: land-based strategies for a plastic-free ocean.
Based on analysis provided by the National Solid Waste Management Commission of the Philippines 118 Ocean Conservancy and McKinsey Center for Business and Environment (2015) Stemming the tide: land-based strategies for a plastic-free ocean

Page 65Plastic production, management and financing
119 GIG stakeholder interview 120 World Bank (2018) Indonesia Marine Debris Hotspot: Rapid Assessment, Synthesis Report
Waste pickers are more likely to collect high-value, low-bulk waste
CASE STUDY
The waste bank model
Waste banks are informal community-based establishments for collecting mostly sorted inorganic waste that has economic value. Waste banks are set up for about 1,000 residents and are usually run by people who wish to increase their income.
Customers typically bring inorganic waste to the banks where it is treated like a deposit and the waste banks sell the deposited material to mobile agents for reuse or recycling. In exchange for the waste, customers can receive cash, vouchers for local shops or even cover school fees.119 The waste banks themselves keep enough money to cover salaries and operating costs.120
The Ministry of Environment of Indonesia promotes waste banks to involve communities in waste collection and sorting, and to raise awareness of the economic value which can be derived from waste.
Some municipalities have taken a leading role in implementing at-source sorting by building on the waste bank model, adding awareness-raising campaigns to bring in the wider public.
McKinsey
Waste banks
The waste bank model is common and widespread in Indonesia as well as much of South East Asia. In most instances they are cited as highly effective ways to promote community engagement and replace at-source sorting.
Time needed to collect 1 kilogram of waste (minutes)
Price paid / kg ($) Day’s wages ($)
Plastic bag 0.05
0.12
0.23
0.16
61
37
37
21 4.6
3.7
2
0.5
PP
PET
HDPE

Page 66Plastic production, management and financing
121 Jakarta Post (2017) ‘Depok: The front line in Indonesia’s fight against waste’ 122 SITRA (2018) “The circular economy - a powerful force for climate mitigation,” Transformative innovation for prosperous and low-carbon
industry. Material Economics Sverige AB, Stockholm
CASE STUDY
Depok’s waste management strategy121
In Depok, a city in West Java, the city administration decided to improve waste segregation by creating a system called Partai Ember (Bucket Party), which included new regulations to encourage and enforce residents to separate their household waste into material streams of organic, recyclables and residue.
After a year, the city managed to divert 148 tons of waste daily from landfills, including around 99 tons comprised organic waste from households, 27 tons from the city’s organic and landscape material, and 22 tons of recyclables that have been going to waste banks.
Part of this success is also linked to regulatory enforcement. The administration refused to pick up the waste if residents failed to segregate it. They also had 25 waste police officers covering Depok to patrol for offenders. About 300 people were prosecuted for their inaction in segregating their waste. The fine offenders had to pay was minimal at Rp 50,000 (US$3.74) but people’s behaviour changed as the offenders were required to go to court.
From almost nil to almost 100% segregation rates, a pocket of about 100,000 households in the city of Depok in West Java have managed to divert almost 72% of all their household food scraps and packaging from landfills.
3.4 Recycling
3.4.1 General principles
3.4.1.1 Mechanical Recycling
Mechanical recycling involves physical processing (such as washing, grinding, granulating, shredding) without changing the basic structure of the polymers to provide a polymer which can then be processed into new products. Common processing techniques after re-melting are injection moulding, extrusion, rotational moulding and heat pressing.
Polymers most suited to mechanical recycling are thermoplastic polymers such as PP, PE, PET, PVC. In terms of MSW, the products most commonly recycled in this way are those with codes 1 and 2 (PET and HDPE); they tend to be remade into new bottles or containers, or produced as a fibre for use in clothing, carpets, insulation etc.
Mechanical recycling is currently the most established means of recycling plastics on a commercial level. It does require sorting of polymers prior to reprocessing and if products are contaminated with food, drinks, other polymers or materials, it can result in downcycling into lower value products.
It is worth noting that mechanical recycling of plastic waste produces less than 20% of the CO2 emissions associated with making new plastics.122
3.4.1.2 Chemical Recycling
Chemical recycling is a broad term covering treatment processes which use solvents, chemical depolymerisation or thermal depolymerisation. Chemical depolymerisation is a process where other chemicals are used to break down polymers, generating monomers, whilst solvents are used to dissolve the polymer and separate them from any contamination before being precipitated back out into the original polymer. An example of this process is presented in the case study below. Therefore the main difference in the two processes is that chemical depolymerisation affects the chemical composition of the polymer, whereas using solvents does not.

Page 67Plastic production, management and financing
123 https://plasticenergy.com
CASE STUDY
Plastic Energy123
Plastic Energy is a UK based, international leader in chemical recycling technologies. Plastic Energy uses a patented thermal anaerobic digestion technology which converts unrecyclable plastic waste into oils and back into virgin plastics – which allows this plastic to be re-manufactured into food-grade packaging.
The Thermal Anaerobic Conversion (TAC) technology is designed to convert end-of-life plastic waste into a new feedstock to create clean recycled plastics or alternative low-carbon fuels. For every tonne of end-of-life plastic waste processed, 850 litres of chemical feedstock TACOIL are produced.
The process consists of 5 stages:
1. Receive raw end-of-life or contaminated plastic waste from municipal recovery and recycling facilities.
2. Feedstock is subjected to a pre-treatment to remove some components and meet the quality control standards to feed the plant. This process:
• Removes metals, heavier plastics and materials, as well as the humidity left in plastic.
• Keeps the types of plastic that can be processed (LDPE, HDPE, PS, PP)
3. Waste plastic feedstock is heated in the absence of oxygen until it melts, and the polymer molecules break down to form a rich saturated hydrocarbon vapour. As a result of the TAC process, the condensable gases are converted to hydrocarbon products while the non-condensable gases are collected separately and combusted to process energy.
4. Atmospheric distillation columns receive the hydrocarbon vapour and according to molecular weights separates the vapour into raw diesel, light oil and synthetic gas components.
5. Naphtha and diesel are stored and sold to the petrochemical industry to convert it back into virgin plastic, oil or into transportation fuels. Synthetic gas is used to make the plant run.
Thermal processes include pyrolysis and gasification. Pyrolysis is the thermal breakdown of material without oxygen, generating hydrocarbon outputs and gas. The gas is often burnt to provide energy to the process. Gasification is the partial combustion of material to produce SynGas, a mixture of carbon monoxide and hydrogen, which can be burnt for energy or used in the production of new hydrocarbons. Pyrolysis works best with polyolefins such as PP and PE.
One of the benefits of chemical recycling is the potential to accept polymers that are challenging to mechanically recycle, for example plastic bags or contaminated plastics. Chemical recycling also has the potential to generate polymers that are high grade and therefore could be used for a wider range of products, including food-based products. However, one of the challenges of chemical recycling is the ability to scale up the processes and for it to be economically viability as a recycling system, although it is worth noting that improvements are being made in this area. Chemical processes can be energy intensive and can also have a high CO2 footprint. In addition, whilst chemical depolymerisation and solvent dissolution have the potential to generate high yields of new polymer for use as secondary raw material (from PET for example), thermal processes generate much lower yields and at commercial level tend to operate as recovery rather than recycling processes.
An overview of the different treatment processes can be seen in the table on the following page.
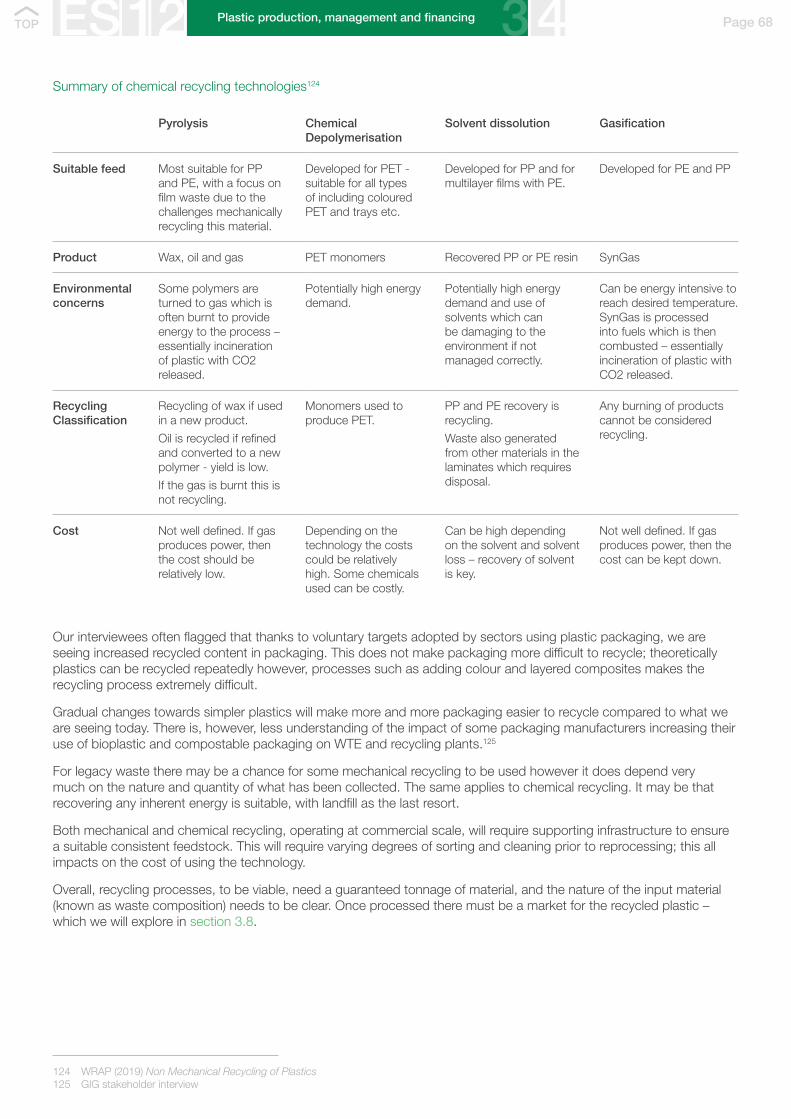
Page 68Plastic production, management and financing
124 WRAP (2019) Non Mechanical Recycling of Plastics 125 GIG stakeholder interview
Summary of chemical recycling technologies124
Pyrolysis Chemical Depolymerisation
Solvent dissolution Gasification
Suitable feed Most suitable for PP and PE, with a focus on film waste due to the challenges mechanically recycling this material.
Developed for PET - suitable for all types of including coloured PET and trays etc.
Developed for PP and for multilayer films with PE.
Developed for PE and PP
Product Wax, oil and gas PET monomers Recovered PP or PE resin SynGas
Environmental concerns
Some polymers are turned to gas which is often burnt to provide energy to the process – essentially incineration of plastic with CO2 released.
Potentially high energy demand.
Potentially high energy demand and use of solvents which can be damaging to the environment if not managed correctly.
Can be energy intensive to reach desired temperature. SynGas is processed into fuels which is then combusted – essentially incineration of plastic with CO2 released.
Recycling Classification
Recycling of wax if used in a new product.
Oil is recycled if refined and converted to a new polymer - yield is low.
If the gas is burnt this is not recycling.
Monomers used to produce PET.
PP and PE recovery is recycling.
Waste also generated from other materials in the laminates which requires disposal.
Any burning of products cannot be considered recycling.
Cost Not well defined. If gas produces power, then the cost should be relatively low.
Depending on the technology the costs could be relatively high. Some chemicals used can be costly.
Can be high depending on the solvent and solvent loss – recovery of solvent is key.
Not well defined. If gas produces power, then the cost can be kept down.
Our interviewees often flagged that thanks to voluntary targets adopted by sectors using plastic packaging, we are seeing increased recycled content in packaging. This does not make packaging more difficult to recycle; theoretically plastics can be recycled repeatedly however, processes such as adding colour and layered composites makes the recycling process extremely difficult.
Gradual changes towards simpler plastics will make more and more packaging easier to recycle compared to what we are seeing today. There is, however, less understanding of the impact of some packaging manufacturers increasing their use of bioplastic and compostable packaging on WTE and recycling plants.125
For legacy waste there may be a chance for some mechanical recycling to be used however it does depend very much on the nature and quantity of what has been collected. The same applies to chemical recycling. It may be that recovering any inherent energy is suitable, with landfill as the last resort.
Both mechanical and chemical recycling, operating at commercial scale, will require supporting infrastructure to ensure a suitable consistent feedstock. This will require varying degrees of sorting and cleaning prior to reprocessing; this all impacts on the cost of using the technology.
Overall, recycling processes, to be viable, need a guaranteed tonnage of material, and the nature of the input material (known as waste composition) needs to be clear. Once processed there must be a market for the recycled plastic – which we will explore in section 3.8.

Municipal government
Material recovery facility (reprocessing) and recycling plants
LandfillSorting MRFs
Population
Packaging companies
Corporates, petrochemical industries, packaging manufacturers
Fuel and cement users
Local taxation
Recycled material
Pay for access to clean recyclable materials
Tipping fee
EPR fees
EPR fees Pay for recycled products
Sorted, recyclable waste
EPR fees
Page 69Plastic production, management and financing
126 World Bank (2018) Indonesia Marine Debris Hotspot: Rapid Assessment, Synthesis Report 127 World Economic Forum (2020) Radically Reducing Plastic Pollution in Indonesia: A Multi-stakeholder Action Plan National Plastic Action Partnership
3.4.2 Financing recycling activities
An important element to note is that recycling plants rely on at-source sorting and sorting MRFs to provide the necessary plastic waste stream. Recycling plants rely on the highest possible quality of recyclable waste in order to work effectively. Sorting MRFs and implementing at-source sorting, including waste banks and waste pickers, can help achieve this higher quality of waste streams for recycling plants.
In the case of Indonesia, likely off-takers of recycled plastics would include large companies operating in the country (e.g. Proctor & Gamble); apparel companies (see the Adidas case study in Chapter 1); and supply chains for automotive or airspace industries, which use recycled materials in the non-visible parts of cars and aircraft. Some pointed out that recycled plastics made in Indonesia are bought by Chinese and Taiwanese manufacturers who will turn recycled pellets into more advanced products, such as yarn for apparel companies.
Revenue stream for a recycling plant or reprocessing MRF
3.4.3 State of the Indonesian market
There are several recycling companies based in Indonesia. Unfortunately, we could not identify specific recycling plants or information about their respective capacities or how the supply of recyclable waste is sourced. We suspect that this is because Indonesia’s recycling sector is largely micro- or very small-scale, and the information is not readily available in English. The World Bank estimates that recycling often starts as an informal sector activity, capturing around 15% of waste generated, with formal recycling systems capturing less than 5% of waste generated.126 There is no clear definition on the exact threshold capacity of a recycling plant which could cause it to be classified as formal or informal.
One interviewee based in Indonesia suggested that there could be as many as 600 recycling companies operating in Indonesia. From the information we could gather on the companies listed below, these companies are small and local. We assume that they work at the local level with very small-scale operations, and likely work well with the informal waste sector, possibly relying on waste pickers and waste banks as their waste feedstock. NPAP estimates that nearly all waste collected by the informal sector ends up at a recycling facility.127
Green Investment Group
CostsWaste flows Revenue

Page 70Plastic production, management and financing
128 World Economic Forum (2020) Radically Reducing Plastic Pollution in Indonesia: A Multi-stakeholder Action Plan National Plastic Action Partnership 129 World Economic Forum (2020) Radically Reducing Plastic Pollution in Indonesia: A Multi-stakeholder Action Plan National Plastic Action Partnership
However, the majority of these recycling companies (80% to 90%) are concentrated on the island of Java, with a much smaller concentration in Northern Sumatra. This leaves most of Indonesia’s land area (and an important part of the population) too far from a recycling plant to supply recyclable material under commercial conditions.128 The World Economic Forum suggests that recycling ‘catchments’ are created throughout the country to create good geographical spread of recycling infrastructure.
We could not find information about the organisations who buy the products coming from these recycling plants, but it seems that the products currently produced are relatively unsophisticated, such as pellets and flakes. We can also infer from NPAP that these small recycling companies turn as much as 85% of plastics into products that are difficult to recycle again, such as textiles or mixed plastics.129
There is very little information on the recycling sector available. There would be value in considering how scaling up these operations could deliver economic benefits for Indonesia:
• Scaling recycling plants could increase recycling rates in the country and drive more demand for collection and sorting – helping the waste sector grow as a whole
• Scale could also help Indonesia establish a stronger export market for recycled plastics
• Larger, more formal plants can improve health and safety standards of workers
• Larger recycling plants are generally more visible in the private sector and could access private capital more easily
• Diversify the types of recycling activities happening in recycling plants, helping produce recycled products which can be more easily recycled again.
Plastic recycling companies based in Indonesia
Companies Materials accepted Recycled products
Global Fiberindo PT PET Flakes
Langgeng Jaya Group Waste plastic Granules/Pellets, Flakes
Polindo Utama PET Flakes
Premier Global Partners PET, HDPE, LDPE Granules/Pellets
Prima Plastindo PP, PS, ABS, HIPS Flakes
PT Bintang Tiga Jaya Plasindo PP, HDPE Granules/Pellets
PT Tridi Oasis Group PET Flakes
PT. Eco Ramah Lestari PP, PE, HDPE, LDPE, LLDPE Granules/Pellets
PT. Langgeng Jaya Plastindo PET, HDPE, LDPE Granules/Pellets
PT. Pelita Mekar Semesta PET, HDPE, LDPE Granules/Pellets, Flakes
PT. Pradha Karya Perkasa PET, HDPE, LDPE Granules/Pellets
PT. Production Recycling Indonesia PET Flakes
PT. Rejeki Adigraha PET, PVC Granules/Pellets, Flakes
PT. Sumber Teknik PET, PP, HDPE, LDPE, ABS, HIPS Granules/Pellets
PT.Sumber Artha Lumbung Sejahtera PET Flakes
ENF Recycling

Page 71Plastic production, management and financing
130 Plastic Energy Press Release (2019) ‘Plastic Energy To Build Five Chemical Recycling Plants In Indonesia’ 131 GIG stakeholder interview
CASE STUDY
Tridi Oasis Group
Established in 2016 and based in Jakarta, Tridi Oasis Group is a women-owned and managed producer of rPET flakes for the packaging and textile industries.
Based in Tangerang, near Jakarta in Indonesia, its current annual production is about 2,000 metric tons with a target of 14,000 metric tons by 2020. This growth will see the company move increasingly toward the production of food grade – the bottle-to-bottle market – rather than sheet grade rPET flakes and a larger proportion of overseas sales.
Tridi Oasis Group notes that a significant portion of PET bottles in Indonesia may not be recycled as a result of poor collection and contamination-related losses during the recycling process.
Therefore, to maintain the quality and cost competitiveness of its feedstock, the company is developing direct channels that dis-intermediate traders: waste banks, schools and universities, and housing developments in and around greater Jakarta.
There is also some activity in recycling led by international firms, such as British company Plastic Energy – whose process was described in an earlier chapter, or Unilever. Our understanding is that these recycling plants are based on proprietary technologies, largely focused on chemical recycling; this allows recyclers to handle low value, unsorted and contaminated plastic waste, as well as handling end-of-life plastic materials which can’t be mechanically recycled such as sachets or plastic bags.
In April 2019, Plastic Energy signed a memorandum of understanding with the Province of West Java, to build five chemical recycling plants.130 We understand from Plastic Energy that these projects are currently in the planning and development phases.131
The combination of mechanical recycling to capture high value plastics combined with chemical recycling, capturing lower value plastic, would be an interesting concept to explore in the Indonesian context. As Plastic Energy has already made a commitment to developing chemical recycling plants it could provide a platform to develop a complimentary mechanical recycling program.

Plastic production, management and financing Page 72
3.5 Waste to Energy
3.5.1 Theory: How does this usually work?
Waste to energy (WTE) technologies are a well-known way to decrease the amount of waste going to landfills and to recover energy and other useful outputs from waste streams. Several WTE technologies exist and are commercially proven means of making electricity and heat out of the energy contained in waste. Beyond energy generation, other benefits can also be attributed to WTE plants. These include the reduction of waste volume; reduction of land demand in comparison to landfilling options; and reduction of environmental and social externalities attributed to waste disposal. Different WTE technologies produce different outputs, and the feasibility of the technology and the quality of the output depends on the nature of the waste stream.
The composition of the input waste stream matters as the calorific value of the input material determines the operation of the plant; too high a calorific value can be as challenging as too low a calorific value in terms of optimisation operations.
Chemical conversion technologies involve bio-chemical decomposition (methanisation) of the organic matter in a waste stream. Methanisation produces biogas, which is combusted for direct heat use or to generate electricity.
Thermal processing involves the combustion of solid waste. It generates heat which can be directly utilised or converted into electricity. Advanced thermal technologies can produce a more versatile range of outputs including syngas, liquid and solid fuels, which can subsequently be used to generate heat, electricity or fuel. This process is done either through conventional incineration technologies, or through advanced thermal conversion technologies, which are in earlier stages of commercial development.
Waste to Energy technologies
Commercial, operational and technology elements associated with various WTE technologies
Key features Incineration Gasification Pyrolysis
Technical summary Thermal breakdown of waste in an excess of oxygen/air
Thermal breakdown of waste in a depleted oxygen/air environment
Thermal breakdown of waste in the absence of oxygen
Commercial? Yes Yes Pilot stage
Number of plants globally > 1,000 < 150 < 10
Pre-treatment of MSW? No Yes Yes
Risks Lower risk of component failure
Higher risk of component failure; syngas needs to be cleaned
Higher risk of component failure; syngas needs to be cleaned
Indonesia’s Ministry of Energy and Mineral Resources
Carbon Trust
Chemical conversion technologies Thermal processing technologies
Advanced thermal processingConventional incineration
• Anaerobic digestion
• Landfill gas recovery
• Pyrolysis
• Gasification
• Moving gate incineration
• Fluidised bed incineration
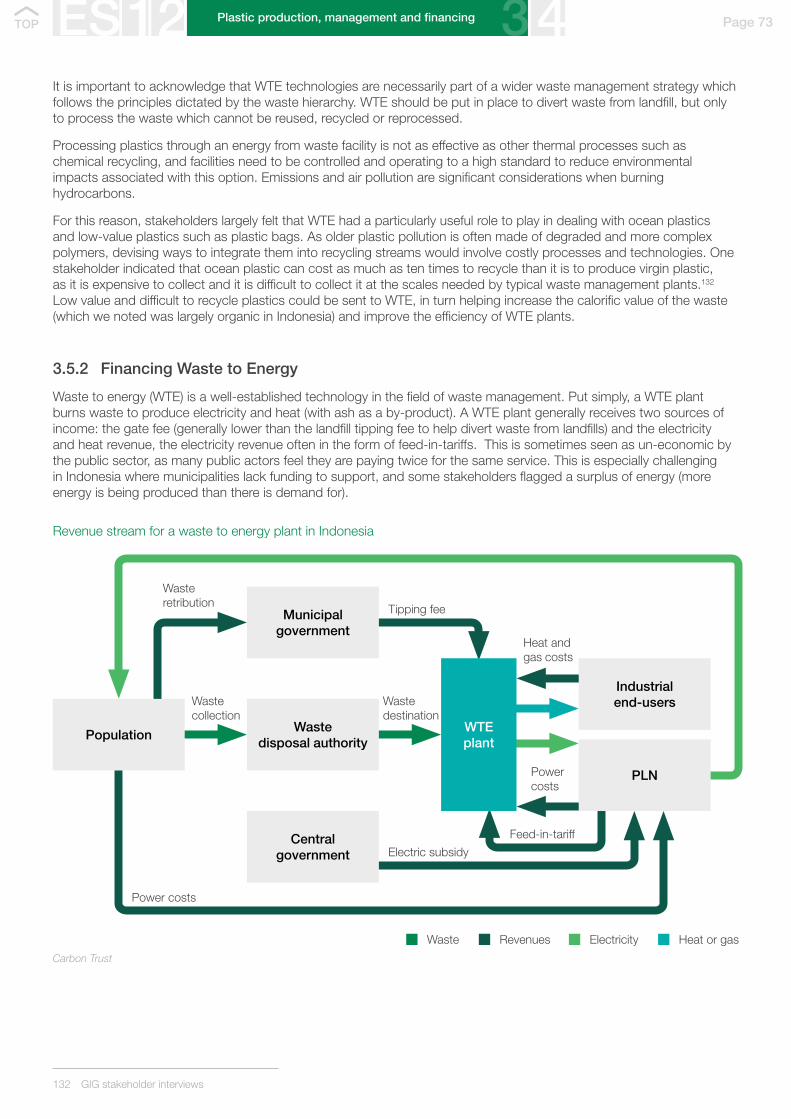
Population
Industrial end-users
PLN
Waste disposal authority
Central government
Municipal government
WTE plant
Page 73Plastic production, management and financing
132 GIG stakeholder interviews
It is important to acknowledge that WTE technologies are necessarily part of a wider waste management strategy which follows the principles dictated by the waste hierarchy. WTE should be put in place to divert waste from landfill, but only to process the waste which cannot be reused, recycled or reprocessed.
Processing plastics through an energy from waste facility is not as effective as other thermal processes such as chemical recycling, and facilities need to be controlled and operating to a high standard to reduce environmental impacts associated with this option. Emissions and air pollution are significant considerations when burning hydrocarbons.
For this reason, stakeholders largely felt that WTE had a particularly useful role to play in dealing with ocean plastics and low-value plastics such as plastic bags. As older plastic pollution is often made of degraded and more complex polymers, devising ways to integrate them into recycling streams would involve costly processes and technologies. One stakeholder indicated that ocean plastic can cost as much as ten times to recycle than it is to produce virgin plastic, as it is expensive to collect and it is difficult to collect it at the scales needed by typical waste management plants.132 Low value and difficult to recycle plastics could be sent to WTE, in turn helping increase the calorific value of the waste (which we noted was largely organic in Indonesia) and improve the efficiency of WTE plants.
3.5.2 Financing Waste to Energy
Waste to energy (WTE) is a well-established technology in the field of waste management. Put simply, a WTE plant burns waste to produce electricity and heat (with ash as a by-product). A WTE plant generally receives two sources of income: the gate fee (generally lower than the landfill tipping fee to help divert waste from landfills) and the electricity and heat revenue, the electricity revenue often in the form of feed-in-tariffs. This is sometimes seen as un-economic by the public sector, as many public actors feel they are paying twice for the same service. This is especially challenging in Indonesia where municipalities lack funding to support, and some stakeholders flagged a surplus of energy (more energy is being produced than there is demand for).
Revenue stream for a waste to energy plant in Indonesia
Carbon Trust
Waste collection
RevenuesWaste Electricity Heat or gas
Power costs
Tipping fee
Waste retribution
Heat and gas costs
Power costs
Electric subsidy
Feed-in-tariff
Waste destination

WTE plants rely on a specific tonnage and composition for the waste it receives. Both elements determine the calorific value (CV) of the waste (i.e. how much electricity will be generated by burning it). Plastics have a high calorific value while organic waste has a relatively low value.
If the CV becomes too low, then the plants won’t be able to burn enough waste to keep the boiler energy capacity at its maximum. The energy coming out of the boiler will reduce and the electricity output will fall. If the CV becomes too high, then the plant will lose revenue from gate fees as a lower tonnage will generate the same electrical outputs.
The role of PLN
In Indonesia, PLN is the national energy utility and therefore acts as the sole off-taker for energy projects such as WTE.
All stakeholders pointed out that PLN does not pay enough for the electricity generated by a WTE facility to make the economics viable. This is because WTE is perceived to already receive public support through gate fees, and because energy can be bought from other sources at much lower prices.133
In order to improve this situation, the Government of Indonesia should consider how to incentivise WTE facilities to develop a suitable heat offtake solution for nearby industrial users. This can improve overall economics and decrease the price of electricity which would be needed to make the project work.
3.5.3 State of the Indonesian market
The use of plastic waste to create energy is an element within the national level strategy of the Government of Indonesia’s National Marine Debris Action Plan. However, as of early 2020, according to NPAP analysis Indonesia does not have commercial-scale incineration or WTE facilities, but several are planned.134
Since Indonesia does not have sorting MRF plants in place, it largely relies on traditional incineration technology, which doesn’t require waste to be pre-treated or sorted, as set out in section 3.5.1.135 MRFs could create opportunities for Indonesia to trial other types of WTE technologies.
We saw earlier that Indonesia’s waste streams are high in organic content – making them low in calorific value for burning. Several stakeholders suggested that oceans plastics and low-value plastics could be used to increase the calorific value of Indonesia’s new waste and, combined, would constitute an ideal feedstock for WTE.136 This may lead to savings for municipalities on gate fees: adding plastics into the waste feedstock and therefore increasing the calorific value means that WTE plants can burn less waste for the same energy output, thus reducing gate fees. Careful economic analysis should be carried out to determine the economic impacts of including low-value plastics and ocean plastics into WTE, both for local government and WTE operators.
In many cases we were told that WTE feed-in-tariffs for energy was often topped up by central Government to help plug in budget restraints at municipal level.137
One Indonesian finance firm confirmed that while there isn’t public information on the number of WTE plants in operation in Indonesia, they believed that one plant is currently in operation in Surabaya with 2MW capacity, and up to 12 new plants expected to operate within 2020-2021.138
Page 74Plastic production, management and financing
133 GIG stakeholder interviews 134 World Economic Forum (2020) Radically Reducing Plastic Pollution in Indonesia: A Multi-stakeholder Action Plan National Plastic Action Partnership 135 GIG stakeholder interviews 136 GIG stakeholder interviews 137 GIG stakeholder interviews 138 https://ekonomi.bisnis.com/read/20190808/44/1133886/tahun-ini-11-mw-pltsa-terpasang

Page 75Plastic production, management and financing
139 Eurostat (2020) Greenhouse gas emissions from waste
3.6 Landfills
3.6.1 General principles
Landfilling is the oldest and most common form of waste disposal, although the systematic burial of the waste with daily, intermediate and final covers began in 1940s. The term landfill is usually shorthand for a municipal landfill or sanitary landfill. These facilities were first introduced early in the 20th century, but gained wide use in the 1960s and 1970s, in an effort to eliminate open dumps and other "unsanitary" waste disposal practices.
A sanitary landfill is an engineered facility that separates and confines waste. These types of landfills are engineered so that they protect water courses from leachates and control gaseous emissions.
Sanitary landfills are intended as biological reactors (bioreactors) in which microbes will break down complex organic waste into simpler, less toxic compounds over time.
It is important to note that organic waste in landfills decomposes and produces greenhouse gases, in particular methane. For this reason, landfills are the biggest contributors of greenhouse gas emissions in the entire waste journey – which also explains why it is important to divert as much waste from landfilling as possible, following the principles of the waste hierarchy.
CASE STUDY
Greenhouse gas emissions from waste in Europe
In Europe, reduction in emissions from solid waste disposal follows from an increase in the recovery of landfill gas and a reduction in the amount of landfilling. With more waste being recycled and residual waste being used to create energy, less of it needs to be landfilled or incinerated, which contributes to protecting the climate.
Municipal waste going to landfill versus greenhouse gas emissions from waste in EU-28 countries, 1995-2017
While the total amount of municipal waste treated increased by 13% between 1995 and 2017, the amount of waste that was landfilled fell by nearly 50% over the same period. The reduction in landfill was possible because the amount of waste that is recycled or composted has tripled and the amount of waste that is burned has doubled.
From an emissions perspective, this is extremely significant: waste is the fourth largest source sector of emissions in Europe, accounting for 3% of total greenhouse gas emissions in 2017.139
Eurostat
160000
140000
120000
100000
80000
60000
40000
20000
0
1995
1996
1997
1998
1999
2000
2001
2002
2003
2004
2005
2006
2007
2008
2009
2010
2011
2012
2013
2014
2015
2016
2017
300000
150000
0
50000
100000
200000
250000
Waste to landfill (thousand tonnes) Greenhouse gases (thousand tonnes of CO2 eq)
Thousand tonnes of CO2 eqThousand tonnes
-43.8%
-48.9%

Page 76Plastic production, management and financing
140 GIG stakeholder interview 141 GIG stakeholder interview 142 World Economic Forum (2020) Radically Reducing Plastic Pollution in Indonesia: A Multi-stakeholder Action Plan National Plastic Action Partnership 143 World Economic Forum (2020) Radically Reducing Plastic Pollution in Indonesia: A Multi-stakeholder Action Plan National Plastic Action Partnership
3.6.2 Financing landfills
Traditionally, landfills are financed with gate fees – i.e. municipalities pay a set price per ton for waste to go to sanitary landfills. Gate fees are used to finance landfill operations.
In efforts to reduce the amount of waste that goes to landfill, many governments impose a tax on landfilling waste, so that landfilling waste is more expensive than any other option further up the waste hierarchy, such as WTE gate fees.
3.6.3 State of the Indonesian market
As there are currently no formal sorting activities, the vast majority of waste collected from businesses and households is taken to landfill. Some stakeholders indicated this was at nearly 100%.140 We did not manage to identify data on the proportions of sanitary versus unsanitary landfills in Indonesia.
It is after waste is landfilled that the informal waste pickers will capture higher value plastics, where they will eventually find their way to recycling plants.
Most landfills in Indonesia are now over-burdened and there is limited land availability to set up new landfills. This situation was confirmed in stakeholder interviews where the situation was deemed to be critical and therefore in need of urgent action.141 A major challenge in this regard is that lack of capability at the level of local municipalities to understand what alternatives to landfill are available.
The World Economic Forum suggests that even with significant progress is sorting and recycling infrastructure, a substantial increase in sanitary landfill capacity is needed to accommodate the extra volumes of additional plastic collected. To handle this, controlled disposal capacity must be expanded to accommodate 3.3 million additional tonnes of plastic waste per year in 2025.142
Taking steps to reduce the need for new landfills, as far as practically feasible, will require taking ambitious steps outside of the waste management sector. This will involve implementing circular economy principles such as reducing avoidable plastic use, substituting plastic packaging with compostable materials, redesigning packaging solutions to use recyclable materials etc.143 - which are solutions outside of the scope of this report.

75+25+A 61+21+18+A
Page 77Plastic production, management and financing
144 Jambeck, Geyer, Wilcox, Seigler, Perryman, Andrady, Narayan and Lavender Law (2015) ‘Plastic waste inputs from land into the ocean’ 145 Ocean Conservancy and Trash Free Seas Alliance (2019) Plastics Policy Playbook: Strategies for a Plastic-Free Ocean 146 Circulate Capital (2019) Investing to reduce plastic pollution in South & Southeast Asia: A Handbook For Action 147 Circulate Capital (2019) Investing to reduce plastic pollution in South & Southeast Asia: A Handbook For Action 148 Ocean Conservancy and McKinsey Center for Business and Environment (2015) Stemming the tide: land-based strategies for a plastic-free ocean 149 GIG stakeholder interviews 150 GIG stakeholder interviews
3.7 Dumping, leakage and plastic pollution
3.7.1 State of the Indonesian market
We saw earlier that collection is not well funded in Indonesia. This is especially true for materials with low residual value such non-recyclable plastics (plastic films, composites and sachets). These types of plastics typically do not create enough revenue to cover the cost of collection and sorting and are not being picked up by waste pickers.144
This makes low-value plastic waste more likely to leak from the collection system. A large portion of ocean plastic is made up of these low-value plastics.145
Around 80% of marine debris comes from land-based sources with ineffective waste management systems.146
Despite comprehensive national-level legislation governing the collection and management of household waste, and action plans on marine plastics in some cases, the South east Asian region still sees mismanaged plastic entering the environment and the ocean. The reasons for this are varied but include lack of enforcement of laws and regulations; for example, with respect to mandating separation of waste at source, and prohibiting illegal dumping and burning of waste.147
Drivers of plastic leakage
Higher-residual value plastics are more likely to be collected from disposal sites and then resold. This means that products or packaging with low residual value (plastic shopping bags, for instance) are less likely to be collected; they therefore become a particularly significant contributor to ocean plastic.
Interviewees have told us that some businesses will pay for informal trucks to collect their waste for lower fees than formal trucks. These illegal companies will often avoid paying tipping fees by taking waste to illegal dumps rather than landfills.
Where households do throw away their waste into the natural environment, we are reminded that this is generally not because people are not considerate for the environment. On the contrary, throwing waste into a riverbed is often the more considerate option compared to burning waste openly or throwing waste near neighbours. Some stakeholders highlighted that Indonesian people are culturally close to the natural environment and most are devastated to witness the impact of plastic pollution on their homeland.
McKinsey analysis
1. Average, 5 focus countries: China, Indonesia, Philippines, Thailand, Vietnam; 2. “Value” is a quantitative function of price at secondary dealers and time taken to collect, combined with a qualitative function of homogeneity and likelihood of rejection by secondary dealers; 3. Low-density polyethylene; 4. Polyethylene terephthalate; 5. High-density polyethylene.
Collected 75%
Low (e.g. films, composites)
61%
Ocean leakage does not stop once waste has been collected
Uncollected 75%
Medium (e.g. polystyrene LDPE3) 21%
High (e.g. PET4, HDPE5) 18%
Collection levels1
Value2 of plastic waste

90+10+A
Page 78Plastic production, management and financing
151 Zero Waste Scotland (2015) Plastics Evidence Base for Plastics Recycling in Scotland 152 OECD (2018) Improving Plastics Management: Trends, policy responses and the role of international co-operation and trade, Prepared by the
OECD for the G7 Environment, Energy and Oceans Ministers. Original data source reported to be Geyer, Jambeck and Lavender Law (2017) ‘Production, use, and fate of all plastics ever made’ Science Advances, Vol.3 no.7
3.8 Downstream markets for recycled plasticsRecycled plastics are a relatively new market for many industries – from apparel companies to packaging manufacturers. In this section we share emerging insights to further demonstrate the opportunities that Indonesia could tap into.
3.8.1 Competing with virgin plastic
Competing with virgin plastic feedstock is a challenge. Prices for virgin feedstock tend to be fairly volatile as they are directly linked to oil prices which can fluctuate significantly. Therefore, when oil prices fall the price for virgin feedstock also falls which can make it difficult for recycled plastic feedstock to compete especially as there is often an expectation that using secondary resources should be cheaper than primary. Evidence has shown that, typically, end customers expect a discounted price for recycled plastic feedstock compared to virgin, but this cannot always be met.151 If, when securing a market opportunity for recycled plastic there is an over-reliance on price differential this can directly impact on the longer-term viability of using recycled plastic feedstock.
In terms of the global market share, virgin plastic continues to dominate, with recycled plastic barely making any impact.
Estimated global market share of virgin and recycled plastics (resin) 2017152
Recyled plastic 10%
Ellen McArthur Foundation
Virgin plastic 90%
The influence of targets and regulation on growing the market
Increasing demand for recycled plastics as a result of regulation and corporates adopting voluntary targets is starting to change this market dynamic and is creating a premium for recycled materials.
International organisations are creating standards and targets to encourage corporates to transition towards circular economy principles. The influence of the Ellen MacArthur Foundation has been mentioned throughout this report.

Page 79Plastic production, management and financing
153 S&P Global Platts (2019) ‘Plastics recycling: PET and Europe lead the way’
CASE STUDY
The European Plastics Pact
The European Plastics Pact is the first regional Pact to join the Ellen MacArthur’s Foundation’s global Plastics Pact network. Launched in March 2020, this Pact brings together governments and businesses within the European Economic Area (EEA) to work towards a common vision for a circular economy for plastic, in which plastics never become waste or pollution.
Together, the 81 members of the European Plastics Pact have committed to a set of ambitious 2025 targets. They include:
• Make all plastic packaging and single-use plastic products reusable where possible, and in all cases recyclable
• Reduce the need for virgin plastic products and packaging by at least 20%
• Increase the collection, sorting and recycling capacity of all plastics used in packaging and single-use products in participating countries by at least 25 percentage points
• Boost the use of recycled plastics as much as possible, with an average of at least 30% recycled plastics across single-use plastic products and packaging
The European Plastics Pact focuses on opportunities to drive ambitious action across country borders. Its members will:
• Cooperate across the value chain on a European scale to boost the development of smarter techniques and approaches
• Harmonise guidelines, standards, and national supporting frameworks
• Connect to share best practices and lessons learned across Europe
Members of the European Plastics Pact include 15 governments and 66 companies. Progress will be monitored and reported each year by all signatories with a Secretariat keeping track of the results.
These types of corporate targets are relatively new and their impact isn’t yet measured, though market analysts such as S&P Global Platts report that most major brands of plastic packaging are well on track to meet these new targets.153 But we know from other sectors that corporate engagement from the public sector can be greatly influential when kick-starting a new market, as demonstrated by the UK Green Finance Taskforce.

01 01
02 02
03 03
04 04
Plastic production, management and financing Page 80
CASE STUDY
The UK Green Finance Taskforce
In September 2017, the UK Government asked leading finance expert and former Lord Mayor of the City of London, Sir Roger Gifford, to chair an independent taskforce to accelerate growth of green finance and the UK’s low carbon economy.
The Green Finance Taskforce produced a report setting out a series of practical recommendations on how the UK government and the private sector could work together to make green finance an integral part of our financial services sector.
In 2019, the government subsequently published the Green Finance Strategy which took forward the key themes of the taskforce. The Taskforce played a central role in shaping the UK’s approach to financing sustainable infrastructure and changing policies in regulation to go in this direction.
The Taskforce also significantly influenced the development of green finance products in the private sector. One example was Barclay’s new green mortgage, which offers lower interest rates if customers purchase more energy efficient homes to help incentivise the energy efficiency market.
Increasing demand for recycled products: public and private perspectives
As we have seen throughout this report, the collection of plastic waste in key focus countries is driven by its inherent economic value. Plastics with established recycling markets like PET and HDPE are largely collected, while others, such as flexible non-recyclable films, are not. One key to solving this challenge is by creating a value for these types of plastics over time.
We noted in our literature review that the standard policy approach is to start with collection and work ‘up’ the waste journey: first improving collection rates, then sorting, recycling etc. However our private sector interviewees overwhelmingly suggested starting with the downstream market first, in effect creating a reverse supply chain, thus ensuring demand for the final product will create a value for the initial product and work its way ‘down’ the waste journey. For this reason, measures that create a downstream market, particularly targeted at plastics not often collected, can play an important role in improving collection rates and the livelihoods of waste collectors.
The policy approach to waste management The private sector approach to waste management
Green Investment Group
Collection
Increasing collection rates will allow waste companies to tap into the full range of generated waste and increase certainty.
New use
Work with corporate buyers to create demand for the final product first. This can help normalise premium prices and create certainty for investors looking for off-takers.
Sorting
Supporting sorting activities (MRFs or at-source) will enable more types of waste infrastructure to flourish and create certainty on composition.
Processing
The demand will dictate products and therefore processing technologies.
Processing
Encouraging waste firms to push waste “up” the waste hierarchy by privileging recycling over WTE and over landfill.
Sorting
Waste processing facilities will put a higher price for the raw materials to recycle as they have more certainty over prices and demand.
New use
Boosting demand for recycled products through regulation and agreements with corporates and off-takers.
Collection
Higher prices for a wider range of products will incentivise collection and sourcing – helping the sector and the public put a higher value on waste.

Plastic production, management and financing Page 81
The future of the recycled plastics market
Regulation and the rise of corporate sustainability mean that demand for recycled plastics is growing rapidly globally, which will likely mean that recycled plastics prices will be increasingly sheltered from the influence of oil prices.
Projected demand for recycled PET globally
The recent decision in China to stop waste imports has a major impact on the Chinese recycling industry. Malaysia, Vietnam, Indonesia, India and Thailand are among the Southeast Asian countries that have attracted Chinese investors in the PET recycling sector over the past year, keen to fill the void left in China.
New niches are also appearing, such as apparel companies now using ‘made from ocean plastic’ as their USP, as can be seen in the case study below.
S&P Global Platts 2019
IHS Markit analysis
R PET food-grade pellets are increasingly immune from drops in virgin plastic prices
13
Feb-19 Mar-19 Apr-19 May-19 Jun-19 Jul-19 Aug-19 Sep-19
1600
1400
1200
1000
800
1914 20 2515 21 2616 22 2717 23 2818 24 29 30
4.0
0.0
0.5
1.0
1.5
2.0
2.5
3.0
3.5
Virgin PET R-PET FGP
Million metric tons
€/million tonne

Page 82Plastic production, management and financing
154 Adidas website, Parley website, Edie newsroom 1/02/19, Adidas to double production of ocean plastic trainers in 2019.
CASE STUDY
Adidas making sportswear from plastic waste154
Adidas partnered with Parley for the Oceans to develop a line of training wear which was launched at the UN in 2015. They used marine plastic waste, turning illegal deep sea fishing gillnets to create yarn and filaments to make training shoes. The range has now developed to include other clothes and shoes made from waste plastics collected from beaches and coastal communities around the world. The plastic is collected by Parley as part of their global clean up network, before being cleaned and processed into thread that is then used to make shoes, high performance sportswear and other clothing.
By 2018, Adidas had produced over 5 million pairs of trainers which contained 95% recycled plastic waste from these clean-up operations, with each trainer containing around five recycled 500ml bottles worth of plastic per shoe, with plans to double production in 2019. It is worth noting that Adidas also used some of the ocean plastic waste sourced by Parley in special and limited editions football kit ranges including Real Madrid, Bayer Munich and Manchester United.
The challenge for a recycling system is to provide a consistent quality supply of the range of polymers in sufficient quantities for a market to be sustained and for manufacturers and producers to consider the use of recycled polymers in their product specifications.
Instability of supply and the availability of recycled plastic as a viable replacement for virgin feedstock is quoted often as a reason why manufacturers will not make the necessary changes and invest in equipment to facilitate the use of recycled feedstock. Stability of supply, not just in volume terms but also in terms of quality can be a challenge. The benefits of packaging feedstock are that the composition can be less varied/complex than other plastic products, and supply can be less of a challenge, therefore ensuring sufficient and appropriate infrastructure is in place to capture and contain targeted waste materials can provide confidence in supply.
Taking steps to scale up the recycling sector in Indonesia, as we explored in more detail in section 3.4, could help Indonesia capture this increasing demand and become an important part of the global supply chain for recycled plastics.

Key challenges and solutions

Page 84Key challenges and solutions
155 https://www.bloomberg.com/cfli/
IntroductionIn this chapter we summarise some of the main barriers to investment identified by our analysis, and describe practical solutions to address them. These proposed solutions are intended to form part of a comprehensive, whole-systems approach and are therefore interlinked.
Our analysis shows that in Indonesia, several steps of the waste journey are being developed independently from one another, creating gaps in the system on sorting and recycling. This has meant the market has not responded to national policy signals such as Indonesia’s targets to reduce unmanaged waste.
Based on our analysis of the current waste journey in Indonesia we set out what a more efficient and inclusive waste journey could look like: creating processes to manage both ‘new’ and ‘legacy’ waste (ocean plastics in particular), and creating processes where formal and informal sectors can work better together.
A multi-stakeholder approach
The solutions presented address the critical roles of policymakers, public finance and private finance – working in concert, to overcome these challenges. This approach is aligned with our work as part of the Climate Finance Leadership Initiative of which Macquarie Group is a founding member.155
The role of development finance
Development Finance Institutions (DFIs) can play a central role creating more certainty for private investors in waste management.
It was noted earlier that, despite strong appetite to do so, DFIs do not finance waste infrastructure as much as other sectors such as clean energy. Stakeholders confirmed that improving waste management is in line with many DFIs’ objectives to improve urban living, improve health and safety and combat climate change. When asked about the role DFIs could play in waste infrastructure, respondents suggested the following activities:
• Support for sector planning
• Supporting the government to achieve policy and regulatory reforms – creating the right enabling environment
• Government capacity building
• Sovereign financing
• Technical assistance provision and financing
• Providing transaction advisory to develop PPP projects
• Providing long-term commercial financing to bankable projects
• Mobilising commercial co-financing and knowledge sharing
• Promoting partnerships between international and local firms
DFIs can even help private investors deal with policy uncertainty. For example, the World Bank’s Multilateral Investment Guarantee Agency (MIGA) specialises in providing political risk insurance and credit enhancements, helping investors move to new geographies.
While our recommendations do not set out a detailed role for DFIs, they will be key partners for both Indonesian and private stakeholders as Indonesia accelerates the growth of its waste infrastructure.

Collection Sorting Plastic recycling Recovery
Plastic waste from MSW
Formal collection trucks
Waste pickers capture high value plastics
Small-scale mechanical
recycling plants
Incineration with energy recovery
Waste banks Waste banks
Private sector-led recycling plants
(e.g. Unilever, Plastic Energy)
Informal collection trucks Disposal
Landfill (sanitary and uncontrolled)
Dumping
Open burning
Collection Sorting Plastic recycling Recovery
Plastic waste from MSW
Formal collection trucks
Local sorting MRFsSmall-scale mechanical
recycling plants
Incineration with energy recovery
Waste banksWaste pickers capture high value plastics
Public-led recycling plants, chemical and
mechanical
Informal collection trucks
Waste banks
Private sector-led recycling plants
(e.g. Unilever, Plastic Energy) Disposal
Landfill (sanitary and uncontrolled)
Ocean waste and plastic pollution
Third-sector and government-led
collection
Informal collection
Key challenges and solutions Page 85
Current waste journey in Indonesia
Green Investment Group
Green Investment Group
A more efficient plastic waste journey in Indonesia
Informal and small-scale processesFormal process Illegal activities
Informal and small-scale processesFormal process

Page 86Key challenges and solutions
156 GIG stakeholder interviews
Theme 1: Building capability to plan for and manage waste
CHALLENGE Local government capability
Interviewees told us that local officials in Indonesia often lack the capability to design and procure waste management solutions. As we saw in our description of a public-led waste management deal in the Introduction, public sector officials are responsible for designing waste projects, testing concepts through soft market tests, running complex procurement processes and awarding contracts. We also understand that in most cases, local authorities do not have enough funding to hire external consultants to support them through these processes.
In the UK local authority officials often do not have project finance or engineering backgrounds and rely on consultants to write and evaluate procurement processes for PPP and PFI projects. In our interviews, stakeholders also cited lack of capability in Indonesian local government as a key barrier to private investment.
SOLUTION Create a new Waste Management Authority
We described in section 2.2.3 that creating a ‘one stop shop’ for investors can help simplify the experience of international investors seeking to invest in Indonesia, as well as consolidate the public sector expertise in waste infrastructure.
One way to build capability across the country is to create a centralised hub of expertise, staffed by experts in project finance, infrastructure and procurement, responsible for supporting local actors in developing waste projects.
RECOMMENDATION
01 The Government of Indonesia should set up a new Waste Management Authority. This could be done inside one of the government departments with existing waste management responsibilities, such as the Ministry of Maritime and Investment Affairs.
This dedicated agency can oversee waste management projects across Indonesia, supporting municipalities to design new projects, run tenders and ensure projects reach completion.
This public body could be responsible for several crucial activities that will unlock private capital in waste infrastructure, such as:
• Enforcing legislation on behalf of government (national and local)
• Publishing annual reports on the state of the waste market, helping investors and others access information and measure progress
• Supporting policy development in central and local government by providing expertise and insights from the private sector
• Representing Indonesia in creating and managing international partnerships
• Improving collaboration between public and private, national and international actors
• Supporting local government in developing and procuring waste management projects

Page 87Key challenges and solutions
157 Information provided by the UK’s Infrastructure and Projects Authority
RECOMMENDATION
02 The UK should consider how it might support Indonesia in developing more integrated approaches to developing waste. This could include technical assistance in policy and project finance to help set up a new Waste Management Authority.
This could form a part of the UK’s aid programmes in climate change, green finance and sustainable infrastructure. In particular, the UK’s Infrastructure and Projects Authority could provide support in setting up this body, providing technical assistance which can harness the UK’s expertise on infrastructure developing in emerging economies.
Indonesia has already implemented a similar system for toll roads; in the form of the specialised government agency named the Toll Road Authority, which helps harmonise regulations and policies across the country and in charge of running tenders for toll road projects. The UK has implemented a similar system for waste infrastructure. More detailed case studies are provided in section 2.2.3.
Several interviewees agreed that the toll road model would work well for waste management.156
Simplifying investors’ experience
From the perspective of policy makers, setting up a new agency to oversee specific work is often regarded as burdensome, over-complicating the public sector landscape rather than simplifying it. It can also be challenging for officials responsible for waste infrastructure in other Ministries to give up their responsibilities in favour of a new public body.
While these concerns are valid, the overwhelming view from investors is that interacting with one public entity which is then responsible for liaising between relevant Ministries, and between national and local authorities, creates a simpler experience. This is especially true for international investors who might not know how to navigate a new jurisdiction. Given the success of the Indonesian Toll Road Authority, it is important that Indonesia considers how this model could work for waste management – arguably one of its greatest infrastructure challenges. We have explored this in more detail in section 2.2.3.
One way to avoid over-complication, from the perspective of the public sector, is to leverage existing staff with waste management experience into a new Agency, to be complemented with staff with private sector (development, finance etc) experience.
This Agency can also be managed by the Ministry responsible for waste management, or be operated as a joint unit – for example, this could be run between Indonesia’s Coordinating Ministry of Maritime and Investment Affairs and the Ministry of Energy and Mineral Resources. While the new Agency or joint unit should have independence and responsibility for implementing waste regulations and supporting local authorities, it can report on progress to senior officials and Ministers from relevant Ministries.

Page 88Key challenges and solutions
158 GIG stakeholder interviews 159 Circulate capital 160 GIG stakeholder interviews
CHALLENGE Local corporate capability
We saw in previous chapters that partnering with local companies can help investors better understand how local market dynamics work, who to engage with in government, and how legislation and regulation works. In the majority of interviews carried out, partnering with a local firm was a crucial element to developing pipeline and doing deals in new geographies.158
The absence of waste management and recycling companies with strong and transparent track records of profitability can be a challenge for international investors and developers.159 Interviewees also indicated that identifying the right local partners and strong commercial partners required hard work – but was not impossible.160
As mentioned in the Introduction, characteristics of good local partners for international firms typically include:
• Local insights: knowledge of where to get information, how regulation works, who decision-makers are.
• Tender-writing: understanding of how to write public tenders, how to pitch to governments, and which Ministries are important.
• Reputation and Influence: without engaging in lobbying or unlawful activities, being able to be a recognised voice when governments consult with the waste management sector and requests feedback, helping to develop policies that create the right enabling environment for the market.
Local firms would benefit from increasing their interactions with international firms to learn about international best practice in due diligence, governance and other elements which will be crucial to international investors.
SOLUTION Create opportunities for international partnerships
Some interviewees told us that trade missions and trade shows are among the most effective ways to build a local network of experienced companies and help create deals and partnerships. The UK and the Netherlands were quoted as being particularly effective at running these events.
CASE STUDY
The UK’s Global Infrastructure Programme157
The Global Infrastructure Programme (GIP) is a technical cooperation scheme in infrastructure funded by the UK Government’s Prosperity Fund and implemented by the Infrastructure and Projects Authority (IPA), Foreign and Commonwealth Office and the UK’s Department for Business, Energy and Industrial Strategy.
The GIP’s offer follows three steps:
• Tools development and adaptation: for the preparation, appraisal, initiation, delivery and management of infrastructure programmes and projects.
• Personnel capacity building and certification: for the adaptation, adoption, implementation and wider use of the tools in-country
• Pathfinder project: to showcase the benefits of using these tools in real projects, the IPA will work with partner countries and relevant government bodies (local and national) to implement one infrastructure project from start to finish

Key challenges and solutions Page 89
RECOMMENDATION
05 The UK runs several Economic and Financial Dialogues around the world, chaired by HM Treasury. Waste could form an important part of this engagement in South East Asia.
The UK Department for International Trade, the Foreign and Commonwealth Office and City of London Corporation have extensive experience in helping create business-to-business learning opportunities and partnerships. To date the focus of these engagements has been clean energy and transport, however this should be expanded to waste infrastructure in South East Asia.
RECOMMENDATION
06 UK Export Finance (UKEF), the UK Export Credit Agency, should work with City of London Corporation and UK stakeholders to explore how it could support UK investment into Indonesian Waste Infrastructure.
In the 2020 budget, UKEF’s direct lending facility was significantly increased to £8 billion, with £2 billion allocated for clean growth projects. To date no waste management projects internationally have benefitted from UKEF support.
Given the increased funding and focus on clean growth, as part of developing partnerships, efforts should be made to engage with UKEF in order showcase the export and investment potential of the Indonesian waste market.
RECOMMENDATION
04 City of London Corporation should prioritise waste management as part of its broader clean growth and green finance agenda, recognising this is an essential sector contributing to economic growth, health, wellbeing, and environmental protection. The UK’s City of London Corporation can convene British waste companies and support them in forming partnerships with local firms.
RECOMMENDATION
03 Government of Indonesia could work with other governments to organise trade missions and trade shows, showcasing local businesses and helping them create ties with international investors and developers.
Key challenges and solutions Page 90
RECOMMENDATION
07 The Government of Indonesia could develop a Waste Management Development Fund concept in order to provide bridging support to municipalities in their development of waste infrastructure.
The fund could be administered by the new Waste Management Authority with seed funding for this concept from bilateral funding from donor governments as well as tapping into existing multilateral funding such as the Technical Assistance Special Fund administered by the Asian Development Bank.
The majority of funds of this type usually only cover capital expenditure, as is the case in the European Union. However, we also flagged in section 3.2.3 that Indonesian municipalities were raising insufficient funding through local taxes to cover operating expenses of waste facilities.
An Indonesian fund could be designed with more flexibility in order to help cover different types of funding gaps in the market.
CHALLENGE Lack of provision in municipal budgets
As described in section 2.3.2.1, the cost of assessing, designing, and implementing an appropriate waste management system is often cited as a reason for inaction. Municipalities have many competing priorities for funding which often means that local government must rely on subsidies from the federal government, as we have seen in the provision of waste to energy.
SOLUTION Close the funding gap using a new technical assistance fund
In the case of the European Union, grant and technical assistance funds were made available to support lower income countries cover the costs of developing waste management provision, as well as funds covering capex costs under the Cohesion Policy.
Several countries used these funds to create national funds which were not only responsible for spending the money, but also to manage waste management programmes overall. There could be a similar role for public finance in Indonesia, where donors from either multilateral or bilateral sources could create a fund to support the development of good waste management provision in the country.

Key challenges and solutions Page 91
Theme 2: Developing supportive frameworks for attracting investments
CHALLENGE Lack of regulatory enforcement
As described in section 2.2.1; all stakeholders who were interviewed, from waste developers to investors, unanimously cited policy and regulatory implementation as core criteria for deciding whether to expand activities and investment in new markets. To international stakeholders, it was often unclear whether national or local institutions were responsible for enforcing laws.
One way that corporations test that regulations are being implemented is by checking whether infringements have been prosecuted and punished.
In Indonesia, there have been high profile cases of prosecutions focused on unlawful exports of waste from other countries into Indonesia. In 2019 for example, Indonesia returned 19 waste containers to the UK, after they were found to contain a combination of rubbish, plastic waste and hazardous materials that did not meet import rules. Indonesian authorities have been seen to ramp up activities in testing incoming waste from other countries and following strict return policies when this waste does not meet regulations.
However, we found no information on cases where Indonesian authorities prosecuted firms for violations on Indonesian soil, such as illegal dumping, which can discourage investors from entering new markets.
SOLUTION Increase enforcement of existing regulations
In section 2.2.1 we showed that investors will look for evidence that organisations that have not met regulations have been prosecuted before making a move to a new market. Any instances of companies or individuals being held to account should be well publicised in order to build investor confidence. Increasing the visibility of such cases of prosecution, so that prospective developers and investors can easily find these examples, will be instrumental. A case study from the UK’s Environmental Agency is provided in section 2.2.1.
RECOMMENDATION
08 Indonesia’s waste regulations and specific responses should be made publicly available and accessible to investors.
The new Waste Management Authority could be given authority and resources to drive enforcement of waste regulation and publish cases of waste offences annually on its website, for investors and others to access.
RECOMMENDATION
09 The UK’s Environment Agency could provide support to Indonesia, sharing its own experience in enforcing and publishing information about waste prosecutions in the UK.
Page 92Key challenges and solutions
161 GIG stakeholder interview 162 GIG stakeholder interviews 163 GIG stakeholder interview
Theme 3: Connecting supply chains
Challenge: Lack of sorting activities is creating uncertainty around the waste feedstock
Since there are no MRFs in operation in Indonesia, we have seen that sorting activities are mostly handled by the informal sector. Household and commercial waste is not sorted at-source and some stakeholders indicated that around 80% of the plastics that are collected are contaminated with organic matter.161 This means that there is no guarantee over the quantity or quality of the feedstock, whether for recycling plants or WTE. Waste companies cannot enter formal contracts with the informal economy and municipalities cannot act as guarantors for the waste.
Uncertainty over waste composition means that waste firms are limited to developing projects with technologies which do not require waste to be sorted. This in part explains the dominance of incineration in Indonesia, with small exceptions in chemical recycling, and is preventing efficient use of waste as resource both in recycling and energy recovery.
In the case of ocean plastics, several stakeholders highlighted that, to date, the third sector has not been able to provide guarantees on the amount of waste collected which could be fed into a WTE plant. This is partly because ocean or river waste collection can dramatically change with the seasons; the prominence of lightweight, soft plastics; unpredictability on the level of degradation or contamination of the waste, as well as organisations not being able to guarantee waste composition.
Solution: Develop a fleet of sorting MRFs alongside pre-planned chemical recycling facilities
Stakeholders suggested that smaller-scale sorting MRFs that feed into larger scale reprocessing MRFs or recycling plants would be a positive step forward in Indonesia. These could be co-located alongside chemical recycling facilities already in development by Plastic Energy in Java, described in section 3.4.
A fleet of sorting and reprocessing MRFs, small and large scale, will provide a varied pipeline of investable propositions for investors, while creating job opportunities that are better distributed cross regions of Indonesia.
The prospect of capturing high and lower value plastic using a combination of mechanical and chemical reprocessing would provide a more integrated recycling solution in the country.
Approaching waste infrastructure in terms of developing a pipeline, including sorting MRFs, reprocessing MRFs and other types of waste management will be most helpful for investors. We saw in section 1.2.3 that investors reported that they look for opportunities to finance multiple projects when considering new markets.
This approach would be particularly effective for linking the informal waste banks to the larger-scale, formal reprocessing plants, where MRFs can play an intermediary role. It may also be more beneficial for lower-income communities where waste collection is still relatively small-scale and where building large-scale infrastructure would not make sense.
Other stakeholders also felt that this approach would reduce the transportation costs of collecting waste, without reducing the economies of scale for making reprocessing MRFs and recycling plants more commercially viable.162
Many stakeholders pointed out that this would allow better and closer connections between waste supply and waste plants, helping reduce supply-related risks. Any plans for infrastructure should account for the regional differences in Indonesia and will require more detailed, place-based analysis. For investors, this would mean building a pipeline of small but replicable waste plants in order to reduce due diligence costs.
Some of the large developers we interviewed described that this model, with numerous and smaller sorting MRFs feeding into a larger-scale reprocessing MRF, had been successful in Hong Kong.
Our interviewees suggested that the private sector could encourage waste banks to work together and aggregate their waste streams, which can be fed into MRFs. Waste banks, as we say in Chapter 2, are a highly successful model for sorting waste in Indonesia. Creating models where these can be more organised and aggregate their waste streams to supply to formal MRFs or recycling plants would be an attractive solution. These types of arrangements can help avoid a single point of failure and creating more certainty for the private sector. Combined with technology solutions mentioned in the previous challenge, the model could be very successful. This could also be supported by a new waste infrastructure authority.

Page 93Key challenges and solutions
164 Circulate Capital 165 GIG stakeholder interview 166 Stemming the tide 167 At COP24 in Katowice, 50 Heads of State adopted the Solidarity and Just Transition Declaration in order to address this. This gives a clear
mission to countries: “considering the social aspect of the transition towards a low-carbon economy is crucial for gaining social approval for the changes taking place”.
RECOMMENDATION
10 Commission a feasibility study to analyse the potential to deploy a fleet of sorting MRFs and larger reprocessing MRFs. Given the scale of the opportunity the first phase of work should focus on the MRF provision around on Java, with a priority on exploring whether sorting MRFs could be co-located with chemical recycling facilities already being planned by UK company, Plastic Energy
This could be supported by the City of London Corporation in the second phase of work for this project.
RECOMMENDATION
11 The Government of Indonesia could build on its previous policy statements and signal to the private sector at a high-level, through political statements and long-term policy targets, that the government will support MRF projects. This is closely linked our recommendations we make around creating a market for recycled plastics, which can be expected to translate into more demand for high quality feedstock and therefore necessitate investment in MRF and sorting infrastructure.
Therefore, increasing the policy focus towards building sorting MRFs, noting that the Government of Indonesia has so far focused on waste to energy, could help unlock this crucial element of the waste journey.
CHALLENGE The private, formal sector is struggling to work with the informal waste economy
Chapter 2 covers in detail the important role that the informal sector and waste pickers play in Indonesia’s waste journey.
Large number of participants in the plastic value chain are members of the informal sector therefore formal contractual relationships are often impossible. Even where a formal entity exists the ongoing sale of material is often subject to continuing goodwill between the buyer and seller and an acceptable price, rather than a written contractual relationship.164
Some stakeholders, including one waste developer, felt that establishing a flexible system where both formal and informal sectors can be a part of the waste value chain would be the best and most easily implemented solution.165
The growth rate in plastic waste will likely exceed any estimates of the growth rate of waste pickers,166 so it is unlikely that waste pickers will have any incentive to start extracting low-residual-value plastics, and unlikely that they will efficiently manage the increase of recyclable plastic waste. As Indonesia scales up its waste management industry, as this report suggests is needed, careful consideration needs to be placed on the future of waste pickers and the informal economy.
This makes the concept of the Just Transition167 very important in Indonesia’s waste agenda. As countries transition to sustainable infrastructure (i.e. infrastructure that meets countries economic growth and development, is low-carbon and climate-resilient). These large-scale transitions in infrastructure, public spending and finance flows creates risks for local workers and communities which could be left behind.

Key challenges and solutions Page 94
One implication is that policy-makers should pay particular attention on the social implications of a sustainable transition – of waste infrastructure and beyond – on the quantity as well as quality of jobs.
Two views on the future of the informal waste economy emerged from our interviews. Noting the immediate need to support the informal economy and waste pickers, and the longer-term imperative to achieve a just transition, we find that both views offer helpful visions:
• Professionalising waste pickers and waste banks: upskilling waste pickers, especially in health and safety, without forcing them to transition to formal jobs. This will be particularly important in the short term.
• Formalising waste pickers: integrating the activities of waste pickers to provide inputs into formal waste plants. This offers insights for a long-term just transition.
SOLUTION Professionalising waste pickers and waste banks
As we saw in section 3.3.3, waste banks are informal community-based establishments for collecting sorted inorganic waste that has economic value.
It was often pointed out that waste pickers see themselves as entrepreneurs or freelance workers, and specifically do not want to become part of a formal employment system. However, previous sections of the report showed that this profession is dangerous, with exposure to sharp or hazardous materials, and often involves children. There is a need to improve conditions for waste pickers, by providing health and safety training, safety equipment and introducing better standards.
One important element of this would be to professionalise waste banks. Interviewees pointed out that as waste banks are an attractive source of income, many families involved young children to take part in waste picking. While they are often hailed as success stories in various reports on waste management in Indonesia, tighter standards should be imposed for waste banks to accept waste. Waste banks could provide training to waste pickers and implement checks to ensure the training and health and safety standards are being respected – either refusing to accept waste that hasn’t been collected according to these guidelines, or offering a lower price for it. Some stakeholders also suggested that schools could be built near waste infrastructure to ensure the children of families working in the informal waste sector are not encouraged to work with them.
This could be jointly developed by the Government of Indonesia, DFIs and third sector organisations with relevant expertise. A new Waste Management Authority would be well placed to deliver this type of programme.
RECOMMENDATION
12 The new Waste Management Authority could be responsible for creating standards and training for informal waste pickers, helping create safer conditions for existing waste pickers.
The Government of Indonesia should ensure it prioritises engagement with the informal economy and the third sector during this process.
RECOMMENDATION
13 The UK’s Health and Safety Executive, which enforces regulation on health and safety for the waste sector (among other sectors of the economy), could provide technical assistance, support and insights to Indonesian stakeholders to develop new standards for the informal economy. This could be facilitated by the City of London Corporation or another UK Government Department.

Page 95Key challenges and solutions
168 Stemming the tide
SOLUTION Formalising waste pickers
While third sector organisations pointed out that there may not be willingness from informal waste workers to work in more formal settings, integrating waste pickers into formal waste plants was consistently highlighted by stakeholders working in waste companies as the preferred option.
Further, waste picking is characterised by low wages and poor working conditions, and many organisations advocate that encouraging the informal waste management sector is not a viable long-term solution.168
As Indonesia sees more waste plants come into operation, be it WTE or MRFs, this growth will create more job opportunities in operations and management. Waste pickers could form an attractive pool of workers for these new plants.
As we set out in section 2.4.5, the benefits of integrating waste pickers into the formal economy include more regular and predictable incomes, higher salaries, pension contributions and helping keep children in school.
RECOMMENDATION
14 Private waste firms could work with civil society, local government and development finance institutions to explore how waste infrastructure projects could create formal jobs for waste pickers, and whether and how they might make the transition into the formal waste economy over the long term.

Key challenges and solutions Page 96
Theme 4: Expanding end markets
CHALLENGE Lack of awareness that waste has value
We saw in section 3.3.3. that there is little awareness among the general population that waste can hold some financial value and is instead seen as a financial burden. This contributes to household behaviours such as dumping and open burning of waste – and means it is likely that a typical household does not put value on paying taxes specifically for MSW management.
The long-term vision for Indonesia, as it has been in all developed countries, is to eventually implement at-source sorting. At-source sorting is the best method for obtaining well separated recyclables, which can be fed directly into reprocessing MRFs, or at least improve the quality of outputs of sorting MRFs.
Gaining public support for the implementation of waste separation at source (waste segregation by households) and the participation of a significant share of citizens in different recycling initiatives requires resources to be designated for extensive communication and awareness programs (paid for by EPR and/or municipal budgets).
When we tested the idea of implementing at-source collection to reduce the need to invest in MRFs, stakeholders pointed out that at-source sorting and segregation has been very challenging to implement in developed markets, with heavy reliance on public education and behaviour change before any hard rules were put in place. Most were not optimistic that at-source sorting was a viable option in the short term but hoped that this would form a part of the government’s long-term pan for waste management.
CHALLENGE Lack of demand for recycled products
We saw in section 3.8.1 that recycled plastics often struggle to compete with virgin plastics, whose prices are tied to oil prices. However, increasing demand for recycled plastics as a result of regulation and corporates adopting voluntary targets is starting the change this market dynamic and is creating a premium for recycled materials. Although these trends have not yet translated into higher values for plastic waste in Indonesia.
SOLUTION Create a market for recycled content through regulation
Policymakers can play a role in creating markets for recycled contents through regulation. We saw in section 3.8.1 that countries have recently started to implement regulations and targets on the amount of recycled content to feature in new packaging.
RECOMMENDATION
15 UK Government Departments, in particular the Department for the Environment, Food and Rural Affairs can provide information on how the UK’s own regulatory changes impacted its own waste management and recycling market, and lessons learnt from that process.
This process could be led by the new Waste Management Authority, which could support Indonesian Government in learning from international examples and consulting with plastic manufacturers in designing new regulations.

Key challenges and solutions Page 97
RECOMMENDATION
16 The Government of Indonesia could reach out to the World Bank and OECD to build on their extensive work on EPR design to support government in implementing EPR policies in its market, with the need to grow demand for recycled contents as a key element to the design.
SOLUTION Create a market for recycled content through taxation and incentives
Another way to build a market for recycled plastic is through Extended Producer Responsibility fees. This system can help create rewards for companies who put easily recyclable and/or recycled packaging on the market. Fees would be lower as the proportion of recycled content increases, helping create competitiveness incentives.
This report does not intend to provide specific advice on designing effective EPR policies. We have given an overview of EPR policies in ASEAN and in the UK in section 2.3.2.5.
Some organisations have published extensive reports on the issue, including:
• Ocean Conservancy and Trash Free Oceans Alliance: Plastics Policy Playbook: Strategies for a Plastic-free Ocean
• World Bank: What a Waste 2.0
• OECD online environmental policy tools and evaluation: https://www.oecd.org/env/tools-evaluation/extendedproducerresponsibility.htm
Packaging material fees could provide an additional source of funding for financing waste management over and above government spending.
RECOMMENDATION
17 The UK Departments and public bodies responsible for designing and running the UK’s EPR policies (Department for Environment, Food and Rural Affairs, Environment Agency and the Environment Exchange) could consider how they can provide support to Indonesian officials in delivering a successful EPR scheme.
SOLUTION Create a market for recycled content through corporate engagement
As explored in section 3.8.1, corporates who purchase or manufacture plastic packaging should also be encouraged to adopt voluntary targets to increase the recyclability of plastic products and increase the recycled content in plastic products.
This should be done in close consultation between public and private sector, ensuring that voluntary targets build on the success of existing frameworks globally which have already been taken up to a large extend by large corporates (such as the Ellen McArthur Foundation’s). Corporates should engage more closely with government to coordinate action across companies; and to support government to take a strategic approach to waste management, including better planning for possible changes in waste feedstock and demand for recycled plastics.

Page 98Key challenges and solutions
169 Circulate Capital
RECOMMENDATION
18 Convene a corporate Taskforce with the firms involved in the manufacturing and use of plastic packaging in Indonesia to identify a set of voluntary and regulatory targets and best practice which could drive private sector action in Indonesia. This could be coordinated by a new Waste Management Authority.
Taskforce members could support the Indonesian government to assess the potential to further develop the domestic market for recycled feedstock.
This Taskforce could also share experience of engaging with consumers to help the Government of Indonesia to support government to consider how it could work to increase public awareness of the important of proper waste management.
RECOMMENDATION
19 The UK’s City of London Corporation and Green Finance Institute could share their experience in setting up and running the UK’s Green Finance Taskforce, which is recognised as a model for managing public-private sector collaboration internationally.
A case study of the Green Finance Taskforce is provided in section 3.8.1.
A note on currency riskCurrency risk was often listed as a key issue in the waste reports we have reviewed, such as Circulate Capital’s report note on foreign exchange risk.169
When we tested this with interviewees from the investment sector, they felt that currency risk was manageable using a number of strategies:
• Making contracts USD denominated, or a mix between USD and local currency (e.g. 75%-25%)
• Recycling revenue made in local currency for other projects in the same country
• Taking out a foreign exchange hedge
• At the point of signing the contract, pegging the local currency to the USD to protect the investor against any devaluation later on
• Working with multilaterals such as the IFC or MIGA to take on some of this risk were also options.
For this reason, we would not consider currency or foreign exchange risk to be a major consideration in financing waste infrastructure in Indonesia.
Page 99
Recommendations for phase 2
We have written this report for City of London Corporation and the Government of Indonesia, in order to provide reflections on Indonesia’s waste management system from an investment perspective. The objective of this work was to set out what is needed to attract more private and international capital into Indonesia’s waste infrastructure – creating economic opportunities for Indonesia as well as investment firms.
While we hope that this report will help policy-makers and waste firms consider what steps are needed to grow the market, more work is needed before projects can begin to appear on the ground.
NEXT STEP 1 Convening a roster of UK experts
The previous chapter highlighted many ways in which UK organisations could support the growth of Indonesia’s waste sector. The City of London Corporation could bring together and coordinate input from key UK experts including the Environment Agency, relevant UK government Departments, the Infrastructure and Projects Authority, the Health and Safety Executive and others with the view to formulate a comprehensive plan of support to deliver technical assistance, focused on policy, regulation, implementation and finance for Indonesia.
NEXT STEP 2 Macroeconomic analysis on the economic opportunity for Indonesia
More economic analysis and modelling is key to inform how waste management can be reformed. Typically, this analysis should make the economic and commercial case for making policy changes, setting out how any costs of developing more waste infrastructure will deliver pay-offs for the broader economy.
This analysis should aim to answer the following questions:
• Can the costs of introducing more rigorous waste sorting processes be recovered, and how would the returns on investment be distributed among government and private sector, and over what timeframes?
• What model of infrastructure development is best suited to Indonesia (e.g. which technologies, large vs small scale)?
• What are typical timeframes and costs to develop different types of waste management infrastructure solutions in Indonesia?
• Can the wider benefits/avoided costs from improved waste management be modelled and estimated, for example recued health impacts, land availability, increased tourism, better fishing industry etc?
This analysis could help to inform more specific work on WTE, anaerobic digestion and recycling, which will be needed to inform future policy and make the case for public and private investment.
NEXT STEP 3 Economic study for sorting MRFs in Indonesia
Our interviews with stakeholders highlighted that MRF infrastructure (i.e. sorting activities) would be essential in order to create appropriate feedstocks for traditional recycling plants. This idea should be further tested, possibly bringing in expertise in economic analysis and engineering.
Some questions which could be asked of this study might include:
• What impact would sorting MRFs have on Indonesian waste management, and recycling in particular?
• How many sorting MRFs, or what overall MRF capacity would be needed to tackle Indonesia's waste?

Page 100
• What is the likely investment required to meet this capacity need, including in terms of capex and opex?
• Are there opportunities to capture economies of scale?
• Which sorting technologies would be best suited for Indonesia?
• Which companies in Indonesia could help with the development, building and operations of MRFs in Indonesia?
• How can sorting MRFs make links between the formal and informal sectors?
• What policy and regulatory levers would be needed – and more broadly what is the role of national and municipal actors?
• What support could DFIs provide to kick-start this market?
NEXT STEP 4 Convene an advisory group of waste stakeholders to progress the design and delivery of a new Waste Management Authority
Convene a group of stakeholders to discuss and design the Waste Management Authority idea and support the Government Indonesia to progress this idea.
In the complex area of financing infrastructure, it is important to ensure policy-makers can access experience and expertise from a broad range of specialist firms, both national and international.
The UK has used this model in a number of areas, such as green finance and financing carbon capture and storage technologies, with great success.
NEXT STEP 5 Further analysis on organic waste treatment
We saw earlier in this report that Indonesia’s waste is largely organic. Although the proportion of plastics is expected to increase as Indonesia continues to develop, we recommend carrying out similar analysis to that provided in this report on organic waste management.
Organic waste and the potential for anaerobic digestion, composting and other recovery technologies could be a great opportunity for Indonesia. Organic waste is closely linked to MSW, but also to Indonesia’s agriculture industry, including palm oil, which generates important amounts of organic waste each year.
Poorly managed organic waste is a major contributor to methane and carbon emissions in the waste sector. Opportunities to capture landfill gas from existing landfills in Indonesia could also be explored.
The UK would be well placed to lend expertise in this area, having significantly reduced the amount of food waste going to landfill.

Page 101
Disclaimer
1. Nature of information in this document
Green Investment Group Limited (together with its affiliates, funds managed by its affiliates and its and their respective employees, directors, officers, successors, representatives and agents, “GIG”) makes no representation or warranty as to the accuracy or completeness of the information contained in this document, and take no responsibility under any circumstances for any loss or damage suffered as a result of any omission, inadequacy or inaccuracy in this document. The information in this document is subject to change at any time, and GIG has no duty to provide you with notice of such changes and assumes no obligation to update or otherwise revise this document for any reason.
2. Interpretation of contents of this document
To the extent this document include estimates and forecasts as to future financial, operational or economic performance, GIG has assumed that such estimates and forecasts have been reasonably prepared on bases reflecting the best currently available estimates and judgments of the source of such information. Additionally, future results are impossible to predict, and past performance is not necessarily indicative of future performance. Recipients of this document should understand that statements regarding future prospects of instruments, securities or transactions may not be realised. Opinions and estimates offered in this document constitute the judgement of non-research employees of GIG and are subject to change without notice, as are statements about market trends, which are based on current market conditions and numerous economic factors. This document includes forward-looking statements that represent opinions, expectations, beliefs, intentions, estimates or strategies regarding the future, which may not be realised. These statements may be identified by the use of words like “anticipate,” “believe,” “estimate,” “expect,” “intend,” “may,” “plan,” “will,” “should,” “seek,” and similar expressions. These forward-looking statements reflect views and assumptions as of the date of this document and are subject to risks and uncertainties. Actual results and trends in the future are likely to vary from such forward-looking statements due to various factors that are beyond our ability to control or predict, and such variations could be material. Given these uncertainties, you should not place reliance on the forward-looking statements or any other aspect of this document. GIG does not undertake any obligation to update or revise any forward-looking statements, whether as a result of new information, future events or otherwise. The information and data contained in this document are not a substitute for your independent evaluation and analysis.
The contents of this document, including the use of statements such as we "recommend", "suggest", "consider", "conclude" or similar expressions in this document (and in any other related document or other communication or statement by any GIG Party at any time in connection with its subject matter) are not, and are not intended to be or to be interpreted as, financial advice by any GIG Party as to the merits or otherwise of any investment or any investment decision by any person or entity: they shall be read and construed in all cases as representing solely a strategic or technical opinion as to the impact that any decision or action may have on the environmental, social, climate or other green or sustainability objectives of that person or entity.
3. Purpose, distribution and use of this document
This document does not constitute an offer to sell or a solicitation of an offer to buy any securities or to participate in any transaction. It is an outline of matters for discussion only. Any person receiving this document and wishing to affect a transaction contemplated hereby, must do so in accordance with applicable law. This document is not intended for distribution to, or use by, any person or entity in any location where such distribution or use would be contrary to law or regulation, or which would subject GIG to any registration requirement or similar regulation or governmental requirement within such location. Any transaction implementing any proposal discussed in this document shall be exclusively upon the terms and subject to the conditions set out in the definitive transaction agreements. Any proposal or offer would be conditional upon, amongst other things, GIG obtaining internal approvals and external approvals and detailed legal, taxation and accounting advice.
4. Scope, nature and currency of source data and information
This document contains selected information and does not purport to be all-inclusive or to contain all of the information that may be relevant to any transaction contemplated hereby. GIG has prepared this document on the basis of information which is publicly available, and sources believed to be reliable. In preparing these materials, GIG has relied upon and assumed, without independent investigation or verification, the accuracy and completeness of all such information. Without limiting the generality of the foregoing, no audit or review has been undertaken by an independent third party of the financial assumptions, data, results, calculations and forecasts contained in, presented or referred to in this document. Recipient acknowledges that circumstances may change, and the contents of this document may become outdated as a result.
5. GIG role and relationship with recipients
GIG is not an adviser as to legal, regulatory, tax, or accounting advice, including with respect to any disclosure requirements under the securities laws of any jurisdiction. You should conduct your own independent investigation and assessment as to the validity of the information contained in this document and the economic, financial, regulatory, legal, tax, investment and accounting implications of such information. Any statements contained herein as to tax matters may not be used by any taxpayer for the purpose of avoiding tax penalties that may be imposed on such taxpayer. By receiving this document, the recipient acknowledges that neither it nor GIG intends that GIG acts or is responsible as a fiduciary to the recipient, its management, stockholders, creditors or any other person. The recipient and GIG, by receiving and providing this Report respectively, expressly disclaims any fiduciary relationship and agrees that the recipient is responsible for making its own independent judgments with respect to any transaction and any other matters regarding this document.
6. Non-application of regulatory or other guarantees of GIG obligations
Green Investment Group Limited is not authorised or regulated by the Financial Conduct Authority or the Prudential Regulatory Authority or any equivalent regulatory authorities in any other jurisdiction. Green Investment Group Limited is not an authorised deposit-taking institution for the purposes of the Banking Act 1959 (Commonwealth of Australia), nor do its obligations represent deposits or other liabilities of Macquarie Bank Limited ABN 46 008 583 542. Macquarie Bank Limited does not guarantee or otherwise provide assurance in respect of the obligations of Green Investment Group Limited.

Page 102
7. Terms of GIG client relationships
GIG has prepared this document for the exclusive use of the person with whom GIG has contracted to produce it (together with its subsidiaries and affiliates, the “Client”). This document has been prepared on the basis of the scope of work and subject to the terms and conditions set out or referred to in the terms of engagement agreed between GIG and the Client (the “Terms of Engagement”). The Terms of Engagement accordingly apply in full to the provision, receipt and use of this document. All recipients receive and use this document on condition that in the event of any inconsistency between any Terms of Engagement or any other agreement or understanding between any GIG Party and any person, the terms of this Notice and disclaimer will prevail.
8. Limitations on liability of GIG parties
Unless GIG has expressly agreed otherwise in the Terms of Engagement, neither GIG nor any of its subsidiaries, holding companies (if any), joint ventures or affiliates (the “GIG Group”) nor any of the directors, officers, employees, consultants, shareholders, sub-contractors or advisers of any member of the GIG Group (each of the foregoing being a “GIG Party”) shall have or assume any liability whatsoever (whether direct or indirect and whether arising in contract, in tort or otherwise) to the Client or any other person receiving this document (each a “Recipient”), including any of their affiliated companies, for or in connection with, and no claim shall be made by the Recipient or any other person in relation to, the provision, receipt or use of this document or any of its contents or any error or inaccuracy in this document. The provisions of this paragraph 8 are in addition to and supplement (and shall not be limited or impaired in any way by) the terms of any other paragraph or statement in this notice or elsewhere in this report.
9. Exclusion of any legal or other contractual or other relationship with other Recipients
Unless GIG has expressly agreed otherwise in the Terms of Engagement: the disclosure to, or receipt by, any person of this document shall not give rise to any legal or contractual relationship between any GIG Party and such person, nor shall it give rise to any duty or assumption of responsibility in favour of such person; no representation or warranty, express or implied, is made to any Recipient as to the accuracy, completeness or correctness of the information contained in this document; no Recipient may rely upon the content of this document and any use of this document by such Recipient shall be at its own risk; and no GIG Party shall be liable to any Recipient in relation to such use or reliance.
10. Intellectual property rights of GIG
All rights are reserved by GIG which, together with its relevant licensors, shall remain the exclusive owners of all intellectual property rights of whatsoever nature subsisting in (1) this document, (2) any other document or materials provided by any GIG Party in connection with the evaluation of green impact and/or the preparation of this document, (3) any systems, methodologies, software, algorithms or outputs used produced or developed by or for GIG in connection with this document or any of its contents, and (4) otherwise made available for use by any person in connection with this document.
11. Restrictions on use, reproduction, publication, disclosure or reliance on all or any part of document
This document must not be published or reproduced by any person without the prior written consent of GIG. Neither the Recipient of this document nor any other person may in any way alter, modify or change this document without the prior written consent of GIG. In particular, without limitation, the Recipient (and any other person in receipt of this document) may only use or disclose this document in its original, whole and complete format and shall not summarise, dissect or in any way use or display only part of this document without the prior written consent of GIG.
Neither the Recipient nor any other person may disclose, publish or reproduce this document in any manner which is misleading or which impairs the relevant data being disclosed, published or reproduced or in any manner which creates a false impression as to the origin or value of the information or which has an adverse impact upon GIG’s reputation as a provider of the relevant services.
Unless GIG has expressly agreed otherwise in the Terms of Engagement, this document is not for use by the Recipient or any other person for any purpose, including in: a) evaluating specific technical or scientific aspects of relevant projects; b) carrying out financial, commercial, economic or investment-related due diligence in relation to the Recipient or any other person, any financial instruments issued, or to be issued, by the Recipient or any other person, or relevant project(s) or transactions; c) providing investment or financial advice, making investment decisions or recommendations or evaluating financial performance of any person or financial instrument; d) valuing financial instruments; e) verifying the accuracy or completeness of any information, data, documents or representations provided to GIG by the Issuer by any third party; f) verifying the accuracy or completeness of any publicly available information, data, documents or representations; or g) providing or obtaining advice on legal, regulatory, environmental, accounting or taxation matters. To the extent permitted by law, no GIG Party shall be liable to the Recipient or any third party for any losses suffered in connection with such use.
12. Governing law and jurisdiction
This document (including the appendices) and any dispute or claim (including non-contractual disputes or claims) arising out of or in connection with it or its subject matter or use shall be governed by and construed in accordance with the laws of England, with the courts of England having exclusive jurisdiction over any such dispute or claim.
Copyright © Green Investment Group Limited 2020

Page 103
Contacts
Gavin TempletonHead of Sustainable Finance
T: +44 131 656 4464
M: +44 7826 534 290
Raphaëlle ValletSustainable Finance Manager
T: +44 131 656 4447
M: +44 7464 513 206
greeninvestmentgroup.com