Financing strategies to achieve the MDGs in Latin America ... · Financing strategies to achieve...
40
Financing strategies Financing strategies to achieve the to achieve the MDGs MDGs in in Latin America and the Caribbean Latin America and the Caribbean Rob Vos (UN-DESA/DPAD) Presentation prepared for the inception and training workshop of the project “Assessing Development Strategies to Achieve the MDGs in Asia and the Pacific, Bangkok, 20-22 August, 2008. UNDP UN-DESA UN-ESCAP
Transcript of Financing strategies to achieve the MDGs in Latin America ... · Financing strategies to achieve...

Financing strategiesFinancing strategiesto achieve the to achieve the MDGsMDGs inin
Latin America and the CaribbeanLatin America and the Caribbean
Rob Vos
(UN-DESA/DPAD)
Presentation prepared for the inception and training workshop ofthe project “Assessing Development Strategies to Achieve the MDGs in Asia and the Pacific, Bangkok, 20-22 August, 2008.
UNDP UN-DESA UN-ESCAP
IntroductionIntroductionIs Latin America Is Latin America ““on trackon track”” to achieve the to achieve the MDGsMDGs? ? Can the Can the MDGsMDGs be achieved through be achieved through adjusted policies? adjusted policies? How much additional public spending will How much additional public spending will be needed and how can this be financed?be needed and how can this be financed?Which tradeWhich trade--offs need to be taken into offs need to be taken into account when identifying a preferred account when identifying a preferred financing strategy? financing strategy?

Is Latin America on track?Is Latin America on track?
10
87
54
187
68
9
97
31
192
77
8
100
21
195
84
5
100
18
47
84
0 50 100 150 200 250
MDG1: Extreme poverty (% livingon less than $1 a day)
MDG2: Primary education (netenrolment rate)
MDG4: Child mortality (underfive deaths per 1,000 live births)
MDG5: Maternal mortality (per100,000 live births) \a
MDG7: People using improvedsanitation (% of total)
19902005Projection (linear) to 2015Target 2015
probably "on track"
"on track"
"on track"
"off track"
"off track"

Really now, is LAC Really now, is LAC ““on trackon track””??The Millennium Development Goals Report The Millennium Development Goals Report 2007 (UN)2007 (UN): : –– LAC is LAC is on trackon track to achieve to achieve
universal primary education, universal primary education, reduced child mortality, reduced child mortality, improved access to water and sanitation; improved access to water and sanitation;
–– LAC is LAC is off trackoff track to achieve to achieve poverty reduction,poverty reduction,reduced maternal mortalityreduced maternal mortality
Problematic concept: linear projectionProblematic concept: linear projectionInstead: modelInstead: model--based based ““businessbusiness--asas--usualusual””(BAU) scenario, taking into account economy(BAU) scenario, taking into account economy--wide tradewide trade--offs and a continuation of current offs and a continuation of current policiespolicies

Some key questions Some key questions regarding MDG strategiesregarding MDG strategies
What does it take to achieve the What does it take to achieve the MDGsMDGs? ? –– What are MDG determinants?What are MDG determinants?–– How would MDG achievement influence other aspects How would MDG achievement influence other aspects
of economic and social development?of economic and social development?Do we know how much it will cost and can we Do we know how much it will cost and can we afford achieving the goals?afford achieving the goals?What policy options do we have in financing the What policy options do we have in financing the MDG strategy? What are the trade offs when:MDG strategy? What are the trade offs when:–– Scaling up aid or borrowing abroad?Scaling up aid or borrowing abroad?–– Enhancing domestic resource mobilization?Enhancing domestic resource mobilization?

UN/DESAUN/DESA--UNDPUNDP--UN/ESCAPUN/ESCAPPublic policies for Public policies for MDGsMDGs projectprojectMAMS: MAMS: MaquetteMaquette for MDG Simulations.for MDG Simulations.–– EconomyEconomy--wide (dynamic CGE) simulation model to analyze MDG wide (dynamic CGE) simulation model to analyze MDG
strategies in different countries.strategies in different countries.–– Dynamic MDG moduleDynamic MDG module
Sector analysis of MDG determinants and of Sector analysis of MDG determinants and of interventionsinterventions needed to achieve needed to achieve MDGsMDGs in education, in education, health, water and sanitationhealth, water and sanitation–– Microeconomic analysis of determinants of access to schooling, Microeconomic analysis of determinants of access to schooling,
infant mortality, etc.infant mortality, etc.–– Costing exercise, considering household Costing exercise, considering household behaviourbehaviour
MicrosimulationMicrosimulation methodologymethodology–– Translate Translate labourlabour market outcomes of CGE simulations into impact market outcomes of CGE simulations into impact
on poverty and income distribution at household level using micron poverty and income distribution at household level using micro o datasetsdatasets

MacroMacro--micromicro linkageslinkagesCGE Model Micro-
simulations
MacroeconomicEnvironment
and Economic Structure
Structural features, InfrastructureFinancing constraintsGeneral equilibrium effects
Factor markets
Factor marketsSegmentation and factor mobilityWage determinationEmployment, productivityDistribution of factor income
HouseholdsHousehold characteristics:
Physical and human capitalDemographic compositionPreferencesAccess to markets
Povertyand
inequality
MDG achievement
DynamicMDG
determinants and costing
Required public
investment for MDGs
(MAMSMAMS)

MDG determinantsMDG determinantsWhat is needed to get all children in school and make What is needed to get all children in school and make them complete all grades?them complete all grades?–– Build more school infrastructure?Build more school infrastructure?–– Improve quality of other school inputs (teachers, textbook supplImprove quality of other school inputs (teachers, textbook supplies)?ies)?–– Increase access to school by improved household income and demanIncrease access to school by improved household income and demand d
subsidies?subsidies?–– All of the above?All of the above?What is needed to reduce child mortality?What is needed to reduce child mortality?–– Better nutrition?Better nutrition?–– Expansion of immunization programs?Expansion of immunization programs?–– Improving maternalImproving maternal--child health facilities?child health facilities?–– Better education?Better education?–– All of the above?All of the above?Are there synergies across the Are there synergies across the MDGsMDGs??What is the direct cost of interventions to achieve What is the direct cost of interventions to achieve MDGsMDGs??Are there diminishing marginal returns to the inputs?Are there diminishing marginal returns to the inputs?

MAMS: Determinants of MDG MAMS: Determinants of MDG outcomesoutcomes
4XXXX2–Primary schooling
7a,7bXXX4-Under-fivemortality
7a,7bXXX5-Maternal mortality
XXX7a-Water
XXX7b-Sanitation
Other MDGs
Public infra-
structure
Wageincen-tives
Consump-tion percapita
Serviceper capita or studentMDG

Macroeconomic influences on Macroeconomic influences on cost estimatescost estimates
Synergies among Synergies among MDGsMDGs: is achieving all : is achieving all MDGsMDGs simultaneously cheaper than simultaneously cheaper than pursuing them one by one?pursuing them one by one?Complementary investment requirements, Complementary investment requirements, especially in infrastructureespecially in infrastructureMacro analysis: economyMacro analysis: economy--wide effects wide effects matter for the (relative) cost estimates matter for the (relative) cost estimates ((labourlabour costs and constraints, prices, costs and constraints, prices, growth effects) growth effects)

MDG MDG simulationssimulationsBAU: BAU: projectionprojection withoutwithout policypolicy changechangeMDG MDG scenariosscenarios::–– OptimizeOptimize toto reachreach MDGsMDGs
EachEach MDG MDG separatelyseparatelySimultaneouslySimultaneously
–– DifferentDifferent financingfinancing strategiesstrategiesForeignForeign aidaidForeignForeign borrowingborrowingDomesticDomestic borrowingborrowingTaxTax increasesincreases

Ecuador: Ecuador: ProgressProgress towardstowards MDGsMDGs
0.0 20.0 40.0 60.0 80.0 100.0
MDG 1 Extreme poverty
MDG 2 Primary schoolcompletion
MDG 3 Child mortality
MDG 4 Maternal mortality
MDG 7a Drinking watersupply
MDG 7b Sanitation
2001 2005 BAU 2015 Target 2015

Is LAC Is LAC ““on trackon track”” under BAU?under BAU?
√√√LAC √√--Uruguay
--√Peru
Paraguay
Nicaragua √√√√Mexico
√Jamaica
Honduras √Guatemala
√El Salvador
√Ecuador √√
Dominican Republic
√√√√√Cuba √√√Costa Rica √√√Colombia √√√√√√Chile √√--√Brazil
--Bolivia --Argentina
MDG 7bMDG 7aMDG 5MDG 4MDG 2MDG 1
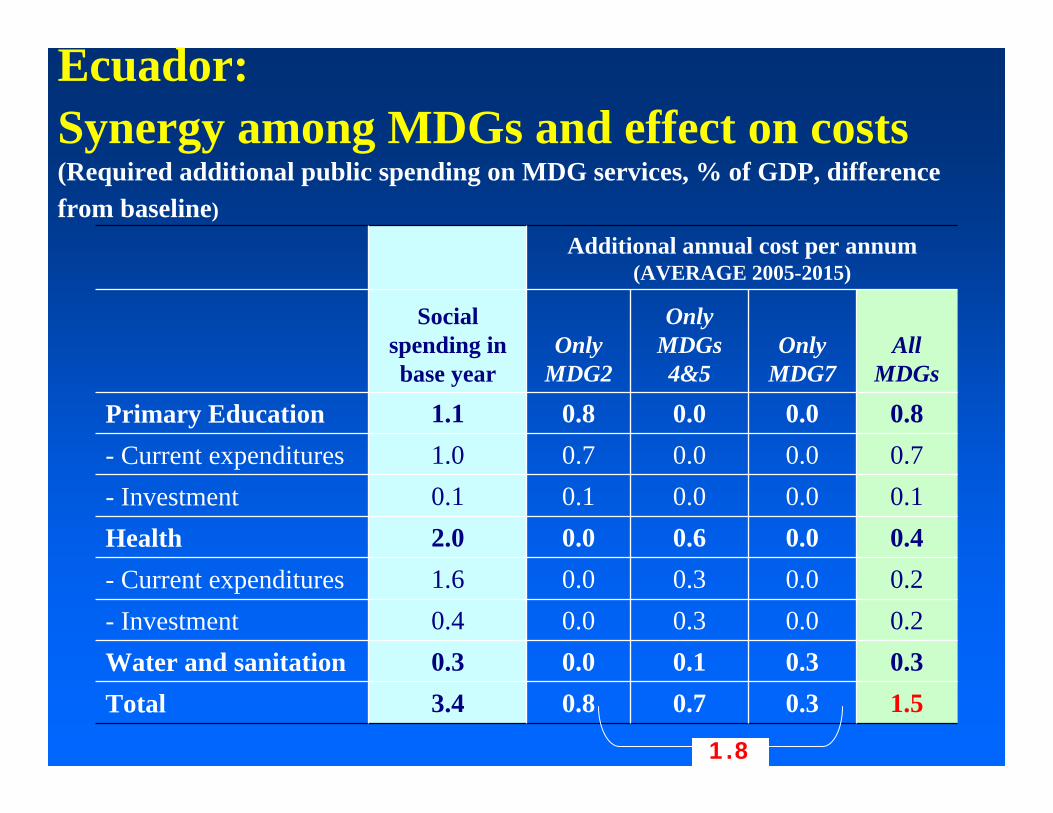
Ecuador:Synergy among MDGs and effect on costs(Required additional public spending on MDG services, % of GDP, differencefrom baseline)
1.50.30.70.83.4Total0.30.30.10.00.3Water and sanitation0.20.00.30.00.4- Investment0.20.00.30.01.6- Current expenditures0.40.00.60.02.0Health0.10.00.00.10.1- Investment0.70.00.00.71.0- Current expenditures0.80.00.00.81.1Primary Education
AllMDGs
OnlyMDG7
OnlyMDGs4&5
OnlyMDG2
Social spending in base year
Additional annual cost per annum(AVERAGE 2005-2015)
1.8

… but there are increasing marginal costs(Required additional public spending on MDG services, % of GDP, difference frombaseline)
2.70.51.71.23.4Total0.50.50.10.00.3Water and sanitation0.40.00.70.00.4- Investment0.60.00.90.01.6- Current expenditures1.00.01.60.02.0Health0.00.00.00.00.1- Investment1.10.00.01.21.0- Current expenditures1.10.00.01.21.1Primary Education
AllMDGs
OnlyMDG7
OnlyMDGs4&5
OnlyMDG2
Social spending in base year
Additional annual cost per annum(END OF PERIOD 2010-2015)
3.4
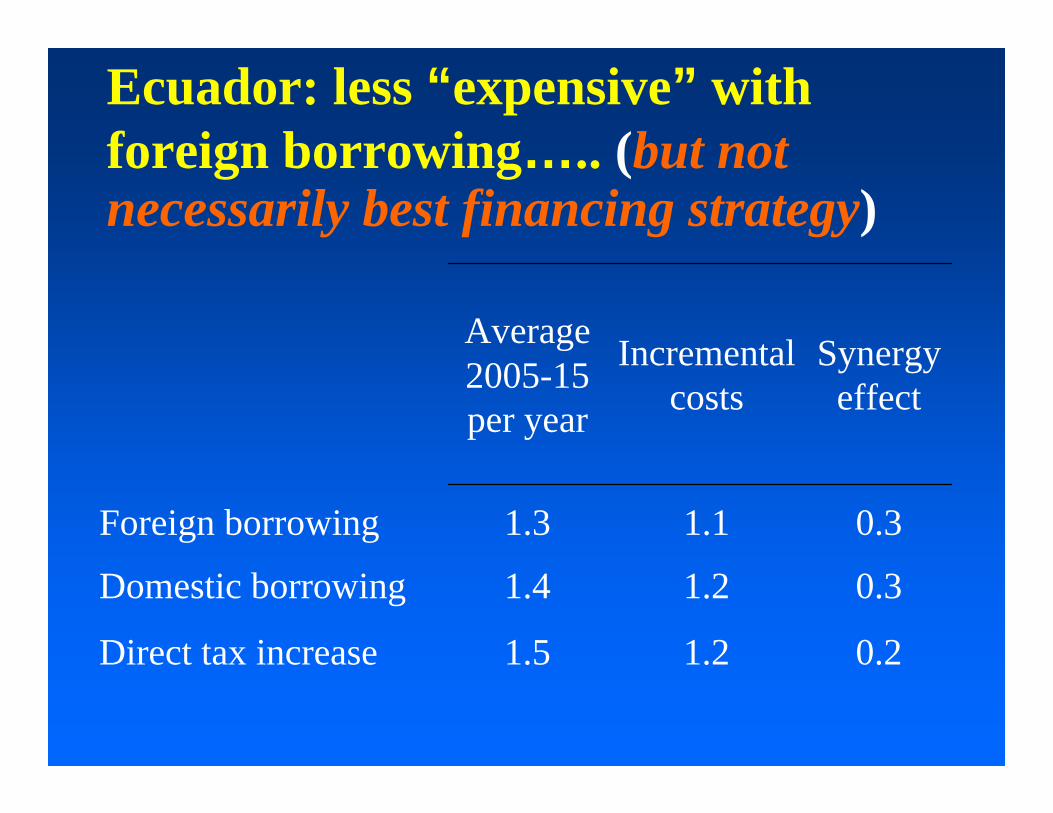
Ecuador: less “expensive” with foreign borrowing….. (but not necessarily best financing strategy)
0.21.21.5Direct tax increase
0.31.21.4Domestic borrowing
0.31.11.3Foreign borrowing
Synergyeffect
Incremental costs
Average2005-15 per year
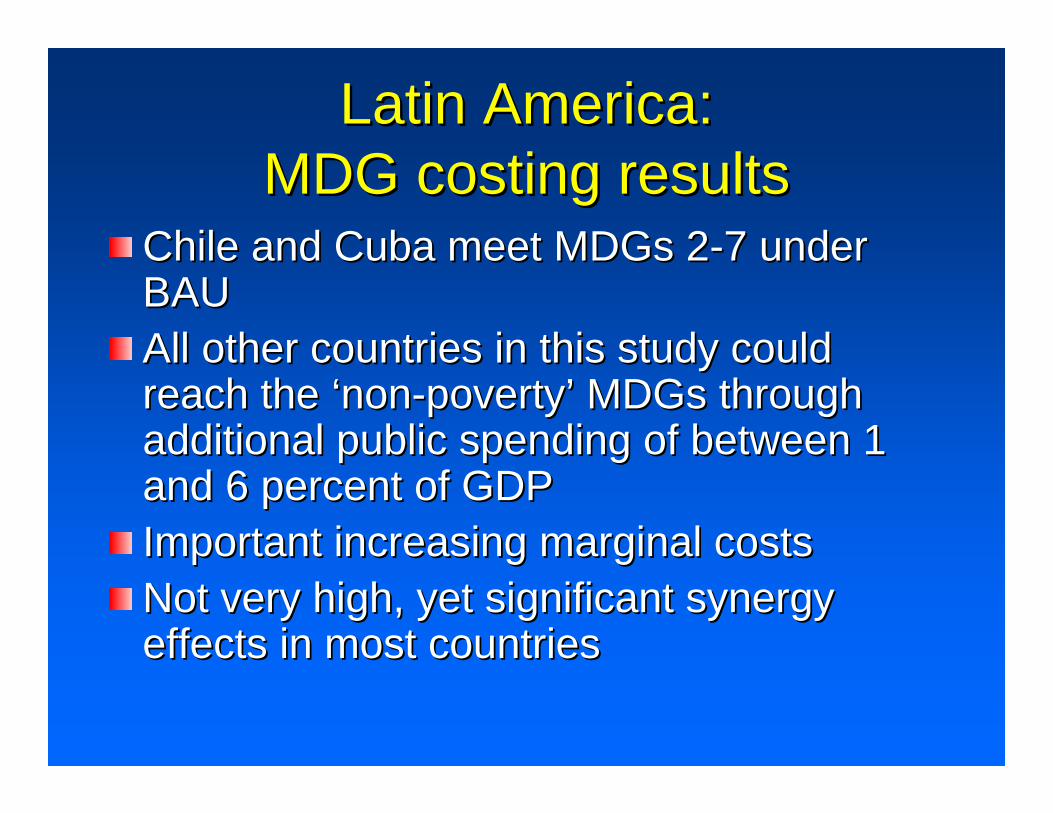
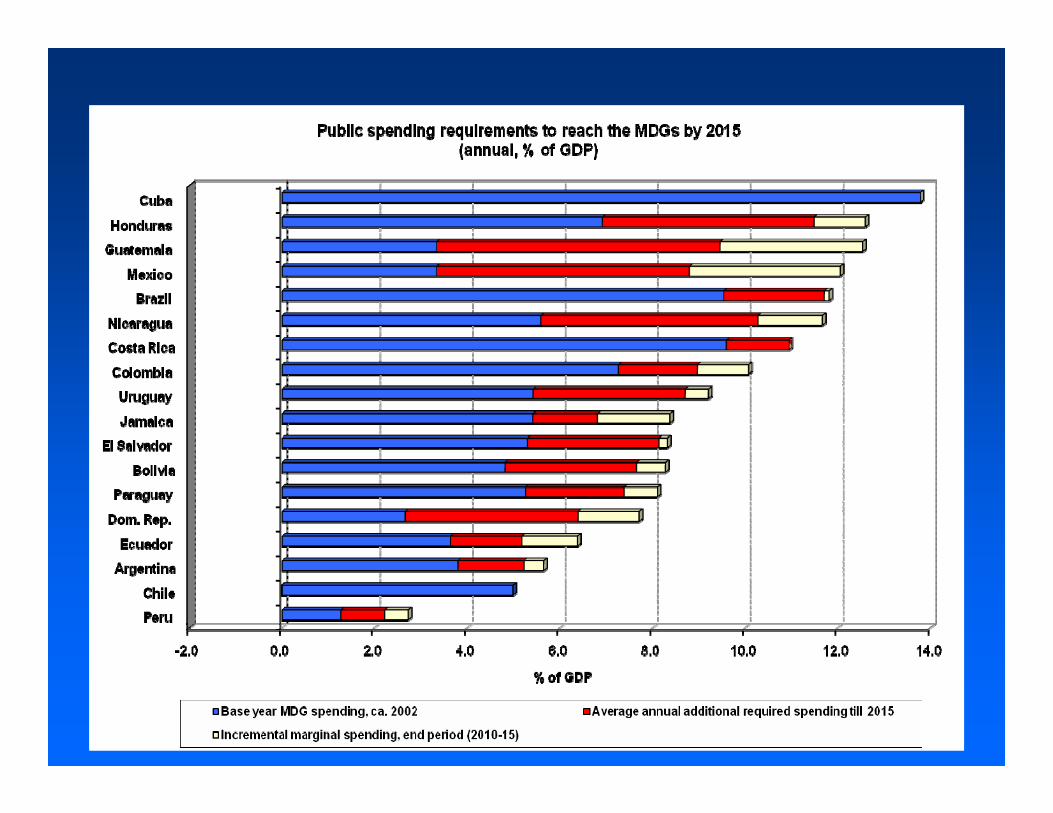
Latin America: Latin America: MDG costing resultsMDG costing results
Chile and Cuba meet Chile and Cuba meet MDGsMDGs 22--7 under 7 under BAUBAUAll other countries in this study could All other countries in this study could reach the reach the ‘‘nonnon--povertypoverty’’ MDGsMDGs through through additional public spending of between 1 additional public spending of between 1 and 6 percent of GDPand 6 percent of GDPImportant increasing marginal costsImportant increasing marginal costsNot very high, yet significant synergy Not very high, yet significant synergy effects in most countrieseffects in most countries

Financing strategies and MDG Financing strategies and MDG costing resultscosting results
Additional spending requirements are Additional spending requirements are generally lower in the case of external generally lower in the case of external finance finance -- through aid or foreign borrowing through aid or foreign borrowing –– than in case of domestic resource than in case of domestic resource mobilizationmobilizationAdditional spending requirements are Additional spending requirements are higher in the case of domestic finance higher in the case of domestic finance --through borrowing or taxation through borrowing or taxation -- owing to owing to crowding out effects and consumption crowding out effects and consumption compressioncompression

What are realistic financing What are realistic financing options?options?
Required additional public spending is just Required additional public spending is just one criterion for assessing desirability of a one criterion for assessing desirability of a financing strategyfinancing strategyOther criteria: Other criteria: –– SustainabilitySustainability–– Macroeconomic tradeMacroeconomic trade--offsoffs–– Institutional constraints and political economy Institutional constraints and political economy
considerationsconsiderationsModels only analyze pure (singleModels only analyze pure (single--source) source) financing strategies, but mixed strategies financing strategies, but mixed strategies may be preferablemay be preferable

MacroeconomicMacroeconomic tradetrade--offsoffsMore More publicpublic spendingspending couldcould generategenerate RER RER appreciationappreciation: : DutchDutch diseasedisease effectseffects??CrowdingCrowding out out ofof privateprivate investmentinvestment becausebecauseofof increasedincreased publicpublic domesticdomestic borrowingborrowingTaxTax increaseincrease couldcould affectaffect real real disposabledisposablehouseholdhousehold incomeincomeLabourLabour marketmarket adjustmentadjustment: : SkilledSkilled labourlabourshortageshortage? No ? No labourlabour shortageshortage, , butbut wagewagepressurespressures??

Ecuador: Ecuador: strongstrong RER RER appreciationappreciationwithwith foreignforeign borrowingborrowing
0.9
0.92
0.94
0.96
0.98
1
2001 2002 2003 2004 2005 2006 2007 2008 2009 2010 2011 2012 2013 2014 2015
BAU Foreign borrowing Taxes Domestic Borrowing
Real exchange rate(index)

Ecuador: Ecuador: LowerLower exportexport growthgrowthunderunder MDG MDG strategystrategy
5,000
6,000
7,000
8,000
9,000
10,000
2001
2002
2003
2004
2005
2006
2007
2008
2009
2010
2011
2012
2013
2014
2015
BAU Foreign borrowing Taxes Domestic Borrowing
Export volume($ mln)

LAC: MDG financing and LAC: MDG financing and erosion of exportserosion of exports
NIC
GTM
HND
Foreign borrowingForeign grant aidTaxes
ARG
BOL
BRA COL
CRI
DOM
ECU
SLV
JAM
MEX
PRYPER
URY
-11.5
-9.5
-7.5
-5.5
-3.5
-1.5
0.5
-11.5 -9.5 -7.5 -5.5 -3.5 -1.5 0.5
Annual average difference RER index (base year = 100)
Ann
ual a
vera
ge d
iffer
ence
in e
xpor
t-to-
GD
P ra
tio

Ecuador: Ecuador: crowdingcrowding out out ofof privateprivateinvestmentinvestment strongeststrongest underunder domesticdomesticborrowingborrowing scenarioscenario
3,000
4,000
5,000
6,000
7,000
2001
2002
2003
2004
2005
2006
2007
2008
2009
2010
2011
2012
2013
2014
2015
BAU Foreign borrowing Taxes Domestic Borrowing
Private investment(volume, $ mln)

Ecuador: Ecuador: alsoalso GDP GDP growthgrowth lessless underunderdomesticdomestic borrowingborrowing scenarioscenario
17,000
22,000
27,000
32,000
2001
2002
2003
2004
2005
2006
2007
2008
2009
2010
2011
2012
2013
2014
2015
BAU Foreign borrowing Taxes Domestic Borrowing
Real GDP (mln $)

……. but domestic debt would . but domestic debt would increase to unsustainable levelsincrease to unsustainable levels
5
10
15
20
25
30
2001 2002 2003 2004 2005 2006 2007 2008 2009 2010 2011 2012 2013 2014 2015
BAU Foreign borrowing Taxes Domestic borrowing
Domestic public debt(% GDP)
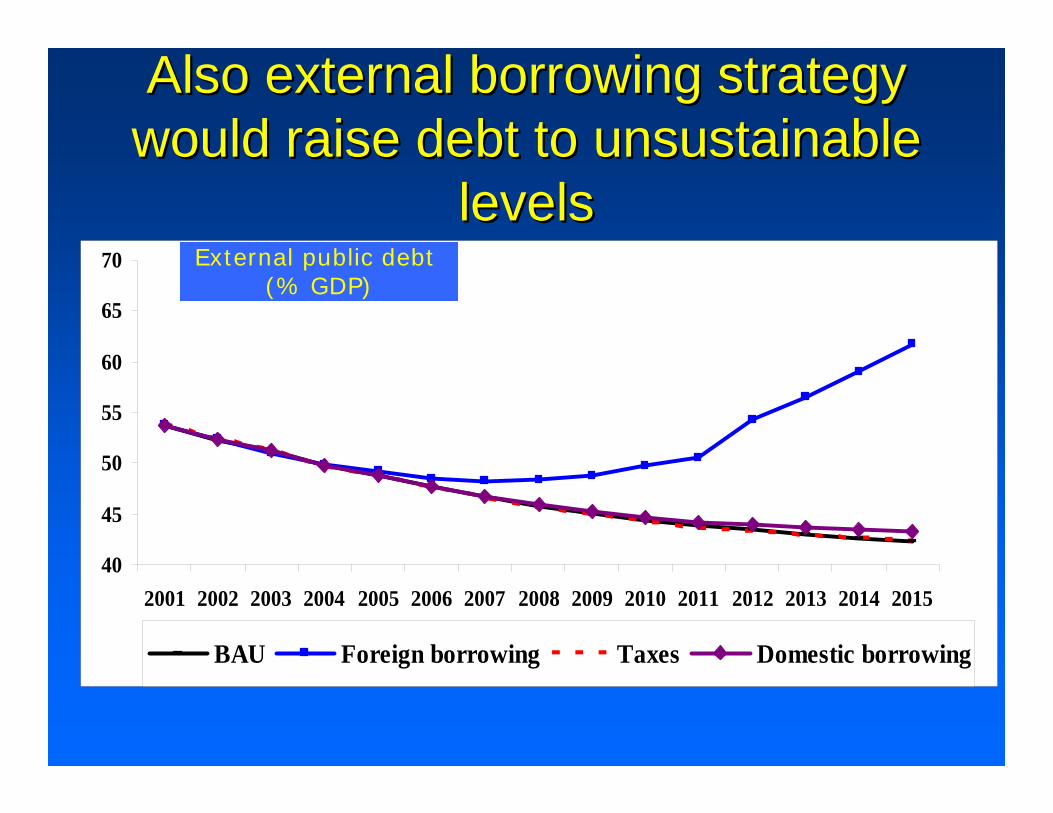
AlsoAlso externalexternal borrowingborrowing strategystrategywouldwould raiseraise debtdebt toto unsustainableunsustainable
levelslevels
40
45
50
55
60
65
70
2001 2002 2003 2004 2005 2006 2007 2008 2009 2010 2011 2012 2013 2014 2015
BAU Foreign borrowing Taxes Domestic borrowing
External public debt(% GDP)

Ecuador: Ecuador: directdirect taxtax burdenburden wouldwould havehavetoto increaseincrease fromfrom 1.5 a 4.6 % 1.5 a 4.6 % ofof GDPGDP
0
1
2
3
4
5
2002 2003 2004 2005 2006 2007 2008 2009 2010 2011 2012 2013 2014 2015
BAU Foreign borrowing Taxes Domestic borrowing
Direct taxes(% GDP)

LAC: LAC: ““FeasibleFeasible”” financing optionsfinancing options
√Uruguay √√√Peru
√Paraguay √Nicaragua
√Mexico √Guatemala √Jamaica
√Honduras
√El Salvador √Ecuador
√Dominican R √√√Costa Rica
√Colombia √Brazil
√Bolivia √Argentina
Tax increaseForeign aidTax increase with public
expenditure reform and other
Tax increase combined with
foreign borrowing
Tax increase combined
with foreign aid

TradeTrade--offs and MDG 1offs and MDG 1
MAMS does not provide for an explicit MAMS does not provide for an explicit MDGMDG--1 strategy 1 strategy Changes in extreme poverty are modelled as Changes in extreme poverty are modelled as results of the other MDG strategies and results of the other MDG strategies and related traderelated trade--offs, in combination with offs, in combination with microsimulationmicrosimulation methodology using CGE methodology using CGE outcomes for labour market and labour outcomes for labour market and labour supply compositionsupply composition

Ecuador: MDG Ecuador: MDG strategystrategy increasesincreasessupplysupply ofof skilledskilled labourlabour
0
1000
2000
3000
4000
5000
2001 2003 2005 2007 2009 2011 2013 2015
Labour supply(thousands)
Unskilled(primary or less)
Semi-skilled(secundary)
Skilled (tertiary)

Ecuador: Ecuador: fallingfalling wagewage gapsgaps
0
2
4
6
8
10
2001 2003 2005 2007 2009 2011 2013 2015
Real wage per worker(thousands of $)
Unskilled(primary or less)
Semi-skilled(secondary)
Skilled (tertiary)

…….but not good enough to meet .but not good enough to meet poverty reduction target poverty reduction target
0
5
10
15
2002 2005 2010 2015
BAU Taxes Domestic borrowing Fofreign borrowing
Target
EcuadorMDG1: Extreme povertyincidence ($1 per day)
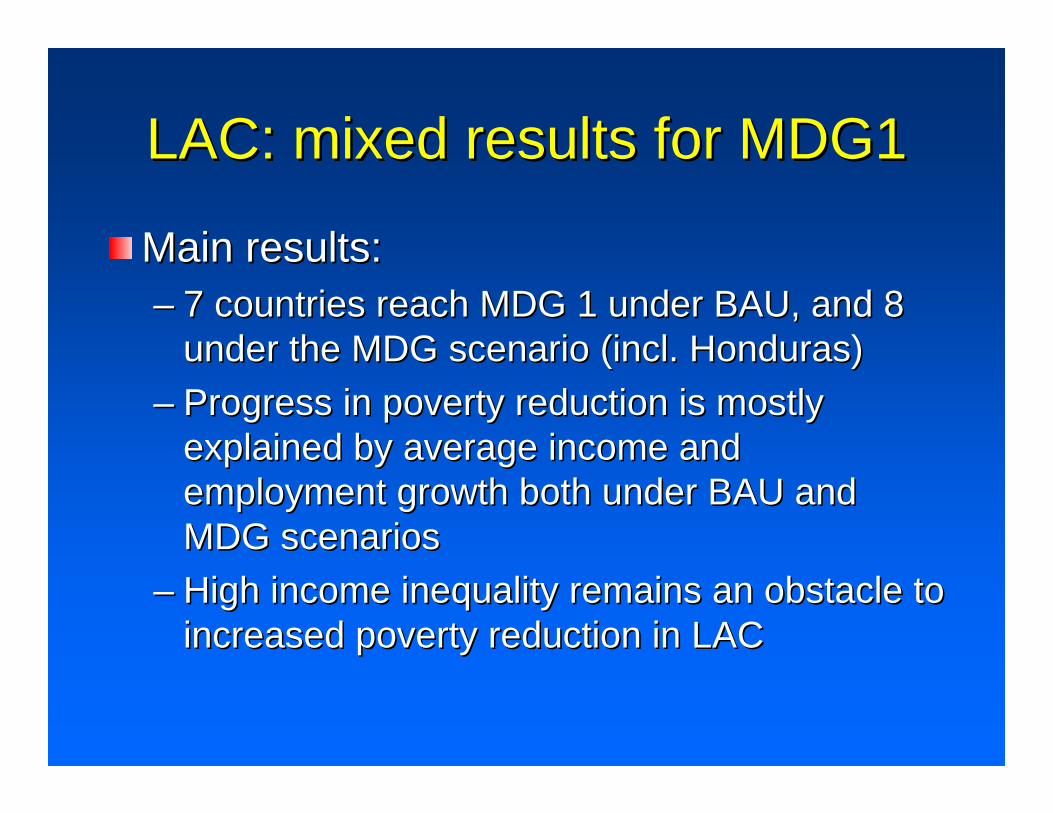
LAC: mixed results for MDG1LAC: mixed results for MDG1
Main results: Main results: –– 7 countries reach MDG 1 under BAU, and 8 7 countries reach MDG 1 under BAU, and 8
under the MDG scenario (incl. Honduras)under the MDG scenario (incl. Honduras)–– Progress in poverty reduction is mostly Progress in poverty reduction is mostly
explained by average income and explained by average income and employment growth both under BAU and employment growth both under BAU and MDG scenariosMDG scenarios
–– High income inequality remains an obstacle to High income inequality remains an obstacle to increased poverty reduction in LACincreased poverty reduction in LAC

MDG strategy does not necessarily MDG strategy does not necessarily strengthen employmentstrengthen employment--output nexusoutput nexus
ARG
BOL
BRACOL
CRI
DOM
ECU
SLVGTM
HND
JAM
MEX
NIC
PRY
PER
URY MDG financing scenario
BAU scenario
0.0
1.0
2.0
3.0
4.0
2.0 2.5 3.0 3.5 4.0 4.5 5.0 5.5 6.0
GDP growth (annual average in %)
Tot
al e
mpl
oym
ent g
row
th (a
nnua
l ave
rage
in %

Investments towards MDGs 2-7 do not necessarily accelerate progress towards MDG 1

ConclusionsConclusions andand recommendationsrecommendationsAffordableAffordable:: thethe costcost ofof reachingreaching MDGsMDGs isis notnotprohibitiveprohibitive, , butbut mostmost LAC LAC countriescountries needneed extra extra effortsefforts toto achieveachieve thethe goalsgoals (BAU (BAU notnot goodgoodenoughenough) )
TaxTax andand spendspend: : analysisanalysis ofof macroeconomicmacroeconomictradetrade--offsoffs suggestsuggest taxtax reformreform shouldshould be be atat centre centre ofof financingfinancing strategystrategy ((thoughthough mixedmixed financingfinancing may may be best in be best in mostmost cases)cases)
EfficiencyEfficiency increasesincreases in social in social spendingspending: : MAMS MAMS assumesassumes effectiveeffective allocationallocation toto reachreachgoalsgoals, , butbut in in practicepractice spacespace toto improveimprove efficiencyefficiencyin in publicpublic spendingspending toto createcreate more fiscal more fiscal spacespace

ConclusionsConclusions andand recommendationsrecommendationsSociallySocially responsibleresponsiblemacroeconomicmacroeconomic policiespolicies: : broadbroadperspectiveperspective onon macro macro policiespolicies beyondbeyondstabilizationstabilization andand inflationinflation targetingtargeting: : growthgrowth, , adequateadequate social social spendingspending, , employmentemploymentgrowthgrowth andand interinter--temporal temporal objectiveobjective ofofhuman human developmentdevelopment
StructuralStructural adjustmentadjustment: : needneed totogenerategenerate more more productiveproductive employmentemployment andandreduce reduce inequalityinequality: MDG : MDG strategystrategy perper se se insufficientinsufficient toto meetmeet povertypoverty reductionreduction targettarget
CaveatsCaveatsMAMS MAMS givesgives stylizedstylized picturepicture ofof economyeconomy. . ResultsResultsare are sensitivesensitive toto modelmodel assumptionsassumptions andand parameterparameterestimatesestimatesAlwaysAlways imperfectimperfect instrumentinstrument, , butbut providesprovidesintegratedintegrated andand consistentconsistent picturepicture–– BetterBetter costingcosting instrumentinstrument–– ImprovedImproved identificationidentification ofof ““on trackon track”” vs vs ““off trackoff track””–– Link Link macroeconomicmacroeconomic andand social social policiespolicies
NeedNeed toto avoidavoid itsits use as use as ““black boxblack box””, but see as , but see as instrument to help policy dialogueinstrument to help policy dialogue