Financing Renewable Energy - World...
105
Peter Lindlein Wolfgang Mostert 2005 Financing Renewable Energy Instruments, Strategies, Practice Approaches
Transcript of Financing Renewable Energy - World...

Peter Lindlein Wolfgang Mostert
2005
Financing Renewable Energy
Instruments, Strategies, Practice Approaches

Financing Renewable Energy
Content
EXECUTIVE SUMMARY
Introduction.......................................................................................................................................... 1
1 The Need for a Special Financial Mix for RE........................................................................... 3
1.1 Constraints for the further development of Renewable Energy.............................3
1.2 Outline of barriers for RE financing ......................................................................5 1.3 The demand side: RE characteristics and the consequences for financing ..........6
1.4 Framework Conditions: Energy market and policy imperfections that discriminate against RE .....................................................................................10
1.5 The supply side: Capital Market Imperfections in Developing Countries.............12 2 Commercial Financial Instruments for RE............................................................................16
2.1 Demand profile for RE financing.........................................................................16
2.2 Types of Financial Instruments...........................................................................17 2.3 Financing Object: Corporate Finance and Project Finance.................................21
2.4 Financial Problems and potential solutions ........................................................22
2.5 Market Access: Types of finance and their availability ........................................24 3 Risk of RE and Instruments of the Financial Sector ...........................................................26
3.1 Risks for RE projects..........................................................................................26
3.2 Instruments for Risk Management: Insurance ....................................................30
3.3 Financial instruments for project risk management.............................................37
3.4 Risk Strategy: Prevention and allocation ............................................................40 4 RE Financing Strategy and Financial Supporting Instruments.........................................46
4.1 Basic Approach for a RE financing strategy .......................................................46
4.2 Use of Development Finance Instruments for RE...............................................51 4.3 GEF and CDM Finance......................................................................................58
4.4 Subsidies ...........................................................................................................62 5 Practice approaches to finance RE projects in LDCs.........................................................72
5.1 Basic Elements of a Program Approach to promote RE .....................................73 5.2 RE Awareness in the Financial Sector................................................................74
5.3 Adequate Funds and Terms ...............................................................................76
5.4 Collateral Problems............................................................................................84
5.5 Exploring Risk and Operation Risk: Contingent finance for geothermal resources for energy production.........................................................................84
5.6 Market- and Off-take Risk ..................................................................................86 6 Some general conclusions......................................................................................................91
ANNEX

Detailed Content Structure
Executive Summary
Introduction.......................................................................................................................................... 1 1 The Need for a Special Financial Mix for RE........................................................................... 3
1.1 Constraints for the further development of Renewable Energy.............................3
1.2 Outline of barriers for RE financing ......................................................................5 1.3 The demand side: RE characteristics and the consequences for financing ..........6
1.3.1 Amounts and levels be financed............................................................................ 7 1.3.2 Viability and access: Return, risk and competitiveness......................................... 8 1.3.3 Project Sponsors.................................................................................................... 9 1.3.4 RE in rural electrification: what is the financing challenge?................................... 9
1.4 Framework Conditions: Energy market and policy imperfections that discriminate against RE .....................................................................................10
1.5 The supply side: Capital Market Imperfections in Developing Countries.............12 1.5.1 Domestic Financial Markets – Potential for RET ? .............................................. 12 1.5.2 Availability of financial instruments: Classification of standard
types of financial/capital markets ......................................................................... 13 1.5.3 A core problem: Absence of long-term finance.................................................... 14
2 Commercial Financial Instruments for RE............................................................................16
2.1 Demand profile for RE financing.........................................................................16 2.2 Types of Financial Instruments...........................................................................17
2.2.1 Equity Finance and Risk Capital .......................................................................... 17 2.2.2 Debt Financing..................................................................................................... 19 2.2.3 "Mezzanine finance" and subordinated debt ....................................................... 20 2.2.4 Sales-Lease-Back Arrangements for RE-Finance ............................................... 20
2.3 Financing Object: Corporate Finance and Project Finance.................................21 2.4 Financial Problems and potential solutions ........................................................22
2.5 Market Access: Types of finance and their availability ........................................24 3 Risk of RE and Instruments of the Financial Sector ...........................................................26
3.1 Risks for RE projects..........................................................................................26 3.1.1 Standard Project Risks......................................................................................... 27 3.1.2 Profile and nature of risk of RE-projects .............................................................. 28
3.2 Instruments for Risk Management: Insurance ....................................................30 3.2.1 Available insurance for RET ................................................................................ 30 3.2.2 Private credit insurance ....................................................................................... 31 3.2.3 Political Risk Insurance........................................................................................ 32 3.2.4 Weather insurance/ Weather derivatives............................................................. 35 3.2.5 Example: Wind energy......................................................................................... 36
3.3 Financial instruments for project risk management.............................................37 3.3.1 Contingent Capital ............................................................................................... 37 3.3.2 Pledge of Shares ................................................................................................. 37 3.3.3 Exchange risk instruments................................................................................... 38 3.3.4 Securitization of credits........................................................................................ 39
3.4 Risk Strategy: Prevention and allocation ............................................................40 3.4.1 Own Risk Management........................................................................................ 41 3.4.2 Partners and standard approach for risk allocation ............................................. 41 3.4.3 Preliminary Conclusion on risk instruments for RE.............................................. 44
4 RE Financing Strategy and Financial Supporting Instruments.........................................46
4.1 Basic Approach for a RE financing strategy .......................................................46 4.1.1 RE Supply Curve, and Viability ............................................................................ 47 4.1.2 Viability and competitiveness of the different RE Types ...................................... 49 4.1.3 Promoting RE viability, the Market and the Development
Continuum............................................................................................................ 50 4.2 Use of Development Finance Instruments for RE...............................................51

4.2.1 Activities of Development Banks ......................................................................... 52 4.2.2 Approach and Lessons learned ........................................................................... 52 4.2.3 Available Financial Instruments ........................................................................... 53 4.2.4 Risk Instruments .................................................................................................. 54 4.2.5 Combined Support ............................................................................................... 56 4.2.6 Opportunities in RE for development banks and DFIs ....................................... 56
4.3 GEF and CDM Finance......................................................................................58 4.3.1 GEF Finance........................................................................................................ 58 4.3.2 Clean Development Mechanism Finance ............................................................ 59
4.4 Subsidies ...........................................................................................................62 4.4.1 Justification of financial support to RETs ............................................................. 62 4.4.2 Portfolio of Financial Supporting Instruments ...................................................... 62 4.4.3 Taxpayer financed Subsidy Instruments .............................................................. 64 4.4.4 Subsidies to RE financed by Electricity Consumers............................................ 66 4.4.5 Smart Subsidies................................................................................................... 70
5 Practice approaches to finance RE projects in LDCs.........................................................72
5.1 Basic Elements of a Program Approach to promote RE .....................................73 5.2 RE Awareness in the Financial Sector................................................................74
5.2.1 Contracting banks to channel loans to rural electrification projects - Burkina Faso ........................................................................................ 74
5.2.2 Creation of a specialized financial institution for RE – India (IREDA)................................................................................................................ 75
5.3 Adequate Funds and Terms ...............................................................................76 5.3.1 DFI structuring commercial financing of renewable energies.............................. 76 5.3.2 Introducing new financial products: Two step finance for
Windfarms in Egypt.............................................................................................. 77 5.3.3 Bullet loan and liquidity stand by guarantee for follow-up loan -
Uganda................................................................................................................. 80 5.3.4 Securitizing micro-credits via partial payment risk guarantee ............................. 81 5.3.5 Initial investment cost subsidy and GER Grant –
Senegal/Rural Electrification................................................................................ 82 5.3.6 Fee-for-Service PV-Concessions - South Africa................................................. 83
5.4 Collateral Problems............................................................................................84 5.5 Exploring Risk and Operation Risk: Contingent finance for geothermal
resources for energy production.........................................................................84
5.6 Market- and Off-take Risk ..................................................................................86 5.6.1 Market pump-priming Subsidies and Market deepening
subsidies - Promoting PV-systems in the off-grid electrification market .................................................................................................................. 86
5.6.2 Energy Market Access: Lease-buy-back scheme to channel long-term donor loans to RE-generators - Cambodia.......................................... 87
5.6.3 Reducing the market risk for intermittent power supply – sharing the market off-take risk: Nicaragua ......................................................... 89
5.6.4 Reducing the off-take risk in green electricity schemes: South Africa .................................................................................................................... 90
6 Some general conclusions......................................................................................................91
Annex
1: Capital Market Conditions in Developing Countries 2: Leveraging Capital with Risk Management Instruments 3: References
Financing Instruments for Renewable Energy I
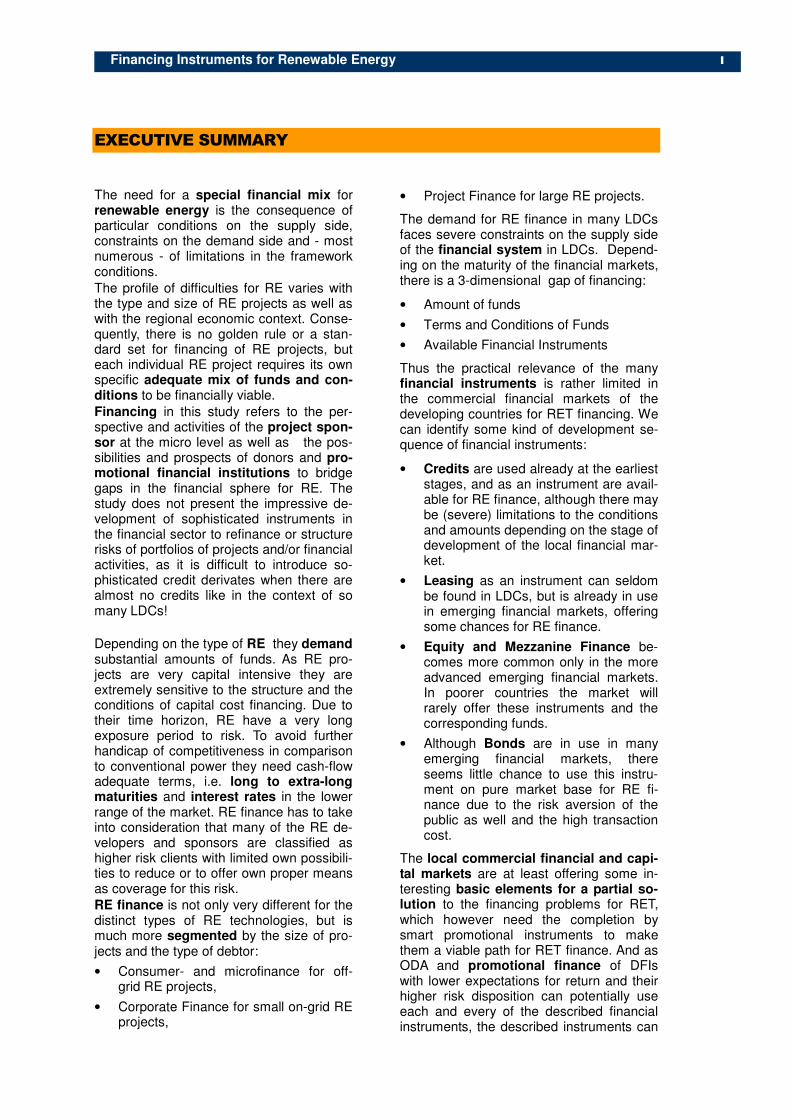
EXECUTIVE SUMMARY
The need for a special financial mix for renewable energy is the consequence of particular conditions on the supply side, constraints on the demand side and - most numerous - of limitations in the framework conditions.
The profile of difficulties for RE varies with the type and size of RE projects as well as with the regional economic context. Conse-quently, there is no golden rule or a stan-dard set for financing of RE projects, but each individual RE project requires its own specific adequate mix of funds and con-ditions to be financially viable.
Financing in this study refers to the per-spective and activities of the project spon-sor at the micro level as well as the pos-sibilities and prospects of donors and pro-motional financial institutions to bridge gaps in the financial sphere for RE. The study does not present the impressive de-velopment of sophisticated instruments in the financial sector to refinance or structure risks of portfolios of projects and/or financial activities, as it is difficult to introduce so-phisticated credit derivates when there are almost no credits like in the context of so many LDCs!
Depending on the type of RE they demand substantial amounts of funds. As RE pro-jects are very capital intensive they are extremely sensitive to the structure and the conditions of capital cost financing. Due to their time horizon, RE have a very long exposure period to risk. To avoid further handicap of competitiveness in comparison to conventional power they need cash-flow adequate terms, i.e. long to extra-long maturities and interest rates in the lower range of the market. RE finance has to take into consideration that many of the RE de-velopers and sponsors are classified as higher risk clients with limited own possibili-ties to reduce or to offer own proper means as coverage for this risk. RE finance is not only very different for the distinct types of RE technologies, but is much more segmented by the size of pro-jects and the type of debtor:
• Consumer- and microfinance for off-grid RE projects,
• Corporate Finance for small on-grid RE projects,
• Project Finance for large RE projects.
The demand for RE finance in many LDCs faces severe constraints on the supply side of the financial system in LDCs. Depend-ing on the maturity of the financial markets, there is a 3-dimensional gap of financing:
• Amount of funds
• Terms and Conditions of Funds
• Available Financial Instruments
Thus the practical relevance of the many financial instruments is rather limited in the commercial financial markets of the developing countries for RET financing. We can identify some kind of development se-quence of financial instruments:
• Credits are used already at the earliest stages, and as an instrument are avail-able for RE finance, although there may be (severe) limitations to the conditions and amounts depending on the stage of development of the local financial mar-ket.
• Leasing as an instrument can seldom be found in LDCs, but is already in use in emerging financial markets, offering some chances for RE finance.
• Equity and Mezzanine Finance be-comes more common only in the more advanced emerging financial markets. In poorer countries the market will rarely offer these instruments and the corresponding funds.
• Although Bonds are in use in many emerging financial markets, there seems little chance to use this instru-ment on pure market base for RE fi-nance due to the risk aversion of the public as well and the high transaction cost.
The local commercial financial and capi-tal markets are at least offering some in-teresting basic elements for a partial so-lution to the financing problems for RET, which however need the completion by smart promotional instruments to make them a viable path for RET finance. And as ODA and promotional finance of DFIs with lower expectations for return and their higher risk disposition can potentially use each and every of the described financial instruments, the described instruments can
Financing Instruments for Renewable Energy II
serve – together with the instruments in the next chapter – as something like a toolbox for adequate RE financing within promo-tional schemes.
As RE-projects are more complex and risky, also because most of these technologies rely on the supply of fuel from nature with-out a chance of substitution by another source, risk management and risk alloca-tion are extremely important. The proper planning of a RE project with carefulness, attention and accuracy exercising the due diligence of a businessman is the most important risk management factor. The capital and insurance markets have devel-oped a series of financial instruments to support the structuring of the risk of pro-jects and to make financial deals viable at all. The most important and relevant risk instruments at the present stage of devel-opment are:
• Political Risk Insurance,
• Wind Insurance,
• Swaps, and
• Contingent Finance.
Due to the limited experience, the early stage development of the relevant markets and the risk-aversion of the players such instrument will only seldom be available for RE in LDCs per se. Given these con-straints, there is a task for the public sector and the donor community to take on to catalyze the utilization of innovative risk management schemes to facilitate com-mercial investment flow to RE sector. Thus, some of these instruments presented offer an interesting starting point for policy makers and donors to support the struc-turing of risk in RE by assisting the players in the financial and insurance markets to develop their skills and instruments. Fur-thermore some of them could be used di-rectly by donors to assist RE projects and
programs.
Taking into consideration the limited re-sources, the study presents on the base of the rationale of economic and financial viability some conclusions for an approach of RE promotional finance and policy makers:
• Pick the low-hanging fruits in RE-investments, i.e. financially viable under current conditions. They could be fi-nanced by commercial finance, pro-vided they get adequate. In cases of fi-nancial market failure this needs com-pensation by agents who have the will-ingness and the funds to create or give
the access. This is a case for market-based development finance.
• Other RETs are economically viable, but not (yet) financially viable, because external costs and benefits are not re-flected in the financial market prices. They need some compensating finan-cial support to become financially vi-able. This is the field for RET financial support through subsidies and ODA with grant elements.
Promotional schemes could play an im-portant role to improve the financial viability of RE projects by an approach to increase funding availability, aiming at leverage of private finance, with a risk-sharing ap-proach, and the facilitation of the bundling of (small) projects to help absorb their higher proportional level of transaction costs. A financing framework for renewable energy based on the economic principle and the principle of subsidiarity is com-posed of three inter-linked pillars:
• Support access to commercial finance by making equity and long-term debt fi-nance available.
• Create a market expanding regulatory framework, which reduces risks, keeps down the costs of projects transactions.
• Offer financial subsidy-instruments to bridge the gap between economic and financial viability, thereby making oth-erwise financially unviable energy in-vestments “bankable”.
Opportunities for donors (in combination with the existing financial instruments and players) in the local capital markets include:
• Support private firms by providing fi-nancing and/or equipment subsidies. Enterprise development supprt, seed capital, debt finance etc.
• Supprt of Specialized Financial Institu-tions (RE, Microfinance).
• Creation of new financing vehicles like revolving funds, credit lines, and con-tingent business loans that are forgiv-able under specified conditions.
• Reduction of (commercial) risks by financial guarantees like for example maturity guarantees, rolling guarantees and pool guarantees.
Subsidies are needed to bridge the gap between economic and financial viability of RE, which should be done by smart sub-sidies reaching intended markets only and encouraging least cost option to achieve social goals at least cost while providing

Financing Instruments for Renewable Energy III
incentives for business to serve target mar-kets. They encourage commercial participa-tion by the private sector and should have a built-in element of phasing out. As a gen-eral international tendency in the developed countries the following can be observed, which are not always in line with the princi-ples of smart subsidies:
• a shift in the subsidy burden from tax-payers to electricity consumer pays in-struments;
• replacement of direct investment subsi-dies to RE to subsidies linked to the output;
• focus on elimination of “windfall” sub-sidy payments.
The possibilities of the interaction of fi-nancing instruments, regulations and institutional innovations as an approach to overcome the hurdles of RE finance and to “mainstream” RE in bulk power markets and rural electrification is presented in a chapter of case studies, making the step from the single RE-project implementation perspective to a program-approach to RE. After presenting basic elements of a pro-gram approach to promote RE, examples are presented illustrating, how
• the creation of specialized institutions for RE finance,
• the introduction of new financial prod-ucts into the capital market and
• the re-allocation of risks RE-Investments can be enabled and
• how problems of collateral could be solved.
Trying to summarize the quintessence of this study an outline of the rationale of a RE financing strategy calling for a well-targeted support by promoters of RE and development is presented:
1. The limited financial viability and the elevated risk profile of RE require special efforts in financing and struc-turing.
2. The financial approach has to deter-mine the distance of the RE project to commercial financial viability, and de-fine a set of cost reducing and income increasing measures on three levels (project, framework, outside support) to create conditions of financial viabil-ity ex ante as a key factor for invest-ment decision.
3. Risk Allocation between project spon-sor, contract partners, the (financial)
market and promoting institutions is the other key determinant for successful project financing of RE.
4. This risk structuring and financial engi-neering of RE projects is a complex and time-consuming process, de-manding staying power and corre-sponding resources itself.
5. For projects with a perspective of viabil-ity, the financial world has ready a well-equipped toolbox with adequate instruments to finance the specific needs of RE projects and to structure its risks, at least in theory.
6. A proper risk allocation with view on the markets perception of RE can make a generally viable RE project creditwor-thy at all or creditworthier, thus helping to attract more funds and reduce the cost of financing in the market.
7. However in practice, local capital markets are not the magic solution due to their limitations on the different levels of financial deepening in the various markets, although even in LDCs they can offer some contribution to finan-cial closure.
8. The 3-dimensional RE financing gap (funds/terms/instruments) can be bridged with the assistance of institu-tions with higher risk-absorptive ca-pacity, and which by themselves can potentially offer each professional fi-nancial instrument to complete the market. However, as the resources of promoting institutions are not unlimited, their approach has to be selective and targeted.
9. To maximize results donors should offer assistance to pick the low hanging fruits of RE, i.e. projects, which are close to market competitiveness. Smart subsidies can be a valuable instrument in such a context, especially if their use needs to be only transitory.
10. Donors could help create creditwor-thiness (Training for RE project spon-sors and RE interested financial institu-tions, Risk structuring and coverage) and look for leverage, offering assis-tance (Financial Guarantee, subordi-nated debt) to bring down the risk of RE to a market-attractive level.
Financing Instruments for Renewable Energy 1
Introduction
‘Renewable energy’ and the ‘Financial Sector’ have one thing in com-
mon: due to their crucial role and their fast technical progress they are
attracting more and more attention, especially in the world of develop-
ment assistance, which is looking for an approach to alleviate the energy
problems of the developing countries by adequate technology.
Applying a market-oriented approach, the starting point of this study are
the barriers to the further development of the renewable energy (RE)
sector on the supply side, the demand side and the framework condi-
tions within the energy sector. Identifying the financial constraints as one
the most important the study tries to systematize the hurdles in the fi-
nancial sphere of RE projects on the demand side, the supply side and
the framework conditions of the financial sector.
In this context, it is important to clarify the perspective and focus of this
study. Financing in this study refers to
• the perspective and activities of the project sponsor at the micro level as well as
• the activities and instruments of the regulatory authorities and Government in the energy sector and at macro level,
• as well as the possibilities and prospects of donors and promotional fi-nancial institutions to bridge gaps in the financial sphere for RE.
It does not refer in detail to the impressive development of sophisticated
instruments in the financial sector to refinance or structure risks of port-
folios of projects and/or financial activities. Although the use of such
techniques by financial institutions in the end may also benefit the supply
of finance for single RE projects, their orientation on portfolio aspects
and refinancing of the financial institution itself would overstretch the
coverage of this study.1
Accordingly the analysis of the task of financing of a RE project making
use of the supply of the commercial financial sector in this study centers
on the possibilities on the utilization of classical financial instruments and
of their availability in the financial market at the different stages of devel-
opment.
This is also the perspective and approach in this report to address the
specific risks RE projects have to manage. Within the scope of this
study, this chapter can give only an overview about the wide range of
risk factors within RE projects and present an outline of the generally
available risk instruments. Within this context it would be too ambitious
to present every financial instrument in detail and to develop a replicable
1 Some of these aspects will be covered in the study “Assessment of Financial Risk
Management Instruments for Renewable Energy” to be implemented by UNEP in co-operation with the World Bank and UNDP from 2005-2007.

Financing Instruments for Renewable Energy 2
blueprint for its utilization for RE projects.2 Thus the chapter will focus on
the most essential instruments at the project level and present an ap-
proach for a risk strategy for RE. A typical scheme for risk allocation at
the RE project level is derived from a screening of risk instruments used
in the financial market.
Although the commercial financial sector offers a wide variety of instru-
ments for financing and risk coverage which potentially could be used for
RET finance, there is a gap due to their actual availability in LCDs. Thus
the following chapter gives an overview of financial supporting ap-
proaches and instruments to bridge such gaps.
The possibilities of the interaction of financing instruments, regula-
tions and institutional innovations as an approach to overcome the
hurdles of RE finance and to “mainstream” RE in bulk power markets
and rural electrification is presented in a chapter of case studies, mak-
ing the step from the single RE-project implementation perspective to a
program-approach to RE. After presenting basic elements of a program
approach to promote RE, examples are presented illustrating, how
• the creation of specialized institutions for RE finance,
• the introduction of new financial products into the capital market and
• the re-allocation of risks RE-Investments can be enabled and
• how problems of collateral could be solved.
This study is concluded with some general conclusions for the financing
of RE from the point of view of a promotional institution.
Peter Lindlein
Wolfgang Mostert
Frankfurt, 2005
2 As mentioned earlier some of these aspects will be covered in the study “Assessment
of Financial Risk Management Instruments for Renewable Energy” to be implemented by UNEP in co-operation with the World Bank and UNDP from 2005-2007.

Financing Instruments for Renewable Energy 3
1 The Need for a Special Financial Mix for RE
1.1 Constraints for the further development of Renewable En-
ergy
Renewable energy (RE) is on the agenda for decades and it has gained
a strong momentum, but despite this, renewable energy projects still
face serious constraints hampering their further development and com-
mercialization. Of cource, the variety of RE types are affected in a differ-
ent degree of the various problems due to their specifics and maturity. A
large number of reasons are named as barriers in this context: internal
and external, political, technical, financial and institutional. If we try to
sort them, it may be appropriate to group the problems by the market
categories supply, demand and framework conditions.
On the supply side RE development has difficulties due to its own tech-
nical and economic characteristics, because of the type of project spon-
sor and shortcomings in the commercialisation3:
RE charac-
teristics
- Newer technologies -Higher operating risks
- Smaller project sizes -Higher transac-tion costs
- Longer lead times -Higher development costs
- Higher ratio of capital costs to operating costs - Need for longer-term financing at reasonable rates
- present technologies not yet fully com-petitive
RE Project
Sponsor
- Less experienced sponsors - Higher completion and operating risks
- Low level of own funds for investment cost contribution
Supply
Commer-
cialization
and Market-
ing
- Commercialization barriers faced by new technologies competing with ma-ture technologies
- Lack of commercial business models
- lack of established infrastructure of some re technologies
As a new technology with a high up-front cost, RE has to face some
constraints on the demand side, as well on the level of individual con-
sumers as on the level of network operator:
3 Adapted from, among others: Beck, Fred and Martinot, Eric - Renewable Energy Policies and
Barriers , in Encyclopedia of Energy, Cutler J. Cleveland, ed. (Academic Press/Elsevier Science, 2004)

Financing Instruments for Renewable Energy 4
Awareness
and Willing-
ness
- Society lacks of awareness or familiar-ity with renewable energy practices
- Limited cultural acceptance of renew-able energy technologies
- Power grids operators are reluctant to deal with decentralized suppliers of en-ergy
Demand
Adequacy
and Cost
- Electricity consumption too low for fi-nancial sustainability (not enough pro-ductive use)
- Low demand at relatively high initial cost for individual investor-clients
- Low demand from power grids on base of actual LRMC level
However, most numerous are the constraints in the framework condi-
tions. Policy and the legal regulations affect the RE sector itself and the
energy sector in its entirety. Furthermore, on the base of the prevailing
price formation, which is not taking into consideration external cost and
benefit in the energy sector, the market mechanism acts not in favour of
RE. As one of the most important barriers in the framework conditions,
the deficiencies of the financial sector to deal with RE and to offer ade-
quate funds at appropriate conditions are mentioned:
Policy and
Legal
Framework
- Independent power producers may be unable to sell into common power grids
- Transmission access and pricing rules may penalize smaller and/or intermit-tent renewable energy sources, Utilities may set burdensome interconnection requirements
- Permitting requirements and siting re-strictions may be excessive.
- Requirements for liability insurance may be excessive.
Energy
Sector
Competition
and Bias
- low cost of energy from conventional sources
- price distortions from existing subsidies and unequal tax burdens between re-newables and other energy sources
Framework
Conditions
Market
Perform-
ance
- failure of the market to value the public benefits of renewables
- lack of environmental externality cost in the current price of fossil fuels
- market barriers such as inadequate in-formation
Financing Instruments for Renewable Energy 5
Financing - RE unfamiliar to financiers due to lack of information
- RE often considered not attractive, be-cause high risk without adequate risk compensation in form of risk coverage instruments or higher returns
- Financing hardly available for projects and customers due to lack of funds and/or lack of instruments
Obviously, not each of these constraints is relevant for every RE tech-
nology, and conditions and hurdles differ much from country to country.
However, many of otherwise viable RE projects is blocked from being
realized by one of these barriers. As no project can be realized without
proper funds, financing is still one of the core problems of RE develop-
ment.
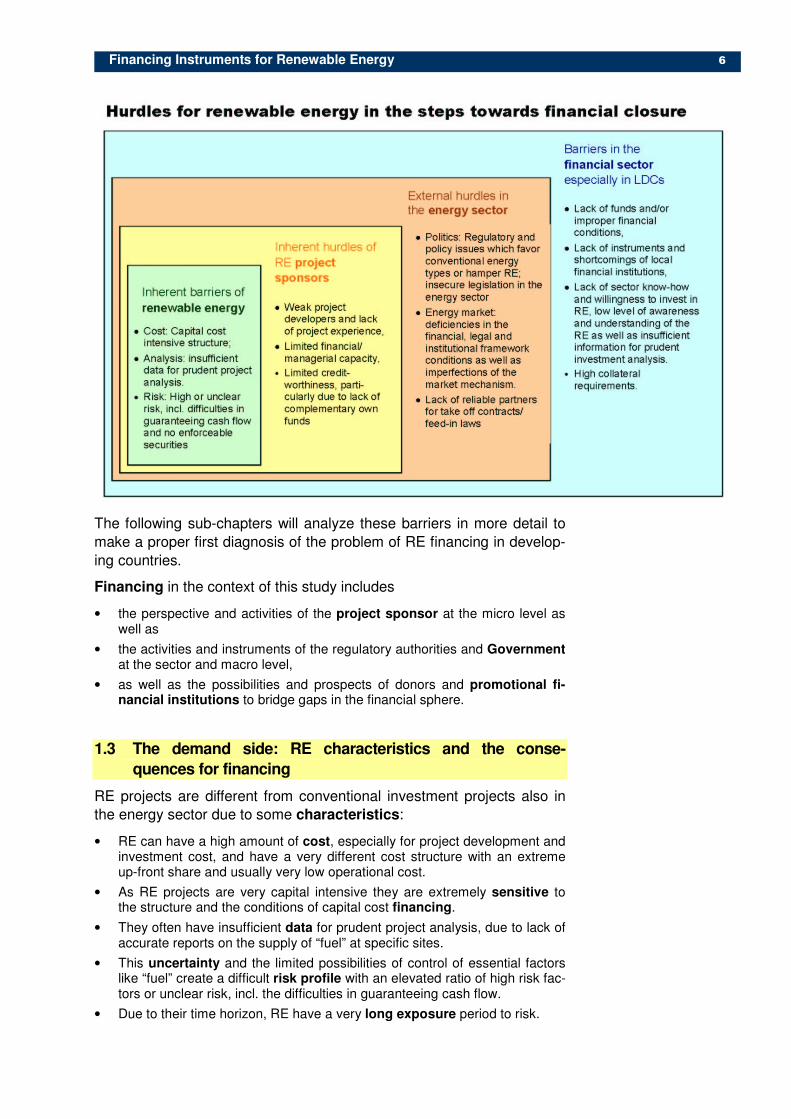
1.2 Outline of barriers for RE financing
On the long way to closure of the financing of a RE project, many hur-
dles have to be cleared. With each of the necessary steps we move
closer from the energy market to the financial market, thus not only
changing the focus and perspectives of the actors of the general scheme
presented above but also applying strictly financial and economic crite-
ria. From this point of view, the most important barriers to finance re-
newable energy are:
• On the demand side for RE finance we find inherent barriers due to the characteristics of renewable energy projects, and internal problems of RE project sponsors.
• The framework conditions for the project within the energy sector may include substantial burden and barriers for RE finance.
• On the supply side of RE finance there are a series of shortcomings in the financial sector, in some of the LDCs to an extent, that there is no supply at all.
If we look into further detail we can identify a series of barriers, some of
them interrelated, in each of the steps of a RE project on the way from
demand to supply on the financial market:
Financing Instruments for Renewable Energy 6
The following sub-chapters will analyze these barriers in more detail to
make a proper first diagnosis of the problem of RE financing in develop-
ing countries.
Financing in the context of this study includes
• the perspective and activities of the project sponsor at the micro level as well as
• the activities and instruments of the regulatory authorities and Government at the sector and macro level,
• as well as the possibilities and prospects of donors and promotional fi-nancial institutions to bridge gaps in the financial sphere.
1.3 The demand side: RE characteristics and the conse-
quences for financing
RE projects are different from conventional investment projects also in
the energy sector due to some characteristics:
• RE can have a high amount of cost, especially for project development and investment cost, and have a very different cost structure with an extreme up-front share and usually very low operational cost.
• As RE projects are very capital intensive they are extremely sensitive to the structure and the conditions of capital cost financing.
• They often have insufficient data for prudent project analysis, due to lack of accurate reports on the supply of “fuel” at specific sites.
• This uncertainty and the limited possibilities of control of essential factors like “fuel” create a difficult risk profile with an elevated ratio of high risk fac-tors or unclear risk, incl. the difficulties in guaranteeing cash flow.
• Due to their time horizon, RE have a very long exposure period to risk.
Financing Instruments for Renewable Energy 7
• To avoid further handicap of competitiveness in comparison to conventional power they need cash-flow adequate terms, i.e.
- long to extra-long maturities and
- interest rates in the lower range of the market
Such characteristics of renewable energy4 specify the task financing has
to solve: Potential returns and possible risks as well as the necessary
amount for investment determine which part of the capital market would
be the most appropriate to deal with this task.
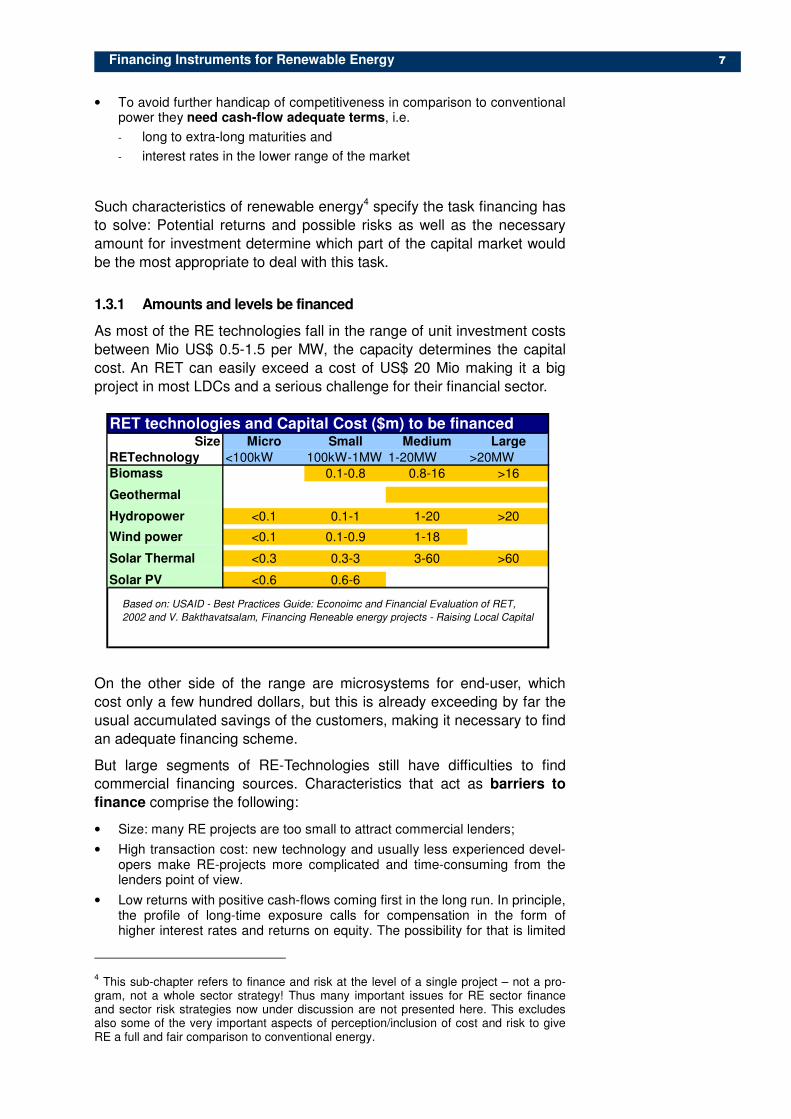
1.3.1 Amounts and levels be financed
As most of the RE technologies fall in the range of unit investment costs
between Mio US$ 0.5-1.5 per MW, the capacity determines the capital
cost. An RET can easily exceed a cost of US$ 20 Mio making it a big
project in most LDCs and a serious challenge for their financial sector.
On the other side of the range are microsystems for end-user, which
cost only a few hundred dollars, but this is already exceeding by far the
usual accumulated savings of the customers, making it necessary to find
an adequate financing scheme.
But large segments of RE-Technologies still have difficulties to find
commercial financing sources. Characteristics that act as barriers to
finance comprise the following:
• Size: many RE projects are too small to attract commercial lenders;
• High transaction cost: new technology and usually less experienced devel-opers make RE-projects more complicated and time-consuming from the lenders point of view.
• Low returns with positive cash-flows coming first in the long run. In principle, the profile of long-time exposure calls for compensation in the form of higher interest rates and returns on equity. The possibility for that is limited
4 This sub-chapter refers to finance and risk at the level of a single project – not a pro-
gram, not a whole sector strategy! Thus many important issues for RE sector finance and sector risk strategies now under discussion are not presented here. This excludes also some of the very important aspects of perception/inclusion of cost and risk to give RE a full and fair comparison to conventional energy.
RET technologies and Capital Cost ($m) to be financedSize Micro Small Medium Large
RETechnology <100kW 100kW-1MW 1-20MW >20MWBiomass 0.1-0.8 0.8-16 >16
Geothermal
Hydropower <0.1 0.1-1 1-20 >20
Wind power <0.1 0.1-0.9 1-18
Solar Thermal <0.3 0.3-3 3-60 >60
Solar PV <0.6 0.6-6
Based on: USAID - Best Practices Guide: Econoimc and Financial Evaluation of RET,
2002 and V. Bakthavatsalam, Financing Reneable energy projects - Raising Local Capital

Financing Instruments for Renewable Energy 8
by the low project returns, which make such kind of projects rather unattrac-tive.
1.3.2 Viability and access: Return, risk and competitiveness
A simple and basic truth: Commercial bankers and investors may be
considered one-dimensional, as all that matters to them is return. Return
is sexy - risk is not. And most RET offer a low return with an extra portion
of risk. This makes it complicated – not for investors as there are enough
other opportunities - but for the RE promoting community. A comparison
with conventional private investments is shown below with the axes of
risk (BETA) and return:5
This example from the UK in 1998 makes the criteria to attract private
capital quite clear – and indicates at the same time that the situation can
change as the private investment in wind energy demonstrates.
The risk of the different RE is varying widely, giving a wide range of
5 Source: Jonathan Johns – Renewable as investments, The Quarterly Newsletter for the
UK New and Renewable Energy Industry, Issue 38, November 1998

Financing Instruments for Renewable Energy 9
risk/cost combinations as the playing field for RE finance:
Depending on the size, RET sector and region, the relevance of the dif-
ferent sources and instruments for RET finance varies extremely, reach-
ing from private finance from savings or relatives to finance very small
RET (pico hydro) to two-digit million credits from advanced domestic
banks participating in the project financing.
� Thus, RE finance is not only very different for the distinct types of
RE technologies, but is much more segmented by the size of pro-
jects and the type of debtor:
Consumer- and microfinance for off-grid RE projects,
Corporate Finance for small on-grid RE projects,
Project Finance for large RE projects
1.3.3 Project Sponsors
RE has extended the energy sector not only technically, but also with its
wide range of project size and its possibilities for off-grid and decentral-
ized energy supply, it has also enabled the insertion of new players in
the field.
Therefore, in comparison to conventional energy RE has also widened
the range of financial tasks to be solved. Thus, financial needs for RE
exist at three levels:
• households and community groups need micro-credit;
• entrepreneurs need long-term “patient capital” that allows them time to develop products and services based on renewable energy; and
• investors need reduced or shared credit risks until confidence in renew-ables grows and track records of success emerge.
On the other side, despite all the good intention, quite often the develop-
ers of these projects and the project sponsors from these very diverse
groups lack project experience in the sector, or even project and in-
vestment experience at all, as for many the RE project is a very new
experience stressing their managerial and financial capacity.
Furthermore, most of these players are new clients for the financial
business. And as many of them did not have accumulated own funds to
invest, they have difficulties to meet the requirement for complementary
financing by own funds and/or collateral.
� RE finance has to take into consideration that many of the RE devel-
opers and sponsors are classified as higher risk clients with limited
own possibilities to reduce or to offer own proper means as coverage
for this risk.
1.3.4 RE in rural electrification: what is the financing challenge?
A special case is RE in rural electrification, which refers to the off-main-
grid use of RE in small isolated rural grids and in off-grid, stand-alone
demand for electricity. Some developing countries are at the end of their

Financing Instruments for Renewable Energy 10
electrification drive – providing electricity services to the large majority of
the population; other countries are at the start of national electrification
with national electrification rates being as low as 5-7%. In both types of
countries, the rural electrification program is not commercially viable;
which is why its scope and implementation depend on Government
and/or donor subsidies.
Promoting the use of RE in rural electrification projects is different from
promoting RE on the bulk power market:
• The size of the RE-technologies in rural electrification is in the Wp and kW-range instead of MW. This hugely increases the costs of project prepa-ration and implementation per MW of promoted RE-generating capacity.
• The bulk market for power is a commercial viability business; if the sector is financially weak there is a problem of regulatory failure; subsidies are used to correct for market imperfections. Large sections of rural electrification are inherently non-commercial, and subsidies are used to improve social eq-uity.
• The strategy for promoting and financing RE is a sub-ordinated part of the overall strategy for organising and financing rural electrification. The key question for RE-subsidy policy in rural electrification is not whether the RE-promotion element within the rural electrification strategy is effective (that’s a second order issue), but whether the overall approach to rural electrifica-tion is effective (first order issue). The optimization issue is how to get maximum electrification access for the subsidy amount that is available for rural electrification.
• The key financing challenge in RE for the main-grid is to minimize the upfront cost of project finance. In RE for rural electrification it is equally im-portant to secure the financial sustainability of RE-generators during opera-tion.
6 Revenues must as a minimum cover the cost of O&M; otherwise the
generator is not maintained and kept in operating conditions.
1.4 Framework Conditions: Energy market and policy imperfec-
tions that discriminate against RE
RE is inserted in a framework of competition and regulations in the en-
ergy sector. Here it faces general and specific problems, which indirectly
affect the possibilities of financing of RE:
• Politics: Regulatory and policy issues which favor conventional energy types or hamper RE; insecure legislation in the energy sector
• Energy market: deficiencies in the financial, legal and institutional frame-work conditions as well as imperfections of the market mechanism.
• Lack of reliable partners for take off contracts/ feed-in laws.
These conditions strongly affect the possibilities and competitiveness of
RE, sometimes in a way that economically viable RE projects are finan-
6 For RE-generators on the bulk market for power, generating survival during operation
depends on their short-term costs of O&M being lower than the SRMC per kWh of con-ventional power generation. That is usually the case: RE-generators are upfront in the merit order for daily scheduling. Since the cost of O&M in RE-projects generating power for the grid is lower than the market price for bulk power –, creditors to a money-losing RE-project have in interest in keeping RE-generator going when the original investor goes bankrupt. For RE in rural electrification, being least-cost in the short run compared with alternative generators is not enough for survival.
Financing Instruments for Renewable Energy 11
cially not viable. Factors, which introduce a bias against investments
in RE, are:
• Price distortions on the bulk power market caused by subsidized prices for fossil fuel consumption of thermal power plants and by import duties & VAT on RE-components: A widespread energy price distortion is that compo-nents and fuels for thermal power production are exonerated from import duty and VAT, whilst investments in RE (in particular PV-systems, which are treated like consumer goods) are not offered the same privilege. In fos-sil fuel-exporting developing countries fuels consumed at power plants are typically priced below their net-back value
7 as export product.
8
• The cost of negative environmental externalities, which is not included in the power prices from thermal power plants: The environmental costs of thermal power plants comprise the impacts of local/regional pollution (health and productive impacts from air, ground and water pollution) and the global warming impacts. The CDM and JI-mechanisms assign a market value to the latter through the revenue from sales of CERs and ERUs
9, which by re-
ducing the required “full cost of production” power tariff of RE improves its competitiveness on the bulk power market. The local environmental costs need to be quantified. Environmental cost estimates are not exact science. They are highly dependent on derived assumptions concerning the effects and the value assigned to lost mandays and lost life. Yet, once a per kWh benefit of replaced thermal power figure has been agreed to politically, it re-flects the environmental premium value of RE to use in power planning models.
• Non-recognition of the portfolio value of RE – the value of its price stabil-ity. The portfolio value of RE refers to the value of protection against fuel price fluctuations. Fluctuating fuel prices impose adjustment costs on agents in the power system and on society; long-term shifts in fossil fuel prices change the ranking of generators in the merit order for scheduling permanently. Given today’s dynamic and uncertain environment however it is impossible to correctly identify the 30-year "least cost" option. Traditional methods for least-cost power planning, however, do not quantify the price of fuel price uncertainty, including it as a cost component in the levelized cost of production per kWh of generators. Conventional project analysis for least-cost planning compares alternatives on a plant to plant comparison using a fixed forecast fuel price; with the sensitivity of results to the fuel price assumption being shown in a separate risk analysis. By omitting a cost component of conventional power altogether, this approach has an in-herent bias against RET.
10
7 Net-back value of fossil fuel consumption at thermal power plants is equal to the price
(fob) of the fuel if exported, minus the domestic cost of converting the domestic fuel into an export product (of e.g. domestically produced natural gas into LNG). 8 During the “pilot project years” of collaboration programs for RETs, donors accepted
such price distortions. But since donor policy has shifted to fund now only “RE-mainstreaming” collaboration programs, donors increasingly refuse to finance RE-collaboration programs unless steps are taken to eliminate the pricing bias. It has be-come common practice for donors to make assistance to a RE-program conditional on a Government commitment to the phasing out of import duties and VAT on RE.
8 When
faced with fossil fuel subsidies in the host country for a proposed RE-project activity, a recommended option for donors is to include a consultant study for the Ministry of Fi-nance on the distortion costs of energy subsidies in their RE- collaboration program
8 and
their social equity impact. 9 Certified Emission Reductions (CDM-projects) and Emission Reduction Units (JI-
projects).
10 A more objective approach is to use the market price of hedged fuel prices as fuel
price in the financial-economic modelling of levelised power plant prices. Bolin-
ger/Wiser/Golove found that this approach increases the calculated cost of natural gas
fired power plants by UScents 0.5/kWh. Another is to apply the Capital Asset Pricing
Model (CAPM) from portfolio asset theory to derive different discount factors for different

Financing Instruments for Renewable Energy 12
• Consumer willingness-to-pay for the consumption value of “clean en-ergy”, which is not fully expressed on the market:
11
These imperfections in the power market keep investments in RE below
the economically optimal level.
1.5 The supply side: Capital Market Imperfections in Develop-
ing Countries
The demand for RE finance in many LDCs faces severe constraints on
the supply side of the financial system in LDCs:
• Lack of funds and/or
• improper financial conditions, especially the maturity of credits and the requirement for collateral;
• Lack of instruments and shortcomings of local financial institutions,
• Lack of sector know-how and willingness to invest in RE, low level of awareness and understanding of the RE as well as insufficient information for prudent investment analysis.
1.5.1 Domestic Financial Markets – Potential for RET ?
With some simplifications, the current state of the capital markets in the
world12 can be summarized as follows:
• LDC-countries have a very low level of financial activities as they do not have much (idle) capital and do not attract much capital from abroad. RETs compete with all other sectors for very scarce local finance. Even for smaller off-grid investments it is difficult to reach financial closure without securing additional funds outside local bank and equity finance as part of the of technological package.
• Emerging markets with their access to international finance have much higher investment levels, both absolutely and as a percentage of GDP, but face problems of volatility of their and the international financial markets. This limits the availability of funds for long-term finance and during crisis pe-riods. Furthermore, domestic credit to the private sector per capita is still only $ 1149 in emerging markets, and only meager $ 113 in LDCs. The fig-ures for gross private capital flows and FDI are well below these amounts. Even with substantial progress in the deepening and development of these financial markets this indicates a general limited availability of funds for RET.
levels of uncertainty. Using lower discount factors for uncertain fuel costs increases the
NPV of these and thus, the cost of production per kWh of plants using these fuels. 11
The “consumption value” of “clean energy” refers to the premium on top of the retail price for electricity, which some consumers and politicians are willing to pay for the “sus-tainable energy” attributes of RE-based power supply. Part of the premium reflects will-ingness-to-pay for the environmental and portfolio values of RET. But a minority of con-sumers has a willingness to pay, which is higher than that, because they attach addi-tional value to the intrinsic quality of getting energy supply from “renewable” sources. This willingness to pay offers a niche market for marketing power supply from RETs as “green energy”. In some developing countries, there exists a small commercial demand for green power from firms exporting “clean products” and from a tiny fraction of domes-tic consumers. Yet, being positively correlated with GDP per capita, the consumption value of green electricity can be ignored in RE-strategies for developing countries. 12
See Annex for more details
Financing Instruments for Renewable Energy 13
The figures are an indication of the very limited volume of available
funds, and of the limited scope for developing and introducing new fi-
nancial instruments on these markets: It is difficult to introduce sophis-
ticated credit derivates when there are almost no credits!
1.5.2 Availability of financial instruments: Classification of standard
types of financial/capital markets
Thus for RET the barrier of financing depends much on the level and
type of (domestic) financial market. The ability to reduce the financial
barriers to the market penetration of RET depends on the availability of
(i) funds and (ii) of adequate financial and risk mitigation instruments.
New financing instruments are typically developed in mature financial
markets and find later application in other regions as their financial sys-
tems become more advanced.
Some emerging economies (e.g., Chile, Malaysia, and Mexico) have
domestic markets that can provide long-term, fixed-rate local currency
financing for infrastructure. Others (e.g., possibly India, Peru, and Brazil)
have emerging long-term debt markets, where interventions can be
made to extend the tenors available or to enable infrastructure projects
to access long-term debt (or currency swap) markets from which they
may otherwise have been excluded.13
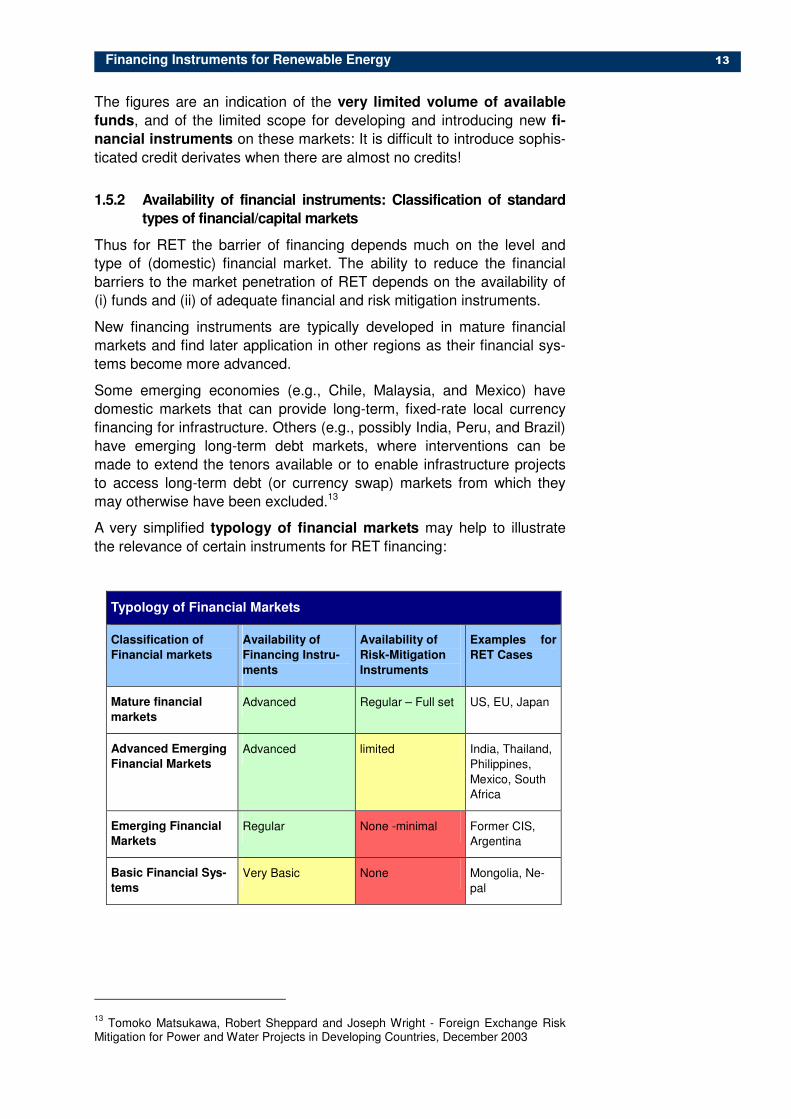
A very simplified typology of financial markets may help to illustrate
the relevance of certain instruments for RET financing:
Typology of Financial Markets
Classification of
Financial markets
Availability of
Financing Instru-
ments
Availability of
Risk-Mitigation
Instruments
Examples for
RET Cases
Mature financial
markets
Advanced Regular – Full set US, EU, Japan
Advanced Emerging
Financial Markets
Advanced limited India, Thailand,
Philippines,
Mexico, South
Africa
Emerging Financial
Markets Regular None -minimal Former CIS,
Argentina
Basic Financial Sys-
tems
Very Basic None Mongolia, Ne-
pal
13 Tomoko Matsukawa, Robert Sheppard and Joseph Wright - Foreign Exchange Risk
Mitigation for Power and Water Projects in Developing Countries, December 2003

Financing Instruments for Renewable Energy 14
Only the financial sectors of the advanced emerging markets offer an
almost full set of financial instruments, which in principle could be used
to solve the financing task for RE.
� In the markets of many LDCs there are only basic financial systems
with only a minimal set of financing instruments and generally with-
out any risk-mitigation instruments. Depending on the maturity of the
financial markets, there is a 3-dimensional gap of financing:
o Amount of funds,
o terms and conditions of funds and
o available financial Instruments.
1.5.3 A core problem: Absence of long-term finance
In many LDCs the private sector faces problem to get access to the
credit market at all, which due to limited long-term funds and the instabil-
ity of the market very seldom offers medium- and long-term funds. Abso-
lute dearth of loan or equity capital may prevent potential RE-projects
from even trying to reach financial closure.
Weak capital markets are not only a problem of access for finance for
RE itself, as they introduce a bias on the free market in favor of invest-
ments in fossil fuel based technologies. Because RETs are more capital
intensive than conventional power technologies, high interest rates,
short maturities and low gearing ratios14 shift the financial price per kWh
of RE upwards relative to conventional power.
The chart below summarizes the consequences of weak capital markets
for RE investments.
Consequences of Weak Capital Market for RE
Inability of long-term lending
Weak balance sheet of financial intermediaries Scarcity of equity capital
Insistence on 50% equiity co-finance
Insistence on 25-30% after-tax RORE
High rates of interest
Short amortisation periods High Cost of Capital
High kWh-tariff to cover amortization of loans and return on equity
Failure to compete with less capital intensive conventional power
14 In many developing countries, banks ask for a 50% equity co-finance

Financing Instruments for Renewable Energy 15
Donor assisted RE-projects in developing countries circumvent the
capital market problem by providing project finance in the form of donor
grants and concessional loans for RE. Local banks are used as on-
lending vehicles in this financing modality.15 The approach solves the
financing problem of RE on an individual project-by-project basis, but
does little to assist the development of a local capital market, which is
indispensable if a sustainable scaling-up of private investment in RETs is
to take place. This requires an autochthonous financing framework
where local equity investors and financial intermediaries play a pro-
active role in financing RET-projects. In recognition of this structural
weakness, donor finance is shifting from conventional project finance to
underwriting risk management instruments that enable local fi-
nance institutions to engage in active project lending.
However, taking into consideration the subsidiarity principle we should
start our analysis looking to which extent private finance is available for
RET to determine on the base of the results to which degree they may
need financial support by other instruments. In the next chapter we will
have a closer look on the commercial finance instruments and their po-
tential for RET, however with a focus on the larger projects of RET close
to market competitiveness and their problems to find adequate commer-
cial finance.
15 India was an exception with regard to use of national capital market institutions. Soft
loans from bilateral donors and multilateral banks are made available as credit lines for national development banks that pro-actively encourage RE-investments. The key insti-tution is IREDA (India Renewable Energy Development Agency, which is the main na-tional provider of finance for RE-projects. Local commercial banks, in turn, are drawn into RE-financing by the example of IREDA.
Financing Instruments for Renewable Energy 16
2 Commercial Financial Instruments for RE
The commercial private sector offers a vide variety of instruments for
financing and risk coverage which potentially could be used for RET fi-
nance. This chapter gives an overview of the instruments, their charac-
teristics and requirements, their suitability and the general availability for
RET, particularly in LDCs. The focus of this study is on the presentation
of instruments for medium and large sized RE projects, not on instru-
ments for financing of micro-sized projects, although they are not ex-
cluded totally.
As most of the LDCs do not have a very developed local financial sector
and are currently lacking many of the instruments presented below, it is
important to note, that in a process of globalization this does not mean,
that such mechanisms and instruments and funds could not be made
available for RE at all. Their contribution to overcome the hurdles of fi-
nancing of RE projects depend on the willingness to deal with risk and
invest funds as well as on the capability to use them for the realization of
RE projects. If this would still mean overstrain for the actors in some
countries, this may be an ideal case for external assistance to share this
burden in order to promote RE.16
2.1 Demand profile for RE financing
Finance is essential for RET projects in two ways: Without funds projects
would not materialize, with inadequate financing structure and conditions
the disadvantage in competitiveness of RET would even increase, as the
costs of electric power utilizing renewable energy technologies are
highly sensitive to financing terms. 17
As described above the typical demand for RE financing has the follow-
ing characteristics:
• Client: Investors, entrepreneurs or households with limited experience and track-record
• Type of funds: “patient capital”, either credit or equity or equivalent
• Amounts: Depending on project and RE type, from micro-finance till major project finance
• External Financing Share: High, due to limited own capital
• Maturity: Very Long term
16 See the Chapter 3 and Chapter 4 of this study.
17 Ryan Wiser and Steven Pickle created a financial cash-flow model that closely repli-
cates those used in the private power industry to evaluate the impact of financing vari-ables on overall project costs, in the context of mature financial markets in 1997. The model tracks revenues, expenses, debt payments, and taxes over a 20-year period and estimates an after-tax, net equity cash flow. The model then calculates the 20-year level-ized cost of electricity from the project being evaluated. See Wiser, Ryan and Pickle, Steve - Financing Investments in Renewable Energy: The Role of Policy Design and Restructuring, Berkeley 1997.
Financing Instruments for Renewable Energy 17
• Interest Rate: Lower Range of the market, due to limited return of invest-ment.
• Security and Collateral: Limited capacity for collateral, preferably on base of cash-flow
This profile sets the benchmark for checking to which extent the local
financial system with its funds and instruments can match the needs of
RE financing.
2.2 Types of Financial Instruments
Project developers generally can obtain capital for the up-front cost of
building a RE project through a debt and/or equity financing. There are
a large number of ways to structure loan agreements, and debt can be
obtained through public markets (bonds) or private placements (bank
loans and institutional debt).
Equity investors and lenders view and analyze projects (and firms) very
differently.
2.2.1 Equity Finance and Risk Capital
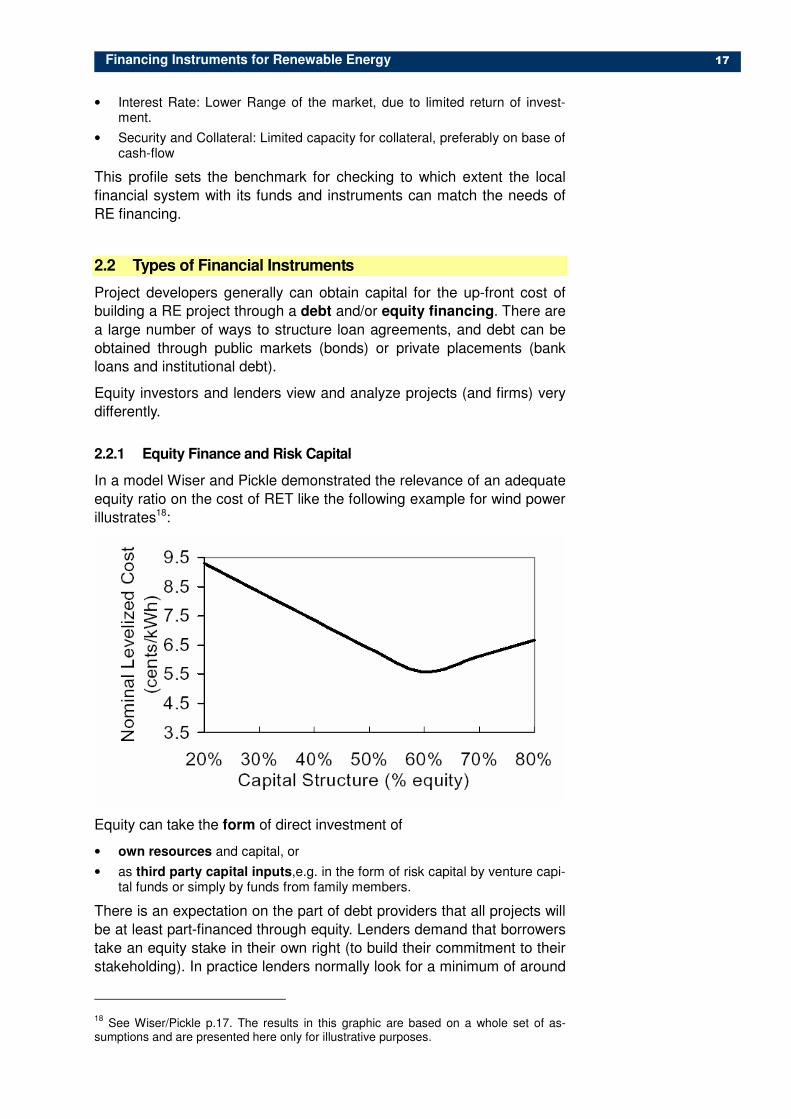
In a model Wiser and Pickle demonstrated the relevance of an adequate
equity ratio on the cost of RET like the following example for wind power
illustrates18:
Equity can take the form of direct investment of
• own resources and capital, or
• as third party capital inputs,e.g. in the form of risk capital by venture capi-tal funds or simply by funds from family members.
There is an expectation on the part of debt providers that all projects will
be at least part-financed through equity. Lenders demand that borrowers
take an equity stake in their own right (to build their commitment to their
stakeholding). In practice lenders normally look for a minimum of around
18 See Wiser/Pickle p.17. The results in this graphic are based on a whole set of as-
sumptions and are presented here only for illustrative purposes.
Financing Instruments for Renewable Energy 18
20% of the project cost to come in the form of borrower equity. RET with
higher risks are expected to have a corresponding higher equity ratio.
On the other hand, the typical project developer has only limited own
funds to make this essential contribution to the whole financial package.
This creates the need for the participation of additional investors in eq-
uity.
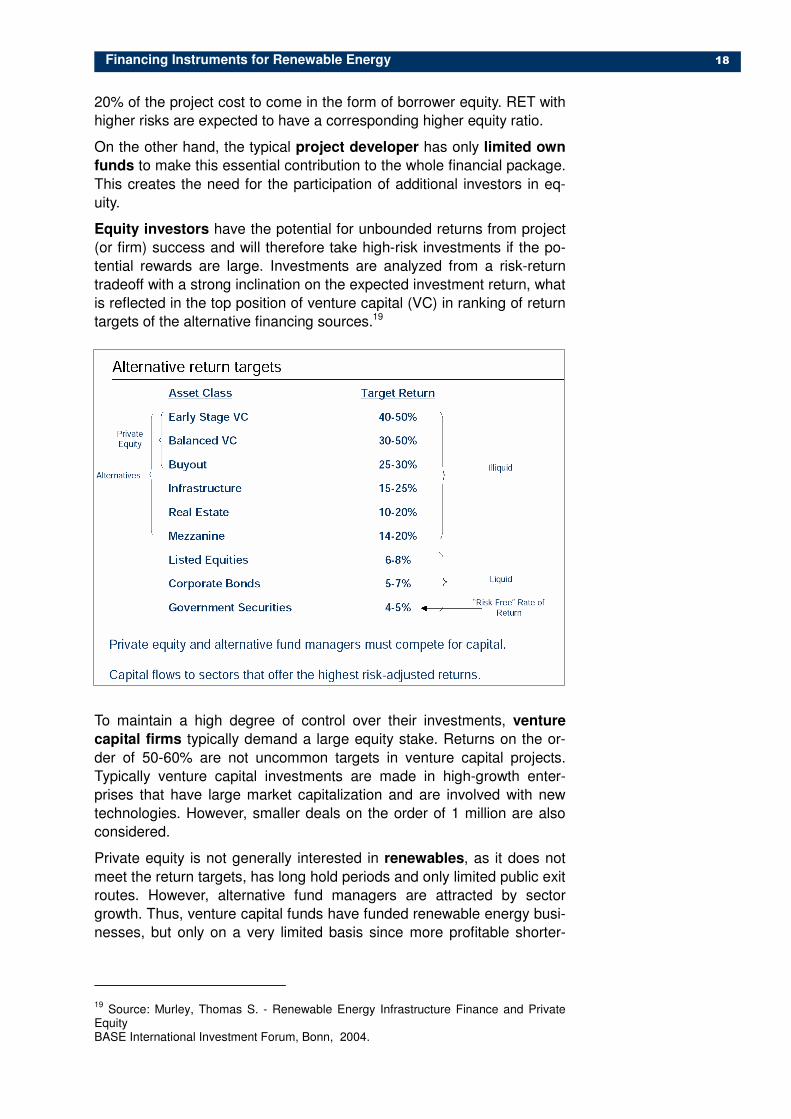
Equity investors have the potential for unbounded returns from project
(or firm) success and will therefore take high-risk investments if the po-
tential rewards are large. Investments are analyzed from a risk-return
tradeoff with a strong inclination on the expected investment return, what
is reflected in the top position of venture capital (VC) in ranking of return
targets of the alternative financing sources.19
To maintain a high degree of control over their investments, venture
capital firms typically demand a large equity stake. Returns on the or-
der of 50-60% are not uncommon targets in venture capital projects.
Typically venture capital investments are made in high-growth enter-
prises that have large market capitalization and are involved with new
technologies. However, smaller deals on the order of 1 million are also
considered.
Private equity is not generally interested in renewables, as it does not
meet the return targets, has long hold periods and only limited public exit
routes. However, alternative fund managers are attracted by sector
growth. Thus, venture capital funds have funded renewable energy busi-
nesses, but only on a very limited basis since more profitable shorter-
19 Source: Murley, Thomas S. - Renewable Energy Infrastructure Finance and Private
Equity BASE International Investment Forum, Bonn, 2004.
Financing Instruments for Renewable Energy 19
term opportunities abound elsewhere.20 They tend to be very selective: a
deal-closure-ratio on proposals of only 5% is not unusual. Core required
characteristics of RE to attract alternative investors are:
• Returns consistent with alternative assets classes with similar risk profiles: 14 – 20% IRR.
• Larger scale transactions - 5-10 million minimum investment.
• Ability to exit – within 10-15 years.
So although there is an instrument to cope with the shortage of own
capital in the financial sphere, this instrument is especially scarce in
LDCs as a consequence of the limited accumulation. In emerging mar-
kets experience has shown that there is a substantial potential for the
use of equity. However, RET has yet shown only limited success in at-
tracting these funds.
However, specialized equity funds have been created to invest in envi-
ronmentally and commercially sound energy companies providing equity
investment capital. Some are in the private sector (e.g. Triodos bank in
the Netherlands) and others are sponsored by the multilateral organiza-
tions (IFC, GEF).
2.2.2 Debt Financing
Classical debt financing is done with (fixed) interest rates and repay-
ment schedules, but in different ways by the source of finance:
• Conventional commercial bank loan, and credits are provided by other private persons or institutional investors. Loans and Credits as instruments are known and practiced all over the world. With the microfinance revolution credits have reached even the poorest in the most remote areas also in small-scale renewable energy project like Solar PV. However the higher the amount needed and the risk, the more difficult for RE projects to find ade-quate credits for their project. Here, RE projects have to face the same bar-rier which is common to many private enterprises, especially in LDCs.
• Bonds are interest-bearing instruments issued by companies and sold to investors in order to raise capital. They are usually issued and sold in the public bond markets, although increasingly some are sold directly to institu-tional investors in which case the financing is known as a "private place-ment". Although known for centuries, bonds still are a rather advanced in-strument, as they require either such institutional investors or a functioning capital market, both not self-evident in developing countries. Thus their relevance for most RET is rather limited.
Most lenders tend to be far more risk averse than equity investors. The
debt contract is a fixed obligation and the lender does not profit beyond
a certain level from project success.
• Unlike equity investors, lenders typically analyze a project (or firm) from a worst-case perspective. Thus RE project developers have to be very careful to shape and structure their project in a way, that even its worst case will still meet the requirements of the lenders. This requires a proper handling of risk instruments (see next sub-chapter).
• Up to the limit of unacceptable risk, lenders adjust (i.e. increase) debt inter-est rates and terms with increasing default risk.
20 APEC, Guidebook, p. 3-12
The dutch Triodos Bank is a social bank lending only to organisations and businesses with social and environmental objec-tives. Triodos Renewable Energy for Development Fund provides finance to promote and support the accessibility and use of renewable energy ser-vices in developing coun-tries.
The fund offers finance for importers, wholesal-ers, energy services companies and retail chains for expansion of working capital or for investments. Amounts may vary from Euro 100,000 – Euro 250,000.
For project developers the fund can provice seed capital. Funding will typically be limited to amounts of maximum Euro 50,000. However, the fund will not finance new technology devel-opment, but only proven technology.
www.triodos.com

Financing Instruments for Renewable Energy 20
In the US and Europe commercial banks have financed renewable
projects, however mainly in the wind sector, although they are looking for
opportunities in other areas, such as landfill gas and biomass. One ex-
ample is Fortis Bank, with a portfolio of € 1.4 billion in renewables, of
which 95% are for wind projects. This is a considerable amount, how-
ever it should be noted, it includes merely 18 projects,21 making clear
that the minimum size is rather elevated: €20 million is the minimum
size of project that a bank like Fortis is likely to consider, because of
transaction costs.22
In many LDCs banks are reluctant to extend long-term loans, however
sometimes offering instead a mid-term loan with a potential follow-up
finance at the end of the term. This creates the problem of higher amor-
tizations or the risk of follow-up financing. A third party liquidity guaran-
tee for the follow-up financing allows the extension of maturities to RE
compatible length by the up-front signing of a two step loan, of which the
first will be a bullet loan with an adequately adjusted repayment sched-
ule paid back mainly with a bullet at the end of its term. The bullet pay-
ment is refinanced by the second loan, which then has to be repaid with
annual payments till the end of the total maturity. Such an approach is
used in the Uganda West Nile Project with the assistance of World
Bank23.
2.2.3 "Mezzanine finance" and subordinated debt
Mezzanine Finance is a general term used to describe various financing
arrangements that rank below the senior debt. Subordinated debt is debt
that ranks below the main (senior) debt in terms of its priority of payment
or in liquidation. Its debt principal and interest is paid only after the sen-
ior debt principal and interest is paid. Private creditors using this instru-
ment are usually compensated for their higher loan risk by some partici-
pation in the profits or capital of the company. As most of the financiers
in developing countries perceive RET projects as higher risk, such a
mixed form financing would imply higher risk acceptance. As they al-
ready are hesitant to extend credits to RET it is not very likely that they
would provide “mezzanine finance”.
However, this approach used by promotional institutions could ease
some of the concerns private creditors may have going the risk to extend
a credit to a RET project as they would be privileged in debt service in
case of financial stress.
2.2.4 Sales-Lease-Back Arrangements for RE-Finance
Leasing is a potentially interesting instrument for financing private RE-
projects in developing countries:
21 Gardiner, Nick - Bank Financing for the Renewables Sector, SEFI Bonn 2004.
22 Finance and Investment: a challenge of scale, in: Renewable Energy World, Septem-
ber–October 2004. 23
See Case Presentation in Chapter 5 of this study

Financing Instruments for Renewable Energy 21
• Since the financing institution maintains ownership of the financed assets, the need for other collateral is largely eliminated.
• Local banks, which for various reasons may be able to provide short-term finance only, can be drawn into RE-financing in the initial project develop-ment stage.
A strong virtue of the lease-buy-back instrument is its flexibility. De-
pending on the situation in the country and the RE-project it can be ap-
plied in different ways. The upfront project development cost up to the
point of commissioning can be financed by the bank which subsequently
acts as lessor, by a different bank, by suppliers credits, or by a combina-
tion of all three. The lessor can be a bank or the off-taker of the power
supply if the power utility signing off the long-term PPA with the RE-
project has access to long-term finance at favorable conditions.
2.3 Financing Object: Corporate Finance and Project Finance
Financing a RE project generally can be done in two different structures:
financing for a project and financing to a project.
Personal and Corporate Finance are providing funds to an economic
subject, which can use it for the agreed purpose, for example a certain
project. The person or the company is the debtor, liable with their whole
property, especially the collateralized items of ‘on-balance sheet’ assets
or personal property. Balance sheet finance has the following character-
istics:
• Simplicity - it is relatively easy and quick to arrange
• Cost - it is usually cheaper in terms of arrangement and legal fees and the annual cost of borrowing may be lower
• Structure - it will normally reflect a looser, more flexible financing structure.
This includes consumer finance, often required for rural clients as a
means of making modern energy services affordable. Various types of
micro-credit schemes are now being deployed in the solar home system
market, for example, which often involve risk-sharing at the local and
institutional levels. However, the possibilities to use such instruments are
limited for RET-finance, as balance sheet financing for bigger RET pro-
jects may be considered as not viable/adequate by project sponsors and
potential financiers, both looking for a more tailored financial structure,
such as project finance.
Applying the central approach of structured finance of making use of a
special purpose entity (SPE), with project finance it is possible not
just giving funds for a project, but to a project itself, involving usually
the participation of several financing entities. This is also known as off-
balance sheet or non-recourse finance, since the financiers rely mostly
on the certainty of project cash flows to pay back the loan, not the cred-
itworthiness of the project sponsors. This seems to be a proper ap-
proach for RE, especially as RE projects in many cases imply the crea-
tion of a new entity anyway.
In this case banks provide funds to distinct, single-purpose companies.
From the developers point of view project financing has several advan-
tages to corporate financing. If there is a parent company loans are

Financing Instruments for Renewable Energy 22
generally non-recourse (sometimes limited-recourse) to it and therefore
do not have a substantial impact on the company’s balance sheet or
creditworthiness. There is another important advantage in the context of
many developing countries, as project finance would form not only the
adequate financial structure but together with the Special Project Vehicle
(SPV) also the necessary management structure to implement the pro-
ject. Structured Finance are non-standard lending arrangements custom-
ized to the needs of specific clients. However, although custom-tailored
suits are fitting perfect, they have their price. Thus, negative aspects of
project financing compared to corporate financing, include the large
transactions costs of arranging the various contracts, high legal fees,
higher debt costs, and a greater array of restrictive loan covenants and
of course the time needed to form such a complex structure. Non-
recourse lending has been used for large fossil-based and geothermal
power plants in Asia. In the case of large renewable energy projects,
resource risk is addressed by incorporating additional mechanisms such
as reserve accounts or contingent repayment schemes.
The following table presents a typical financial structure for a conven-
tional power project24 and illustrates the complexity of financial engineer-
ing for bigger projects even for well-known technology indicating the high
demands of the task for financing of bigger RET projects.
Typical Project Financing Structure for Conventional Power Project
Sources % of Project Costs Tenors
Foreign Export Credits 40% total project costs, and/or 85 % equipment costs
12 years, 3 years grace, slightly concessionary rates
Multilateral Agencies 10-15% credits & loan guarantees 12-15 years
Commercial Bank Debt 10% loans, 5-15 member bank syndi-cate
5-12 years
Multilateral Co-Financing Facilities
10% loans, umbrella for commercial banks reduces risk; participation limits may require co-financing
12-15 years
Local Bank Debt 10% loans in local currency for work-ing capital
5-8 years, 2 years grace, usually higher interest rates
Private Placements 10% loans, beyond what may be available for commercial banks
5-12 years
2.4 Financial Problems and potential solutions
Summarizing our analysis hitherto we could relate RE financing demand
profile and problems with the instruments offered by the different institu-
tions in the ideal financial sector in a simplified scheme:
24 Source: Dr. J. Michael Cobb - Global Infrastructure Financing. Sources & Structures,
IDC International Development Consultants, LLC, available at: http://www.idcworld.com/sources.htm
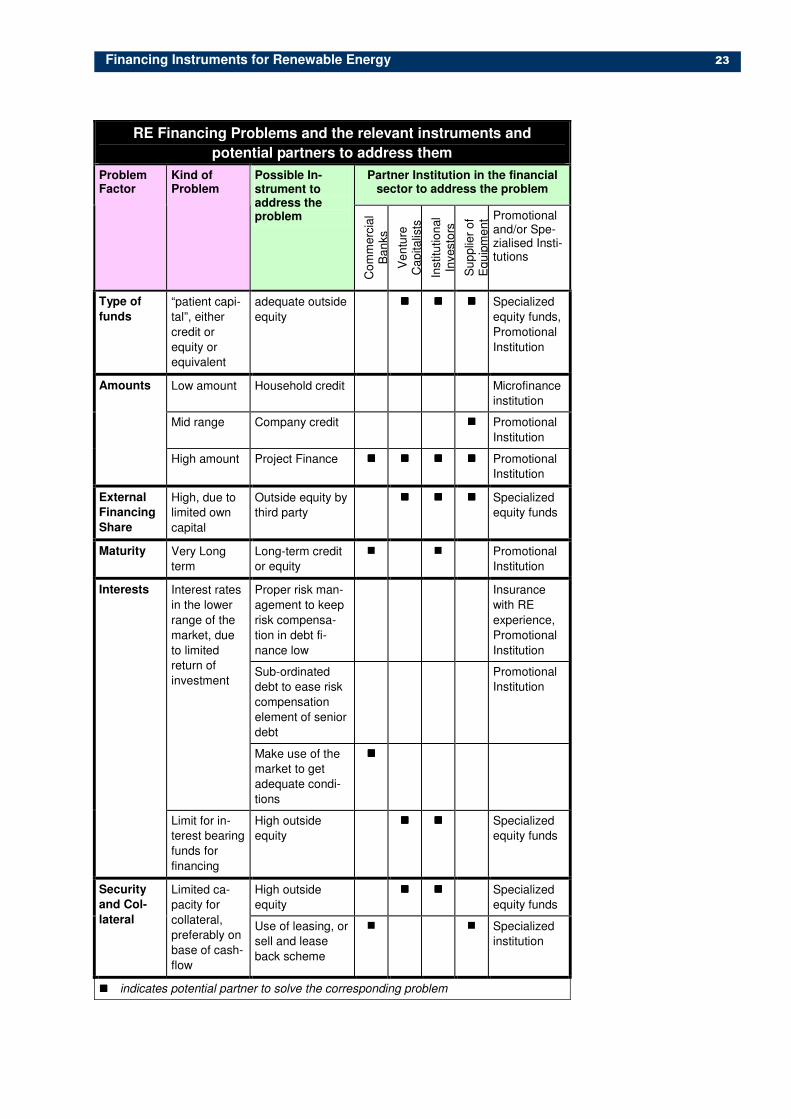
Financing Instruments for Renewable Energy 23
RE Financing Problems and the relevant instruments and
potential partners to address them
Partner Institution in the financial sector to address the problem
Problem Factor
Kind of Problem
Possible In-strument to address the problem
Co
mm
erc
ial
Ba
nks
Ve
ntu
re
Ca
pitalis
ts
Instit
utio
nal
Investo
rs
Su
pp
lier
of
Eq
uip
me
nt Promotional
and/or Spe-zialised Insti-tutions
Type of
funds
“patient capi-
tal”, either
credit or
equity or
equivalent
adequate outside
equity
���� ���� ���� Specialized
equity funds,
Promotional
Institution
Low amount Household credit Microfinance
institution
Mid range Company credit ���� Promotional
Institution
Amounts
High amount Project Finance ���� ���� ���� ���� Promotional
Institution
External
Financing
Share
High, due to
limited own
capital
Outside equity by
third party
���� ���� ���� Specialized
equity funds
Maturity Very Long
term
Long-term credit
or equity
� � Promotional
Institution
Proper risk man-
agement to keep
risk compensa-
tion in debt fi-
nance low
Insurance
with RE
experience,
Promotional
Institution
Sub-ordinated
debt to ease risk
compensation
element of senior
debt
Promotional
Institution
Interest rates
in the lower
range of the
market, due
to limited
return of
investment
Make use of the
market to get
adequate condi-
tions
����
Interests
Limit for in-
terest bearing
funds for
financing
High outside
equity
���� ���� Specialized
equity funds
High outside
equity
���� ���� Specialized
equity funds
Security
and Col-
lateral
Limited ca-
pacity for
collateral,
preferably on
base of cash-
flow
Use of leasing, or
sell and lease
back scheme
� � Specialized
institution
� � � � indicates potential partner to solve the corresponding problem

Financing Instruments for Renewable Energy 24
At first sight, it seems that there is a cure for most of the problems of RE
financing. However, this refers only to the ideal conditions in mature fi-
nancial markets, and even there some critical factors like high minimum
size for transactions, limited risk of projects and return expectations are
still barriers for many RE projects commercial financing. For RE financ-
ing in LDCs the conditions are even more difficult, as the following sub-
chapter shows.
2.5 Market Access: Types of finance and their availability
The different instruments and sources of finance presented are well
known in theory all over the world, but their accessibility depends on the
degree of development of the financial systems and the availability of the
corresponding capital. Summarizing and simplifying the following over-
view with its traffic lights colors indicates the degree of availability of fi-
nancial instruments for RE finance in the different stages of market de-
velopment:
Comments on the general availability of financial instruments (for
RET) in the commercial markets
Classification of Financial markets
Equity Credits Bonds Mezza-nine
Leasing
Mature finan-cial markets
Yes Yes, however with difficul-ties within the segment of extra-long maturities
Difficult, due to highlevel of transaction cost
Yes
Advanced Emerging Fi-nancial Mar-kets
Capital is not scarce in general, however, the venture capital mar-kets lacks formalization and accessi-bility
Yes, however only with mid- to long-term maturity (max. 8 years); only very limited schemes with RET ade-quate extra-long maturi-ties
Hardly avail-able due to highlevel of transaction cost and risk aversion of investors
Some schemes may be available by semi-commercial institutions
Emerging Fi-nancial Mar-kets
Limited, some venture capital schemes, however mainly orien-tated to mid-term invest-ment with an correspond-ing exit ap-proach
Yes, but limitations of amounts and only with mid- term maturity (max. about 5 years); no schemes with RET ade-quate (extra-)long maturi-ties
Practically not available due to high trans-action cost, risk aversion and volatility of markets
Some schemes may be available by semi-commercial institutions
Some finan-cial institu-tions provide leasing schemes (however mainly with limited amounts available
Basic Finan-cial Systems
Very Limited, due to lack of accumulated own funds and underde-veloped venture capital market
Only limited amounts with mid-term maturity;
Not available, if any mainly dominated by state bonds
As basic instruments are missing also no mix available commercially
Limited to international supplier leasing schemes
Financing Instruments for Renewable Energy 25
Thus the practical relevance of the many financial instruments is rather
limited in the commercial financial markets of the developing countries
for RET financing. We can identify some kind of development sequence
of financial instruments:
• Credits are used already at the earliest stages, and as an instrument are available for RE finance, although there may be (severe) limitations to the conditions and amounts depending on the stage of development of the local financial market.
• Leasing as an instrument can seldom be found in LDCs, but is already in use in emerging financial markets, offering some chances for RE finance.
• Equity and Mezzanine Finance becomes more common only in the more advanced emerging financial markets. In poorer countries the market will rarely offer these instruments and the corresponding funds.
• Although Bonds are in use in many emerging financial markets, there seems little chance to use this instrument on pure market base for RE fi-nance due to the risk aversion of the public as well and the high transaction cost. However, in a combination with a RE promotional tax scheme this in-strument could be made more attractive for the investors offering some po-tential for RE finance.
� As indicated also by the latter case, the local commercial financial
and capital markets are at least offering some interesting basic ele-
ments for a partial solution to the financing problems for RET, which
however need the completion by smart promotional instruments to
make them a viable path for RET finance.
� And as ODA and promotional finance of DFIs with lower expectations
for return and their higher risk disposition can potentially use each
and every of the described financial instruments, the described in-
struments can serve – together with the instruments in the next
chapter – as something like a toolbox for adequate RE financing
within promotional schemes.
Financing Instruments for Renewable Energy 26
3 Risk of RE and Instruments of the Financial Sector
Risk management is one of the keys to deployment of RE, as it influ-
ences the availability of commercial financing to the projects: As RE de-
pend on funds from lenders to implement the project, and the RE cost
and competitiveness depend on the terms and conditions of these funds,
which on the other hand are determined by lenders with their risk aware
perception, risk is one of the crucial factors for almost any RE project
financing.25 Thus, financial risk management instruments are an essen-
tial part of any financial structuring in infrastructure projects, yet their
application to RE hitherto has been limited especially in LDCs. Within
the scope of this study, this chapter can give only an overview about the
wide range of risk factors within RE projects and present an outline of
the generally available risk instruments. Within this context it would be
too ambitious to present every financial instrument in detail and to de-
velop a replicable blueprint for its utilization within for RE projects.26
Thus the chapter will focus on the most essential instruments at the pro-
ject level and present an approach for a risk strategy for RE.
3.1 Risks for RE projects
A RE-project essentially is just like every other project, with the excep-
tion that it is in many cases not competitive per se, it has a much more
complex structure and is more risky.27 Some simple truths about risk:
• As each and every factor of a project has a degree of uncertainty, all these factors represent a potential threat for the success of the project.
28
• For each of these risks some party has to take it, willingly or unwillingly, getting a premium or none.
• Although the theory of probabilities seems to reduce the problem to a sim-ple calculation of an expectation value to be taken into consideration for the computation of the expected return, it should be noted that such an ap-proach is based on the law of large numbers and may include the fatality for the single project under decision.
• Furthermore the financial market will require a risk premium, not only as compensation for any loss, but as payment for uncertainty itself. Additionally they will charge for their administration cost and their expected profit. With-out taking into consideration the utility functions the risk compensation pre-mium to be paid is higher than the simple statistical expected value of loss.
• Greater uncertainty means that less debt capital, if any at all, will be avail-able.
25 Important aspects of this factor in RE Finance have been presented in detail in two
recent studies: Olivier, E. - Survey of Contingent Financing & Risk Mitigation Instruments for Clean Infrastructure Projects, November 2003; UNEP - Financial Risk Management Instruments for Renewable Energy Projects, Summary Document, 2004. 26
As mentioned earlier some of these aspects will be covered in the study “Assessment of Financial Risk Management Instruments for Renewable Energy” to be implemented by UNEP in co-operation with the World Bank and UNDP from 2005-2007. 27
Walid Musallam - International Private Hydro Power Development and Risk Manage-ment, 2000 28
See: Ole Langniß (ed.), and others (1999). Financing renewable energy systems, Stuttgart 1999.
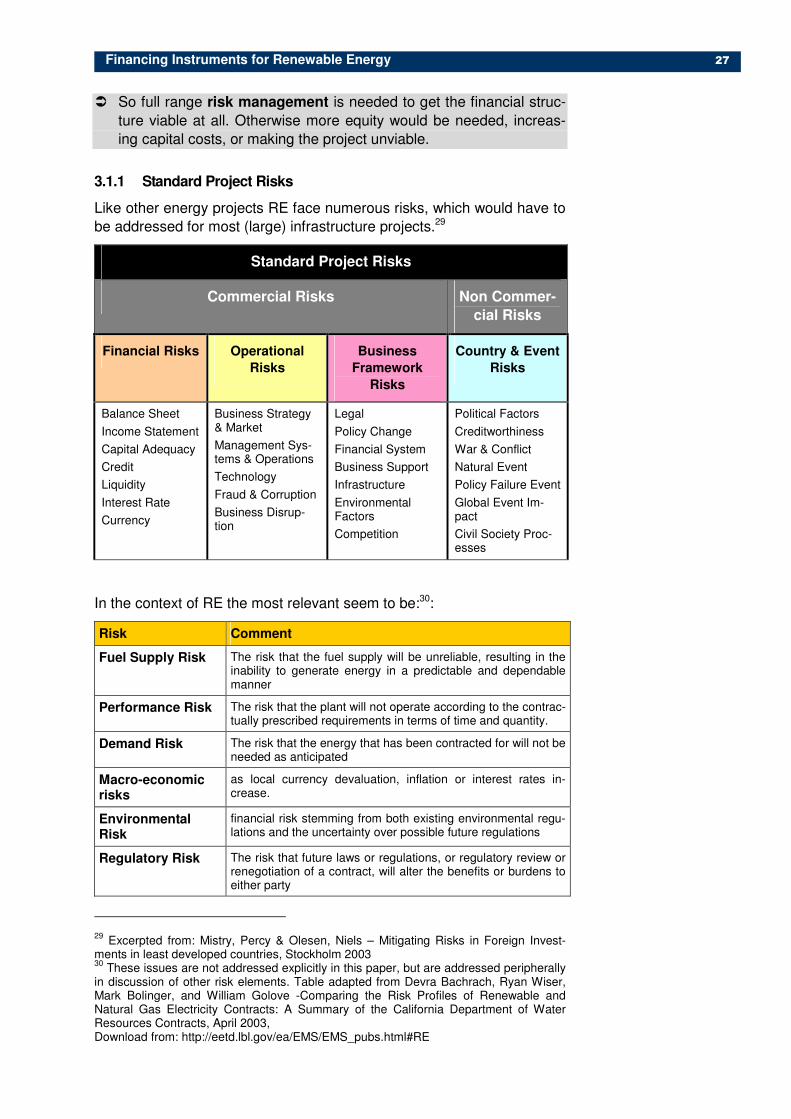
Financing Instruments for Renewable Energy 27
� So full range risk management is needed to get the financial struc-
ture viable at all. Otherwise more equity would be needed, increas-
ing capital costs, or making the project unviable.
3.1.1 Standard Project Risks
Like other energy projects RE face numerous risks, which would have to
be addressed for most (large) infrastructure projects.29
Standard Project Risks
Commercial Risks Non Commer-
cial Risks
Financial Risks Operational
Risks
Business
Framework
Risks
Country & Event
Risks
Balance Sheet
Income Statement
Capital Adequacy
Credit
Liquidity
Interest Rate
Currency
Business Strategy & Market
Management Sys-tems & Operations
Technology
Fraud & Corruption
Business Disrup-tion
Legal
Policy Change
Financial System
Business Support
Infrastructure
Environmental Factors
Competition
Political Factors
Creditworthiness
War & Conflict
Natural Event
Policy Failure Event
Global Event Im-pact
Civil Society Proc-esses
In the context of RE the most relevant seem to be:30:
Risk Comment
Fuel Supply Risk The risk that the fuel supply will be unreliable, resulting in the inability to generate energy in a predictable and dependable manner
Performance Risk The risk that the plant will not operate according to the contrac-tually prescribed requirements in terms of time and quantity.
Demand Risk The risk that the energy that has been contracted for will not be needed as anticipated
Macro-economic risks
as local currency devaluation, inflation or interest rates in-crease.
Environmental Risk
financial risk stemming from both existing environmental regu-lations and the uncertainty over possible future regulations
Regulatory Risk The risk that future laws or regulations, or regulatory review or renegotiation of a contract, will alter the benefits or burdens to either party
29 Excerpted from: Mistry, Percy & Olesen, Niels – Mitigating Risks in Foreign Invest-
ments in least developed countries, Stockholm 2003 30
These issues are not addressed explicitly in this paper, but are addressed peripherally in discussion of other risk elements. Table adapted from Devra Bachrach, Ryan Wiser, Mark Bolinger, and William Golove -Comparing the Risk Profiles of Renewable and Natural Gas Electricity Contracts: A Summary of the California Department of Water Resources Contracts, April 2003, Download from: http://eetd.lbl.gov/ea/EMS/EMS_pubs.html#RE
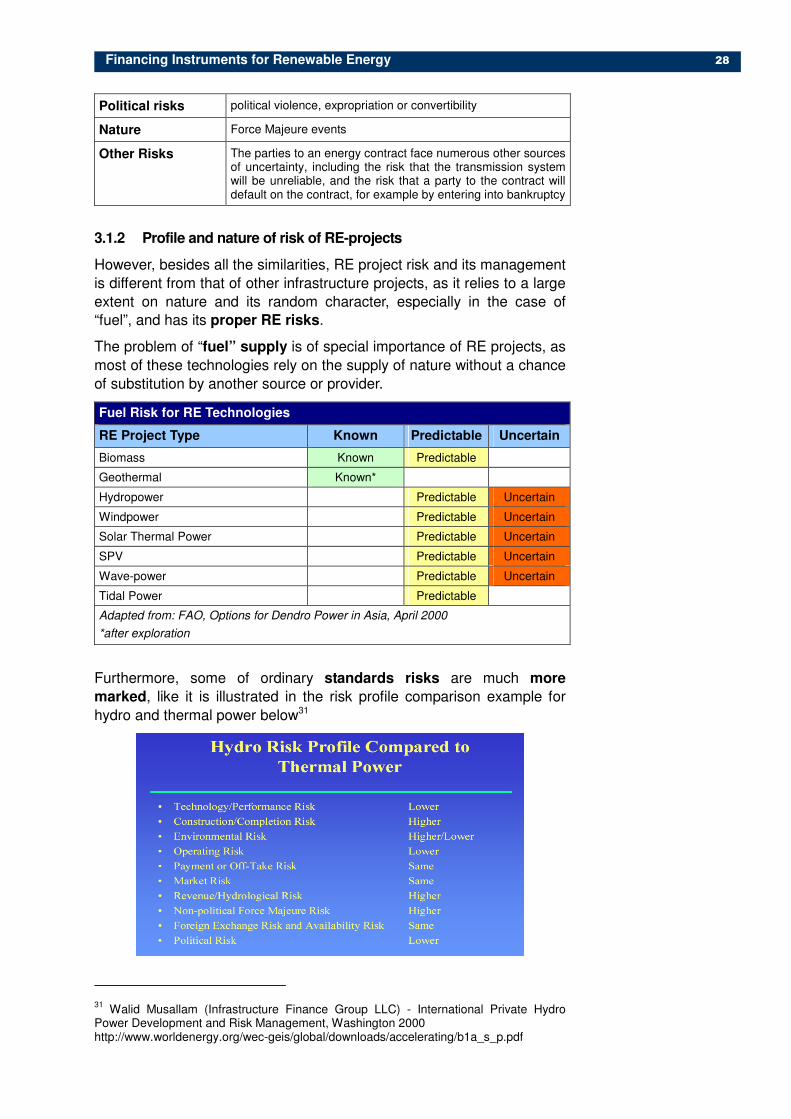
Financing Instruments for Renewable Energy 28
Political risks political violence, expropriation or convertibility
Nature Force Majeure events
Other Risks The parties to an energy contract face numerous other sources of uncertainty, including the risk that the transmission system will be unreliable, and the risk that a party to the contract will default on the contract, for example by entering into bankruptcy
3.1.2 Profile and nature of risk of RE-projects
However, besides all the similarities, RE project risk and its management
is different from that of other infrastructure projects, as it relies to a large
extent on nature and its random character, especially in the case of
“fuel”, and has its proper RE risks.
The problem of “fuel” supply is of special importance of RE projects, as
most of these technologies rely on the supply of nature without a chance
of substitution by another source or provider.
Fuel Risk for RE Technologies
RE Project Type Known Predictable Uncertain
Biomass Known Predictable
Geothermal Known*
Hydropower Predictable Uncertain
Windpower Predictable Uncertain
Solar Thermal Power Predictable Uncertain
SPV Predictable Uncertain
Wave-power Predictable Uncertain
Tidal Power Predictable
Adapted from: FAO, Options for Dendro Power in Asia, April 2000
*after exploration
Furthermore, some of ordinary standards risks are much more
marked, like it is illustrated in the risk profile comparison example for
hydro and thermal power below31
31 Walid Musallam (Infrastructure Finance Group LLC) - International Private Hydro
Power Development and Risk Management, Washington 2000 http://www.worldenergy.org/wec-geis/global/downloads/accelerating/b1a_s_p.pdf

Financing Instruments for Renewable Energy 29
Other standard risks may not be covered by an insurance company
because of a general reluctance to deal with RE under the concrete cir-
cumstances.
Moreover, as a playground of promotion and politics RE is extremely
exposed to changes in these which may take place between the time the
investment is made and the time at which invested capital is fully repaid
from project cash flows.
Furthermore many of RE technologies face additionally their specific
typical risks:
Typical RE risks of the different RE technologies
RE type Key Risk Issues
Geothermal • Drilling expense and associated risk (e.g. blow out )
• Exploration risk (e.g. unexpected temperature and flow rate)
• Critical components failures such as pumps breakdowns
• Long lead times (e.g. planning consents)
Large PV • Component breakdowns
• Weather damage
• Theft / vandalism
Solarthermal • Prototypical / technology risks as project sizes increase and
combine with other RET e.g. solar towers
Small hydro-
power
• Flooding
• Seasonal / annual resource variability
• Prolonged breakdowns due to offsite monitoring (long re-sponse time)
Windpower • High upfront costs
• Critical component failures
• Wind resource variability
• Offshore cable laying
Biomass
power
• Fuel supply availability / variability
• Resource price variability
• Environmental liabilities associated with fuel handling and storage
Biogas power
• Resource risk
• Planning opposition associated with odor problems
Tidal/wave
power
• Survivability in harsh marine environments
• Prototypical / technology risks, Various designs and con-cepts but with no clear winner at present
• Small scale and long lead times
Source: UNEP - Financial Risk Management Instruments for Renewable Energy Pro-
jects, Summary Document, 2004
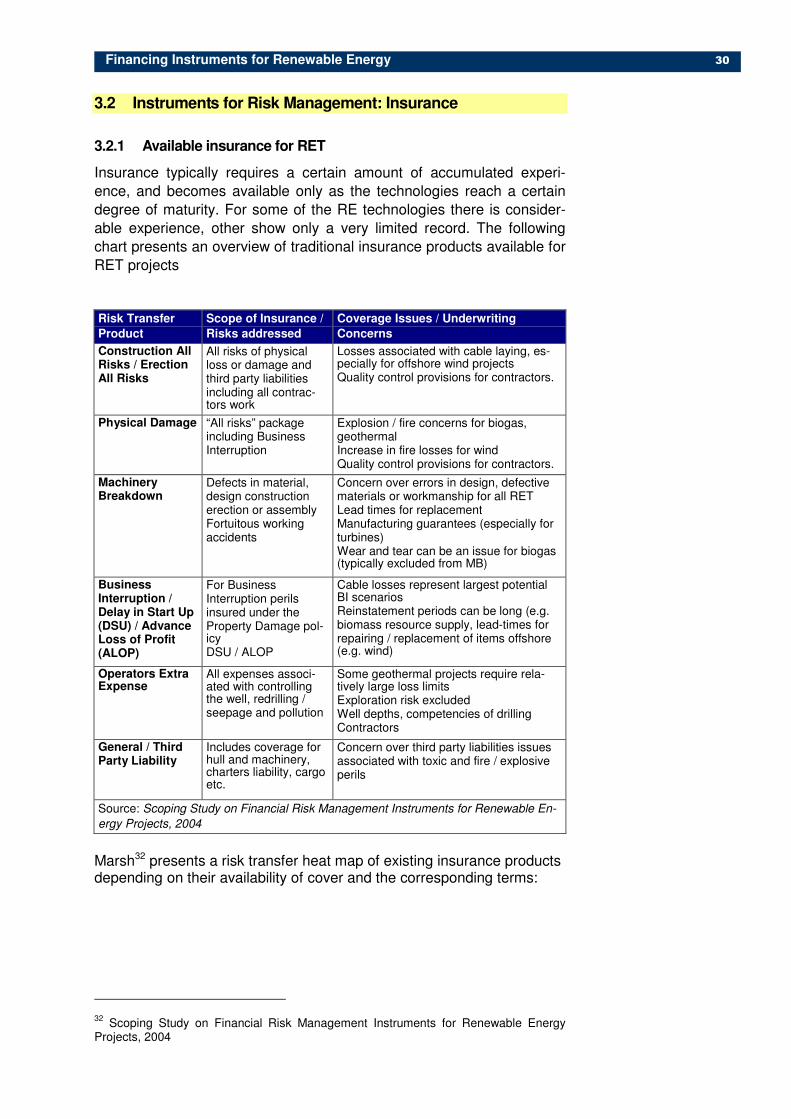
Financing Instruments for Renewable Energy 30
3.2 Instruments for Risk Management: Insurance
3.2.1 Available insurance for RET
Insurance typically requires a certain amount of accumulated experi-
ence, and becomes available only as the technologies reach a certain
degree of maturity. For some of the RE technologies there is consider-
able experience, other show only a very limited record. The following
chart presents an overview of traditional insurance products available for
RET projects
Risk Transfer
Product
Scope of Insurance /
Risks addressed
Coverage Issues / Underwriting
Concerns
Construction All Risks / Erection All Risks
All risks of physical loss or damage and third party liabilities including all contrac-tors work
Losses associated with cable laying, es-pecially for offshore wind projects
Quality control provisions for contractors.
Physical Damage “All risks” package including Business Interruption
Explosion / fire concerns for biogas, geothermal Increase in fire losses for wind Quality control provisions for contractors.
Machinery Breakdown
Defects in material, design construction erection or assembly Fortuitous working accidents
Concern over errors in design, defective materials or workmanship for all RET Lead times for replacement Manufacturing guarantees (especially for turbines) Wear and tear can be an issue for biogas (typically excluded from MB)
Business Interruption / Delay in Start Up (DSU) / Advance Loss of Profit (ALOP)
For Business Interruption perils insured under the Property Damage pol-icy DSU / ALOP
Cable losses represent largest potential BI scenarios Reinstatement periods can be long (e.g. biomass resource supply, lead-times for repairing / replacement of items offshore (e.g. wind)
Operators Extra Expense
All expenses associ-ated with controlling the well, redrilling / seepage and pollution
Some geothermal projects require rela-tively large loss limits Exploration risk excluded Well depths, competencies of drilling Contractors
General / Third Party Liability
Includes coverage for hull and machinery, charters liability, cargo etc.
Concern over third party liabilities issues associated with toxic and fire / explosive perils
Source: Scoping Study on Financial Risk Management Instruments for Renewable En-
ergy Projects, 2004
Marsh32 presents a risk transfer heat map of existing insurance products depending on their availability of cover and the corresponding terms:
32 Scoping Study on Financial Risk Management Instruments for Renewable Energy
Projects, 2004
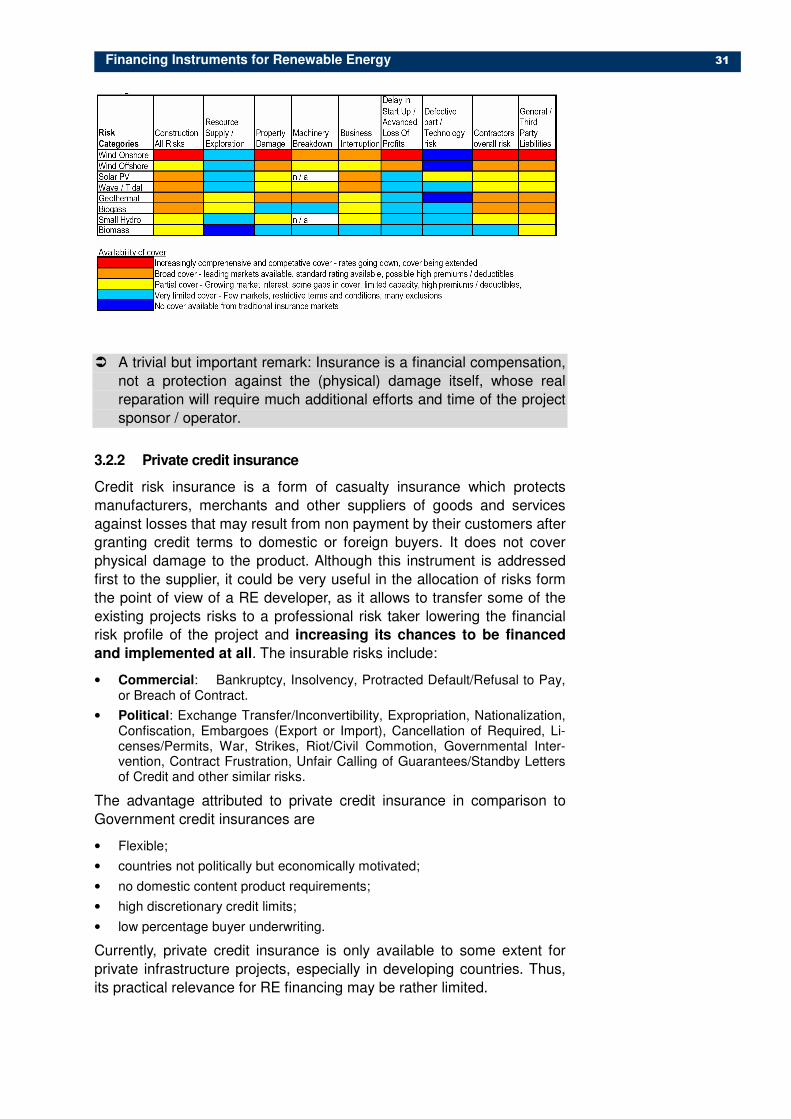
Financing Instruments for Renewable Energy 31
� A trivial but important remark: Insurance is a financial compensation,
not a protection against the (physical) damage itself, whose real
reparation will require much additional efforts and time of the project
sponsor / operator.
3.2.2 Private credit insurance
Credit risk insurance is a form of casualty insurance which protects
manufacturers, merchants and other suppliers of goods and services
against losses that may result from non payment by their customers after
granting credit terms to domestic or foreign buyers. It does not cover
physical damage to the product. Although this instrument is addressed
first to the supplier, it could be very useful in the allocation of risks form
the point of view of a RE developer, as it allows to transfer some of the
existing projects risks to a professional risk taker lowering the financial
risk profile of the project and increasing its chances to be financed
and implemented at all. The insurable risks include:
• Commercial: Bankruptcy, Insolvency, Protracted Default/Refusal to Pay, or Breach of Contract.
• Political: Exchange Transfer/Inconvertibility, Expropriation, Nationalization, Confiscation, Embargoes (Export or Import), Cancellation of Required, Li-censes/Permits, War, Strikes, Riot/Civil Commotion, Governmental Inter-vention, Contract Frustration, Unfair Calling of Guarantees/Standby Letters of Credit and other similar risks.
The advantage attributed to private credit insurance in comparison to
Government credit insurances are
• Flexible;
• countries not politically but economically motivated;
• no domestic content product requirements;
• high discretionary credit limits;
• low percentage buyer underwriting.
Currently, private credit insurance is only available to some extent for
private infrastructure projects, especially in developing countries. Thus,
its practical relevance for RE financing may be rather limited.
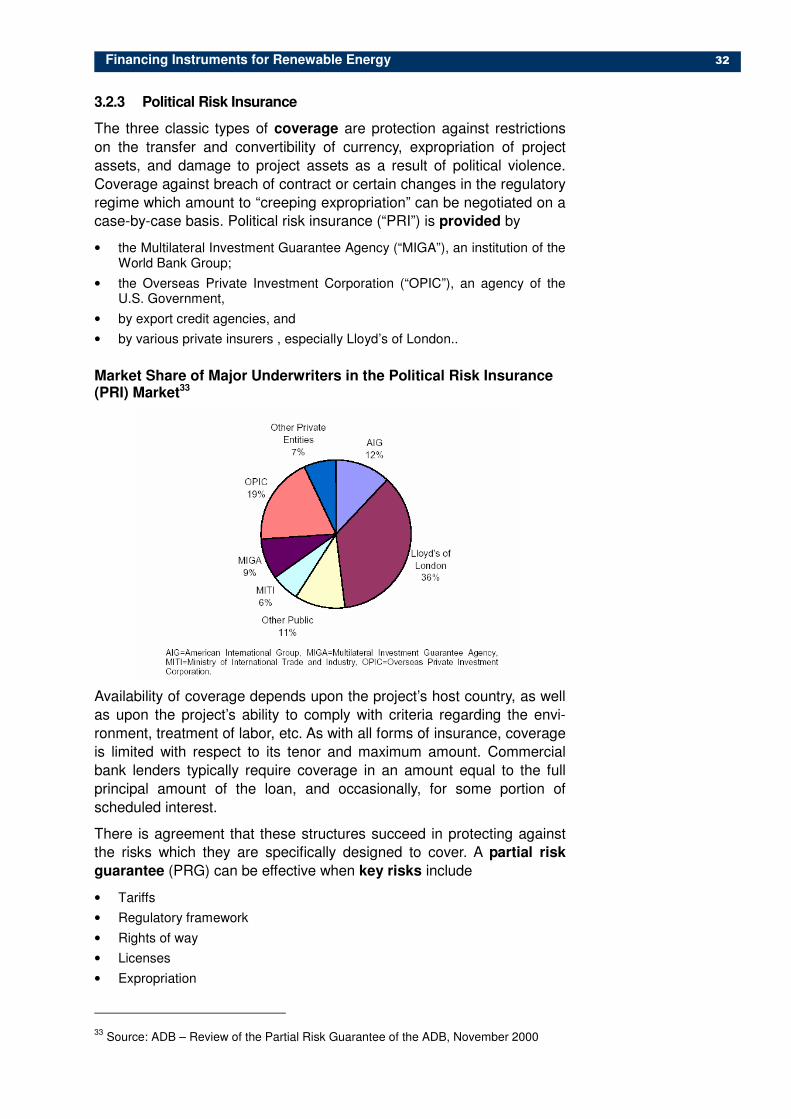
Financing Instruments for Renewable Energy 32
3.2.3 Political Risk Insurance
The three classic types of coverage are protection against restrictions
on the transfer and convertibility of currency, expropriation of project
assets, and damage to project assets as a result of political violence.
Coverage against breach of contract or certain changes in the regulatory
regime which amount to “creeping expropriation” can be negotiated on a
case-by-case basis. Political risk insurance (“PRI”) is provided by
• the Multilateral Investment Guarantee Agency (“MIGA”), an institution of the World Bank Group;
• the Overseas Private Investment Corporation (“OPIC”), an agency of the U.S. Government,
• by export credit agencies, and
• by various private insurers , especially Lloyd’s of London..
Market Share of Major Underwriters in the Political Risk Insurance (PRI) Market33
Availability of coverage depends upon the project’s host country, as well
as upon the project’s ability to comply with criteria regarding the envi-
ronment, treatment of labor, etc. As with all forms of insurance, coverage
is limited with respect to its tenor and maximum amount. Commercial
bank lenders typically require coverage in an amount equal to the full
principal amount of the loan, and occasionally, for some portion of
scheduled interest.
There is agreement that these structures succeed in protecting against
the risks which they are specifically designed to cover. A partial risk
guarantee (PRG) can be effective when key risks include
• Tariffs
• Regulatory framework
• Rights of way
• Licenses
• Expropriation
33 Source: ADB – Review of the Partial Risk Guarantee of the ADB, November 2000

Financing Instruments for Renewable Energy 33
• Termination amounts
• Interference in arbitration process
• Rule of law.
Partial risk guarantees are typically provided by multilateral agencies
and, as the name implies, cover a portion of the financing for which they
provide support. With the exception of hydropower there have not been
a large number of these transactions for RE.
A PRG is not only a instrument for mitigation of project risk, but also an
instrument to enhance creditworthiness, improve lending terms, en-
couraging risk sharing and providing additional leverage with the gov-
ernment. The following charts illustrates the catalytic impact on the ac-
cess to private finance:
• PRG attracts funds in considerable amounts, as each dollar of guarantee catalyzes close to 5 dollars of private finance
34:
• Equally important: the funds have more sustainable terms, i.e. longer ma-turities and lower interest rates, which are crucial for RE
35:
0 500 1000 1500 2000
China Yangzhou
Philippines Leyte
Pakistan Hub
China Zheijiang
Jordan Telecom
China Ertan
Pakistan Uch
Lebanon Power
Morocco Jorf Lasfar
Thailand EGAT
Cote d'Ivoire Power
Argentina PBG
Colombia PBG
Bangladesh Haripur
Vietnam Phu My 2-2
US$ Million
Guaranteed Amount
Private Capital Mobilized
PRG impact on Maturities
5
1
1
16
14
14
12
0
Vietnam
Uganda
Bangladesh
Cote d'Ivoire
Without With PRG
PRG impact on Interest Spread
5
3
3
2
3,1
2
2,75
8
Vietnam
Uganda
Bangladesh
Cote d'Ivoire
Without With PRG

Financing Instruments for Renewable Energy 34
The World Bank offers a partial risk guarantee to cover debt service
defaults on a loan to a private sector project caused by a government's
failure to meet its contractual obligations related to a private project. The
principal categories of risks covered by the guarantee are:
• Breach of Contract
• Availability and Convertibility of Foreign Exchange
• Changes in Law
• Expropriation and nationalization
With respect to RET it is important to note, that PRGs can be used for a
series of smaller projects with an intermediary for the retail of partial risk
guarantees and help access private finance at improved terms. The
World Bank charges a standby fee, a guarantee fee, and a front-end fee
to provide a guarantee.36
34 Adapted from: Babbar, Suman – Infrastructure Financing. Growing risk aversion in
emerging markets and the need for risk mitigation Workshop on Tools for Risk Mitigation in Small-scale Clean Infrastructure Projects, November 19, 2003 35
See above.
36 Source: IBRD - Catalyzing private finance: The relevance of World Bank Guarantees at time of
risk aversion. The contractual guarantee fee is equal to the contractual lending spread on IBRD
loans prevailing at the time guarantee is approved by the Board (currently 75 bp per annum), and
remains same for the term of the guarantee. At the date of each fee payment, private sector bor-
rowers pay the contractual guarantee fee, plus a premium of up to 25 bp per annum. The premium
depends on the scope of risk coverage provided under the guarantee. The initiation and processing
fees will only be charged in the case of private sector borrowers, and applies to loans and guaran-
tees. The Bank charges the borrower a one-time initiation fee of 0.15% or US$100,000 (whichever
is higher) of the guaranteed debt; payable as a condition of guarantee effectiveness. The Bank also
charges a processing fee of up to 0.50% of the guaranteed debt to generally cover the cost of ex-
ternal consultants and out of pocket expenses that the Bank incurs for the transaction, if any. A
front-end fee of 1%, if applicable to IBRD loans, applies to all IBRD guarantees. The fee is charged
in full as a condition of guarantee effectiveness. The fee is charged on Bank´s maximum exposure
under the guarantee.
OrPower 4 Inc. involves
the design, construction
and operation of a 48
MW geothermal power
plant, located in the Ol-
karia geothermal fields,
in Kenya’s Rift Valley.
In 2002 MIGA has pro-
vided Ormat Holding
Corp. of the Cayman
Islands with a $70 million
guarantee to cover its
equity investment and
shareholder loan totaling
$171 million, in OrPower
4 Inc. in Kenya, as well
as future loans to the
project.
The coverage is against
the risks of transfer re-
striction, expropriation,
war and civil disturbance
and breach of contract,
and is for a period of 14
years.
http://www.ormat.com/ne

Financing Instruments for Renewable Energy 35
MIGA provides investment guarantees against certain non-commercial
risks (i.e., political risk insurance) to eligible foreign investors for quali-
fied investments in developing member countries.
• MIGA insures new cross-border investments originating in any MIGA mem-ber country, destined for any other developing member country.
• Types of foreign investments that can be covered include equity, share-holder loans, and shareholder loan guaranties, provided the loans have a minimum maturity of three years.
• Equity investments can be covered up to 90 percent, and debt up to 95 percent, with coverages typically available for up to 15 years, and in some cases, for up to 20. MIGA may insure up to $200 million.
• Pricing is determined on the basis of both country and project risk, with the effective price varying depending on the type of investment and industry sector. The investor has the option to cancel a policy after three years, however MIGA may not cancel the coverage.
One of the main differences between a MIGA guarantee and a World
Bank partial risk guarantee is that the World Bank requires a counter-
guarantee of the host government; also, the World Bank only insures
debt instruments, while MIGA covers equity as well.37 Although MIGA
does not require a counter-guarantee, it does request host country ap-
proval before issuing a guarantee. MIGA can insure investments in pro-
jects with or without the involvement of another member of the World
Bank Group.
To date, ECA’s have little experience with RE support for various rea-
sons. The G8 Renewable Energy Task Force mentioned in its report38,
that less than 5% of the ECA covers for energy projects were related to
RET. However, ECA staff pointed out that this result is demand driven.
� However, potentially there is a larger role in RET financing for these
bilateral insurers to play in future when adequate projects are pre-
sented. ECAs can potentially act as bridges to help mobilize the
commercial and concessional financing the RETF identified as nec-
essary.
For ECAs to play this bridging role, however, will require governments to
renegotiate an adaptation of Guidelines for ECAs, for example to include
renewable energy in the list for more favorable repayment terms for par-
ticular sectors,39 such as aviation, nuclear power and dams, as they also
have particular financing requirements.
3.2.4 Weather insurance/ Weather derivatives
Weather hedges, or derivatives, protect a range of industries against
weather-related damages, most notably in the agriculture and energy
sectors.
37 http://www.worldbank.org/html/fpd/guarantees/
38 G8 Renewable Energy Task Force, Final Report, 2001. p.37 and Crescencia Maurer
with Ruchi Bhandari – The Climate for Export Credit Agencies, May 2000 and Crescen-cia Maurer - The Transition from Fossil to Renewable Energy Systems: What Role for Export Credit Agencies?, Berlin 2003 39
These sector arrangements essentially allow extended repayment periods of 12 to 15 years for nuclear power projects and dams.
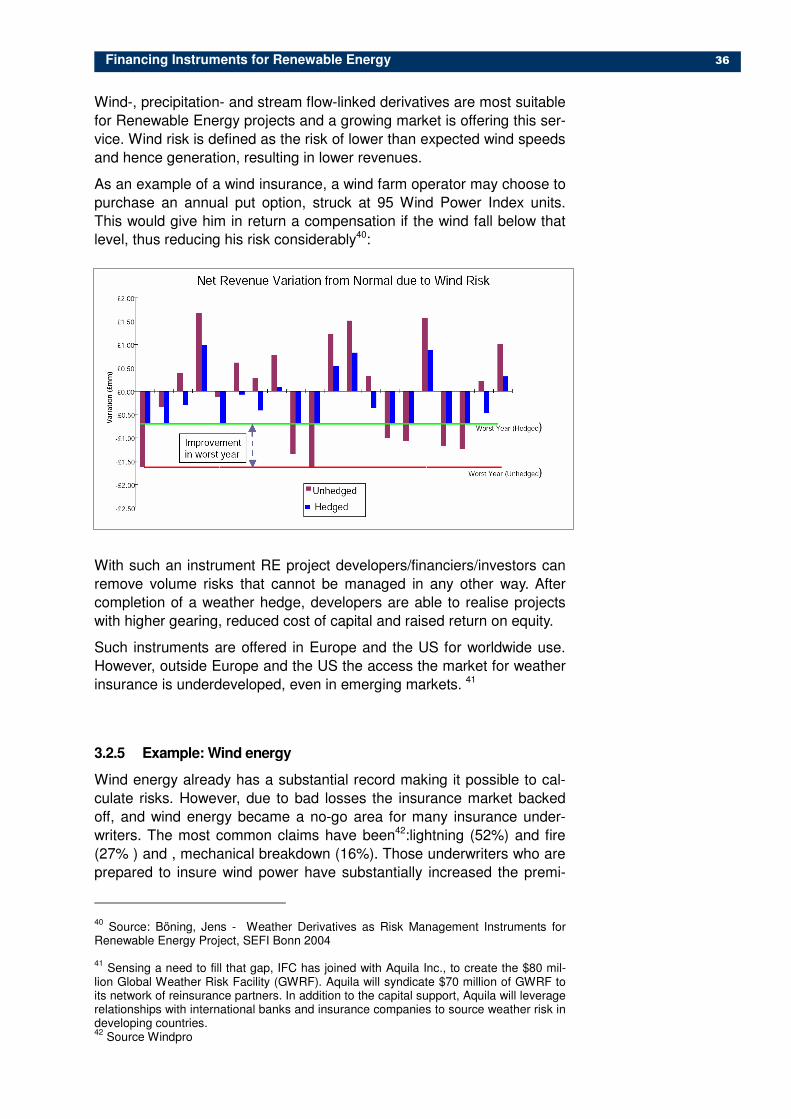
Financing Instruments for Renewable Energy 36
Wind-, precipitation- and stream flow-linked derivatives are most suitable
for Renewable Energy projects and a growing market is offering this ser-
vice. Wind risk is defined as the risk of lower than expected wind speeds
and hence generation, resulting in lower revenues.
As an example of a wind insurance, a wind farm operator may choose to
purchase an annual put option, struck at 95 Wind Power Index units.
This would give him in return a compensation if the wind fall below that
level, thus reducing his risk considerably40:
With such an instrument RE project developers/financiers/investors can
remove volume risks that cannot be managed in any other way. After
completion of a weather hedge, developers are able to realise projects
with higher gearing, reduced cost of capital and raised return on equity.
Such instruments are offered in Europe and the US for worldwide use.
However, outside Europe and the US the access the market for weather
insurance is underdeveloped, even in emerging markets. 41
3.2.5 Example: Wind energy
Wind energy already has a substantial record making it possible to cal-
culate risks. However, due to bad losses the insurance market backed
off, and wind energy became a no-go area for many insurance under-
writers. The most common claims have been42:lightning (52%) and fire
(27% ) and , mechanical breakdown (16%). Those underwriters who are
prepared to insure wind power have substantially increased the premi-
40 Source: Böning, Jens - Weather Derivatives as Risk Management Instruments for
Renewable Energy Project, SEFI Bonn 2004 41
Sensing a need to fill that gap, IFC has joined with Aquila Inc., to create the $80 mil-lion Global Weather Risk Facility (GWRF). Aquila will syndicate $70 million of GWRF to its network of reinsurance partners. In addition to the capital support, Aquila will leverage relationships with international banks and insurance companies to source weather risk in developing countries. 42
Source Windpro

Financing Instruments for Renewable Energy 37
ums and deductibles levels. But now insurance brokers are coming up
with some creative solutions and doing a lot of awareness raising. Risk
sharing is also helping. Brokers say that many underwriters will typically
syndicate a risk. 43 One of the most complete insurance solutions is of-
fered by Windpro (see box). WindPro is a facility underwritten by certain
underwriters at Lloyd's and other insurers.
3.3 Financial instruments for project risk management
The financial world has developed a series of more complex and sophis-
ticated structures to manage the structural challenges. Some of these
instruments have already been used for RE-financing addressing the
problems of big debtor risk and foreign exchange risk. However, due
their transaction cost and structure such approaches only would make
sense for RE projects with larger project financing structures.
3.3.1 Contingent Capital
Contingent capital structures ensure the availability of committed finance
to the risk seller in circumstances where a loss event occurs. As it is al-
ready difficult to find a private investor to take the risk of the first financ-
ing there is hardly any supply in the commercial market of the develop-
ing countries to step in with contingent finance.
� However this instrument would be a very appropriate tool for promo-
tional agencies to cover the risk a private investor would otherwise
deter from financing RET projects. It is clear, that this requires are
very precise and solid definition of risk trigger and the coverage.
3.3.2 Pledge of Shares
As a special collateral serves a pledge of shares for start-up capital.
Private investors sometimes need a pledge over other shares in a com-
43 JESSICA McCALLIN and FRASER McLACHLAN. - Wind power, risk and finance.
Can the wind industry get a better deal from insurers? Renewable energy world, Nov. 2002; http://www.jxj.com/magsandj/rew/2002_06/wind_power.html
Private Insurance for Wind energy
Established in 1999 the WindPro facility can include a “cradle to grave” insurance policy that is available to both new and repowered wind farms. This policy is acti-vated as a Builder’s All Risk policy upon commencement of construction, remains in full force as each turbine is erected and commissioned, and simply transitions to an Operational All Risk policy when commercial operations begin. This includes non-warranty mechanical breakdown and may eliminate the need for a separate boiler and machinery policy. Among the solutions offered are global cover for transit, delay in start up, construction, liability (primary and excess), operating risks and business interruption. The facility can provide limits up to $184 million (£130 million) on any one project and is underwritten primarily in the Lloyd's market.
WindPro is accessible via an insurance broker or directly for all businesses involved with the wind energy industry. It can provide tailored insurance solutions to transfer risks endured by wind farm contractors, owners, developers, financiers and manu-facturers. WindPro has provided cover for over 4,500 megawatts (MW) out of the 28,000 MW capacity from wind power worldwide.

Financing Instruments for Renewable Energy 38
pany so they can take control if the company defaults on its obligations.
The pledge of shares, like other pledge instruments, is an accessory
agreement which may only be used to secure an underlying debt obliga-
tion. Pledge of shares may be a useful collateral instrument especially in
cases, where the company structure and company laws are quite clear,
but land property rights and mortgage laws are complex and risky.
3.3.3 Exchange risk instruments
A SWAP is an agreement between two counterparties to exchange
something (one "leg" of the swap) for something else (the other "leg").
These things can be anything that has a financial value. Most important
for our topics and the financial problems of RET funding are cross cur-
rency swaps which allow the management of exchange risk, as foreign
exchange is a special concern for many RET projects. Power projects
typically generate revenues in local currency, while their financing costs
and investment cost are denominated in U.S. dollars or other hard cur-
rencies, creating the risk of a mismatch in the development of the ex-
change rate between the two currencies. 44
A Cross Currency Swap is an agreement between two parties to ex-
change principal amounts in two different currencies, to pay interest
based on those amounts during some period of time, and to re-
exchange the principal amounts at maturity. Graphics and an example
make the process more illustrative45:
44 The IFC is lending in local currency to projects in developing countries where it can
fully hedge its foreign exchange exposure back to dollars in the currency swap market. In 2002 IFC offered local currency loans and hedges for the following 11 emerging mar-kets outside Europe: Korea, India, Indonesia, Philippines, Thailand, Mexico, South Af-rica. However, the availability of these currencies, and the terms and conditions that the IBRD and IFC could obtain, will depend on swap market conditions at the time of execu-tion of the proposed transactions. Because conditions in emerging financial markets can change rapidly, the IBRD will determine, upon a borrower’s request, whether it is able to offer financing in a specific currency. 45
IBRD Local currency financial products: An introduction.
Financing Instruments for Renewable Energy 39
“In this illustration, the IBRD has made a USD loan to a borrower. The
original USD loan is financed by borrowing in the international bond
markets. After the loan is disbursed, the borrower requests that the IBRD
convert its USD obligation into local currency, in this case south African
Rand (ZAR). In response to the borrower conversion request, the IBRD
arranges a ZAR-USD swap with an institution in the financial markets.
The swap is structured such that the currency payments under the swap
match exactly the currency obligation under the original loan and the
borrower’s desired ZAR cash-flows.” 46
The principal amounts in each currency remain constant throughout the
transaction, and interest payments are a function of indigenous fixed or
floating rates. The customer is able to lock-in a specific exchange rate
for the life of an asset or liability. The pricing of IBRD hedging products
consists of the market cost of the hedge (IBRD will pass through to the
borrower the exchange rate and interest rate terms achieved) and a
transaction fee. The transaction fee payable in respect of local currency
conversions and swaps is ¼ of 1 per cent of the principal amount
swapped.
� So SWAPs can solve the problem of foreign exchange risk at a rea-
sonable price. However, this instrument is only available for the
rather advanced financial markets of the developing countries.
RET projects in other countries have to look for the less elegant solu-
tions, as presented in the following table:
Mechanisms that allocate the Exchange risk to
Government Fixed Exchange Rates
Public Sector Lending in Local Currency
Exchange Rate Guarantees
Tariff Index Foreign Exchange Index
Inflation Index
Regulatory Risk Mitigation
Liquidity Facilities Escrow Accounts
Liquidity Facilities dedicated to Exchange risk mitigation (stand by credit facility for devaluation)
Source: Matsukawa, Tomoko et al. - Foreign Exchange Risk Mitigation for Power and Water Projects in Developing Countries, World Bank, December 2003
3.3.4 Securitization of credits
Making use of the structured finance approach of the creation of a
special purpose entity like project finance, but on the level of refinance,
securitization is a financing technique transferring the risk of loans to
bond investors and distribute it among them. The term credit securitiza-
tion refers to the transformation of non-marketed assets into marketable
assets, i.e. securities.
• In the first step of the credit securitization process the originator pools a number of roughly homogeneous assets.
46 IBRD Local currency financial products: An introduction.p.4.
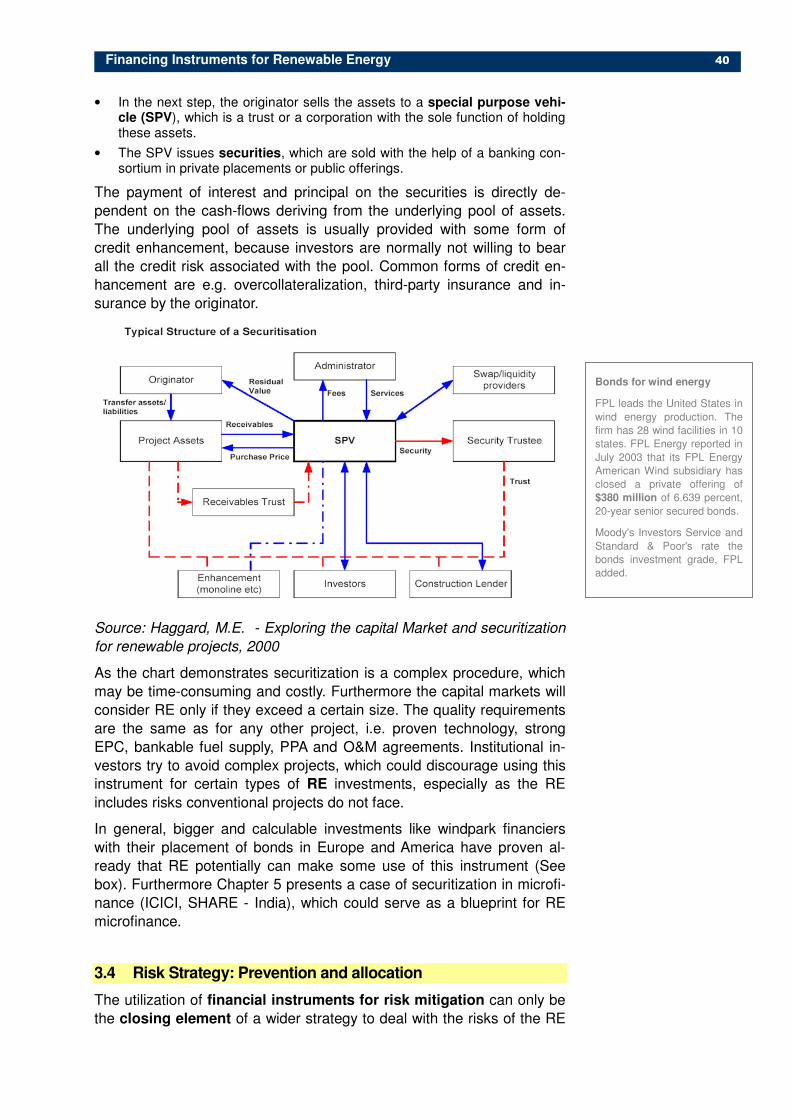
Financing Instruments for Renewable Energy 40
• In the next step, the originator sells the assets to a special purpose vehi-cle (SPV), which is a trust or a corporation with the sole function of holding these assets.
• The SPV issues securities, which are sold with the help of a banking con-sortium in private placements or public offerings.
The payment of interest and principal on the securities is directly de-
pendent on the cash-flows deriving from the underlying pool of assets.
The underlying pool of assets is usually provided with some form of
credit enhancement, because investors are normally not willing to bear
all the credit risk associated with the pool. Common forms of credit en-
hancement are e.g. overcollateralization, third-party insurance and in-
surance by the originator.
Source: Haggard, M.E. - Exploring the capital Market and securitization
for renewable projects, 2000
As the chart demonstrates securitization is a complex procedure, which
may be time-consuming and costly. Furthermore the capital markets will
consider RE only if they exceed a certain size. The quality requirements
are the same as for any other project, i.e. proven technology, strong
EPC, bankable fuel supply, PPA and O&M agreements. Institutional in-
vestors try to avoid complex projects, which could discourage using this
instrument for certain types of RE investments, especially as the RE
includes risks conventional projects do not face.
In general, bigger and calculable investments like windpark financiers
with their placement of bonds in Europe and America have proven al-
ready that RE potentially can make some use of this instrument (See
box). Furthermore Chapter 5 presents a case of securitization in microfi-
nance (ICICI, SHARE - India), which could serve as a blueprint for RE
microfinance.
3.4 Risk Strategy: Prevention and allocation
The utilization of financial instruments for risk mitigation can only be
the closing element of a wider strategy to deal with the risks of the RE
Bonds for wind energy
FPL leads the United States in
wind energy production. The
firm has 28 wind facilities in 10
states. FPL Energy reported in
July 2003 that its FPL Energy
American Wind subsidiary has
closed a private offering of
$380 million of 6.639 percent,
20-year senior secured bonds.
Moody's Investors Service and
Standard & Poor's rate the
bonds investment grade, FPL
added.
Financing Instruments for Renewable Energy 41
project. First, RE developers have to do their homework in risk man-
agement, before they can qualify as a partner for risk allocation with third
parties.
3.4.1 Own Risk Management
Proper risk management is a prerequisite for any investment and in-
cludes a series of steps, which would have to be carried out for each
and every RE project:
• All risks are correctly identified and as much as possible quantified, and assessed in their consequences for the project,
• followed by a definition of risk tolerance limits;
• efforts are made to mitigate the risks, residual risks are properly allocated and managed.
The decision also depends also on the following crucial criteria,
whether
• the consequences of particular risks are catastrophic or not,
• the risks are controllable at the micro level or not,
• the consequences are reversible or not, and
• the risks are insurable or not,
• how much is to pay for somebody else covering the financial damage re-sulting from a certain risk
• and how much resources we are willing to spend to deal with all this.
Only after the execution of this steps and procedures it can be deter-
mined which risks shall be transferred and what kind of financial risk
mitigation instruments are needed. All this may sound trivial, but in real-
ity can be an extremely complex and time consuming procedure
involving substantial transaction cost, especially for such difficult struc-
tures as RE:
• It may sound very trivial, but the proper planning of a project with careful-ness, attention and accuracy exercising the due diligence of a business-man is the most important risk management factor.
• The selection of solid, reliable and experienced contract partners is an central approach to compensate for the risk balance of RE.
• Collection of relevant data, investigation and research for the RE project and its location does not come without a cost, but may reduce substantially the uncertainty and reduce the cognitive barriers, which relate to the low level of awareness, understanding and attention afforded to the RE financ-ing and risk management instruments.
3.4.2 Partners and standard approach for risk allocation
However, even the best efforts to avoid or mitigate risks cannot eradi-
cate them. And most of the above-mentioned risks can hardly be as-
sumed by a private investor or a commercial lender alone.
� Therefore, those risks must be allocated and be taken on by other
key stakeholders.
In this context of risk allocation it is important to note that a single asset
or liability contributes different amounts of risk, depending on the portfo-

Financing Instruments for Renewable Energy 42
lio it is a part of. Thus the proper allocation can contribute to the reduc-
tion of risk.
Like for any other major project the partner of the commercial con-
tracts form the basis of the security structure for a RE project. For re-
newable energy projects, the typical principal contracts are:
• Engineering, Procurement and Construction Agreement (may be separated into more than one agreement)
• Fuel or waste supply contract (if required)
• Operating agreement
• Power purchase agreement
• Shareholders (or joint-venture) agreement
• Loan agreement.
Other important institutions to structure the risk allocation are:
• The host government, which is chiefly responsible for creating the proper legal and institutional environment in which developers will feel reasonably protected,
• The (mulitilateral) development banks, which can help in different ways: by lending to the project while taking political risk, by providing partial risk guarantee (PRG) products or political risk insurance cover (from MIGA for instance).
• Export Credit Agencies (ECAs), which can cover part of the commercial risk.
• Professional risk takers, like Insurance Companies.
The skill in structuring a successful project financing for a renewables
project is to transfer or allocate specific risks to external parties best able
to manage, absorb or mitigate the risk in the most efficient manner,
thereby leaving only a residual risk with the developer.
These external parties, and the principal risks which typically could be
allocated to them, can be summarized as follows47:
Pre-completion risk
Risk Third Party Comments
Technology Contrac-tor/Equipment Supplier
Risk transferred through monetary damages for performance shortfall.
Contractor Risk transferred through monetary damages for delay in completion.
Delay
Insurance Certain delay risks can be covered by insurance.
47 DTI – Financing Renewable Energy Projects – A Guide for Developers, February 2000
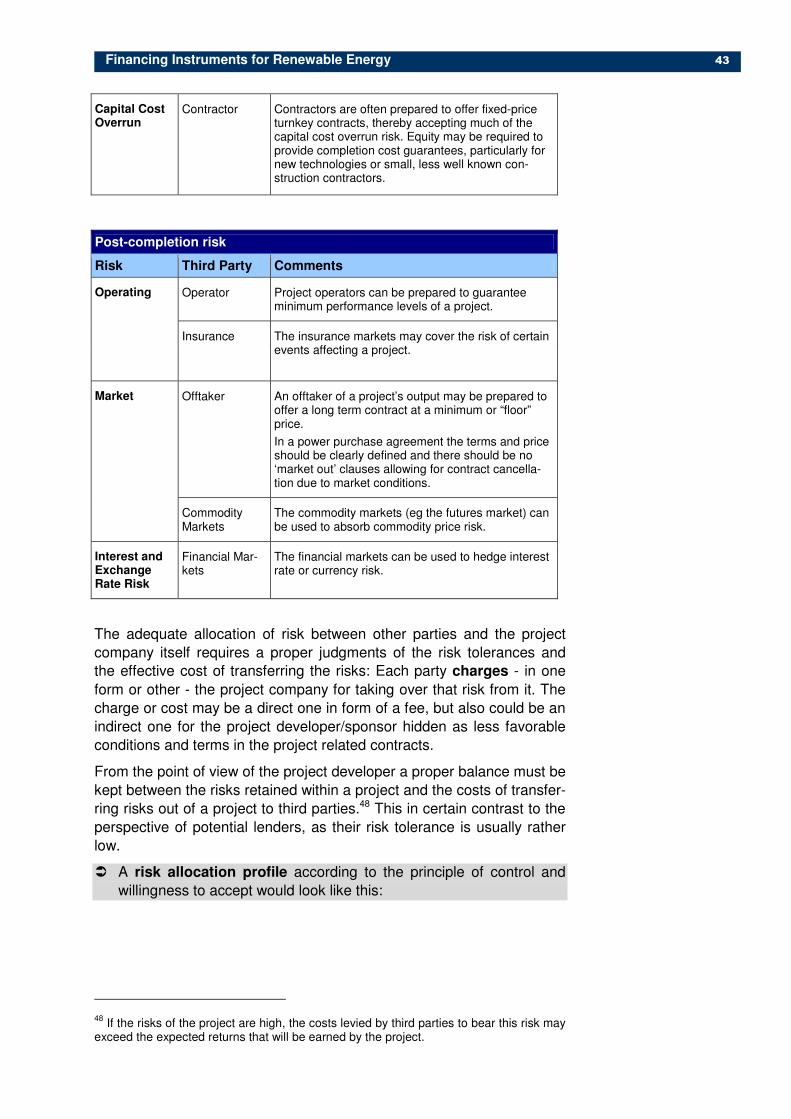
Financing Instruments for Renewable Energy 43
Capital Cost Overrun
Contractor Contractors are often prepared to offer fixed-price turnkey contracts, thereby accepting much of the capital cost overrun risk. Equity may be required to provide completion cost guarantees, particularly for new technologies or small, less well known con-struction contractors.
Post-completion risk
Risk Third Party Comments
Operator Project operators can be prepared to guarantee minimum performance levels of a project.
Operating
Insurance The insurance markets may cover the risk of certain events affecting a project.
Offtaker An offtaker of a project’s output may be prepared to offer a long term contract at a minimum or “floor” price.
In a power purchase agreement the terms and price should be clearly defined and there should be no ‘market out’ clauses allowing for contract cancella-tion due to market conditions.
Market
Commodity Markets
The commodity markets (eg the futures market) can be used to absorb commodity price risk.
Interest and Exchange Rate Risk
Financial Mar-kets
The financial markets can be used to hedge interest rate or currency risk.
The adequate allocation of risk between other parties and the project
company itself requires a proper judgments of the risk tolerances and
the effective cost of transferring the risks: Each party charges - in one
form or other - the project company for taking over that risk from it. The
charge or cost may be a direct one in form of a fee, but also could be an
indirect one for the project developer/sponsor hidden as less favorable
conditions and terms in the project related contracts.
From the point of view of the project developer a proper balance must be
kept between the risks retained within a project and the costs of transfer-
ring risks out of a project to third parties.48 This in certain contrast to the
perspective of potential lenders, as their risk tolerance is usually rather
low.
� A risk allocation profile according to the principle of control and
willingness to accept would look like this:
48 If the risks of the project are high, the costs levied by third parties to bear this risk may
exceed the expected returns that will be earned by the project.
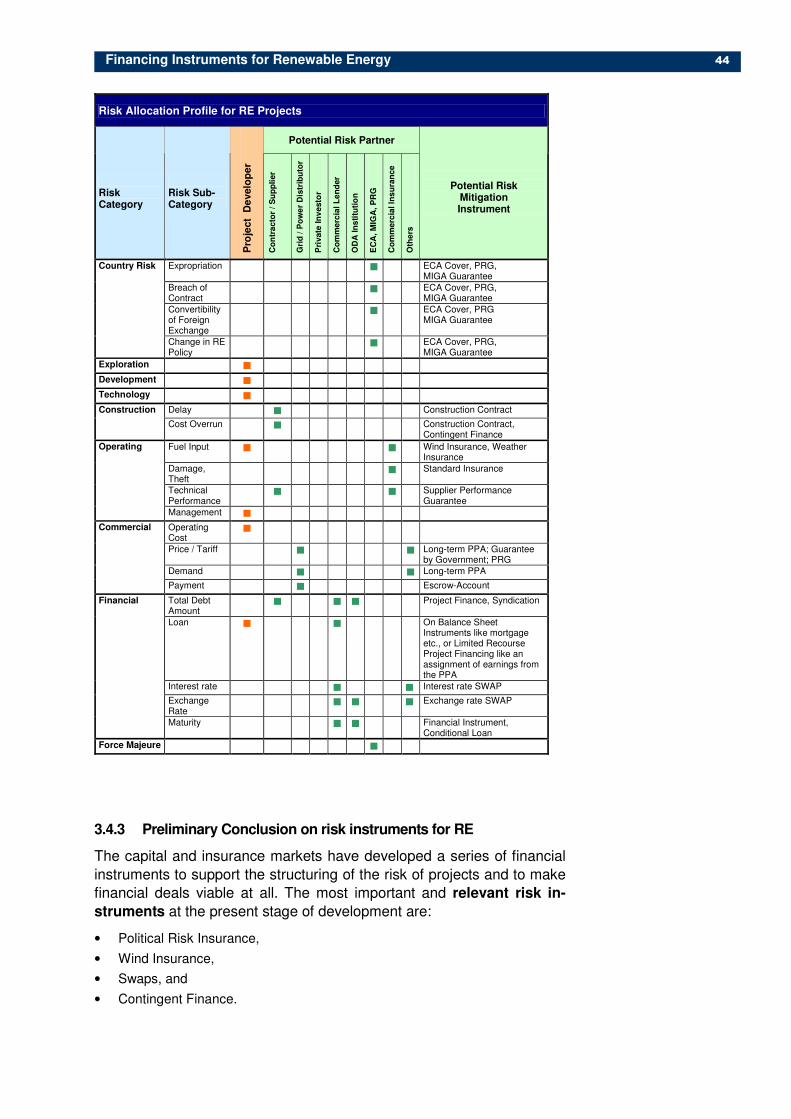
Financing Instruments for Renewable Energy 44
Risk Allocation Profile for RE Projects
Potential Risk Partner
Risk Category
Risk Sub-Category
Pro
ject
De
velo
pe
r
Co
ntr
acto
r /
Su
pp
lier
Gri
d / P
ow
er
Dis
trib
uto
r
Pri
vate
In
vesto
r
Co
mm
erc
ial
Le
nd
er
OD
A I
ns
titu
tio
n
EC
A, M
IGA
, P
RG
Co
mm
erc
ial In
su
ran
ce
Oth
ers
Potential Risk Mitigation Instrument
Expropriation � ECA Cover, PRG, MIGA Guarantee
Breach of Contract
� ECA Cover, PRG, MIGA Guarantee
Convertibility of Foreign Exchange
� ECA Cover, PRG MIGA Guarantee
Country Risk
Change in RE Policy
� ECA Cover, PRG, MIGA Guarantee
Exploration �
Development �
Technology �
Delay � Construction Contract Construction
Cost Overrun � Construction Contract, Contingent Finance
Fuel Input � � Wind Insurance, Weather Insurance
Damage, Theft
� Standard Insurance
Technical Performance
� � Supplier Performance Guarantee
Operating
Management �
Operating Cost
�
Price / Tariff � � Long-term PPA; Guarantee by Government; PRG
Demand � � Long-term PPA
Commercial
Payment � Escrow-Account
Total Debt Amount
� � � Project Finance, Syndication
Loan � � On Balance Sheet Instruments like mortgage etc., or Limited Recourse Project Financing like an assignment of earnings from the PPA
Interest rate � � Interest rate SWAP
Exchange Rate
� � � Exchange rate SWAP
Financial
Maturity � � Financial Instrument, Conditional Loan
Force Majeure �
3.4.3 Preliminary Conclusion on risk instruments for RE
The capital and insurance markets have developed a series of financial
instruments to support the structuring of the risk of projects and to make
financial deals viable at all. The most important and relevant risk in-
struments at the present stage of development are:
• Political Risk Insurance,
• Wind Insurance,
• Swaps, and
• Contingent Finance.

Financing Instruments for Renewable Energy 45
It has been explained, that due to the limited experience, the early stage
development of the relevant markets and the risk-aversion of the players
in developing countries such instrument will only seldom be available for
RE in LDCs per se. The availability of such instruments in LDCs is sum-
marized by the proposal for the abovementioned research study: “In
developing countries, standard insurance products for RE projects may
be partly available though local insurance and re-insurance brokers, who
then place insured risks directly on international market. However, these
have even higher underwriting restrictions because of difficult re-
insurance procedures and low capacity on international markets. The
market conditions are more or less similar for other non-insurance risk
management instruments, and there are very few commercially available
financial instruments for RET projects, such as guarantees, guarantee
funds, or finance risk hedge mechanisms.”
Given these constraints on the capital markets in LDCs to respond, there
is a task for the public sector and the donor community to take on to
catalyze the utilization of innovative risk management schemes to facili-
tate commercial investment flow to RE sector.
Thus, some of these instruments presented offer an interesting start-
ing point for policy makers and donors to support the structuring of
risk in RE by assisting the players in the financial and insurance markets
to develop their skills and instruments. Furthermore some of them could
be used directly by donors to assist RE projects and programs.
• When governments with financial and TA help from donors introduce risk management products for RE-projects on the market, the market price of private project finance for RE decreases while the availability of domestic debt and equity capital for RE-projects increases. The objectives of the ap-proach are (i) to leverage donor finance (generating an increase in domes-tic project finance, which is larger than the donor-financed cost of develop-ing and marketing the hedging product) and (ii) to assist a long-term strengthening of the capital market.
• In emerging economies, one can expect a significant impact on RE-investments from new risk instruments. Investors in East-Asia in particular react very quickly to new commercial opportunities and are capable of rising significant capital in a short time.
• In poorer developing countries, the leveraging effect on the availability of capital for RE is likely to be small in the short-term and requires a subsidiza-tion of the risk product. The donor would finance a reserve fund to cover the expected financial losses on the under-priced product. In these countries, it is not the short-term impact, but the longer term impact on the capital mar-ket which provides the justification for adopting the approach.
� It is recommended, therefore, to use modalities for providing financial
assistance to RE-investments, which strengthen the local capital
markets, even if they offer few short-term advantages for RE-
investments compared with conventional donor-assisted project fi-
nance.

Financing Instruments for Renewable Energy 46
4 RE Financing Strategy and Financial Supporting In-
struments
As the commercial markets do not provide a satisfying set of financial
instruments in most regions, policy makers and donors have to look for
additional financial supporting instruments to make economic viable RE
projects and programs financially possible.
To find a proper approach for such a support we have to precise a strat-
egy RE financing and its promotion. After that this chapter will have a
closer look on such financial supporting instruments:
• ODA-instruments as grants, soft loans, promotional credits and other fi-nancial supporting instruments as guarantees as well as financial instru-ments provided by private sector promoting DFIs.
• International promotional schemes like CDM and GEF.
• Subsidies, which could be used by policy makers, electricity providers and third parties as donors.
Such instruments could play an important role to improve the financial
viability of RE projects
• by an approach to increase funding availability for renewable energy in-vestments, aiming at leverage of private finance,
• with a risk-sharing approach,
• and the facilitation of the bundling of (small) projects to help absorb their higher proportional level of transaction costs.
4.1 Basic Approach for a RE financing strategy
Obviously, as described above, the characteristics of RE and its project
sponsors on the demand side of finance do not match the requirements
of a very incompletely developed supply side. The framework conditions
in the energy market tend to increase the gap between RE investors and
financial institutions in LDCs. Obviously in many countries and situations
there seems to be a need for assistance to overcome this severe barrier
for making full advantage of RE for development of these countries.
However, before we can start to think about a promotional package of
financial instruments for an RE activitiy, we have to make a diagnostic of
the state of viability of a certain RE activity and whether and to which
extent it makes sense, to use scarce resources to solve financial prob-
lems of such a RE project. This problem has to be addressed on the
base of the concept economic viability. This means, that a proper strat-
egy for RE finance does not aims at the promotion of RE per se, but on
the creation of proper financial conditions for economic viable RE pro-
jects. In detail:

Financing Instruments for Renewable Energy 47
4.1.1 RE Supply Curve, and Viability
The RE-supply curve shows the marginal cost of production per GWh
of RE as a function of the scale of national RE-production. It bench-
marks Government RE-priorities and targets against the scope for finan-
cially viable, economically viable and non-economic RE-supply. Bench-
marking the RE-supply curve against the supply curve for conventional
power supply permits identifying the scope for economically viable RE-
investments. An example with styled facts is shown below.49 The supply
curve for RE is presented based on three basic concepts:
• the financial supply curve (REFS) includes all costs (capital, and operating and maintenance costs) priced at current market prices. Capital costs are annualised, using a formula that incorporates the lifespan of the capital equipment, and a discount rate.
• the economic supply curve for RE (REECS) is based on the data used in deriving financial curves, making adjustments for two categories of inputs: (i) the input data for labour, fuels and the exchange rate are shadow priced to reflect the opportunity cost to the economy rather than the market price; (ii) CO2 emission offset data is included, valued with Certified Emission Credits (CER) of the Clean Development Mechanism (CDM).
• the socio-economic supply curve is equal to the economic supply curve minus the value of the indirect and induced labour created by the introduc-tion of RE technologies. Since technological progress and the growth in the RE-market bring down the cost of production per kWh of new RE-projects, the dynamic supply curves in the long run (RESEDS) are lower than the static supply curves in the short run (RESESS). The dynamic socio-economic cost curve shows the lowest cost scenario for RET, the financial supply curve the highest.
49 Based on Conningarth Economists: “Economic and Financial Calculations and Model-
ling for the Renewable Energy Strategy Formulation - technologies for fulfilling the 10 000 (4 000) GWh target a least cost for the South African society”. February 4, 2004. Off-
0
0,1
0,2
0,3
0,4
0,5
0,6
0,7
0,8
0,9
1
100 1000 10000 100000
REFS REECS RESESS RESEDS CEES CESES
4. Optimum RE Supply at dynamic
socioeconomic cost 12000 GWh
1. Optimum RE Supply at
financial cost 800 GWh
2. Optimum RE Supply at
economic cost 1500 GWh
3. Optimum RE Supply at static
socioeconomic cost 3500 GWh
CU/kwh
Cumulative GWh

Financing Instruments for Renewable Energy 48
The chart benchmarks the cost of RE-supply against these two LRMCs.
The point of intersection of the RE supply curves with the conventional
supply curves indicates the optimum RE-quantity based on the different
concepts.
Even the socio-economic curve shows that a large market share for RE
carries a high price tag: the socio-economic cost per kWh of RE-
production increases sharply as soon as contribution of RE is expanded
beyond a few thousand GWh, and quickly oversteps the two benchmark
figures for the Long Run Marginal Cost (LRMC) of conventional power
(the cost with (CESES) and without (CEES) the environmental cost of
thermal power).
The central observations from the RE-curve benchmarking against
conventional power supply in this example are:
• there are few low-hanging fruits in RE-investments, i.e. financially viable under current conditions (Optimum 1);
• the cost of expanding investments beyond the “commercial” RE-potential rises steeply, calling for increasing amounts of compensation to be intro-duced;
• however, under a long-term socio-economic perspective a much higher RE-Supply is desirable (Optimum 4), setting the rational limits for interven-tions and corrections in the current (renewable) energy framework.
• On the other side, a considerable share of technically feasible RE-supply is non-economic even under long-term socio-economic perspective.
In countries that are blessed with hydropower resources and/or geo-
thermal resources RE can make up close to 100 percent of national
power generation. Here there are enough low-hanging fruits to cover
total demand for power with few or no RE-specific incentives.
In other countries, the task is to find niche markets for the lowest-cost
RETs. Many of these are only marginally competitive with conventional
power supply on the free market due to (i) price distortions on the energy
market, which prevent RE from being offered tariffs that reflect their full
economic value and (ii) weaknesses on the capital market which reduce
the price competitiveness of RE-generated power. They, therefore, need
compensating innovative finance and market regulations to secure a
market share reflecting their objective value for society.
If the energy policy is taking into consideration the long-term and socio-
economic aspects by inserting them into the cost of the energy suppliers
to promote the viability of RE, this will not only increase the competitive-
ness of RE projects, but it may also lift the energy supply curve (from SM
to SA). This would lead to a new market equilibrium with an increase
of the energy price and a reduction in the total energy consumption
along the demand curve, both being detrimental to the consumers of
energy, which may create a substantial problem in a very sensitive field.
grid RETs are not included in the supply curve for South Africa. Solar water heaters are included because they reduce demand for power from the grid.
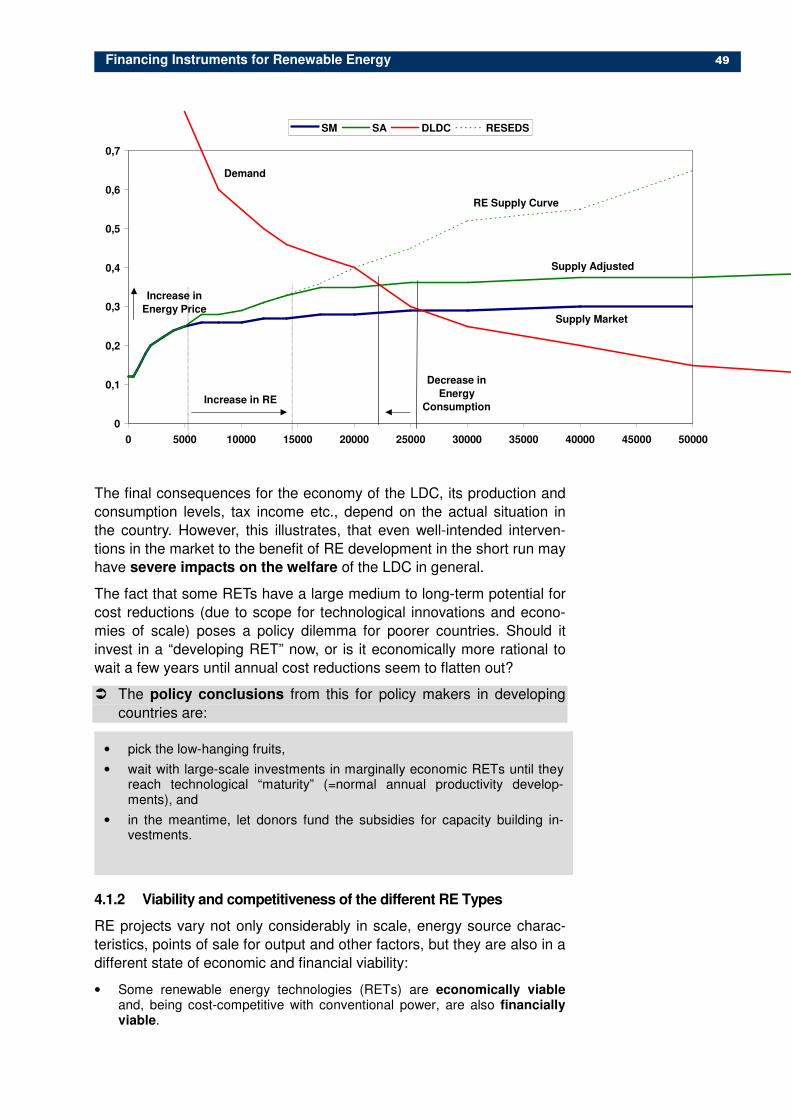
Financing Instruments for Renewable Energy 49
The final consequences for the economy of the LDC, its production and
consumption levels, tax income etc., depend on the actual situation in
the country. However, this illustrates, that even well-intended interven-
tions in the market to the benefit of RE development in the short run may
have severe impacts on the welfare of the LDC in general.
The fact that some RETs have a large medium to long-term potential for
cost reductions (due to scope for technological innovations and econo-
mies of scale) poses a policy dilemma for poorer countries. Should it
invest in a “developing RET” now, or is it economically more rational to
wait a few years until annual cost reductions seem to flatten out?
� The policy conclusions from this for policy makers in developing
countries are:
4.1.2 Viability and competitiveness of the different RE Types
RE projects vary not only considerably in scale, energy source charac-
teristics, points of sale for output and other factors, but they are also in a
different state of economic and financial viability:
• Some renewable energy technologies (RETs) are economically viable and, being cost-competitive with conventional power, are also financially viable.
• pick the low-hanging fruits,
• wait with large-scale investments in marginally economic RETs until they reach technological “maturity” (=normal annual productivity develop-ments), and
• in the meantime, let donors fund the subsidies for capacity building in-vestments.
0
0,1
0,2
0,3
0,4
0,5
0,6
0,7
0 5000 10000 15000 20000 25000 30000 35000 40000 45000 50000
SM SA DLDC RESEDS
Increase in RE
Decrease in
Energy
Consumption
Increase in
Energy Price
Demand
Supply Market
Supply Adjusted
RE Supply Curve
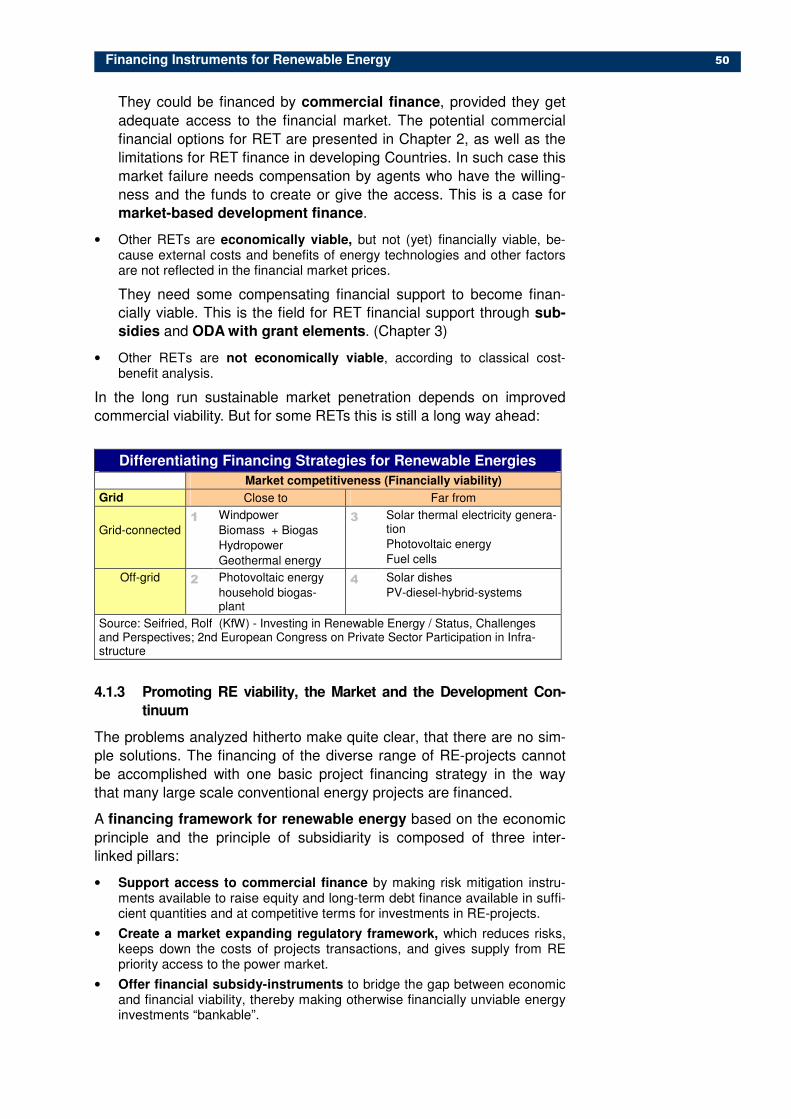
Financing Instruments for Renewable Energy 50
They could be financed by commercial finance, provided they get
adequate access to the financial market. The potential commercial
financial options for RET are presented in Chapter 2, as well as the
limitations for RET finance in developing Countries. In such case this
market failure needs compensation by agents who have the willing-
ness and the funds to create or give the access. This is a case for
market-based development finance.
• Other RETs are economically viable, but not (yet) financially viable, be-cause external costs and benefits of energy technologies and other factors are not reflected in the financial market prices.
They need some compensating financial support to become finan-
cially viable. This is the field for RET financial support through sub-
sidies and ODA with grant elements. (Chapter 3)
• Other RETs are not economically viable, according to classical cost-benefit analysis.
In the long run sustainable market penetration depends on improved
commercial viability. But for some RETs this is still a long way ahead:
Differentiating Financing Strategies for Renewable Energies
Market competitiveness (Financially viability)
Grid Close to Far from
Grid-connected 1 Windpower
Biomass + Biogas
Hydropower
Geothermal energy
3 Solar thermal electricity genera-tion
Photovoltaic energy
Fuel cells
Off-grid 2 Photovoltaic energy
household biogas-plant
4 Solar dishes
PV-diesel-hybrid-systems
Source: Seifried, Rolf (KfW) - Investing in Renewable Energy / Status, Challenges and Perspectives; 2nd European Congress on Private Sector Participation in Infra-structure
4.1.3 Promoting RE viability, the Market and the Development Con-
tinuum
The problems analyzed hitherto make quite clear, that there are no sim-
ple solutions. The financing of the diverse range of RE-projects cannot
be accomplished with one basic project financing strategy in the way
that many large scale conventional energy projects are financed.
A financing framework for renewable energy based on the economic
principle and the principle of subsidiarity is composed of three inter-
linked pillars:
• Support access to commercial finance by making risk mitigation instru-ments available to raise equity and long-term debt finance available in suffi-cient quantities and at competitive terms for investments in RE-projects.
• Create a market expanding regulatory framework, which reduces risks, keeps down the costs of projects transactions, and gives supply from RE priority access to the power market.
• Offer financial subsidy-instruments to bridge the gap between economic and financial viability, thereby making otherwise financially unviable energy investments “bankable”.
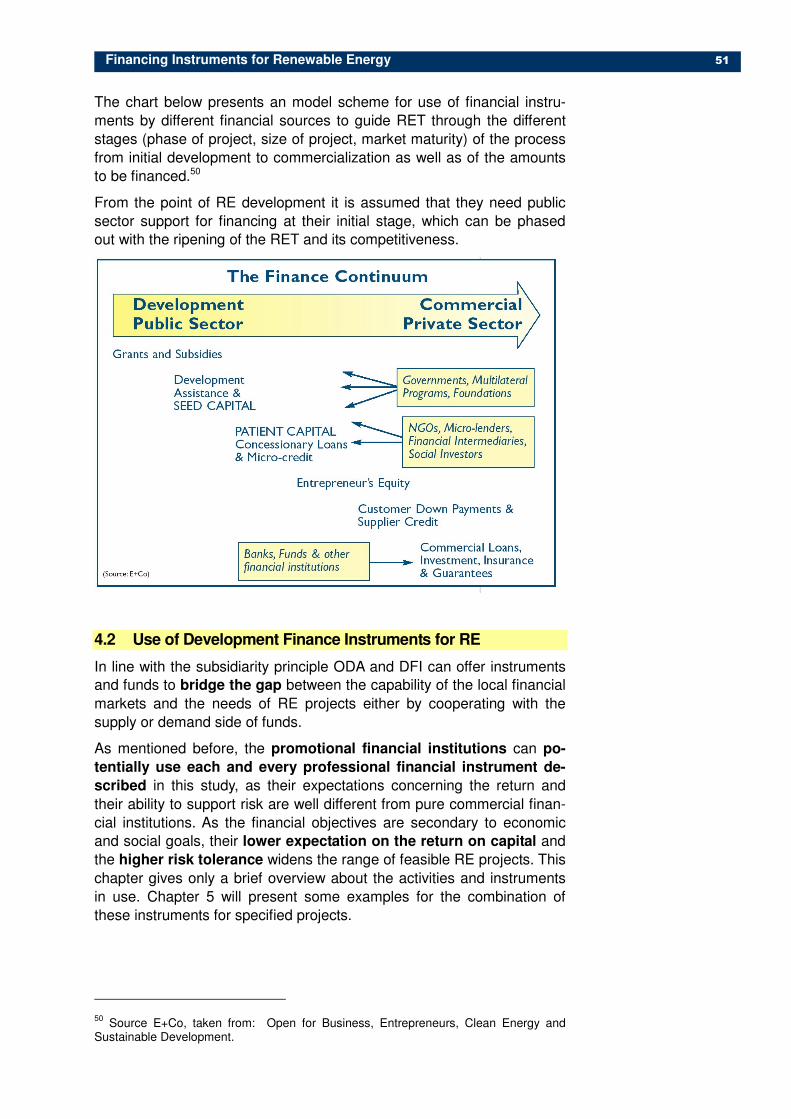
Financing Instruments for Renewable Energy 51
The chart below presents an model scheme for use of financial instru-
ments by different financial sources to guide RET through the different
stages (phase of project, size of project, market maturity) of the process
from initial development to commercialization as well as of the amounts
to be financed.50
From the point of RE development it is assumed that they need public
sector support for financing at their initial stage, which can be phased
out with the ripening of the RET and its competitiveness.
4.2 Use of Development Finance Instruments for RE
In line with the subsidiarity principle ODA and DFI can offer instruments
and funds to bridge the gap between the capability of the local financial
markets and the needs of RE projects either by cooperating with the
supply or demand side of funds.
As mentioned before, the promotional financial institutions can po-
tentially use each and every professional financial instrument de-
scribed in this study, as their expectations concerning the return and
their ability to support risk are well different from pure commercial finan-
cial institutions. As the financial objectives are secondary to economic
and social goals, their lower expectation on the return on capital and
the higher risk tolerance widens the range of feasible RE projects. This
chapter gives only a brief overview about the activities and instruments
in use. Chapter 5 will present some examples for the combination of
these instruments for specified projects.
50 Source E+Co, taken from: Open for Business, Entrepreneurs, Clean Energy and
Sustainable Development.

Financing Instruments for Renewable Energy 52
4.2.1 Activities of Development Banks
During the last decade the World Bank and other multilateral and bilat-
eral development banks have been among the largest and most ac-
tive investors in renewable energy throughout the developing world.
Donor grants and (concessional) loans for RE come from three
sources:
• Donor grants allocated to RE-capacity building and investment within the framework of pluri-annual bilateral aid-programs;
• (Soft) loans from international development banks, such as IDA and ADB, for rural electrification and RE programs;
• Donor soft loans to specific RE-investment projects.
Furthermore Development Finance Institutions and Promotional
Banks provided funds for RE at conditions at the lower end of markets in
form of equity or loans assuming a risk commercial institution is not will-
ing to accept presently.
Besides the sector strategic approach by support for electric power pol-
icy frameworks and regulations, development banks channeled funds
directly or indirectly through private Participating Credit Institutions
(PCIs), to provide medium and long-term financing to private sector
firms, NGOs, and cooperatives for solar home systems, village hydro
projects, grid-connected mini-hydro schemes and other renewable en-
ergy projects. Some of these activities are presented in chapter 5 in the
context of best practice approaches.
4.2.2 Approach and Lessons learned
In recipient countries, the funds provided fulfill two equally important
functions:
• they channel foreign grants to investments in RE,
• they provide long-term project finance, which is not available in most coun-tries.
The strength of donor credits is the ability to raise important sums of
project finance for individual projects. Loans at favorable conditions from
different donors can, as demonstrated by IREDA51, be combined into a
long term financing facility for RE-investments. This is the approach to
adopt when a country wants to mainstream RE. A weakness is that soft
credits often are restricted to finance supplies from the donor country.
This is changing; KfW, for example, accepts that the host country organ-
izes international tenders for supplies to projects financed by KfW.
The strength of the development banks in their assistance to RE is their
ability to combine breadth in terms of scope of intervention with depth in
terms of the scale of financial volume they can provide. Development
banks can and do finance the “whole chain of support activities from
institution-building TA to project finance and risk guarantee facilities.
Their weakness is slowness in procedures from the time of initial contact
till the flow of investment funds.
51 See Chapter 5
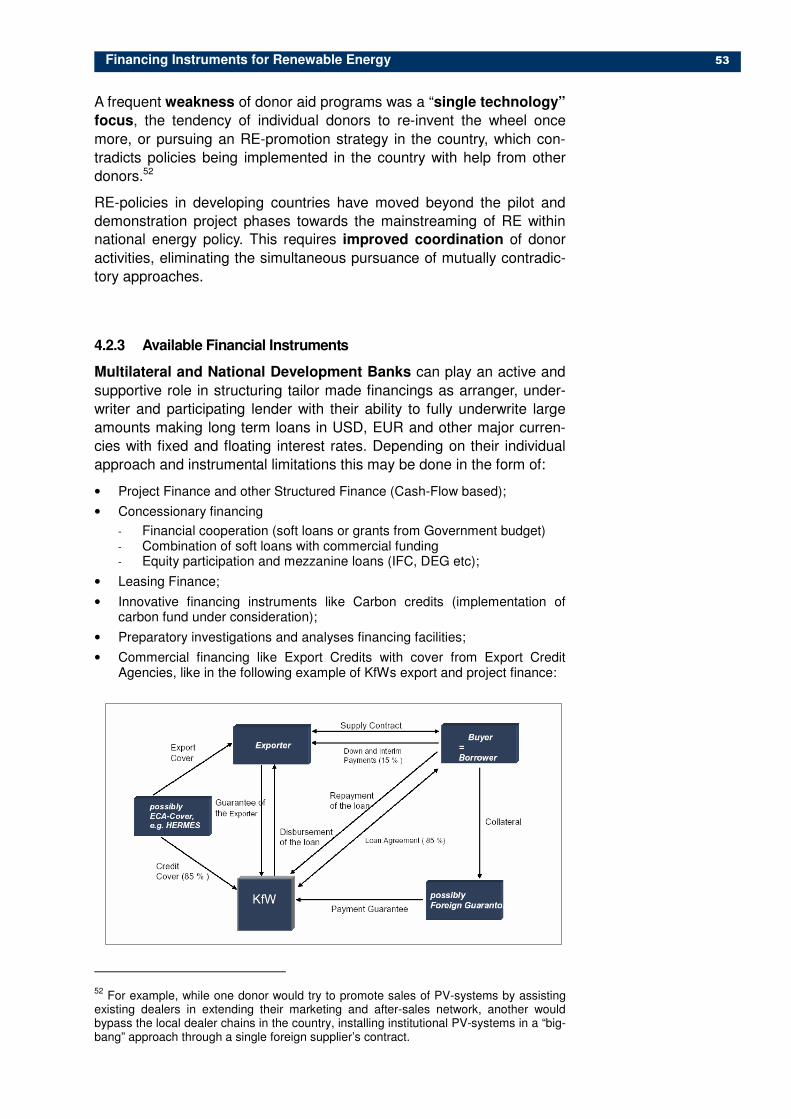
Financing Instruments for Renewable Energy 53
A frequent weakness of donor aid programs was a “single technology”
focus, the tendency of individual donors to re-invent the wheel once
more, or pursuing an RE-promotion strategy in the country, which con-
tradicts policies being implemented in the country with help from other
donors.52
RE-policies in developing countries have moved beyond the pilot and
demonstration project phases towards the mainstreaming of RE within
national energy policy. This requires improved coordination of donor
activities, eliminating the simultaneous pursuance of mutually contradic-
tory approaches.
4.2.3 Available Financial Instruments
Multilateral and National Development Banks can play an active and
supportive role in structuring tailor made financings as arranger, under-
writer and participating lender with their ability to fully underwrite large
amounts making long term loans in USD, EUR and other major curren-
cies with fixed and floating interest rates. Depending on their individual
approach and instrumental limitations this may be done in the form of:
• Project Finance and other Structured Finance (Cash-Flow based);
• Concessionary financing
- Financial cooperation (soft loans or grants from Government budget) - Combination of soft loans with commercial funding - Equity participation and mezzanine loans (IFC, DEG etc);
• Leasing Finance;
• Innovative financing instruments like Carbon credits (implementation of carbon fund under consideration);
• Preparatory investigations and analyses financing facilities;
• Commercial financing like Export Credits with cover from Export Credit Agencies, like in the following example of KfWs export and project finance:
52 For example, while one donor would try to promote sales of PV-systems by assisting
existing dealers in extending their marketing and after-sales network, another would bypass the local dealer chains in the country, installing institutional PV-systems in a “big-bang” approach through a single foreign supplier’s contract.
Financing Instruments for Renewable Energy 54
The affiliated private sector promoting Development Finance Institu-
tions like IFC and DEG have further financial instruments available for
RE Finance:
• Equity participation
• Subordinated loans without conversion option (Mezzanine)
• Long-terms loans
• Guarantees
• Mobilization of additional finance (e.g. syndications, coordinations).
A typical equity participation of DEG used for capital expenditures in
green-field-projects or as a capital increase in existing RE projects would
have the following characteristics53:
• Amount: 2.5 – 15 million €
• Participation: between 10 % and 49 %
• Exit option: IPO (after 3-6 years), Private Placement (after 3-6 years), Put option against other shareholders (if other options less realistic, after 7-10 years)
A DFI’s input as subordinated lender would render a quasi-equity func-
tion with lower costs and without additional dilution. The debt service
would be subordinated to senior loans with an individual amortisation
structure (e.g. longer grace period). Also securities would be subordi-
nated to senior loans with second ranking mortgage. DEG could offer
subordinated loans up to 20 million € in €, USD (depending on country
risk), but local currency only in special cases. The maturity would be up
to 15 years (including grace period). Interest rate would be variable or
fixed calculated on a base rate plus a margin for country, project and
subordination risk and a possible variable part of interest rate depending
on EBITDA or profit.
4.2.4 Risk Instruments
Given the gaps on the capital markets in LDCs to respond, there is a
task for the public sector and the donor community to take on to catalyze
the utilization of risk management schemes to facilitate commercial in-
vestment flow to RE sector.
At present, the multilateral development banks are using various guaran-
tee schemes help to structure the more general risks of RE projects:
53 Source: Investing in Renewable Energy - The Experiences and Possibilities of Financ-
ing of DEG in Emerging Markets and Developing Countries, Cologne 2002
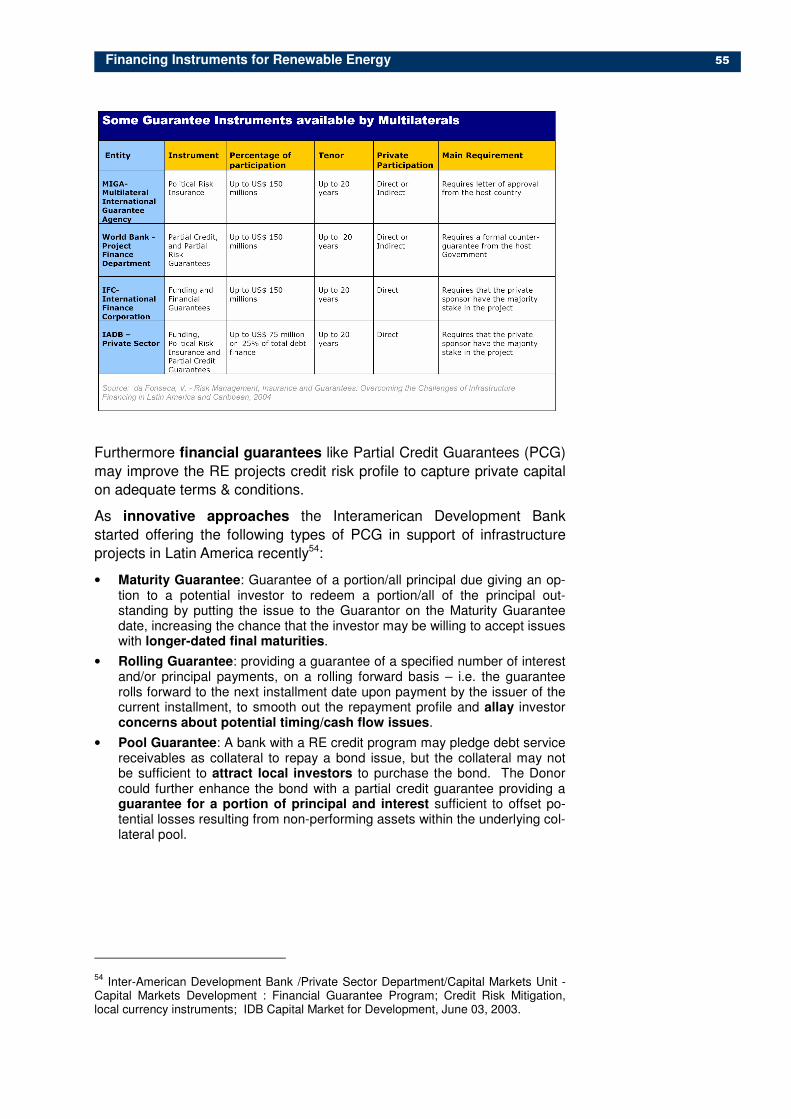
Financing Instruments for Renewable Energy 55
Furthermore financial guarantees like Partial Credit Guarantees (PCG)
may improve the RE projects credit risk profile to capture private capital
on adequate terms & conditions.
As innovative approaches the Interamerican Development Bank
started offering the following types of PCG in support of infrastructure
projects in Latin America recently54:
• Maturity Guarantee: Guarantee of a portion/all principal due giving an op-tion to a potential investor to redeem a portion/all of the principal out-standing by putting the issue to the Guarantor on the Maturity Guarantee date, increasing the chance that the investor may be willing to accept issues with longer-dated final maturities.
• Rolling Guarantee: providing a guarantee of a specified number of interest and/or principal payments, on a rolling forward basis – i.e. the guarantee rolls forward to the next installment date upon payment by the issuer of the current installment, to smooth out the repayment profile and allay investor concerns about potential timing/cash flow issues.
• Pool Guarantee: A bank with a RE credit program may pledge debt service receivables as collateral to repay a bond issue, but the collateral may not be sufficient to attract local investors to purchase the bond. The Donor could further enhance the bond with a partial credit guarantee providing a guarantee for a portion of principal and interest sufficient to offset po-tential losses resulting from non-performing assets within the underlying col-lateral pool.
54 Inter-American Development Bank /Private Sector Department/Capital Markets Unit -
Capital Markets Development : Financial Guarantee Program; Credit Risk Mitigation, local currency instruments; IDB Capital Market for Development, June 03, 2003.

Financing Instruments for Renewable Energy 56
4.2.5 Combined Support
The full set of potential support by a proper cooperation of the different
specialized institutions of a development bank group and their com-
bined instruments is demonstrated in the following chart, showing the
coordinated interaction of IFC, IBRD and MIGA:
• MIGA covers the shareholder/investors, which are participating in the eq-uity of the Renewable Energy Project Company.
• IFC is a partner in equity and additionally gives an A loan and channels a B Loan from commercial lenders.
• World Bank is giving a guarantee to the commercial lenders, which are giving credit to the Renewable Energy Project Company.
This illustrates how the support of DFIs could promote the participation
of the private sector in RE.
4.2.6 Opportunities in RE for development banks and DFIs
Essential elements of a strategy for development capital in supporting
the further RE development are55:
• Build up innovative approaches to tap commercial markets with enhanced risk sharing models;
• Utilization of flexible mechanisms of the Kyoto Protocol, primarily project-based “Joint Implementation“, “Clean Development Mechanism“;
• Strengthen strategic partnership with the Global Environment Facility (GEF), UNEP and other donors;
• Expand development partnerships with the private sector. This includes risk sharing with regard to preparatory measures via PPP facilities to mobilize private capital and entrepreneurial competence for the partner countries.
55 Seifried, Rolf - Financing Energy Services for Rural and Urban Poor within German
Financial German Financial Co-operation, Brussels, July 23, 2002.
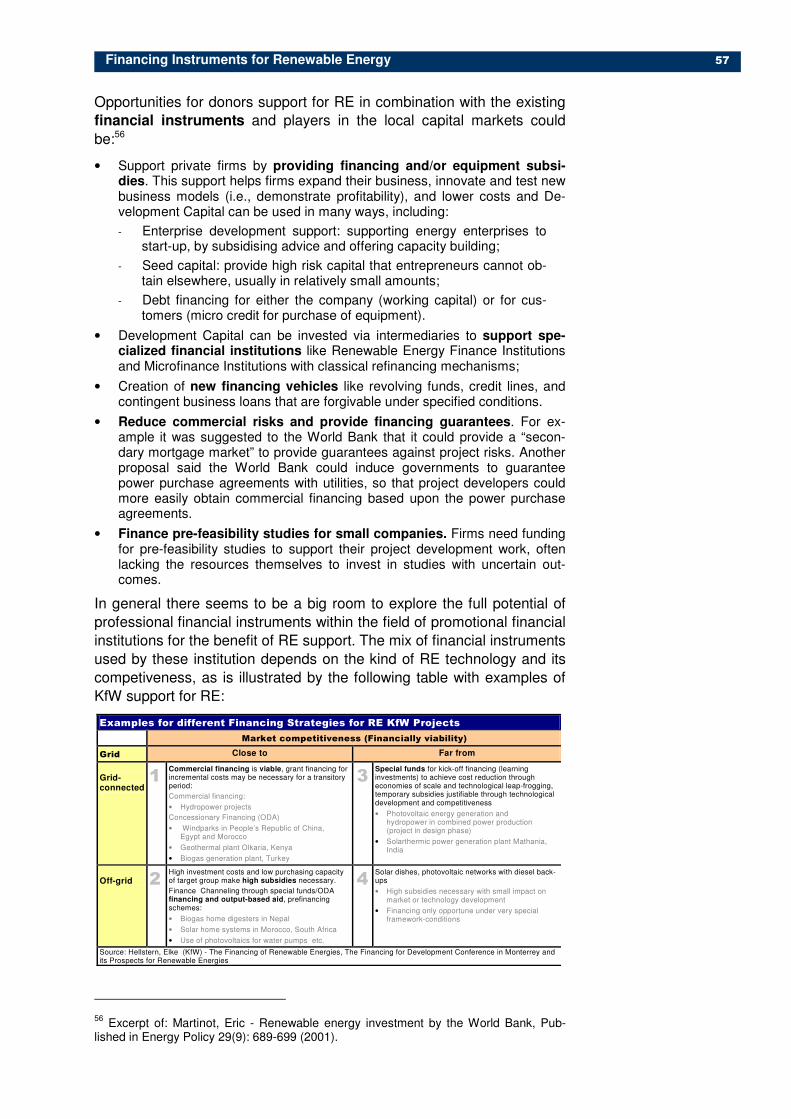
Financing Instruments for Renewable Energy 57
Opportunities for donors support for RE in combination with the existing
financial instruments and players in the local capital markets could
be:56
• Support private firms by providing financing and/or equipment subsi-dies. This support helps firms expand their business, innovate and test new business models (i.e., demonstrate profitability), and lower costs and De-velopment Capital can be used in many ways, including:
- Enterprise development support: supporting energy enterprises to start-up, by subsidising advice and offering capacity building;
- Seed capital: provide high risk capital that entrepreneurs cannot ob-tain elsewhere, usually in relatively small amounts;
- Debt financing for either the company (working capital) or for cus-tomers (micro credit for purchase of equipment).
• Development Capital can be invested via intermediaries to support spe-cialized financial institutions like Renewable Energy Finance Institutions and Microfinance Institutions with classical refinancing mechanisms;
• Creation of new financing vehicles like revolving funds, credit lines, and contingent business loans that are forgivable under specified conditions.
• Reduce commercial risks and provide financing guarantees. For ex-ample it was suggested to the World Bank that it could provide a “secon-dary mortgage market” to provide guarantees against project risks. Another proposal said the World Bank could induce governments to guarantee power purchase agreements with utilities, so that project developers could more easily obtain commercial financing based upon the power purchase agreements.
• Finance pre-feasibility studies for small companies. Firms need funding for pre-feasibility studies to support their project development work, often lacking the resources themselves to invest in studies with uncertain out-comes.
In general there seems to be a big room to explore the full potential of
professional financial instruments within the field of promotional financial
institutions for the benefit of RE support. The mix of financial instruments
used by these institution depends on the kind of RE technology and its
competiveness, as is illustrated by the following table with examples of
KfW support for RE:
Examples for different Financing Strategies for RE KfW Projects
Market competitiveness (Financially viability)
Grid Close to Far from
Grid-connected
1 Commercial financing is viable, grant financing for incremental costs may be necessary for a transitory period:
Commercial financing:
• Hydropower projects
Concessionary Financing (ODA)
• Windparks in People’s Republic of China, Egypt and Morocco
• Geothermal plant Olkaria, Kenya
• Biogas generation plant, Turkey
3
Special funds for kick-off financing (learning investments) to achieve cost reduction through economies of scale and technological leap-frogging, temporary subsidies justifiable through technological development and competitiveness
• Photovoltaic energy generation and hydropower in combined power production (project in design phase)
• Solarthermic power generation plant Mathania, India
Off-grid 2
High investment costs and low purchasing capacity of target group make high subsidies necessary.
Finance Channeling through special funds/ODA financing and output-based aid, prefinancing schemes:
• Biogas home digesters in Nepal
• Solar home systems in Morocco, South Africa
• Use of photovoltaics for water pumps etc.
4
Solar dishes, photovoltaic networks with diesel back-ups
• High subsidies necessary with small impact on market or technology development
• Financing only opportune under very special framework-conditions
Source: Hellstern, Elke (KfW) - The Financing of Renewable Energies, The Financing for Development Conference in Monterrey and its Prospects for Renewable Energies
56 Excerpt of: Martinot, Eric - Renewable energy investment by the World Bank, Pub-
lished in Energy Policy 29(9): 689-699 (2001).

Financing Instruments for Renewable Energy 58
It is quite obvious that the more commercially viable a project is the
lower the component of grants and subsidies should be. In the field of
on-grid RE close to competitiveness the development banks are mainly
offering to complete financial packages of project sponsors by catalytic
or complementary financial packages reducing risk and/or cost to make
the project financially viable. Off-grid and far from competitiveness a
much higher subsidy component is necessary requiring a financial pack-
age with a much higher grant element.
4.3 GEF and CDM Finance
Generally there are high expectations on global environment programs
like the Global Environment Facility (GEF) and the Clean Development
Mechanism (CDM) to contribute to alleviate the problems of financing of
RE projects.
4.3.1 GEF Finance
The Global Environment Facility (GEF) is an intergovernmental fund for
environmental protection. The GEF is managed jointly by the World
Bank, UN Environment Programme (UNEP) and UN Development Pro-
gramme (UNDP) and provides non-reimbursable funding for the incre-
mental costs of enhancing international environmental public goods in
projects. Countries can obtain GEF funds if they are eligible to borrow
from the World Bank (IBRD and/or IDA) or receive technical assistance
grants from UNDP through a country program.
One of its operational programs seeks to reduce GHG emissions asso-
ciated with energy consumption and production through increased use of
already commercially viable REs. Any eligible individual or group may
propose a project. GEF finance is “incremental cost” financing of mar-
ginally economically viable RE projects – to permit an early entry of
these on national power markets. GEF funds the additional costs asso-
ciated with transforming a project with national benefits into one with
global environmental benefits; for example, choosing solar energy tech-
nology over coal or diesel fuel meets the same national development
goal (power generation), but is more costly. GEF grants cover the differ-
ence or "increment" between a less costly, more polluting option and a
costlier, more environmentally friendly option. The value of incremental
cost finance for larger scale RE-projects was partly undermined by an
ideologically driven refusal by GEF to co-finance CDM-projects.57
From 1991 till 2003 GEF has provided about US-$ 840 Mio for renew-
able energy activities. Three trends can be witnessed:
• Support to hardware investments is becoming increasingly less important for GEF.
• There is a move away from direct investment subsidies and towards risk sharing contingent finance.
57 Part of the incremental cost financed by GEF, therefore, was the artificial cost increase
from not allowing CER-revenues to be used to reduce the cost of the energy output.
Financing Instruments for Renewable Energy 59
• The direct subsidy payment has shifted from the “per MW-subsidy” form to a “per MWh subsidy” during the initial five years of operation.
The “per MWh subsidy” involves less risk sharing than the “per MW-
subsidy” and, unlike the latter, does not reduce the size of commer-
cial project finance. However, it facilitates project finance by allowing
a five year loan to be included in the package equal to the NPV of
expected per MWh-subsidy payments. One can expect, though, that
the “per kW-subsidy” will continue to be used for micro- and mini-
hydro power projects and biomass-based generators in rural electri-
fication. One reason for this is reduced costs of transactions; the
other the high value of reducing the upfront size of project finance in
the rural context of weak financial intermediation. In PV-finance GEF
has dropped the initial “per Wp-subsidy”, which was a total misun-
derstanding on both market-expansion and social equity grounds.
GEF now gives “per system subsidies” to systems in the 18-50 Wp
range.
4.3.2 Clean Development Mechanism Finance
The basic principle of the CDM is simple: It allows developed countries
to invest in low-cost abatement opportunities in developing countries and
receive credit for the resulting emissions reductions (CER). Developed
countries can then apply this credit against their 2008-2012 targets, re-
ducing the cutbacks that would have to be made within their borders.
The Renewable Energy and Energy Efficiency Fund (REEF) is a specialized fund of the International Finance Corporation (IFC), focused on investment in private sector projects in the renewable energy and energy efficiency sectors in emerging markets. The fund is targeted to be capitalized by the Global Envi-ronment Facility (US$30 million), IFC, and a group of large investors (US$210 million), which stand to be able to leverage projects with total costs of US$300-800 million.
REEF consists of an equity fund with capitalization of US$110 million and a debt facility with a loan portfolio of US$100 million. The GEF funds are intended to be used for grants to finance incremental costs and/or mitigate risks of in-vesting in projects that may not be acceptable to commercial investment funds, because of their inadequate risk-adjusted rate of return. However, REEF will never serve as the principal investor on a project. The underlying goal of the REEF is that it is to catalyze further investment. This is to be done by making investments in:
- grid-connected renewable energy power projects;
- small-scale off-grid power systems that use renewable energy technologies (e.g., small distributed mini-grids);
- local manufacturing companies and financial intermediaries involved in the renewable energy and energy efficiency sector.
The debt and equity components of the REEF are able to invest primarily in projects with total costs less than US$50 million. However, the equity fund seeks to allocate at least 20% of its resources to smaller projects (less than US$5 million In terms of geographic focus, the guidelines also specify that not more than 60% of the funds can go to one particular region. The regions are defined as Asia, Latin America and the Caribbean, Africa and the Middle East, Central and Eastern Europe, and the Newly Independent States.
Financing Instruments for Renewable Energy 60
As a result, projects in these countries will get a new source of financing
for sustainable development in the introduction of clean and renewable
technologies by selling their emission reduction on the market, for e.g. to
the Prototype Carbon Fund (see box). Thus carbon finance like CDM
potentially could provide bankable, hard-currency revenue streams for
clean technology projects.58
These revenue streams can increase projects’ financial IRRs by several
percentage points, depending on the technology and on the “carbon in-
tensity” of the fuels displaced. Through financial engineering of carbon
transactions, banks can mitigate currency convertibility and transfer risk
and, in some cases, country risk and lending ceilings.
The effectiveness of Clean Development Mechanism (CDM) for facili-
tating investments in RE is limited:
• The CDM-approval process imposes high costs of transaction.
• At CER-prices of around US$4 per ton, the NPV of future CER-revenue amounts to no more than about 2% of the initial cost of investment in wind-farms or small hydropower.
59
Thus Project Developers are experiencing a financing gap because they
are unable to monetize their Emissions Reductions Purchase Agree-
ments (ERPA). Monetization potentially could fill this financing gap, by
bringing additional capital to clean energy project developers:60
58 Summary of Workshop on Tools for Risk Mitigation in Clean Infrastructure, Paris,
November 19-20, 2003 59
The small percentage belittles the psychological impact of the CDM-mechanism on expanding the market for renewable energy. Renewable energy lobbyists in host coun-tries use the “ability to attract CER-payments to the national economy” as an argument to increase political support for RE. 60
Quelle: Usher, Bruce – ERPA Monetization, UNEP/SEFI 2004
The Prototype Carbon Fund (PCF) has pioneered the market for greenhouse gas emission reductions (ERs) as a CDM project facility. The IBRD is the Trustee of the PCF, and purchases Certified Emission reductions on behalf of the Participants in the Fund, Six governments and 17 companies—including power and oil companies from Japan and Europe, and leading global banks, which have contributed US$180 million in funds to the PCF, committed to purchase ERs from approximately 30-40 projects.
PCF prefers to pay for ERs after verification and upon delivery of a certificate confirm-ing that the ERs have been achieved in compliance with relevant criteria. As a rule, PCF payments to the project entity on delivery of ERs should be considered as a revenue stream against which the project entity can invest equity or borrow. (-> Mone-tization Chart) As a pilot activity, the PCF does not endeavor to compete in the Emis-sion Reductions market and is scheduled to terminate in 2012.
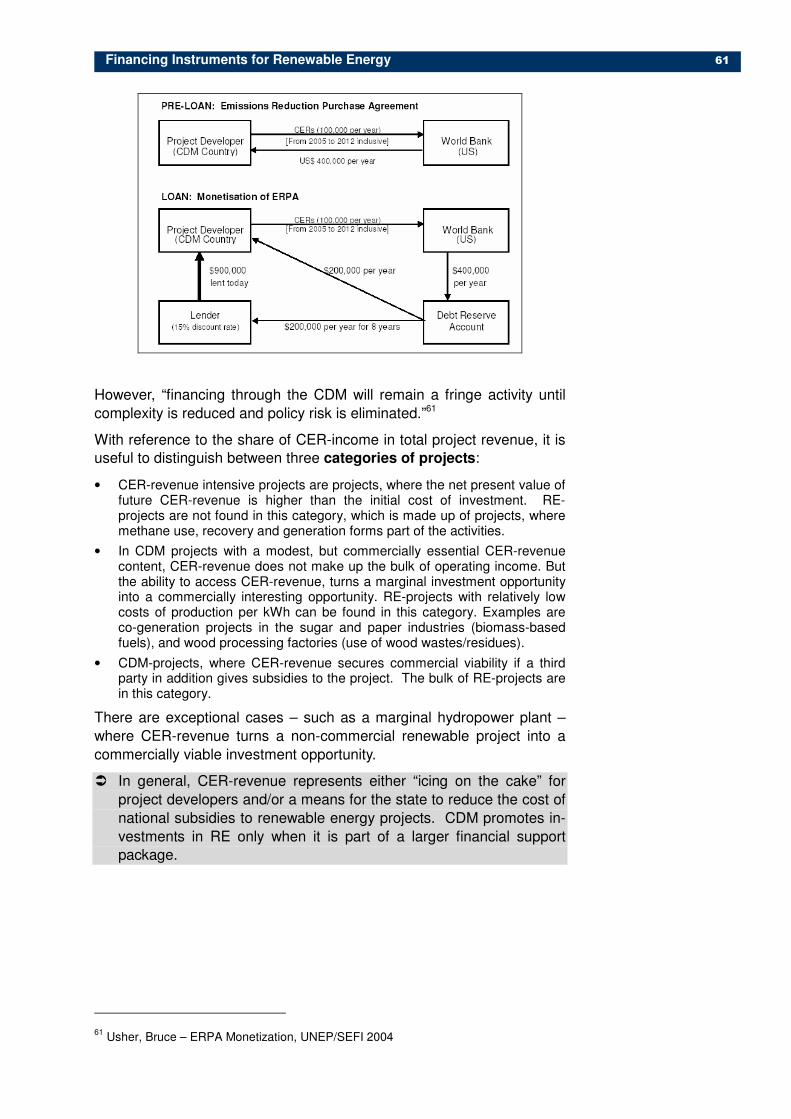
Financing Instruments for Renewable Energy 61
However, “financing through the CDM will remain a fringe activity until
complexity is reduced and policy risk is eliminated.”61
With reference to the share of CER-income in total project revenue, it is
useful to distinguish between three categories of projects:
• CER-revenue intensive projects are projects, where the net present value of future CER-revenue is higher than the initial cost of investment. RE-projects are not found in this category, which is made up of projects, where methane use, recovery and generation forms part of the activities.
• In CDM projects with a modest, but commercially essential CER-revenue content, CER-revenue does not make up the bulk of operating income. But the ability to access CER-revenue, turns a marginal investment opportunity into a commercially interesting opportunity. RE-projects with relatively low costs of production per kWh can be found in this category. Examples are co-generation projects in the sugar and paper industries (biomass-based fuels), and wood processing factories (use of wood wastes/residues).
• CDM-projects, where CER-revenue secures commercial viability if a third party in addition gives subsidies to the project. The bulk of RE-projects are in this category.
There are exceptional cases – such as a marginal hydropower plant –
where CER-revenue turns a non-commercial renewable project into a
commercially viable investment opportunity.
� In general, CER-revenue represents either “icing on the cake” for
project developers and/or a means for the state to reduce the cost of
national subsidies to renewable energy projects. CDM promotes in-
vestments in RE only when it is part of a larger financial support
package.
61 Usher, Bruce – ERPA Monetization, UNEP/SEFI 2004

Financing Instruments for Renewable Energy 62
4.4 Subsidies
4.4.1 Justification of financial support to RETs
One can identify seven justifications of RE-subsidies, each driven by a
specific motivation:
1) Subsidies given to RETs to compensate for price distortions in
the energy market, which prevent economically viable RETs from
competing on equal footing with conventional power supply. (e.g.
subsidized natural gas prices in thermal power);
2) Subsidies to RETs to compensate for the non-inclusion of exter-
nal costs in the financial cost of production of conventional power
(environmental costs or macroeconomic costs of fuel price risks);
3) Subsidies to RETs to compensate for weaknesses in the financial
markets, which prevent RETs from getting access to debt finance on
competitive terms with conventional power plants;
4) “Market jump-starting” subsidies to RETs with a mass market
potential (household PV-systems), which create the minimum de-
mand needed to motivate entrepreneurs to invest in an effective
marketing and after-sales-service infrastructure for the RET;
5) “Learning curve” subsidies to RETs with a strong potential for
technological progress (wind energy, PV-systems). They create the
mass market demand which motivates manufacturers of RET to in-
vest considerable amounts in R&D bringing down each year the cost
of production of new generations of the RET. Subsidies, which in-
crease consumer demand for new RETs, thus, expand the market di-
rectly in the short term and, by accelerating the rate of cost reduc-
tions in the subsidized RET also in the long term;
6) “Sustainable development” subsidies to RE. These subsidies al-
low RETs with an economic cost of production higher than conven-
tional power production (according to conventional economic cost
analysis) to gain market shares. Because conventional power pro-
duction uses finite resources and contributes to global warming it is
not considered to be sustainable;
7) “Picking the winner” subsidies to R&D&D in potentially promising
RETs that are at the pilot stage of development.
4.4.2 Portfolio of Financial Supporting Instruments
The portfolio of financial support instruments used to increase the mar-
ket share of RE-generated electricity is summarized in the matrix below.
• The rows identifies four potential financing sources for subsidies to RE:
(i) subsidies financed by the public budget,
(ii) subsidies raised through electricity invoices,
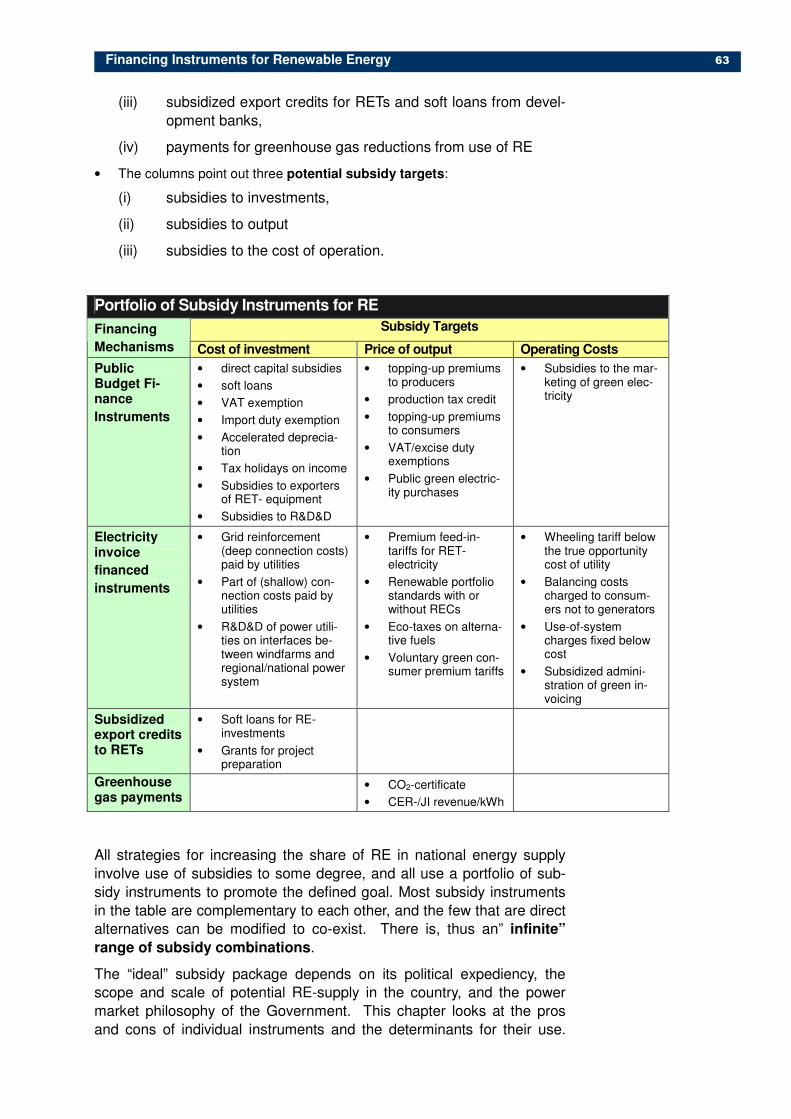
Financing Instruments for Renewable Energy 63
(iii) subsidized export credits for RETs and soft loans from devel-
opment banks,
(iv) payments for greenhouse gas reductions from use of RE
• The columns point out three potential subsidy targets:
(i) subsidies to investments,
(ii) subsidies to output
(iii) subsidies to the cost of operation.
Portfolio of Subsidy Instruments for RE
Subsidy Targets Financing
Mechanisms Cost of investment Price of output Operating Costs
Public Budget Fi-nance
Instruments
• direct capital subsidies
• soft loans
• VAT exemption
• Import duty exemption
• Accelerated deprecia-tion
• Tax holidays on income
• Subsidies to exporters of RET- equipment
• Subsidies to R&D&D
• topping-up premiums to producers
• production tax credit
• topping-up premiums to consumers
• VAT/excise duty exemptions
• Public green electric-ity purchases
• Subsidies to the mar-keting of green elec-tricity
Electricity invoice
financed
instruments
• Grid reinforcement (deep connection costs) paid by utilities
• Part of (shallow) con-nection costs paid by utilities
• R&D&D of power utili-ties on interfaces be-tween windfarms and regional/national power system
• Premium feed-in-tariffs for RET-electricity
• Renewable portfolio standards with or without RECs
• Eco-taxes on alterna-tive fuels
• Voluntary green con-sumer premium tariffs
• Wheeling tariff below the true opportunity cost of utility
• Balancing costs charged to consum-ers not to generators
• Use-of-system charges fixed below cost
• Subsidized admini-stration of green in-voicing
Subsidized export credits to RETs
• Soft loans for RE-investments
• Grants for project preparation
Greenhouse gas payments
• CO2-certificate
• CER-/JI revenue/kWh
All strategies for increasing the share of RE in national energy supply
involve use of subsidies to some degree, and all use a portfolio of sub-
sidy instruments to promote the defined goal. Most subsidy instruments
in the table are complementary to each other, and the few that are direct
alternatives can be modified to co-exist. There is, thus an” infinite”
range of subsidy combinations.
The “ideal” subsidy package depends on its political expediency, the
scope and scale of potential RE-supply in the country, and the power
market philosophy of the Government. This chapter looks at the pros
and cons of individual instruments and the determinants for their use.
Financing Instruments for Renewable Energy 64
The issue of combinations of instruments, which together represent best
practice, is taken up in chapter 5.
The rows in the table are arranged according to the worst case scenario
from the point of view of the Ministry of Finance in the host country, start-
ing with instruments paid by the public budget and ending with foreign
payments for national CO2-credits.
The first two rows (below the heading) show national sources of subsidy
finance; the use of which involves real trade-offs. Grants from pluri-
annual bilateral aid programs, used to cofinance RE-projects, are in-
cluded under “tax payer financed instruments”, as finance from bilateral
donor aid programs is transferred to the national ministry of finance (in
principle, being a line on the national budget) and could have been allo-
cated to other sectors.
Getting approval from the Ministry of Finance for raising subsidies to RE
from the national budget, is very difficult in all developing countries ex-
cept in rapidly developing and larger countries such as China, India and
Brazil. To get “electricity consumer pays” financing instruments accepted
is equally difficult as also the financial situation of the power companies
normally is tight, giving power companies strong motivation and argu-
ments to fight against being imposed new financial burdens.
4.4.3 Taxpayer financed Subsidy Instruments
4.4.3.1 Type of instruments
Strategies that rely on the tax payer to subsidise renewable energy sys-
tems use the following instruments:
• Direct capital subsidies. State grants to purchases of renewable energy equipment are used in industrialized countries for jump starting demand for a RET. In the Netherlands, until 1995, investors in wind farms were given a 30% subsidy; in Denmark until the mid-1980s. In Spain, during the second half of the 1990s, investment subsidies of up to 40% were given to invest-ment in RE; wind farms could be no larger than 20 MW each; and the sub-sidy limit per project was ESP 400 million (US$ 2.8 million). Some German “Länder” give a capital subsidy of up to 8% to wind energy projects. In de-veloping countries, market jump-starting subsidies are given to household PV-systems, while investment subsidies to grid-connected RE-generators are an instrument to facilitate financial closure.
• Soft loans are a different way of giving capital subsidies. In Germany, investors in wind farms can get 10 year loans at a rate of interest of 4.75%.
• Tax exemptions / tax rebates are used to either reduce the cost of the investment (the first three below) or to increase the RE-investors net reve-nue after taxes from the sales of the output (the last item below):
- exemption from payment of VAT on renewable energy equipment
- exemption from import duties for renewable energy technologies
- accelerated tax deductions for investments in renewable energy,
- tax breaks on returns from investments in environmentally sound
initiatives,.
Financing Instruments for Renewable Energy 65
• In India, the VAT on renewable energy equipment is lower than the normal rate. In China, the imports of renewable energy technologies used to be ex-empt from payment of import duty; in India this is the case for renewable energy technologies not produced in India. In the Netherlands, such in-vestments can be written off against tax at any time – a scheme, which is particularly attractive to firms with fluctuating incomes. In Navarra, Spain, wind power investors can deduct up to 15% of their earnings from wind power before handing in their tax returns. In Denmark, a wind turbine owner does not have to pay taxes on the level of production, which equals his an-nual power consumption. Similar tax breaks exist in the Netherlands.
• Top-up premium payments per kWh are paid by the state budget to pro-ducers making use of renewable energy. In Denmark until 2001, IPPs and utility companies were paid a so-called CO2 premium of 0.1 DKK/kWh (=1.5 US-cents) for power produced on the basis of renewable energy. IPPs, were paid an additional premium of 0.17 DKK/kWh (=2.5 US-cents). On top of that, the power utilities were obliged to pay IPPs a tariff equal to the avoided cost of production (around 4.3 US-cents). An indirect form of the topping-up subsidy is the production tax credit of 1.5 UScents per kWh in the USA.
• A kWh premium is paid to electricity consumers that purchase “green energy” from their power companies.
• Public sector purchases of “green power”. In this case the public sector through its green electricity purchases provides both direct demand for green power and assists in developing a voluntary green market in general.
• Lower VAT on power produced by renewable energy. In the Netherlands, the government set the rate of VAT on green energy to 6% compared to the normal rate of 17.5% for conventional energy. This permits renewable en-ergy producers to raise their prices net of VAT, and still be competitive in the eyes of the final private consumers, who cannot deduct VAT payments.
• Eco-taxes / green taxes on non-renewable forms of energy reduce the gap in the market prices of RE and non-RE forms of energy. In theory the ap-proach is ideal, since it intends to “internalise” the “external” costs of non-renewable energy (cost of environmental damages) into the market price of non-RE. In practice, it runs into problems in countries with free cross-border trade. Energy intensive industries must be exempted to avoid bankruptcy due to competing imports from countries that do not impose green taxation on their manufacturers. Domestic electricity generators selling into open regional (cross-country) markets get hurt if their foreign competitors do not pay eco-taxes on their fuel consumption.
• Export subsidies to exporters of renewable energy technology. The Neth-erlands had a generous program in place to subsidize exports of renewable energy technologies to non-OECD countries. The belief was that a larger market for national producers would reduce the cost of production also do-mestically due to economies of scale. Between 1993 and 1996, the German program Eldorado paid 70% of the list price of wind farms in a number of developing countries.
4.4.3.2 Time frame for tax payer financed instruments
Tax payer pays instruments play an essential role in the initial market
start-up phases. Once the RE-market achieves a significant penetration
on the power market, say a 5% penetration, the cost of the subsidy bur-
den to the public budget becomes increasingly heavy, and the need to
“mainstream” RE into the general procedures and rules of the power
market increasingly urgent. Inevitably, then tax payer pays instruments
begin to be phased out – one after the other - and replaced by man-
dated “electricity consumer pays” instruments.

Financing Instruments for Renewable Energy 66
The public subsidy instruments most likely to remain are tax write-offs
and public green electricity purchases.
In developing countries with small power markets and low per capita
income, foreign donor may fund the tax payer pays instruments.
4.4.4 Subsidies to RE financed by Electricity Consumers
4.4.4.1 Mandated Market: definition
All “electricity invoice-financed subsidy instruments” are “forced subsides
to RE” created by regulations. The exception is the voluntary green elec-
tricity scheme. A Mandated Market is defined to include any scheme for
RETs where there is:
• an obligation on transmission and distribution companies to connect RETs,
• a right for commercial power suppliers to recover legally-imposed surplus RET-costs from consumers and
• a national (or state) policy target for the penetration of RE on the market
4.4.4.2 Subsidy cost effectiveness of Mandated Market Schemes
A key discussion is whether to use a variant of the “mandated quantity”
approach (a quantified off-take is defined by law, while the economic
conditions for windfarms are project specific and defined in individual
commercial contracts), or, of the “mandated tariff” approach (economic
terms for off-take and connections are defined by law and confirmed in
standard contracts between the commercial actors).
Much discussion in international literature has centered on the suppos-
edly superior subsidy-cost-effectiveness of mandated quantity regimes
over mandated tariff regimes. Studies financed by the EU Commission
have, in addition, underlined the higher allocative efficiency of an EU-
wide “RE-certificate”-scheme, as it allows member countries with high
RE-ambitions to invest in “RE-certificates” from RE-projects in other EU
countries where costs are lower.62 The theoretical basis of the higher
subsidy-cost effectiveness of mandated quantity regimes is illustrated in
the chart below.
The small arrows indicate the location of individual RET-projects along
the RET-supply curve. We look at the impact to achieve a RE-policy tar-
get of Q4 within four years:
• In a fixed feed-in-tariff regime, a tariff of Tp is offered to all projects,
allowing a quantity of Q4 to be reached – either at the end of the four
years or before.
• In a renewable portfolio scheme, a quantity of Q1 would be re-
quired in national power supply in year 1 (all projects paid the market
clearing price of T1), Q2 in year 2 (all year 2 projects paid the market
62 Once political economy is taken into account, the picture is less rosy. The Netherlands
has shown political willingness to import “green electricity”. Yet, in Spain, Germany, Denmark, the strong political support to green electricity would evaporate if it meant investing in RE-plants outside the national territory.
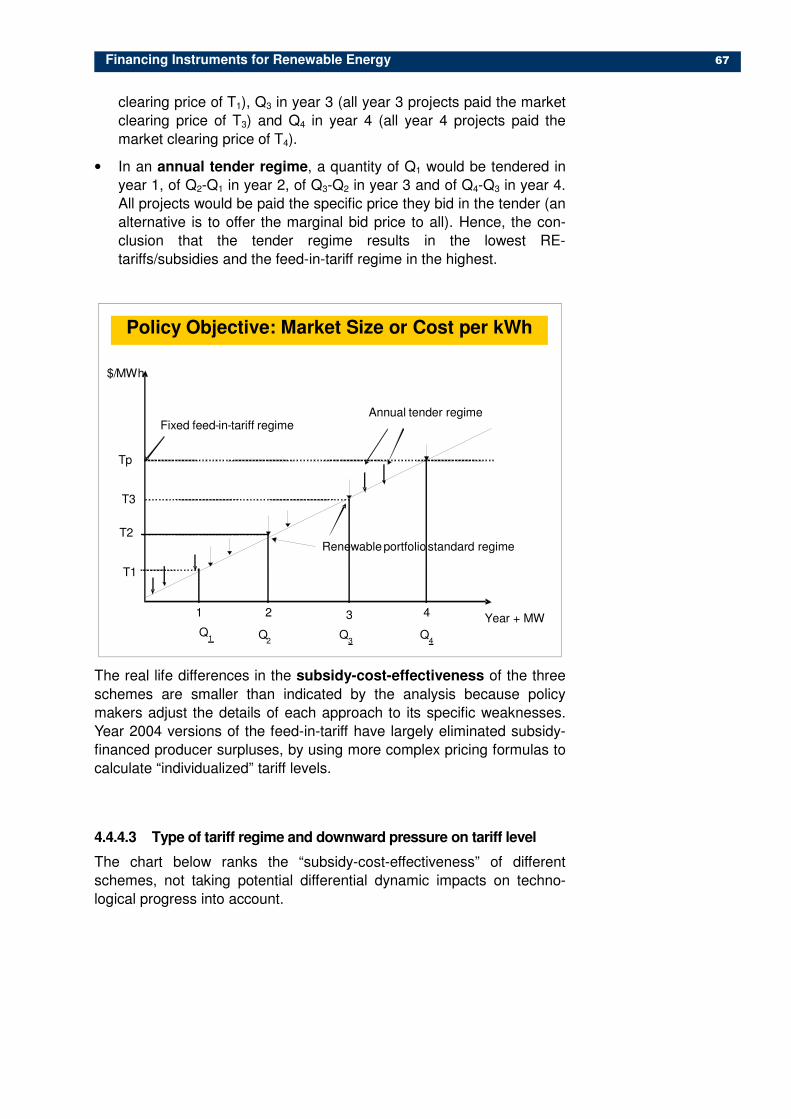
Financing Instruments for Renewable Energy 67
clearing price of T1), Q3 in year 3 (all year 3 projects paid the market
clearing price of T3) and Q4 in year 4 (all year 4 projects paid the
market clearing price of T4).
• In an annual tender regime, a quantity of Q1 would be tendered in
year 1, of Q2-Q1 in year 2, of Q3-Q2 in year 3 and of Q4-Q3 in year 4.
All projects would be paid the specific price they bid in the tender (an
alternative is to offer the marginal bid price to all). Hence, the con-
clusion that the tender regime results in the lowest RE-
tariffs/subsidies and the feed-in-tariff regime in the highest.
Policy Objective: Market Size or Cost per kWh
$/ MWh
Year + MW 1 2 3 4
Tp
T3
T2
T1
Fixed feed - in - tariff regime Annual tender regime
Renewable portfolio standard regime
Q 1 Q
2 Q 3 Q
4
The real life differences in the subsidy-cost-effectiveness of the three
schemes are smaller than indicated by the analysis because policy
makers adjust the details of each approach to its specific weaknesses.
Year 2004 versions of the feed-in-tariff have largely eliminated subsidy-
financed producer surpluses, by using more complex pricing formulas to
calculate “individualized” tariff levels.
4.4.4.3 Type of tariff regime and downward pressure on tariff level
The chart below ranks the “subsidy-cost-effectiveness” of different
schemes, not taking potential differential dynamic impacts on techno-
logical progress into account.
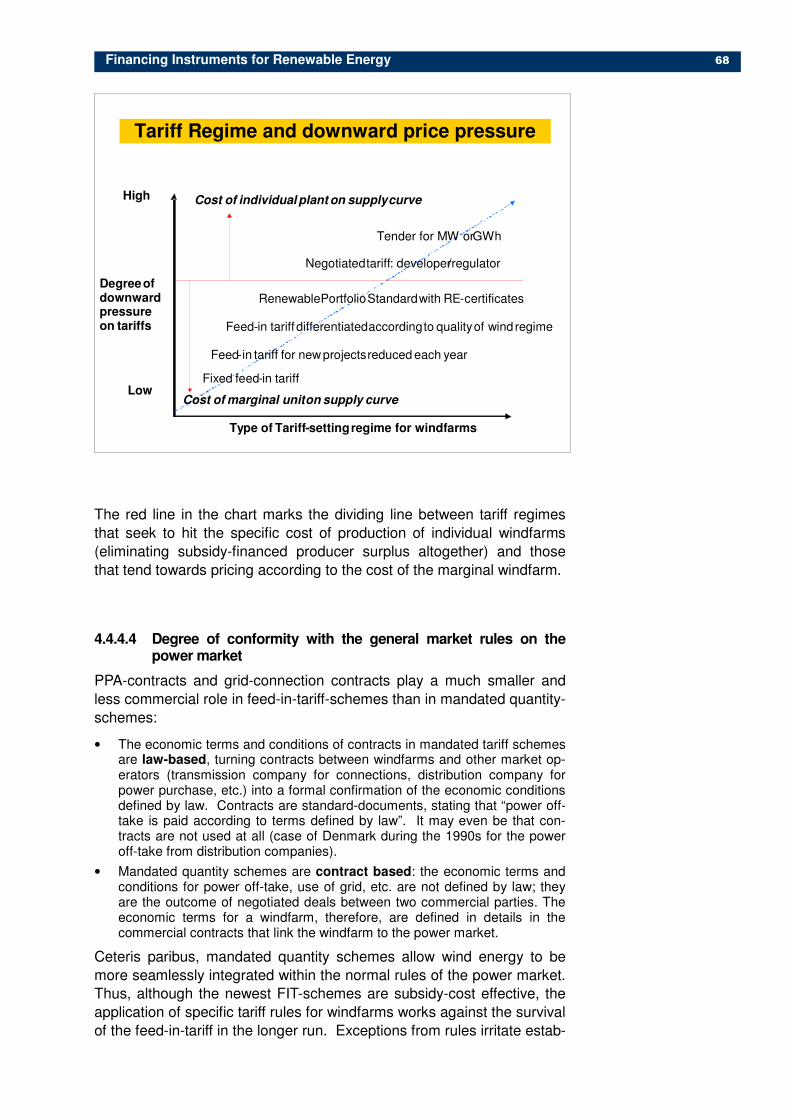
Financing Instruments for Renewable Energy 68
Tariff Regime and downward price pressure
Type of Tariff - setting regime for windfarms
Degree of downward pressure on tariffs
High
Low Fixed feed - in tariff
Feed - in tariff for new projects reduced each year
Renewable Portfolio Standard with RE - certificates
Negotiated tariff : developer /regulator
Tender for MW or GWh
Cost of individual plant on supply curve
Cost of marginal unit on supply curve
Feed - in tariff differentiated according to quality of wind regime
The red line in the chart marks the dividing line between tariff regimes
that seek to hit the specific cost of production of individual windfarms
(eliminating subsidy-financed producer surplus altogether) and those
that tend towards pricing according to the cost of the marginal windfarm.
4.4.4.4 Degree of conformity with the general market rules on the power market
PPA-contracts and grid-connection contracts play a much smaller and
less commercial role in feed-in-tariff-schemes than in mandated quantity-
schemes:
• The economic terms and conditions of contracts in mandated tariff schemes are law-based, turning contracts between windfarms and other market op-erators (transmission company for connections, distribution company for power purchase, etc.) into a formal confirmation of the economic conditions defined by law. Contracts are standard-documents, stating that “power off-take is paid according to terms defined by law”. It may even be that con-tracts are not used at all (case of Denmark during the 1990s for the power off-take from distribution companies).
• Mandated quantity schemes are contract based: the economic terms and conditions for power off-take, use of grid, etc. are not defined by law; they are the outcome of negotiated deals between two commercial parties. The economic terms for a windfarm, therefore, are defined in details in the commercial contracts that link the windfarm to the power market.
Ceteris paribus, mandated quantity schemes allow wind energy to be
more seamlessly integrated within the normal rules of the power market.
Thus, although the newest FIT-schemes are subsidy-cost effective, the
application of specific tariff rules for windfarms works against the survival
of the feed-in-tariff in the longer run. Exceptions from rules irritate estab-

Financing Instruments for Renewable Energy 69
lished market players and reduce the operational effectiveness of power
pools.
The international trend, therefore, is to make frameworks more com-
patible with the general operation of the power market. Originally,
the market access rules were tailor made to the needs and technical
characteristics of wind energy. Now, the pendulum is swinging the other
way: the regulatory framework for RET-generators is adjusted to better
match the needs and rules of the liberalized power market.
Tariff-Regime and conformity with the market
Type of Tariff - setting regime for windfarms
Degree of conformity with market rules for liberalized electricity market
High
Low Fixed feed - in tariff / Lowest tariff tender for MW / Negotiated tariff
Feed - in tariff benchmarked against retail price + premium
Renewable Portfolio Standard with RE - certificates
Power pool price + premium
Season - dependent feed - in tariff
Time - of - day - dependent feed - in tariff
Merchant RE - plants selling into pool
RE - generator selling green electricity to retail consumers
The chart ranks different market schemes according to the market com-
patibility dimension. The red line charts the dividing line between fixed
and market-determined tariffs. It shows ways in which the fixed tariff re-
gime is adjusted to “mimic” the outcome of free market forces. In Costa
Rica, for example, the rate of the feed-in-tariff, depends on the time of
day (higher during peak demand hours) and on the season (higher dur-
ing the dry season, when hydro-reservoirs are low).
The use-of-system charges – the terms for using the transmis-
sion/distribution grid and for operating on the power market - are also
increasingly priced to reflect the higher costs of satisfying the needs of
intermittent power supply.
4.4.4.5 Burden sharing
An issue in the “electricity consumer pays” strategy is how to distribute
the extra cost associated with renewable energy use among the regional
and local utilities on an equitable basis. Since wind and hydro-resources
are unevenly distributed, some regional companies have a “high” rate of
wind energy penetration, others a low rate.
Financing Instruments for Renewable Energy 70
The renewable portfolio standard’ (RPS) approach solves this directly and
equitably. In feed-in-tariff and tender systems, a possibility is to let the
system operator (either the operator of the power pool or of the trans-
mission system) charge a levy on all traded / transported electricity. The
revenue from this levy is then used to subsidise new investments in re-
newable energy via a tender system (the British NFFO approach), or to
compensate the different distribution companies for the extra-cost of
their renewable energy purchase obligations (the Danish “public service
obligation”, PSO, approach).
A different approach used in the German Electricity Feed Law during the
1990s was the hardship clause. The law obliged regional distribution
companies to purchase any amount of power, produced by wind farms in
their concession area. The law, therefore, contained a so-called “hard-
ship clause”, which allowed utilities to pass on costs of their premium
payments to wind power to the neighboring utility once wind energy
reached a 5% penetration.
4.4.5 Smart Subsidies
Subsidy will be necessary, but should be considered as a transitional
policy tool only. Subsidies are needed to expand service, but many sub-
sidy programs impact long-term sustainability and distort market signals.
The answer are “smart subsidies” reaching intended markets only and
encouraging least cost option to achieve social goals at least cost while
providing incentives for business to serve target markets. Thus, smart
subsidies must have the following qualities63:
• “They are well targeted. A rigorous method is applied to determine who should receive the subsidies; and the same discipline is used to prevent "free riders".
• They support least cost options for service. Smart subsidies are not mar-ried to particular technologies or to state implementation of such technolo-gies.
• They encourage commercial participation by the private sector. Ulti-mately, government's role is to formulate an effective business environment for private initiatives to prosper.
• Similar to the government's construction of roads and bridges, smart subsi-dies are applied to the front-end cost. It is when subsidies are given to consumption that sustainability problems arise.”
These are the criteria for the selection of subsidies, which obviously for
different stages of the technology introduction cycle, are needed in a
different package of subsidy instruments:
• A “tax payer pays” based strategy is useful in the short term to get a de-velopment process started.
• The “electricity consumer pays” strategy is the solution in the mid term, as tax based financing would become too expensive.
• However, each of these instruments need some built-in element of phas-ing out, to give an incentive that only long-run viable RE is supported.
63 Excerpt of: Del Rosario, Tony - Alleviating Poverty by Sustaining Energy Development
Accessibility Issues and Innovative Financing, World Energy Council, G8 Energy Minis-ters Meeting, Detroit, USA, May 1-3, 2002

Financing Instruments for Renewable Energy 71
As an example of smart subsidies, the reduction of the up-front in-
vestment may trigger entrepreneurs to develop RE products and may
be applicable to buy down the costs of purchase of available products
for consumers. For low-income customers, additional measures are re-
quired such as subsidies for end-user price reductions. One-off costs
of connection, installation or purchase of many energy solutions may be
useful within such an approach: biogas generators, efficient stoves, hy-
dropower connections, solar electricity, solar heating.
As a general international tendency in the developed countries – with
deep pockets and relative high RE ambitions – the following can be ob-
served, which are not always in line with the principles of smart subsi-
dies:
• a shift in the subsidy burden from tax-payers to electricity consumer
pays instruments;
• replacement of direct investment subsidies to RE (“per MW capacity”
subsidies paid by the state budget) to subsidies linked to the output
(per kWh-subsidy);
• focus on elimination of “windfall” subsidy payments (standard subsi-
dies or tariffs creating artificial producer surpluses for best-site RE-
operators);
• RE-generators are increasingly charged the full-cost for market ac-
cess services provided by grid operators and system operators.
A special case under electricity invoice paid instruments is the voluntary
premium market for “green electricity”, which can be developed by
electricity retailers through appropriate branding. Development of the
green electricity market requires a sophisticated industrial-commercial
base and a large number of relatively wealthy households.
In the tight financial context in most developing countries, the most
relevant financing sources for RE-subsidies are promotional credits and
CER-revenues. Normally, it is not difficult to get political approval for
using soft credits from donors to co-finance RE-projects. Using soft
credits to finance RE-projects may reduce their availability for other sec-
tors in the country, but more often than not, the effect is that more soft
credits are attracted to the host country, and less to others. CER-
revenues and the rare foreign-purchases of green electricity credits
are technically speaking not subsidies, but market payments for positive
attributes of renewable energy. Yet, they are totally “free gifts” to the
host country, and are, therefore fully exploited whenever possible.
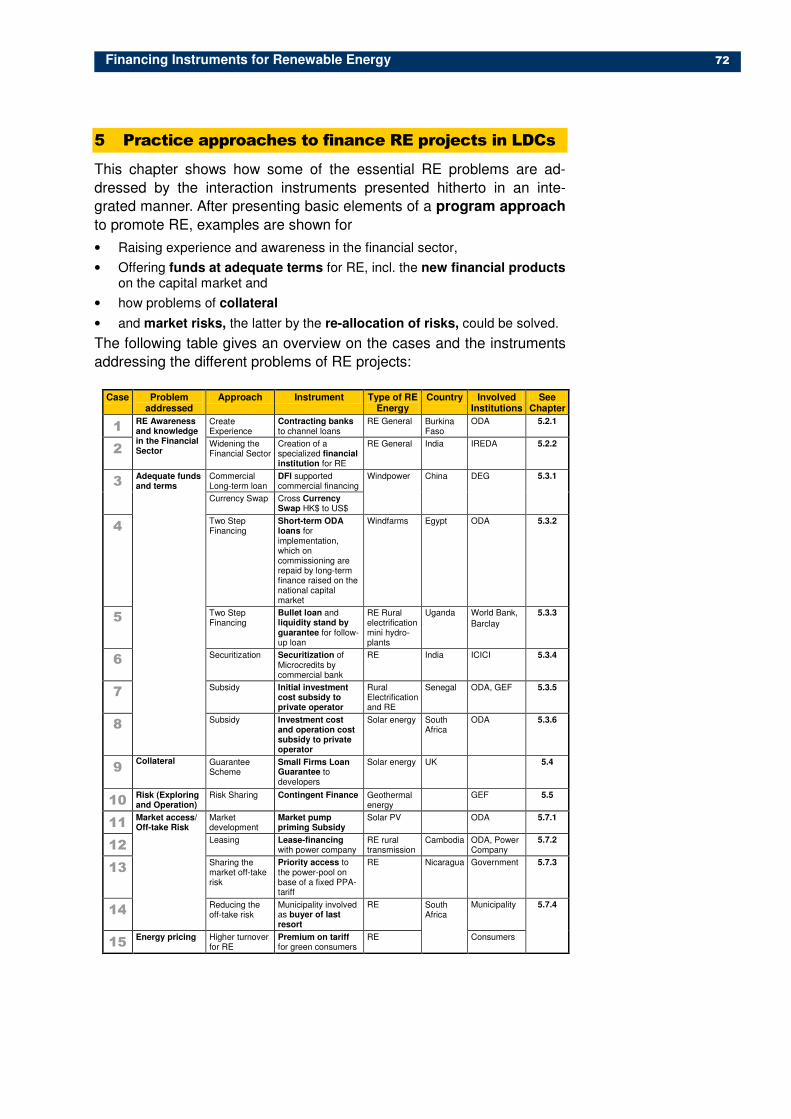
Financing Instruments for Renewable Energy 72
5 Practice approaches to finance RE projects in LDCs
This chapter shows how some of the essential RE problems are ad-
dressed by the interaction instruments presented hitherto in an inte-
grated manner. After presenting basic elements of a program approach
to promote RE, examples are shown for
• Raising experience and awareness in the financial sector,
• Offering funds at adequate terms for RE, incl. the new financial products on the capital market and
• how problems of collateral
• and market risks, the latter by the re-allocation of risks, could be solved.
The following table gives an overview on the cases and the instruments
addressing the different problems of RE projects:
Case Problem addressed
Approach Instrument Type of RE Energy
Country Involved Institutions
See Chapter
1 Create Experience
Contracting banks to channel loans
RE General Burkina Faso
ODA 5.2.1
2
RE Awareness and knowledge in the Financial Sector
Widening the Financial Sector
Creation of a specialized financial institution for RE
RE General India IREDA 5.2.2
Commercial Long-term loan
DFI supported commercial financing 3
Currency Swap Cross Currency Swap HK$ to US$
Windpower China DEG
5.3.1
4 Two Step Financing
Short-term ODA loans for implementation, which on commissioning are repaid by long-term finance raised on the national capital market
Windfarms Egypt ODA 5.3.2
5 Two Step Financing
Bullet loan and liquidity stand by guarantee for follow-up loan
RE Rural electrification mini hydro-plants
Uganda World Bank,
Barclay
5.3.3
6 Securitization Securitization of Microcredits by commercial bank
RE India ICICI 5.3.4
7 Subsidy Initial investment cost subsidy to private operator
Rural Electrification and RE
Senegal ODA, GEF 5.3.5
8
Adequate funds and terms
Subsidy Investment cost and operation cost subsidy to private operator
Solar energy South Africa
ODA 5.3.6
9 Collateral Guarantee
Scheme Small Firms Loan Guarantee to developers
Solar energy UK 5.4
10 Risk (Exploring and Operation)
Risk Sharing Contingent Finance Geothermal energy
GEF 5.5
11 Market development
Market pump priming Subsidy
Solar PV ODA 5.7.1
12 Leasing Lease-financing
with power company RE rural transmission
Cambodia ODA, Power Company
5.7.2
13 Sharing the market off-take risk
Priority access to the power-pool on base of a fixed PPA-tariff
RE Nicaragua Government 5.7.3
14
Market access/ Off-take Risk
Reducing the off-take risk
Municipality involved as buyer of last resort
RE Municipality
15 Energy pricing Higher turnover
for RE Premium on tariff for green consumers
RE
South Africa
Consumers
5.7.4

Financing Instruments for Renewable Energy 73
5.1 Basic Elements of a Program Approach to promote RE
As soon as the policy ambition is to “mainstream” RE in bulk power mar-
kets and rural electrification programs, one shifts from the RE-project
implementation mode to a program-approach to RE.
The optimization process for RE-finance in a program approach con-
cerns the interlinked processes of structuring project finance and the
composition of project revenues in a way which maximizes the benefits
to society of investments in RE.
The optimization of project finance and of project revenue are equally
essential elements in the RE-promotion strategy; focusing on one with-
out getting the other right, prevents mainstreaming.
Because of contextual differences between countries and the wide range
of instrument combinations, which can deliver similar results, generally
applicable recipes for RE mainstreaming cannot be developed.
Instead, this chapter attempts (i) to offer guidance to policy makers on
how mainstreaming of RE is be approached, and (ii) show examples of
innovative solutions to concrete problems in finance, but also demon-
strates shortcomings of some innovative approaches in practice. This
chapter first lists the necessary elements of mainstreaming approaches.
Then it uses case studies of optimization concepts to show how new
financing instruments, new regulations and institutional innovations can
interact to generate the mixture of energy and economic development
results, which politicians are looking for.
Large segments of RE-Technologies still not able to attract commercial
financing and subsidies are needed for kick-start over a limited period
until market distortions and barriers will be eliminated to a large extent,
but wide-spread use and dissemination of RE can not be financed
through subsidy schemes or concessionary financing, as this would
overstress the possibilities of ODA.64
At a very general level, best practice mainstreaming of RE calls for the
following:
• The quantified policy targets for RE-supply are based on an analysis of the national RE-supply curve and its identification of the country’s commercially viable, economically viable, and economically non-viable RE-potential. Oth-
64 Seifried, Rolf - Financing Energy Services for Rural and Urban Poor within German
Financial German Financial Co- Co-operation operation, Brussels, July 23, 2002.
Optimization of RE Finance
Project Financing Project Revenue
Financing Instruments for Renewable Energy 74
erwise, quantitative long-term targets are hollow statements with no rele-vance in practice, which do not strengthen investor certainty about the RE-market, and reduce the risks premiums charged by equity investors and banks.
• A holistic financing strategy makes cost-effective use of a mix of new fi-nancial risk management instruments, more effective regulations and a carefully chosen portfolio of subsidy instruments to reach the Government’s policy targets for RE.
• Risks in upfront financing and in revenue generation are allocated to the agents best capable of handling them.
• The cost-reducing potential of regulatory reforms and commercial finance innovations is exploited fully before subsidies are used to cover commercial viability gaps.
• The pricing and subsidy instruments encourage the lowest-cost RE-supply to be developed; while pilot investments in a “marginally economic RET” are undertaken only if the RET offers a large and realistic supply po-tential in the long-term.
• “Electricity consumer pays” subsidy instruments for RE are normally more effective than “tax payer pays” subsidy instruments with regard to allocative efficiency (right price signals), income distributional impacts and RE-expansion per unit of subsidy.
• Donor activities are coordinated and comply with the specific modalities of the program approach. Since donors and Governments in developing countries have routine procedures and forms of providing assistance, which may not be effective within the framework of a program approach, both sides need adjusting.
• Grant finance - whether by donors or by Governments – does not substi-tute for private capital, but is used in ways that leverages the amount of pri-vate finance for RE, even when the short-term gains are not evident.
• Concessional loans from donors are channeled to RE-projects through the local capital markets, not by bypassing it.
• The power market rules provide for an equitable burden sharing of extra costs associated with a penetration of RE between the distribution compa-nies, retailers and large consumers purchasing power on the bulk market.
• Access rules in favor of RE-generators are compatible with the general market rules established for the power market, and do not distort the smooth operation of the bulk market for power.
5.2 RE Awareness in the Financial Sector
5.2.1 Contracting banks to channel loans to rural electrification pro-
jects - Burkina Faso
Burkina Faso is attempting to separate the grant-financing function of
the Rural Electrification Fund (REF) from the debt financing functions of
the commercial banks. Mixing grants and commercial loan functions in
one single institution risks to create confusion about the mandate and
behavior of the institution.
In Burkina Faso, the government leaves rural expansion to be done by a
single national distribution company. Isolated grid projects will be done
by local communities, who will set-up a electrification cooperative for the
purpose. The REF gives 75-80% grants to the rural investment projects,

Financing Instruments for Renewable Energy 75
and the remaining 20-25% in the form of 10 year loans on concessional
terms, which are administered by a rural bank on behalf of the REF. The
rural bank runs no risk. The idea of the approach is that the local banks
will find rural electrification too risky to enter. Administering the loans
creates trust between the electricity cooperative (demonstrating its ability
to repay loans on schedule) and the rural bank. Thus, when need arises
for a major re-investment calling for a bank loan, the bank will be willing
to give it.
While the idea of making banks comfortable with rural electrification in
the long run is laudable, the approach is high risk. It is against the logic
of the long-term institutional objective that the loan terms do not reflect
normal commercial terms. The track record of electricity cooperatives
created “externally” for concrete projects in rural electrification is not
strong. The REF may be too soft in its insistence on loan repayments.
5.2.2 Creation of a specialized financial institution for RE – India
(IREDA)
As the capital market was not willing to finance renewable energy pro-
jects adequately the Indian Government opted for the creation of a spe-
cialized financial institution for that purpose, which seems a rather logic
approach and – taking into consideration the results for renewable en-
ergy promotion as well as the institution financial side – a fairly success-
ful one.
Indian Renewable Energy Development Agency Limited (“IREDA”) is a
Government owned specialized financial institution under Ministry of
Non-conventional Energy Sources (MNES) for promoting and financing
renewable energy and energy efficiency projects in India. IREDA was
incorporated as a Public Limited Government Company in March 1987.
Seat of the financial institution is New Delhi, where almost its entire staff
of some 100 is working, as IREDA has non branches in the country.
IREDA has evolved into a good, active, financially sound and innovative
Financial Development Agency for the Indian renewable energy sector.
During sixteen years of operations, IREDA has sanctioned loans to over
1600 projects with cumulative sanctions and disbursements of € 1.1 bil-
lion and € 0.5 billion till 31 March, 2003. IREDA has supported about
30% of about 3700 MW of power generating capacity based on renew-
able energy sources installed in the country so far.
� In the case of IREDA we can observe the combination of the use of
the local capital market, ODA, tax-subsidies and the utilization of
various financial instrument on the lending and on the refinancing
side.
IREDA extends long-term credits directly to project sponsors (7-12
years repayment period) with a grace period (up to 3 years) at competi-
tive interest rates (9-12% p.a.) to refinance up to 70% of the project cost
of renewable energy projects.
IREDA's resources are mobilized from the following main sources:
Financing Instruments for Renewable Energy 76
• Equity contribution from the Government of India
• International Development assistance
• Market borrowings
• Bank and other borrowings
IREDA is availing assistance from various international organizations like
International Development Association (IDA), IBRD, KfW, Asian Devel-
opment Bank and IBRD. As more than 80% of the IREDA’s funds are
borrowing, their terms and conditions play a crucial role. Domestic bor-
rowing are made by tax free secured redeemable energy bonds with a
maturity of 7-10 years with a favourable interest rate of 6%. In the case
of foreign borrowings IREDA needs to hedge against risks of interest
rate variations and foreign exchange rate variations with the foreign-
exchange swaps and interest swaps.
Although IREDA’s non-performing asset portfolio is not neglectable,
IREDA’s performance compares well with other Indian term lending insti-
tutions.
IREDA has satisfactorily performed the operational and institutional re-
sponsibilities in accordance with the diverse objectives for which it was
created. Despite its fairly young age, IREDA is an able and competent
financial institution and has retained its financial strengths through years
of very rapid growth and in sectors with considerable technological and
financial risks. Furthermore it demonstrated the financial viability for
several types of RE projects, which are nowadays – due to this success-
ful example - are financed by the commercial banking sector.
However, in the mid-term view it seems worthwhile to review the strate-
gic approach and market positioning of a special purpose financial insti-
tution like IREDA:
• Due to the limited size of the market it will be rather difficult for a centralized and small institution like IREDA to reach the productivity of universally ac-tive banks in its financial and credit operations.
• Thus, it seems rather reasonable to think about a proper division of labour between IREDA and the commercial banks.
• As an apex level institution offering refinancing services or (partial) guaran-tees, IREDA could make use of its specific knowledge of the market and energy projects, while commercial banks would handle the financial and credit operations more efficiently. Although this may be only a mid-term ap-proach, it would be worthwhile for potential donors to take this strategic op-tion into consideration for the project and program design in the sector.
5.3 Adequate Funds and Terms
5.3.1 DFI structuring commercial financing of renewable energies
Qingdao Huawei Windpower in the P.R. of China, a Joint venture be-
tween Nordex Energy GmbH (2/3) and Qingdao Dongyi (1/3), is the

Financing Instruments for Renewable Energy 77
case of the first project financed wind park in China.65 Its 15 Wind tur-
bines located in Qingdao (eastern coast) have an output capacity of
16.35 MW (about 34.200 MWh p.a.) and a total cost of US-$ 17.5 mil-
lion.
DEG financed 58% of the cost with long term loan (maturity of 9 years
including 1 year grace period) with a mortgage style repayment sched-
ule. To cover the foreign exchange risk a cross currency swap HK$ to
US-$ was used.
However this financial package would have been to risky if the other
major risks would not have been addressed and structured properly:
• The wind yield was assessed by wind studies.
• The EPC risk is borne by the main supplier Nordex with a semi-turnkey contract, and technical completion guarantee.
• There is a tariff subsidy of approximately 79% compared to grid average (financial completion guarantee)
• There is a chance for additional income by carbon reduction (25.000 t p.a.) with possible of 1million USD if certification is successful.
5.3.2 Introducing new financial products: Two step finance for Wind-
farms in Egypt
Egypt has at the Gulf of Suez some of the best wind resources in the
world. The windfarm effort so far has been undertaken by the New and
Renewable Energy Authority, NREA, a former off-spring of the national
power company. The build-up of windfarm capacity is impressive, but
rests on an artificial foundation. The windfarm investments were fi-
nanced 100% by soft loans, on-lend to NREA through the national de-
65 Biley, Amichia - How to structure commercial financing of renewable energies – the
case of the first project financed wind park in China, International Renewable Energy Conference, Bonn, June 1, 2004

Financing Instruments for Renewable Energy 78
velopment bank. NREA’s PPA-tariff with the national power company of
10 piaster/kWh does not fully cover the costs of operation and debt ser-
vice.
The exploitation of the economic potential for windfarms requires the
removal of energy pricing and capital market barriers. First, subsidized
gas prices reduce the financial value of saved thermal power production.
Second, the import duty and sales tax on windfarm components artifi-
cially increase the cost of windfarm output. Third; the national capital
market does not offer project financing on internationally competitive
terms. The situation on the capital market can be summarized as fol-
lows.
• Investors have to rely on bank loans for their debt finance. Under the best of conditions, a private investor would be offered (i) interest rate of 13%; (ii) loan maturity of 8 years; (iii) 30% equity-self-finance. Non-recourse lending is unlikely.
• The bond market is almost non-existent in Egypt. The equity market is small. There are few listed companies and turn-over of equity is low.
The result is a huge “financial cost-benefit gap”, as the minimum PPA-
tariff requirement of 27.6 piaster/kWh is 19.4 piaster/kWh higher than the
financial value of the cost savings for the “single buyer” in the national
power system and 17.7 piaster/kWh above the economic value of the
avoided cost savings.66
The economic cost-benefit gap is to be close by a threefold combination
of external finance, provided in a manner that interacts with the national
capital market:
• All new windprojects are to be developed as CDM-projects to tap CER-revenue, which could bring 1.1 piaster/kWh in revenue (=UScents 0.2).
67
• Soft loans (mixed credits) from donors continue to be the main source of subsidy support for windfarms. But to eliminate the foreign exchange risk of the long-term investment, donors are asked whether it is possible to provide soft credits as short-term loans, which upon commissioning of the windfarm are repaid by long-term finance raised on the national capital market.
66 Due to subsidised gas prices in thermal power production, the financial value of cost
savings are lower that their economic value to the national economy. 67
The payment falls each year, due to improved thermal power plant efficiency. In 2024, the average emission in steam turbine plants of 0.43 kg/CO2 triggers a payment of 1.0 Piaster/kWh.
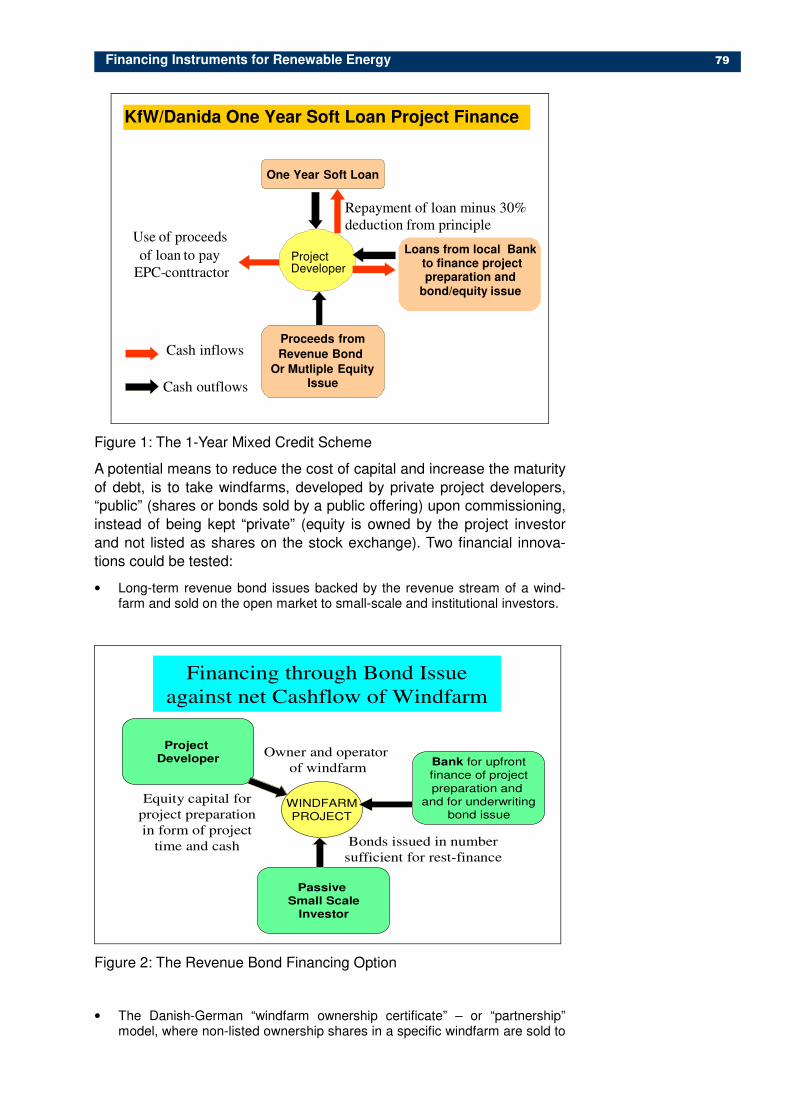
Financing Instruments for Renewable Energy 79
Project Developer
KfW/Danida One Year Soft Loan Project Finance
Proceeds from Revenue Bond
Or Mutliple Equity Issue
One Year Soft Loan
Use of proceeds
of loan to pay EPC - conttractor
Repayment of loan minus 30% deduction from principle
Cash inflows
Cash outflows
Loans from local Bank to finance project preparation and
bond/equity issue
Figure 1: The 1-Year Mixed Credit Scheme
A potential means to reduce the cost of capital and increase the maturity
of debt, is to take windfarms, developed by private project developers,
“public” (shares or bonds sold by a public offering) upon commissioning,
instead of being kept “private” (equity is owned by the project investor
and not listed as shares on the stock exchange). Two financial innova-
tions could be tested:
• Long-term revenue bond issues backed by the revenue stream of a wind-farm and sold on the open market to small-scale and institutional investors.
WINDFARMPROJECT
Financing through Bond Issue
against net Cashflow of Windfarm
Bank for upfrontfinance of projectpreparation and
and for underwritingbond issue
Passive Small Scale
Investor
ProjectDeveloper
Bonds issued in number
sufficient for rest-finance
Equity capital for
project preparation
in form of project
time and cash
Owner and operator
of windfarm
Figure 2: The Revenue Bond Financing Option
• The Danish-German “windfarm ownership certificate” – or “partnership” model, where non-listed ownership shares in a specific windfarm are sold to
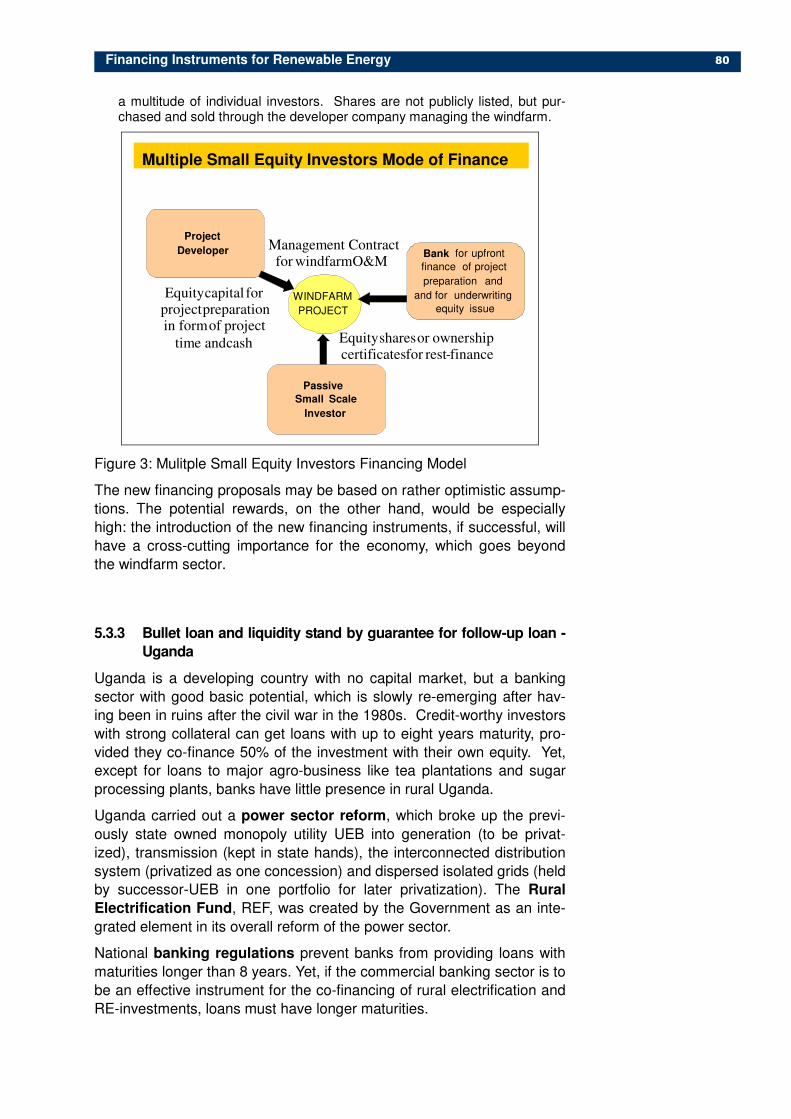
Financing Instruments for Renewable Energy 80
a multitude of individual investors. Shares are not publicly listed, but pur-chased and sold through the developer company managing the windfarm.
WINDFARM PROJECT
Multiple Small Equity Investors Mode of Finance
Bank for upfront finance of project preparation and
and for underwriting equity issue
Passive Small Scale
Investor
Project Developer
Equity shares or ownership certificates for rest - finance
Equity capital for project preparation in form of project
time and cash
Management Contract for windfarm O&M
Figure 3: Mulitple Small Equity Investors Financing Model
The new financing proposals may be based on rather optimistic assump-
tions. The potential rewards, on the other hand, would be especially
high: the introduction of the new financing instruments, if successful, will
have a cross-cutting importance for the economy, which goes beyond
the windfarm sector.
5.3.3 Bullet loan and liquidity stand by guarantee for follow-up loan -
Uganda
Uganda is a developing country with no capital market, but a banking
sector with good basic potential, which is slowly re-emerging after hav-
ing been in ruins after the civil war in the 1980s. Credit-worthy investors
with strong collateral can get loans with up to eight years maturity, pro-
vided they co-finance 50% of the investment with their own equity. Yet,
except for loans to major agro-business like tea plantations and sugar
processing plants, banks have little presence in rural Uganda.
Uganda carried out a power sector reform, which broke up the previ-
ously state owned monopoly utility UEB into generation (to be privat-
ized), transmission (kept in state hands), the interconnected distribution
system (privatized as one concession) and dispersed isolated grids (held
by successor-UEB in one portfolio for later privatization). The Rural
Electrification Fund, REF, was created by the Government as an inte-
grated element in its overall reform of the power sector.
National banking regulations prevent banks from providing loans with
maturities longer than 8 years. Yet, if the commercial banking sector is to
be an effective instrument for the co-financing of rural electrification and
RE-investments, loans must have longer maturities.

Financing Instruments for Renewable Energy 81
The obstacle can be circumvented by offering a bullet loan to an inves-
tor in a rural electrification and renewable energy project.68 An investor in
need of a 15 year loan is provided with an eight year loan, but the amor-
tization profile is similar to that of a 15 year loan, except that there us a
“bullet payment” due at the end of year 8, when the remaining principal
has to be repaid. At that time, the bank gives a new 7-year loan to the
investor to pay the bullet payment; the annual amortization payment re-
mains the same.
The procedure poses a liquidity risk for the bank: the bank may at the
end of the seventh year period be in a liquidity crunch, preventing it from
giving the seven year loan to the bullet-payment. This risk can be miti-
gated by liquidity stand-by guarantees by a third party. It steps in,
when the bank, due to shortage of liquidity, is unable to give the investor
a new 7-year loan when the bullet payment is due.
The bullet-loan approach is pilot-tested in the financing of the West Nile
rural electrification project, a regional grid project, which is supplied
by power from two minihydro plants under construction. The World Bank
World Bank gives a loan to the Bank of Uganda, which onlends the loan
to the commercial bank Barclay at the average cost of capital to Barclay.
Barclay offers the investor, who is a blueship client, a loan for seven
years, but the client knows that in the end he will de facto get a loan for
15 years. The repayment rate is based on 15 years. To reduce the risk
for Barclay a separate credit support facility is established, which
places funds into an account to accumulate enough funds to pay the
required bullet payment at the end of year 7 and take over the rest-loan.
Barclay pays a fee for that facility, which is passed on to the borrower via
an increase in the interest rate.
That the bank loan, which is enabled through this mechanism, provides
only about 10% of total project finance, shows how difficult and long-
term task it is to develop commercial project finance for rural electrifica-
tion.
5.3.4 Securitizing micro-credits via partial payment risk guarantee
It is well-known that the development of a mass market for solar home
systems in a dealer-sales approach depends on the availability of micro-
credits to assist households with the co-financing of the investment in
the systems.
Finance for these can be provided through dedicated solar home system
credit lines provided by donors to micro-finance institutions or by raising
funds from the local finance markets. An innovative example of the latter
is the securitisation of microcredits in India. In 2004, ICICI, an Indian
bank, paid $4.3m for a portfolio of 42,500 loans from SHARE, a microfi-
68 A bullet loan is a term loan with periodic instalments of interest, where the entire – or a
sizeable part – of principal is due at the end of the term as a final payment. The final payment on a bullet loan is sometimes referred to as a bullet.
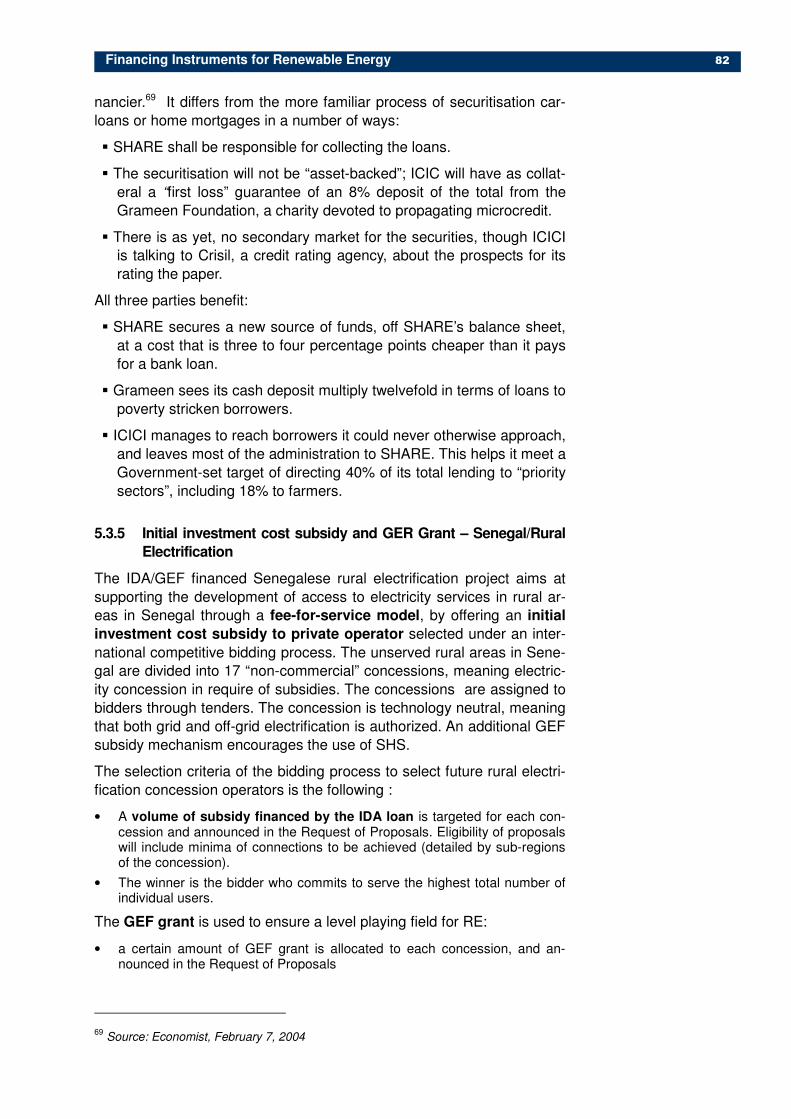
Financing Instruments for Renewable Energy 82
nancier.69 It differs from the more familiar process of securitisation car-
loans or home mortgages in a number of ways:
� SHARE shall be responsible for collecting the loans.
� The securitisation will not be “asset-backed”; ICIC will have as collat-
eral a “first loss” guarantee of an 8% deposit of the total from the
Grameen Foundation, a charity devoted to propagating microcredit.
� There is as yet, no secondary market for the securities, though ICICI
is talking to Crisil, a credit rating agency, about the prospects for its
rating the paper.
All three parties benefit:
� SHARE secures a new source of funds, off SHARE’s balance sheet,
at a cost that is three to four percentage points cheaper than it pays
for a bank loan.
� Grameen sees its cash deposit multiply twelvefold in terms of loans to
poverty stricken borrowers.
� ICICI manages to reach borrowers it could never otherwise approach,
and leaves most of the administration to SHARE. This helps it meet a
Government-set target of directing 40% of its total lending to “priority
sectors”, including 18% to farmers.
5.3.5 Initial investment cost subsidy and GER Grant – Senegal/Rural
Electrification
The IDA/GEF financed Senegalese rural electrification project aims at
supporting the development of access to electricity services in rural ar-
eas in Senegal through a fee-for-service model, by offering an initial
investment cost subsidy to private operator selected under an inter-
national competitive bidding process. The unserved rural areas in Sene-
gal are divided into 17 “non-commercial” concessions, meaning electric-
ity concession in require of subsidies. The concessions are assigned to
bidders through tenders. The concession is technology neutral, meaning
that both grid and off-grid electrification is authorized. An additional GEF
subsidy mechanism encourages the use of SHS.
The selection criteria of the bidding process to select future rural electri-
fication concession operators is the following :
• A volume of subsidy financed by the IDA loan is targeted for each con-cession and announced in the Request of Proposals. Eligibility of proposals will include minima of connections to be achieved (detailed by sub-regions of the concession).
• The winner is the bidder who commits to serve the highest total number of individual users.
The GEF grant is used to ensure a level playing field for RE:
• a certain amount of GEF grant is allocated to each concession, and an-nounced in the Request of Proposals
69
Source: Economist, February 7, 2004

Financing Instruments for Renewable Energy 83
• the bidder who offers to use renewable energy may claim for an additional subsidy which comes from the allocated GEF grant
• there will be a ceiling defining a limited maximum unitary amount of GEF subsidy for each renewable technology (for instance max $ of GEF subsidy per Wp installed in case of photovoltaics). This ceiling will be defined ac-cording to the lesser of the values of subsidies observed in other WB pro-jects for the same technologies, and the incremental cost calculated in the Project Brief.
• the selection criteria to identify the winning bid remains the maximum num-ber of consumers served using both the non-targeted “IDA source” of sub-sidy and the targeted “GEF subsidy”.
This way the bidders will receive a double incentive:
• to increase the proportion of renewable in their proposal, because of the additional “GEF” subsidy they can get to help overcome the adoption barri-ers,
• to claim for the lowest “GEF” subsidy per renewable energy based system, since they need to maximize the number of consumers served to win, using the global amount of subsidy (IDA+GEF) allocated for the considered con-cession.
The approach has interesting merits. The weaknesses are (i) that the
SHS-system sizes to be used are pre-defined and (ii) that some of the
17 concessions may not attract any bidders.
5.3.6 Fee-for-Service PV-Concessions - South Africa
The fate of the fee-for-service concessions in South Africa shows the
perils of public-private-partnerships for social projects that depend on
heavy subsidization during the investment phase as well as during the
operating phase:
As early as 1997, the Department of Mining and Energy (DME) in South
Africa had identified a number of under-serviced geographic areas, suit-
able for the off-grid electrification of some 300000 rural dwellings over
ten years using stand-alone home solar systems. To make the projects
viable and sustainable, a capital subsidy of R3500 per installed home
solar system would be funded from the fiscus through the DME.
• Interim concession contracts of 18 months were intended as a pilot
phase from which lessons could be learned for the final 20-year con-
cessions. In 2001, these interim tri-partite contracts were eventually
signed for each of five concession areas, between the concession-
aire, the National Electricity Regulator (who acts as an agent of the
DME), and Eskom, as the licensed distributor in the areas.
• However, free electricity promises in election campaigns, broken
commitments to concessionaires concerning operating subsidies,
made its doubtful, whether the schemes would be sustainable in the
longer term. The concessionaires suffered serious damages to their
reputation and credibility with suppliers and customers, as their
promised installation and connection dates were delayed, and the
fee-for-service first dropped substantially and then increased by
200%.

Financing Instruments for Renewable Energy 84
• The Eskom/Shell concessionaire's technical partner for the manufac-
ture of the home solar systems, Conlog, experienced some early
technical problems in the pilot phase and has since ceased manu-
facture of the systems due to an "unsustainable business case" in-
cluding a limited and erratic local demand that is inadequate to sup-
port further developments required.
This case illustrates that – despite all good intentions at the beginning –
these rather complex schemes with many partners are especially prone
to politically or commercially motivated stretches, that question the rules
of the game in an environment which is still developing in legal terms. To
ease such risk, these approaches for the RE promotion could benefit
substantially if they would include some forms of Partial Risk Guaran-
tees.
5.4 Collateral Problems
The UK’s Small Firms Loan Guarantee (SFLG) scheme can serve as a
model for how commercial lending can be directed from banks and to-
wards PV-system dealers and developers of rural electrification projects
who want to expand their activities.
The Small Firms Loan Guarantee (SFLG) makes it possible for small
businesses with a workable business proposal, but lacking security, to
borrow money from approved lenders. The scheme is structured as fol-
lows:
� The SFLG is a joint venture between the UK Department of Trade
and Industry (DTI) and approved lenders.
� It is administered by the Small Business Service (SBS), an agency of
the DTI. In the REF-approach to rural electrification (section 4.5), a
Business Development Organisation is normally contracted to pro-
vide TA on a cost-shared basis to rural entrepreneurs. It would be the
logical “SBS”-candidate.
� Borrowers must present a viable business plan for the investment.
� The loans are provided by the approved lenders who make all the
commercial decisions about borrowing.
� The Government, through the SFLG, helps by providing a guarantee
to the lender, guaranteeing 75 per cent of the loan (maximum loan of
£30,000).
� The business pays the Government a premium of 2 per cent per year
on the outstanding loan amount.
5.5 Exploring Risk and Operation Risk: Contingent finance for
geothermal resources for energy production
Geothermal energy poses two risks for investors. During the pre-
investment phase, rather large investments are needed to establish the
geological resource potential at the investigated site, and checking
whether it can be exploited commercially. During operation, the re-

Financing Instruments for Renewable Energy 85
source may turn out to be less attractive than estimated, with the result
that peak production capacity declines after a few years.
The tolling arrangement represents the extreme case of upfront risk
sharing. In this, a Government entity invests in the exploration and de-
velopment of a geothermal resource. Once the commercial feasibility of
exploiting the resource is established, the national energy regulator is-
sues a tender for the electrification part of the project. The tender can
be for a steam purchase contract, in which case the electricity genera-
tor sells the electricity on the power market, or a steam-to electricity
conversion contract. In the latter case, the government entity – a state
owned power company - provides steam to the plant without cost and
accepts power generated from the plant against a conversion fee.
The scheme has two drawbacks: no private capital is attracted to finance
geothermal exploration and the geothermal plant; and the assumed effi-
ciency advantage of private investors in the construction and operation
of the plant is not exploited.
The “Geothermal Energy Development Fund” created by the World Bank’s “ECA Geothermal Energy Development Project” is a more effi-cient and market-based energy risk-sharing facility for mitigate explora-tion and development risks70 The fund uses the “contingent finance” to risk sharing.
The fund has three financing windows.
• A “technical assistance window” assists in developing a data base on geothermal resources and strengthening local capacities.
• A partial risk guarantee window partially ensures investors against the short-term upfront geological risk of exploration and/or the long-term geo-logical risk of facing a deposit with lower than expected temperature, higher than expected levels of mineralization or difficult re-injectivity.
• An investment financing window provides contingent grants and low cost loans.
The soft investment finance is a traditional investment subsidy. The
preparation of better a priori resource data and the partial risk guarantee
for the exploration phase, on the other hand, make efficient use of public
70 The World Bank - GEF Geothermal Energy Development Project focuses on Russia,
Poland, Bulgaria, Romania, the Czech Republic, Slovakia and Hungary. The facility covers the geological risks of geothermal investments.
Contingent Risk Sharing of Geothermal Resource Risk
Project Finance:
Pre-Investment Reservoir
Drilling
Project Revenue:
Blow-Outs and failing Heat
Production

Financing Instruments for Renewable Energy 86
money to attract private risk capital to the sector. Large, risky outlays
during the pre-investment phase have a particularly large impact on the
NPV of the expected cost of investment (and levelised cost of produc-
tion) in pre-feasibility studies. One can therefore, expect the leveraging
effect to be considerable.
5.6 Market- and Off-take Risk
5.6.1 Market pump-priming Subsidies and Market deepening subsi-
dies - Promoting PV-systems in the off-grid electrification mar-
ket
The market for PV-systems in rural electrification consists of two seg-
ments:71 (i) PV-power supply for productive uses in social institutions,
such as schools, rural clinics, community telecom centers and water
pumping; (ii) solar home systems (SHS) from rural households and small
rural businesses. The institutional PV-market segment depends on
finance from donor programs, who normally finance the cost of invest-
ment 100% upfront. The key success factors for sustainability are well-
known.
• Financial engineering in this market means making the social institutions receiving the PV-systems and the ministry responsible for the beneficiary institutions aware of the O&M costs of the PV-systems and of the need to inscribe a budget line for PV-O&M in the annual budget of the institutions.
• The most sustainable delivery mode is to supply the institutional systems through established dealers. This improves the likelihood that effective after sales service is available.
Despite their mass-market potential, solar PV-systems have not
achieved the market penetration, which was expected. This has been
blamed on the accessibility problem posed by the “large” upfront pay-
ment for the SHS-systems
SHS “is not a substitute for grid based electrification; it plays a supple-
mentary role to grid-based electrification, offering individual consumers a
power supply option when grid based electricity is not available. SHS is
an individual consumer good and is best promoted as an individual con-
sumer product, as in this way its advantages in terms of flexibility. Fi-
nancial engineering in SHS-promotion means getting (i) commercial
banks involved on the supply side, financing working capital and invest-
ments finance to dealers and (ii) micro-finance institutions to provide
consumer loans for SHS purchases. The difficulty in getting finance to
both the supply and the demand side explains, why despite the market
penetration of SHS in developing countries has been lower than ex-
pected by energy experts in the early 1990s. This is not for want of do-
nor projects trying out different delivery and financing models: leasing,
fee-for-service, sales-to-end users, consumer finance via banks, con-
sumer finance dealers, diffusion via regional power utilities; the list goes
71
Commercial demand from telecommunications for productive use in relay stations and other applications is important in terms of installed MW but is outside rural electrification.
Financing Instruments for Renewable Energy 87
on. The multitude of approaches, however, illustrates the fundamental
problem: there was widespread confusion about how to proceed.
Developers lacked the confidence in the market and the financial means
– because sales volumes were low - to undertake effective promotion
campaigns. This “deadlock” situation justifies the introduction of "mar-
ket pump priming subsidies". A market pump priming subsidy is a
temporary, time limited subsidy to lift market demand to a size that is
sufficiently large to permit commercial delivery structures to be devel-
oped. The objective is to get the development of this “natural commer-
cial market” jump started to a level that makes investments by the pri-
vate sector in a nation-wide SHS marketing and service infrastructure
commercially viable. A market pump-priming subsidy for solar home sys-
tems should:
• Have a maximum lifetime of two to five years
• Be launched with either pre-announced time-limits for its duration or with pre-announced sales targets, after which the subsidy scheme will stop.
• Have pre-announced declining subsidy rates during the subsidy period.
The “natural, without subsidies” market for solar home systems amounts
to 10-20 percent of households in the off-grid areas. The objective of a
“market deepening subsidy” is to expand sales to reach the poorer
households also.
5.6.2 Energy Market Access: Lease-buy-back scheme to channel
long-term donor loans to RE-generators - Cambodia
The scheme described below has been conceived to accelerate invest-
ments in rural electrification in Cambodia, where the financial markets
for individual project developers are largely dysfunctional – project loans
have a maximum of four years maturity and require 50% equity co-
financing - but where the public power utility, EdC, although being very
small and financially weak, is relatively well-functioning, and, therefore,
credit-worthy in the yes of the donor community.72
EdC assists rural electrification by investing in rural transmission using
soft loans from international donors, but is not interested in managing
small rural distribution systems. Cambodia has very active entrepre-
neurs operating in rural areas, who largely using informal financial chan-
nels to raise capital for investments. Since finance is scarce, they make
recourse to second-rate equipment to keep down the costs of invest-
ment. This leads to high costs and low quality of rural power supply.
A scheme was therefore conceived to combine the economies of scale
in investment and in finance of EdC with the managing and operating
advantages of rural entrepreneurs. In this, EdC finances and constructs
the rural transmission lines, including simple back-bone distribution
grids, which are leased to the local entrepreneurs having the local distri-
bution concession. The entrepreneurs own and operate the local “distri-
bution utility”, and finance the line drops from the backbone grid to the
72 The scheme has not been approved yet by the Government of Cambodia.
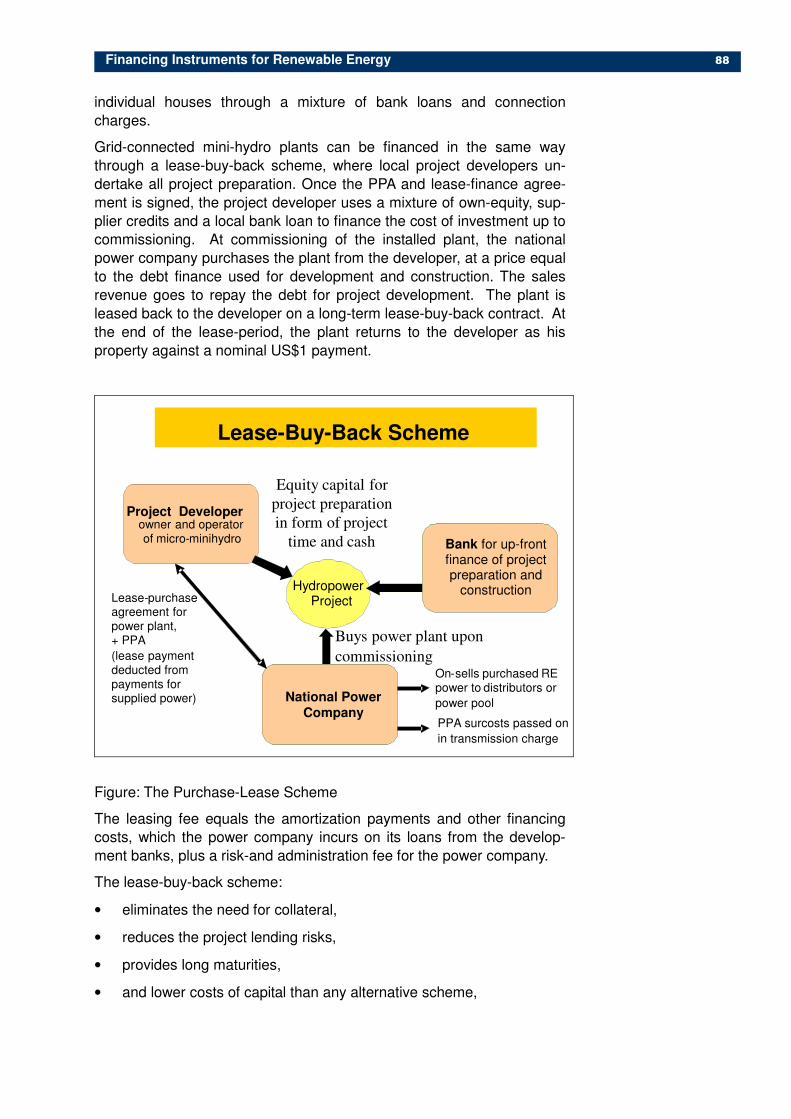
Financing Instruments for Renewable Energy 88
individual houses through a mixture of bank loans and connection
charges.
Grid-connected mini-hydro plants can be financed in the same way
through a lease-buy-back scheme, where local project developers un-
dertake all project preparation. Once the PPA and lease-finance agree-
ment is signed, the project developer uses a mixture of own-equity, sup-
plier credits and a local bank loan to finance the cost of investment up to
commissioning. At commissioning of the installed plant, the national
power company purchases the plant from the developer, at a price equal
to the debt finance used for development and construction. The sales
revenue goes to repay the debt for project development. The plant is
leased back to the developer on a long-term lease-buy-back contract. At
the end of the lease-period, the plant returns to the developer as his
property against a nominal US$1 payment.
Hydropower Project
Lease-Buy-Back Scheme
Bank for up-front finance of project preparation and
construction
National Power Company
Project Developer owner and operator of micro - minihydro
Buys power plant upon
commissioning
Equity capital for
project preparation
in form of project
time and cash
Lease - purchase agreement for power plant, + PPA (lease payment deducted from payments for supplied power)
On - sells purchased RE power to distributors or power pool
PPA surcosts passed on in transmission charge
Figure: The Purchase-Lease Scheme
The leasing fee equals the amortization payments and other financing
costs, which the power company incurs on its loans from the develop-
ment banks, plus a risk-and administration fee for the power company.
The lease-buy-back scheme:
• eliminates the need for collateral,
• reduces the project lending risks,
• provides long maturities,
• and lower costs of capital than any alternative scheme,

Financing Instruments for Renewable Energy 89
making the financing conditions of small biomass based and hydrobased
RE-projects competitive with supply from conventional power plants.
This eliminates the need for subsidies.
5.6.3 Reducing the market risk for intermittent power supply – shar-
ing the market off-take risk: Nicaragua
RE-projects for the bulk power market need long-term PPAs with a fi-
nancially sound off-taker to be bankable. In many developing countries,
however, the financial situation of the distribution companies is weak.
The experience of Nicaragua illustrates what options are available.
Nicaragua has first class RE-resources, especially in hydropower, geo-
thermal energy and MW wind energy.
Nicaragua implemented in the late 1990s a power sector reform, which
broke up the state-owned national power company, vertically separated
ownership of generation, transmission and distribution and privatized the
company’s generation and distribution assets.73 Union Fernosa operates
as the only large distributor. Three to four local project developers were
in 2003 ready to invest in windfarms and tried to negotiate a PPA with
the regulator and the distribution company, Union Fernosa. However, for
the financial community, Union Fernosa is not a creditworthy off-taker.
Faced with this situation, the Government in 2004 introduced a special
legislation giving the intermittent RE-power sources, windfarms and
run-of-the-river hydropower plants priority access to the power pool, at
a fixed PPA-tariff during ten years. Since the Government did not
want to destroy the working of the competitive power pool by allowing
large supply to be priced outside its mechanism, the priority access is
limited to hydropower plants that are installed within fives years of the
issue of the decree, and to an initial 20 MW windfarm capacity allocated
by competitive tender. Losing windfarm developers can later access the
scheme, provided they finance a study for the system operator, demon-
strating that their additional power can be absorbed by the power sys-
tem.74 The system operator will pay the RE-generators; any financial
73 The privatisation of some generation assets failed, and are in 2004 still owned by the
state owned holding company, which replaced the previous power company. 74
A study commissioned by the Government concluded that the national power system could economically absorb 50-60 MW of intermittent wind power.
Guaranteeing Market Access for Intermittent RE-Generation
Priority Access
to Power Pool
Long term PPA with
Distribution com-
pany
RPS imposed
on Retailers

Financing Instruments for Renewable Energy 90
losses – the difference between the fixed PPA-tariff and the power pool
prices – will be charged to all off-takers from the power pool on a pro-
rated basis.
The scheme provides two benefits for RE-generators:
• it eliminates the market risk (indirectly the risk is transferred to all
other generators, as the size of the free power market, for which they
compete is reduced) and
• largely reduces the payment risk for supply.
5.6.4 Reducing the off-take risk in green electricity schemes: South
Africa
RE-promotion strategies making use of a green electricity scheme can
reduce the off-take risk of green electricity by interventions on the project
finance side and the off-take side.
Policy makers in South Africa use an interesting mix of instruments
and institutional solutions in their green electricity scheme for wind en-
ergy.
South Africa is a tough market for RE, as the cost of coal-fired power
production is the cheapest in the world. Thus, although South Africa has
reasonably good wind resources the green electricity premium of wind-
farms is much higher than elsewhere. The political willingness to pay for
such a high green premium is low.
A private developer had for years tried to get the first commercial
windfarm in South Africa established: the 5 MW Darling windfarm lo-
cated some 80 kms West of Cape Town. But, due to the high cost of
production it was not possible to get the project finance together. In the
end the green electricity scheme was seen as an option to make the
project commercially viable. The main innovative feature of the green
electricity scheme was to get a municipality involved as buyer of last
resort, thereby taking over the off-take risk:
• The nearest large distribution company, owned by Cape Town Municipality, is to sign a 25 year purchasing power agreement (PPA) to purchase the output of the windfarm, paying a substantial green premium.
• The distribution company resells the electricity to “green consumers”. These are a broad spectrum of different private firms in different sectors (in-cluding those who want to export “environmentally clean” products to the
Reducing the Off-Take Risk in Green Electricity
Project Finance: Investment subsidy to
reduce size of premium Pre-Investment Reservoir Drilling
Project Revenue: Off-taker of last resort or revenue guarantee

Financing Instruments for Renewable Energy 91
US and EU niche market for these higher priced products) as well as state and provincial Government institutions.
• National power sector regulation does not allow distribution companies to make losses by paying non-commercial prices for any inputs. This means that the distribution company can not recover losses on non-sold green electricity via its average tariff. To solve that problem, the municipality takes over the market risk by purchasing non-sold “green” quantities for its municipal institutions.
Although this was an innovative solution to the financing problems of the
Darling project, the concept has little to offer as a means to sustain na-
tional investments in wind energy. Its potential replicability is too lim-
ited, are not so many potential buyers of last resort and the unsubsi-
dized green electricity premium of windfarms in South Africa is so large.
Since the Government is interested in getting an additional 45 MW of
windfarms installed by 2010, equal to nine times the size of the Darling
windfarm, another solution had to be found. The preliminary strategy of
the Government, to be implemented with the help of a GEF project75 , is
the following.
• The size of the green premium is reduced by using soft loans from donors (35% grant element) to co-finance a substantial part of the investments in the windfarms and by the state providing a roughly 15% investment subsidy to the windfarms.
• A green power guarantee scheme will be set up, initially funded by GEF (US$3.2 million contribution) to a dedicated account, to cover shortfalls which distribution companies face in the uptake of the green power pur-chased from windfarms. The shortfall will be assessed and averaged on a six-month basis.
• Additional light investment subsidies are given through GEF-support to wind measurements and pre-feasibility studies of sites.
However, to provide sufficient demand for 45 MW it would require a
mandated central Government demand for green electricity. Thus, a
“state sector renewable energy portfolio standard” could outline
green electricity purchase targets for state institutions with increases
year for year.
This example makes clear, that – besides certain financial instruments -
it requires a lot of combined efforts and financially strong good will, to
make RE investment viable, as long as its price is not competitive in
commercial terms.
6 Some general conclusions
This study tried to give an overview on the needs and approaches for
RE financing in LDCs. Taking into consideration the great range and
variety of problem situations of the different RE technologies in the vari-
ous context frameworks, it is quite clear that such a study cannot pro-
duce a standard set of reproducible recipes for RE finance. Each situa-
75 South Africa Wind Energy Programme (SAWEP), GEF OP-6.
Financing Instruments for Renewable Energy 92
tion requires a specific diagnostic and a tailor-made approach for finan-
cial closure.
However, trying to summarize the quintessence of this study, we like to
finish this study with some general conclusions giving an outline of the
rationale of a RE financing strategy calling for a well-targeted support
by promoters of RE and development:
1. The limited financial viability and the elevated risk profile of RE
require special efforts in financing and structuring.
2. The financial approach has to determine the distance of the RE pro-
ject to commercial financial viability, and define a set of cost reducing
and income increasing measures on three levels (project, framework,
outside support) to create conditions of financial viability ex ante
as a key factor for investment decision.
3. Risk Allocation between project sponsor, contract partners, the (fi-
nancial) market and promoting institutions is the other key determi-
nant for successful project financing of RE.
4. This risk structuring and financial engineering of RE projects is a
complex and time-consuming process, demanding staying power
and corresponding resources itself.
5. For projects with a perspective of viability, the financial world has
ready a well-equipped toolbox with adequate instruments to finance
the specific needs of RE projects and to structure its risks, at least in
theory.
6. A proper risk allocation with view on the markets perception of RE
can make a generally viable RE project creditworthy at all or credit-
worthier, thus helping to attract more funds and reduce the cost of fi-
nancing in the market.
7. However in practice, local capital markets are not the magic solu-
tion due to their limitations on the different levels of financial deepen-
ing in the various markets, although even in LDCs they can offer
some contribution to financial closure.
8. The 3-dimensional RE financing gap (funds/terms/instruments)
can be bridged with the assistance of institutions with higher risk-
absorptive capacity, and which by themselves can potentially offer
each professional financial instrument to complete the market. How-
ever, as the resources of promoting institutions are not unlimited,
their approach has to be selective and targeted.
9. To maximize results donors should offer assistance to pick the low
hanging fruits of RE, i.e. projects, which are close to market com-
petitiveness. Smart subsidies can be a valuable instrument in such a
context, especially if their use needs to be only transitory.
10. Donors could help create creditworthiness (Training for RE project
sponsors and RE interested financial institutions, Risk structuring
and coverage) and look for leverage, offering assistance (Financial
Guarantee, subordinated debt) to bring down the risk of RE to a
market-attractive level.

Annex
ANNEX
Annex 1: Capital Market Conditions in Developing Countries
Annex 2: Leveraging Capital with Risk Management Instruments
Annex 3: References

Annex
Annex 1 : Capital Market Conditions in Developing Countries
Domestic Financial Markets – Potential for RET ?
Also the facts and deficiencies about financial
and capital markets in DCs are well known, the
dimension of disparities to the mature financial
markets are less present in our minds. However,
at the moment they are simple facts to be taken
into consideration for thinking about the potential
sources and instruments of commercial financ-
ing of RET in DCs:
More than 85% of the world’s capital funds are
concentrated in the mature financial markets,
which also absorb the vast majority of them. The
share of the emerging markets and the develop-
ing countries markets in the total capitalization is
about 15%. About two thirds of the latter are
concentrated on the Asian emerging market
economies, leaving only minor shares for Latin
America and Africa.
The classic instruments of bank assets and public debt securities dominate even the capital markets of
the emerging markets. The more advanced instruments of private debt securities and stock markets play
a minor but recently growing role.
Asia70%Latin America
14%
Middle East6%
Europe6%
Africa4%
Emerging Capital Market Size 2002: US-$ 8,404 bn
Bonds, Equities and Commercial Bank
Source: IMF 2004
EU
34%
North America
37%
Japan
14%
Emerging Markets
11%
Others
4%
World Capital Market Size 2002:
US-$ 106,443 bn
Bonds, Equities and Commercial Bank Assets
Source: IMF
0% 20% 40% 60% 80% 100%
Asia
Latin America
Middle East
Africa
Europe
Stock Market Capitalization 1.965 308 52 116 81
Debt Securities (Private) 820 178 13 21 28
Debt Securities (Public) 706 464 5 47 287
Bank Assets of Commercial banks 4.911 773 598 315 381
Asia Latin America Middle East Africa Europe
Emerging
Markets:
Capital
Market
Structure
US-S bn

Annex
Furthermore, domestic credit to the private sec-
tor per capita is still only $ 1149 in emerging
markets, and only meager $ 113 in LDCs. The
figures for gross private capital flows and FDI
are even well below these amounts. Even with
substantial progress in the deepening and de-
velopment of these financial markets this is a
clear indication of the general limitations of the
availability of funds for RET.
In summary:
• LDC-countries have a very low level of financial activities as they do not have much (idle) capital and they do not attract much from abroad. RET would have to compete with all the other sectors for very scarce re-sources. Even for smaller off-grid invest-ments this will be difficult without additional funds as a package of technology and fi-nancing.
• Emerging markets with their access to international financing are playing on a higher level, but face the problems of volatil-ity of their own and the international mar-
kets, thus limiting the availability of funds and instruments especially at the long end and during crisis periods.
• These figures are not only an indication of the very limited volume of available funds, but also for the development of these finan-cial markets and the practical availability of financial instruments: You don’t have to think about sophisticated credit derivates when there are no credits at all!
Country Group
Low income
developing
countries
Middle
income DCs
+ emerging
markets
Industrialized
countries + Mature
financial markets
Population mio 2495 2738 966
GNI total in bn 1070 5056 25596
GNI per cap $ 430 1850 26490
Domestic Credit to private sector in % GDP 26,5 62,2 133,1
Domestic Credit to private sector 283 3145 34068
Domestic Credit to private sector US/$ per cap. 113 1149 35267
Gross Private Capital Flows % GDP 4,4 12,4 22,9
Gross Private Capital Flows US/cap 19 229 6068
Gross FDI % GDP 1,7 3,7 6,6
Gross FDI Per cap 7 68 1749
Investment in Energy with private participation 29 bn 156 bnSource: World Development Indicators 2004
Funds for Investment per Capita (US-$ 2002)
113
1149
35267
19
229
6068
7
68
1749
0 5000 10000 15000 20000 25000 30000 35000 40000
Low incomedeveloping countries
Middle income DCs
Industrializedcountries
Gross FDI
Gross Private Capital Flows
Domestic Credit to private sector

Annex
Annex 2 : Leveraging Capital with Risk Management Instruments
Risk management in project finance involves the
intelligent use of regulatory and financial risk
sharing instruments to:
- attract private debt and equity capital to project finance,
- get debt capital with longer maturities into the market,
- reduce the cost of capital for a given matur-ity.
The buzz word is “leveraging”: investing an
amount equal to “Y” in risk management instru-
ments allows a multiple of “YxN” of private loan
and equity finance to be channeled to RE-
investments.
Some changes in the regulatory framework re-
duce the absolute risk of RE-projects; an exam-
ple is the introduction of a feed-in tariff for RE.
The reduction in risk reduces the cost of capital
and hence the cost of production per kWh.
Other regulatory instruments and financial risk
sharing instruments reallocate project risks from
lenders and equity investors to entities better
equipped to handle perceived specific risks.
Sovereign guarantees for loans of development
banks to RE projects transfer default risks to the
state, which reduces the cost of private project
finance. Project insurance and weather deriva-
tives transfer risks from the project investor to
private insurers and hedgers against a premium.
The impact of that on the cost of capital is ex-
plained with the help of the chart below.
A project developer or a lender reacts to project
risks and uncertainty by either (i) staying away
from undertaking the activity, or (ii) adjusting his
risk-free rate of return upwards as compensation
for accepting the risk and/or (iii) taking insurance
against the risk. The “project risk-rate of return”
indifference curve (RR-line) shows how a project
developer’s asked for rates of return on equity
(or a lender’s rate of interest) vary according to
the perceived levels of project risks and uncer-
tainties. Higher risks are accepted if compen-
sated for by higher potential returns. Risk aver-
sion leads the agent to ask for increasingly
higher increments in the rate of return as pro-
jects move into incrementally higher risk areas
until the agent’s upper limit for accepted risk is
reached. Projects located on or below the RR
line (green project) are accepted by the agent
with RR-line 1, projects above the line (red pro-
ject) are rejected: corporate risk-tolerance limits
cannot be exceeded.
Let us assume that a project developer asks a
bank for a loan offering to pay the rate of interest
RR1. Due to the project’s risk level of R1, the
bank is not interested. Let us then assume that
use of hedging instruments shifts the project risk
for the bank from the red to the green position.
The fee RR1-RR2, which the bank pays the
seller of the risk instrument to take over a spe-
cific risk, reduces the net interest rate for the
bank from RR1 to RR2; yet, because the risk is
reduced to R2, the bank is now willing to lend to
the project.
Commercial risk instruments owe their existence
to three factors:
• Agents have different levels of risk aversion:
I2 in the chart could represent a commercial
bank, I1 a development bank: the latter would
finance the green project, the former not.
• Portfolio investors invest in assets with differ-
ent RR-profiles, some high risk/high RR,
some low risk/low RR. Adding a high risk/high
RR asset, is profit-maximising strategy as
long as the total risk-RR profile of the portfo-
lio is not pushed beyond the RR-line frontier.
• Risk specialists, such as insurance compa-
nies or hedgers, can price risks, and thereby
changing what for a project developer is a
project stopping uncertainty, into a quantified
risk.
Adding new risk management (hedging) instru-
ments to the financial market enables otherwise
unwilling local project developers and financial
Project Risk-Rate of Return Curve
Risk adjusted rate of return requirement
LevelOf Risk
RR1RR2
R1
R2
I1
I2
RR3

Annex
intermediaries to engage in the development
and financing of RE-projects or to provide funds
with longer maturities to RE-projects.76
The transfer of risks to specialists comes with a
price tag for the lending institutions and/or pro-
ject developers, which is part of the cost of capi-
tal. But since specialists are more efficient at
managing specific risks than the entity transfer-
ring it, and risk transfers take place at the mar-
gin, where a reduction in risk leads to a relatively
large reduction in the asked for rate of return,
the cost of capital in a free and efficient capital
market will go down or, as a minimum be un-
changed. Otherwise, risk management instru-
ments would not be on the market. This out-
come is shown in the chart, where the hedging
transaction brings the RR-profile of the project
below the lender’s RR-curve; meaning that the
cost of capital to the project is reduced by the
transaction. At the risk R2, the bank’s minimum
net rate of interest requirement is RR3, enabling
the project developer to get his loan at a rate of
interest of RR1 minus the difference between
RR2 and RR3.
Under free competition, hedging instruments
reduce the cost of capital. When governments
with financial and TA help from donors introduce
risk management products for RE-projects on
the market, the market price of private project
finance for RE decreases while the availability of
domestic debt and equity capital for RE-projects
increases. The objectives of the approach are (i)
to leverage donor finance (generating an in-
crease in domestic project finance, which is
larger than the donor-financed cost of develop-
ing and marketing the hedging product) and (ii)
to assist a long-term strengthening of the capital
market.
In emerging economies, one can expect a sig-
nificant impact on RE-investments from new risk
instruments. Investors in East-Asia in particular
react very quickly to new commercial opportuni-
ties and are capable of rising significant capital
in a short time. In poorer developing countries,
the leveraging effect on the availability of capital
for RE is likely to be small in the short-term and
requires a subsidization of the risk product. The
donor would finance a reserve fund to cover the
expected financial losses on the under-priced
76 In the chart the original stumbling block could have
been that the bank was willing to provide a 6-year loan but not the 12-year loan, which the project de-veloper needed
product. In these countries, it is not the short
term impact, but the longer term impact on the
capital market which provides the justification for
adopting the approach.
It is recommended, therefore, to use modalities
for providing financial assistance to RE-
investments, which strengthen the local capital
markets, even if they offer few short term advan-
tages for RE-investments compared with con-
ventional donor-assisted project finance. An
example is a project financing scheme com-
posed of:
• investment support from CDM and/or a ru-
ral electrification grant;
• a donor funded credit facility for banks in-
volved in RE-lending to provide up to 30-
70% of the debt finance for individual pro-
jects;
a donor funded partial risk finance facility for
rest-finance.

Annex
Annex 3 : References
ADB – Review of the Partial Risk Guarantee of the ADB, November 2000
Babbar, Suman – Infrastructure Financing. Growing risk aversion in emerging markets and the need for risk mitigation Workshop on Tools for Risk Mitiga-tion in Small-scale Clean Infrastructure Projects, November 19, 2003
Bachrach, Devra and others - Comparing the Risk Profiles of Renewable and Natural Gas Electricity Contracts: A Summary of the California Department of Water Resources Contracts, April 2003,
BASE International Investment Forum, Bonn, 2004.
Beck, Fred and Martinot, Eric - Renewable Energy Policies and Barriers , in Encyclopedia of Energy, Cutler J. Cleveland, ed. (Academic Press/Elsevier Science, 2004)
Biley, Amichia - How to structure commercial financ-ing of renewable energies – the case of the first project financed wind park in China, International Renewable Energy Conference, Bonn, June 1, 2004
Böning, Jens - Weather Derivatives as Risk Man-agement Instruments for Renewable Energy Pro-ject, SEFI Bonn 2004
Cobb, Dr. J. Michael - Global Infrastructure Financ-ing. Sources & Structures, IDC International Devel-opment Consultants, LLC.
Conningarth Economists - “Economic and Financial Calculations and Modelling for the Renewable En-ergy Strategy Formulation - technologies for fulfilling the 10 000 (4 000) GWh target a least cost for the South African society”. February 4, 2004
DEG - Investing in Renewable Energy - The Experi-ences and Possibilities of Financing of DEG in Emerging Markets and Developing Countries, Co-logne 2002
Del Rosario, Tony - Alleviating Poverty by Sustain-ing Energy Development Accessibility Issues and Innovative Financing, World Energy Council, G8 Energy Ministers Meeting, Detroit, USA, May 1-3, 2002
DTI – Financing Renewable Energy Projects – A Guide for Developers, February 2000
Finance and Investment: a challenge of scale, in: Renewable Energy World, September–October 2004.
G8 Renewable Energy Task Force, Final Report, 2001.
Gardiner, Nick - Bank Financing for the Renewables Sector, SEFI Bonn 2004.
IBRD - Catalyzing private finance: The relevance of
World Bank Guarantees at time of risk aversion.
IBRD - Local currency financial products: An intro-duction.
Inter-American Development Bank /Private Sector Department/Capital Markets Unit - Capital Markets Development : Financial Guarantee Program; Credit Risk Mitigation, local currency instruments; IDB Capital Market for Development, June 03, 2003.
Johns, Jonathan – Renewable as investments, The Quarterly Newsletter for the UK New and Renew-able Energy Industry, Issue 38, November 1998
Langniß, Ole (ed.), and others (1999) - Financing renewable energy systems, Stuttgart 1999.
Martinot, Eric - Renewable energy investment by the World Bank, Published in Energy Policy 29(9): 689-699 (2001).
Matsukawa, Tomoko et. al. - Foreign Exchange Risk Mitigation for Power and Water Projects in Develop-ing Countries, December 2003
Maurer, Crescencia - The Transition from Fossil to Renewable Energy Systems: What Role for Export Credit Agencies?, Berlin 2003
Maurer, Crescienca with Ruchi Bhandari – The Climate for Export Credit Agencies, May 2000
McCallin, Jessica and Fraser McLachlan - Wind power, risk and finance. Can the wind industry get a better deal from insurers? Renewable energy world, Nov. 2002
Mistry, Percy & Olesen, Niels – Mitigating Risks in Foreign Investments in least developed countries, Stockholm 2003
Murley, Thomas S. - Renewable Energy Infrastruc-ture Finance and Private Equity
Musallam, Walid (Infrastructure Finance Group LLC) - International Private Hydro Power Development and Risk Management, Washington 2000
Olivier, E. - Survey of Contingent Financing & Risk Mitigation Instruments for Clean Infrastructure Pro-jects, November 2003
Seifried, Rolf - Financing Energy Services for Rural and Urban Poor within German Financial German Financial Co-operation, Brussels, July 23, 2002.
UNEP - Financial Risk Management Instruments for Renewable Energy Projects, Summary Document, 2004.
Usher, Bruce – ERPA Monetization, UNEP/SEFI 2004
Wiser, Ryan and Pickle, Steve - Financing Invest-ments in Renewable Energy: The Role of Policy Design and Restructuring, Berkeley 1997.
Workshop on Tools for Risk Mitigation in Clean Infrastructure, Paris, November 19-20, 2003