Financing Issues and Economic Effects of American … · Financing Issues and Economic Effects of...
21
Order Code RL31176 Financing Issues and Economic Effects of American Wars Updated July 29, 2008 Marc Labonte Specialist in Macroeconomics Government and Finance Division Mindy Levit Analyst in Public Finance Government and Finance Division
-
Upload
truongtruc -
Category
Documents
-
view
215 -
download
0
Transcript of Financing Issues and Economic Effects of American … · Financing Issues and Economic Effects of...

Order Code RL31176
Financing Issues and Economic Effectsof American Wars
Updated July 29, 2008
Marc LabonteSpecialist in Macroeconomics
Government and Finance Division
Mindy LevitAnalyst in Public Finance
Government and Finance Division

Financing Issues and Economic Effects of American Wars
Summary
The increased government outlays associated with wars can be financed in fourways: through higher taxes, reductions in other government spending, governmentborrowing from the public, or money creation. The first two methods are unlikelyto have an effect on economic growth (aggregate demand) in the short run: theexpansion in aggregate demand caused by greater military outlays is offset by thecontraction in aggregate demand caused by higher taxes or lower non-militarygovernment spending. The latter two methods increase aggregate demand. Thus, aby-product of American wars has typically been a wartime economic boom in excessof the economy’s sustainable rate of growth. Wars may shift resources from non-military spending to military spending, but because military spending is included inGDP, it is unlikely to lead to a recession. Just as wars typically boost aggregatedemand, the reduction in defense expenditures after a war removes some economicstimulus as the economy adjusts to the return to peacetime activities.
The economic effect of World War II stands in a class of its own. More thanone-third of GDP was dedicated to military outlays. Budget deficits were almost aslarge; these large deficits were made possible through policies that forced individualsto maintain a very high personal saving rate. Money creation was a significant formof financing, but the inflation that would typically accompany it was suppressedthrough widespread rationing and price controls. Private credit was directed towardcompanies producing war materials. There was a significant decrease in non-militaryoutlays and a significant increase in taxes, including the extension of the income taxsystem into a mass tax system and an excess profits tax. President Truman attemptedto avoid financing the Korean Conflict through borrowing from the public or moneycreation — budget deficits were much lower than during any other period considered — but the economy boomed anyway. Tax increases and a reduction in non-militaryspending largely offset the increases in military outlays. President Truman relied onprice controls to prevent the money creation that did occur from being inflationary.
Vietnam, the Reagan military buildup, and the two wars in Iraq were not largeenough to dominate economic events of their time. The beginning of the VietnamConflict coincided with a large tax cut. Non-military government spending rosethroughout the Vietnam era. Most of the conflict was deficit financed, although taxincreases occurred at the peak of the conflict. Inflation rose throughout the period,and President Nixon turned to price controls to suppress it. The beginning of theReagan military buildup also coincided with a large tax cut, as well as an effort bythe Federal Reserve to disinflate the U.S. economy. Thus, borrowing from thepublic, and later a reduction in non-military outlays, offset most of the rise in militaryspending. Unlike earlier conflicts, liberalized international capital markets allowedthe United States to borrow significantly abroad for the first time, which manyeconomists believe caused the large trade deficits of the mid-1980s. Desert Stormtook place among rising budget deficits and rising taxes. It was the only militaryoperation considered to largely occur in a recession. The ongoing wars in Iraq andAfghanistan took place at a time of sluggish economic recovery, tax cuts, and risingbudget deficits. This report will be updated as needed.

Contents
The Economics of War Financing . . . . . . . . . . . . . . . . . . . . . . . . . . . . . . . . . . . . . 1Borrowing from the Public . . . . . . . . . . . . . . . . . . . . . . . . . . . . . . . . . . . . . . 2Money Creation . . . . . . . . . . . . . . . . . . . . . . . . . . . . . . . . . . . . . . . . . . . . . . . 2Use of Price Controls . . . . . . . . . . . . . . . . . . . . . . . . . . . . . . . . . . . . . . . . . . . 3Equity Issues . . . . . . . . . . . . . . . . . . . . . . . . . . . . . . . . . . . . . . . . . . . . . . . . . 4Interpreting Results . . . . . . . . . . . . . . . . . . . . . . . . . . . . . . . . . . . . . . . . . . . . 4
World War II . . . . . . . . . . . . . . . . . . . . . . . . . . . . . . . . . . . . . . . . . . . . . . . . . . . . . 6
Korean Conflict . . . . . . . . . . . . . . . . . . . . . . . . . . . . . . . . . . . . . . . . . . . . . . . . . . . 8
Vietnam Conflict . . . . . . . . . . . . . . . . . . . . . . . . . . . . . . . . . . . . . . . . . . . . . . . . . . 9
Reagan Military Buildup . . . . . . . . . . . . . . . . . . . . . . . . . . . . . . . . . . . . . . . . . . . 11
Desert Storm Operation . . . . . . . . . . . . . . . . . . . . . . . . . . . . . . . . . . . . . . . . . . . . 13
Ongoing War in Iraq and Afghanistan . . . . . . . . . . . . . . . . . . . . . . . . . . . . . . . . . 15
Conclusion . . . . . . . . . . . . . . . . . . . . . . . . . . . . . . . . . . . . . . . . . . . . . . . . . . . . . . 17
List of Figures
Figure 1. Comparing the Size of Conflicts(Military Outlays at Their Peak as a % of GDP) . . . . . . . . . . . . . . . . . . . . . . 5
List of Tables
Table 1. Economic Indicators in the World War II Era . . . . . . . . . . . . . . . . . . . . 7Table 2. Economic Indicators in the Korean Conflict Era . . . . . . . . . . . . . . . . . . 9Table 3. Economic Indicators in the Vietnam Era . . . . . . . . . . . . . . . . . . . . . . . 11Table 4. Economic Indicators in the Reagan Era . . . . . . . . . . . . . . . . . . . . . . . . 13Table 5. Economic Indicators in the Desert Storm Era . . . . . . . . . . . . . . . . . . . . 15Table 6. Economic Indicators in the 2003 Iraq War . . . . . . . . . . . . . . . . . . . . . . 16

Financing Issues and Economic Effects of American Wars
With military conflict in Iraq and Afghanistan, Congress has expressed aninterest in how wars have been financed historically, and what effects the wars hadon the economy. This report examines financing and economic issues in World WarII, the Korean Conflict, the Vietnam Conflict, the Reagan Military Buildup, and the1991 and 2003 wars in Iraq. It examines tax policy, non-military outlays, the budgetbalance, economic growth, inflation, and interest rates during these periods.
The Economics of War Financing
People often assume that wars will lead to recessions, reasoning that thespending on war will lead to less spending in the rest of the economy. While thisreasoning is correct, the conclusion is wrong. Recessions are characterized by areduction in spending in the entire economy, including the military sector. Althoughit is true, in times of war, resources must be shifted to the military sector, because themilitary sector is a part of gross domestic product (GDP), the shift does not lowerGDP. Wars may lead to less spending on non-military goods and services, but thereis no reason to assume that they will lead to less spending on total goods andservices. In fact, under certain financing methods, it is likely to lead to greaterspending on total goods and services, which would increase the growth rate ofaggregate demand in the short run.
The increased government outlays associated with wars can be financed in fourways: through higher taxes, reductions in other government spending, governmentborrowing from the public (the issuance and sale of U.S. Treasury securities to thepublic), or money creation. Major wars have relied upon all four measures.
The first two methods are unlikely to have an effect on economic growth(aggregate demand) in the short run. The expansion in aggregate demand caused bygreater military outlays is largely offset by the contraction in aggregate demandcaused by higher taxes or lower non-military government spending.
The latter two financing methods increase aggregate demand. Thus, a by-product of wars has typically been a short-term economic boom and an increase inemployment in excess of the economy’s sustainable rate of growth. The sectors ofthe economy that are recipients of the military spending, such as the transportationsector and military equipment producers, would receive the biggest boost. Just as amilitary buildup in wartime typically boosts aggregate demand, the reduction indefense expenditures after a war typically causes a brief economic contraction as theeconomy adjusts to the return to peacetime activities.

CRS-2
1 For a more detailed discussion, see CRS Report RL31235, The Economics of the FederalBudget Deficit, by Brian W. Cashell.2 Money creation also has the side effect of transferring wealth among private individualsfrom those who suffer from higher inflation to those who benefit from higher inflation. Inmany cases, it is particularly savers who suffer and debtors who benefit from high inflation
(continued...)
Borrowing from the Public
If the economy’s resources are fully employed when the government boostsaggregate demand, the increase in government spending must be offset by a reductionin spending elsewhere in the economy. In the case of borrowing from the public,prices and interest rates would be expected to rise, the latter causing investment andother interest-sensitive spending to be lower than it otherwise would be. Economistsrefer to this phenomenon as government purchases “crowding out” privateinvestment and interest-sensitive spending. Because private investment is crucial tolong-run growth, the long-run effect of these policies would be to reduce the privatecapital stock and future size of the economy.1
Once government controls on the international flow of private capital werelargely removed by the early 1970s, it became possible for government budgetdeficits to be financed by foreigners as well as domestic citizens. If a budget deficitis financed by foreigners, exports and import-competing goods rather than privateinvestment would be “crowded out” by government expenditures through anappreciation of the dollar and a larger trade deficit. The appreciation occurs becausedemand for the dollar increases as foreigners purchase U.S. financial instruments.
In the case of expenditures on a military campaign abroad, there may be less ofan expansion in aggregate demand than from other forms of government spendingsince some of the expenditures would be used for foreign goods and services. Thissuggests that there would be less upward pressure on the exchange rate and lesscrowding out of U.S. exports and import-competing goods.
Money Creation
How does money creation help the government raise revenues? When thegovernment (through the Federal Reserve) prints money, it can use that money topurchase real resources. But at full employment, the government cannot increase theamount of real resources in the economy simply by printing money. In this case, ifthe increase in the money supply increases the resources available to the government,it must be offset by a decrease in the resources available to other individuals in theeconomy. This occurs through inflation, which makes money less valuable in termsof the amount of real resources for which it can be exchanged. The individualswhose wealth is reduced are those who held a portion of their wealth in the existingmoney at the time when the government increased the money supply. That is becausethe existing money they hold can now be exchanged for fewer real resources thanbefore the new money was printed. For this reason, using money creation as a formof government finance has often been characterized by economists as an “inflationtax.”2

CRS-3
2 (...continued)because inflation reduces the relative value of both savings and debt. Further, someeconomists argue that inflation is a regressive tax, which inflicts a greater burden on poorerhouseholds due to their higher use of cash and cash equivalents.3 Part of individuals’ private wealth is held in the form of U.S. Treasuries, government debt.If individuals do not fully anticipate future inflation and cannot protect their holdings ofTreasuries from inflation, then manipulating the money supply can also reduce thegovernment’s burden of servicing its debt. (For example, holding long-term bonds exposesan individual to future inflation risk.) One result of the high inflation after World War IIwas a large reduction in the real value of government debt outstanding.4 At present, the Federal Reserve’s use of monetary policy has the same results as theprocess described in this report — increases in the money supply increase the amount of realresources that the government can purchase. The difference between the Federal Reserve’scurrent policy and the process described in this report is that current policy is not designedto maximize the purchasing power of the government. Instead, its current policy aims tomaintain price stability and full employment. Maximizing the purchasing power of thegovernment would require far too much money creation to maintain these goals. Butreaching these goals may incidentally lead to increases in the money supply that add to thegovernment’s purchasing power because small increases in the money supply are consistentwith a growing economy which has a small, but positive, rate of inflation.
Unlike borrowing from the public, money creation would not be expected todisproportionately crowd out private investment because expansionary monetarypolicy is likely to have the effect of reducing interest rates in the short run. Instead,the transfer of resources is likely to come about through higher inflation, affectingindividuals who are unable to protect their wealth and income from inflation.3
Although some price inflation may be associated with borrowing from the public,money creation is typically a more inflationary method of finance.
In World War II, the means by which the increase in the money supply cameabout was through the Federal Reserve’s purchase of government bonds. In effect,the Federal Reserve made a loan to the government of newly printed money. Theincrease in the money supply transferred resources to the government by reducing thepublic’s real wealth.
World War II was the only conflict examined in this report in which thegovernment relied on money creation as a significant source of revenue. In the1950s, the Treasury- and Federal Reserve reached an “accord,” and the governmentcould no longer “borrow” directly from the Federal Reserve.4 In other conflicts inwhich inflation rose in the United States, such as the Vietnam Conflict, it would beunfair to characterize the excessive money creation that occurred as being motivatedprimarily by a desire to increase government revenue. It is fairer to say that excessivemoney creation was influenced by a desire or belief by the government that theeconomy could or should grow faster than was actually possible.
Use of Price Controls
Under normal circumstances, money creation as a means of government financewould be expected to lead to price inflation. In major wars, the government hasattempted to suppress inflation through the use of widespread price controls rather

CRS-4
5 For more information, see CRS Report RL30520, The National Debt: Who Bears ItsBurden?, by Marc Labonte and Gail E. Makinen.
than forgo the benefits of inflationary monetary policy. Economic theory suggests,and historical evidence supports, that the use of price controls may be successful atsuppressing inflation for a time, but prices will eventually rise when those controlsare removed, or even sooner if the administration of controls break down. Thesuppression of inflation increases the government’s purchasing power for a givenchange in the money supply, making monetary finance more powerful. Strict pricecontrols create significant market distortions and may result in shortages for somegoods because they do not allow relative prices to adjust as supply and demand forindividual goods change. When price controls are in effect, black market activitytypically expands as citizens attempt to avoid the distortions that the controls create.
Equity Issues
All four methods of war financing raise equity questions because each methodplaces the financing burden on different groups of individuals. The burden offinancing wars through higher taxes is borne by the individuals that have their taxesraised. The burden of financing wars through a reduction in other governmentspending is borne by the individuals to whom the spending was previously directed.This is the essence of the famous “guns vs. butter” analogy: when military spendingis financed through higher taxes or lower government spending, society consumesmore “guns” (military spending) and less “butter” (non-military spending). Theburden of financing wars through money creation is borne by those whose real wealthand real income fall when prices rise. Uniquely, the burden of financing warsthrough borrowing from the public is thought to be borne in part by futuregenerations rather than present generations. The result of borrowing from the publicis lower private investment, and lower private investment leads to a smaller futureeconomy, and hence lower standards of living in the future. In this case, today’s“guns” are financed through less “butter” in the future. Philosophically, the debtfinancing of wars has often been justified on the grounds that the peace or securitythat wars make possible is enjoyed by present and future generations. Thus, the costshould be borne by present and future generations.5
Interpreting Results
Unlike science experiments, economic experiments are not controlled andcannot be repeated. It is difficult to separate out the effects of a war from thecountless other economic events happening simultaneously to get accurate estimatesof how any given war affected the economy. The presentation of data in the tablesbelow is not meant to imply causation. This is especially true in the case of interestrates. The economic theory that interest rates are higher than they otherwise wouldbe when the budget is in deficit is not equivalent to the empirical observation thatinterest rates are high or low in any given year. For example, interest rates can risein any given year because private investment demand rises, monetary policy istightened, private individuals change their savings patterns, foreigners find U.S.assets less attractive, the perceived riskiness of investment increases, or because thefederal budget deficit increases. Furthermore, real (or inflation-adjusted) interest

CRS-5
Figure 1. Comparing the Size of Conflicts(Military Outlays at Their Peak as a % of GDP)
rates are measured in this report based on actual inflation rates. But they aredetermined in part by expected inflation rates. If actual inflation turns out to be muchhigher than expected inflation, then real interest rates will be temporarily low. Thus,it is not unusual to see ex-post negative real interest rates in years of unexpectedlyhigh inflation, of which there are several examples in the periods discussed below.
In drawing lessons from past conflicts, it should also be stressed that larger warsrequire wider ranging government involvement and produce larger economic effects,as illustrated in Figure 1. The Vietnam Conflict, the Reagan Military Buildup, andthe Desert Storm Operation were not large enough events that they could be thoughtto dominate cause and effect in the economy at the time. And to equal the militaryoutlays (as a percentage of GDP) undertaken at the peak of the Reagan militarybuildup, military outlays today would need to more than double from their level in2001.
Source: Office of Management and Budget, Budget of the United States GovernmentFY2009 Historical Tables.

CRS-6
6 These distortions make economic statistics from the period highly questionable.According to the Bureau of Economic Analysis, the “residuals” of data that cannot beaccounted for reach one-sixth the size of GDP at one point in World War II.7 See CRS Report RS21046, War Bonds in the Second World War: A Model for a New WarBond?, by James Bickley.
World War II
World War II was unique among events considered in this report in that it wasaccompanied by fundamental (albeit temporary) changes in the structure of ourmarket economy. Because of these measures, any economic comparison betweenWorld War II and other economic events in the post-war period is questionable, andthe predicted economic outcomes could be significantly different. In World War II,the prices of consumer goods were fixed and controlled on a widespread basis from1942 to 1945, consumer goods were rationed through the use of purchase couponsand goods and services available to individuals were purposely kept below salariesto force a higher private saving rate. Also, private factories were instructed andencouraged to change their output to war production, resources and credit weredirected by the government toward companies producing war materials, the femaleparticipation rate in the labor force was temporarily raised, and nearly half of GDPwas used by the federal government.6
Because of the size of World War II associated expenditures, the governmentrelied on all four methods of financing. Despite the record size of government as apercentage of GDP, non-military government expenditures had fallen to less than halftheir pre-war level by the end of the war. As can be seen in Table 1 below, whichillustrates economic conditions before, during, and after the war, budget deficitsexceeded 30% of GDP at their peak. The publicly held debt reached 108.6% of GDPin 1946. This would have been impossible without government controls over privatespending and investment decisions and the patriotism generated by a major war.Central to this policy was the decision by the Treasury and Federal Reserve to keepthe yield on U.S. Treasuries artificially low to ease the debt financing burden. (Withthe desire to keep inflation low, this policy decision necessitated the use of pricecontrols since it required rapid money creation.) About one-quarter of the debtfinancing of World War II occurred through the war bond program, which sold small-denomination, non-marketable bonds to private citizens.7 The war effort was largeenough to keep the economy operating far above its sustainable rate for the entiretyof the war. Furthermore, there was a high rate of unemployment before the warbegan, at 14.6% in 1940. Thus, the economy probably had idle resources to enlisttoward the war effort, allowing growth to exceed its sustainable rate while thoseresources became employed. Since economic growth was so great during the war,the standard contraction following the war was also large, as the economy adjustedto a decline in government spending from about 40% of GDP to about 15% of GDP.The contraction ended in 1948, and left no lasting impact on growth in the 1950s.
To finance the increase in government outlays from 9.8% of GDP in 1940 to43.6% of GDP in 1943 through higher taxes exclusively would have involvedimpossibly large tax increases, with corresponding disincentive effects on work andsaving. Nevertheless, the government did finance a portion of the war effort by

CRS-7
8 Sidney Ratner, Taxation and Democracy in America (New York: Octagon Books, 1980),pp. 515-518; Joe Thorndike, “Wartime Tax Legislation and the Politics of Policymaking,”Tax Notes, Oct. 25, 2001.
raising taxes. Tax measures during the War included the Revenue Act of 1942, theCurrent Tax Payment Act of 1943, the Revenue Act of 1943, and the IndividualIncome Tax Act of 1944. The Revenue Act of 1942 included provisions that madethe individual income tax a “mass tax” for the first time, increased the corporate tax,increased excise taxes, increased the excess profits tax to 90%, and created a 5%Victory tax that was to be repaid through a post-war tax credit. The Current TaxPayment Act of 1943 introduced tax withholding that eased the Treasury’s ability tofinance day-to-day expenditures. The Revenue Act of 1943 was meant to alter thedistribution of taxation. It was the first tax bill to be vetoed, and Congress overrodethe veto. The Individual Income Tax Act of 1944 was meant to simplify the incometax system and it also abolished the Victory Tax. The act lowered tax revenues byan estimated 0.2% of GDP.8 Tax rates were greatly reduced after the war ended.
Table 1. Economic Indicators in the World War II Era
Year
MilitaryOutlays(% ofGDP)
TaxRevenue
(% ofGDP)
BudgetDeficit
(-) (% ofGDP)
Non-MilitaryOutlays(% ofGDP)
RealGDP
Growth
InflationRate
(PriceDeflator)
RealCorporate
BondYields
1940 1.7% 6.8% -3.0% 7.2% 8.5% 0.8% 4.1%
1941 5.6% 7.6% -4.3% 5.6% 13.8% 3.6% -0.7%
1942 17.8% 10.1% -14.2% 5.9% 17.8% 7.4% -6.6%
1943 37.0% 13.3% -30.3% 5.8% 16.8% 6.9% -2.2%
1944 37.9% 20.9% -22.8% 4.7% 11.8% 3.8% 1.9%
1945 37.5% 20.4% -21.5% 3.0% 3.3% 2.5% 1.0%
1946 19.2% 17.6% -7.2% 3.8% -6.2% 7.3% -5.2%
1947 5.5% 16.4% 1.7% 7.4% -4.5% 10.4% -11.2%
Source: Office of Management and Budget, Historical Tables; Bureau of Labor Statistics, ConsumerPrice Index; Federal Reserve.
Note: Non-Military Outlays do not include interest payments on the federal debt; real corporate bondyields are for Moody’s BAA series as recorded by the Federal Reserve less the consumer price index(CPI); all data are calculated on a fiscal year basis except for corporate bond yields and economic datain 1940, both of which are calculated on a calendar year basis.

CRS-8
9 Craufurd Goodwin, Exhortation and Controls (Washington, DC: Brookings Institution,1975), pp. 69-93; Milton Friedman and Anna Schwartz, A Monetary History of the UnitedStates (Princeton: Princeton University Press, 1963), pp. 610-636.10 Robert Willan, Income Taxes: Concise History and Primer, Clairtor’s PublishingDivision, (Baton Rouge: 1994); John Witte, The Politics and Development of the FederalIncome Tax, University of Wisconsin Press, (Madison: 1985).
Korean Conflict
In contrast to World War II, President Truman relied largely on taxation and areduction of non-military outlays, rather than borrowing from the public or moneycreation, to finance the Korean Conflict. Of course, this turned out to be feasibleonly because the Korean Conflict was so much smaller than World War II.Nevertheless, it is striking how much lower budget deficits and inflation were duringthis era than during the Vietnam Conflict and President Reagan’s military buildup,both of which involved much smaller military expenditures as a percentage of GDP.
Inflation remained low even though economic growth was kept above itssustainable rate throughout the war. When high inflation emerged in 1951, thegovernment again resorted to widespread wage and price controls. It did notreimplement a rationing system for private consumption of goods and services,however. A change in Federal Reserve policy in 1951 assured that inflation wouldbe kept under control. After World War II, the Treasury had adopted the positionthat Federal Reserve monetary policy should be directed toward keeping the yield onTreasury securities stable and artificially low to keep debt financing costsmanageable while limiting the reserves available to banks. In 1951, it became clearthat maintaining this policy would be inflationary, and because inflation remained theTruman administration’s primary concern, the Treasury and Federal Reserve reachedan “accord” to allow the Fed to focus on maintaining price stability and graduallyallowing the yields on Treasury securities to become market determined. True topattern, the economy experienced a short recession after the Korean Conflict ended.9
Shortly after the outbreak of the Korean Conflict, the Revenue Act of 1950 wasenacted. It resurrected the income tax rates of World War II and raised taxes by anestimated 1.3% of GDP. Later in the year, the Excess Profits Tax of 1950 wasenacted. The Revenue Act of 1951 raised individual income and corporate taxes, foran estimated revenue increase of 1.9% of GDP. The increase in individual andcorporate taxes would have raised more revenue, but the 1951 act also containedseveral narrow-based tax reductions.10
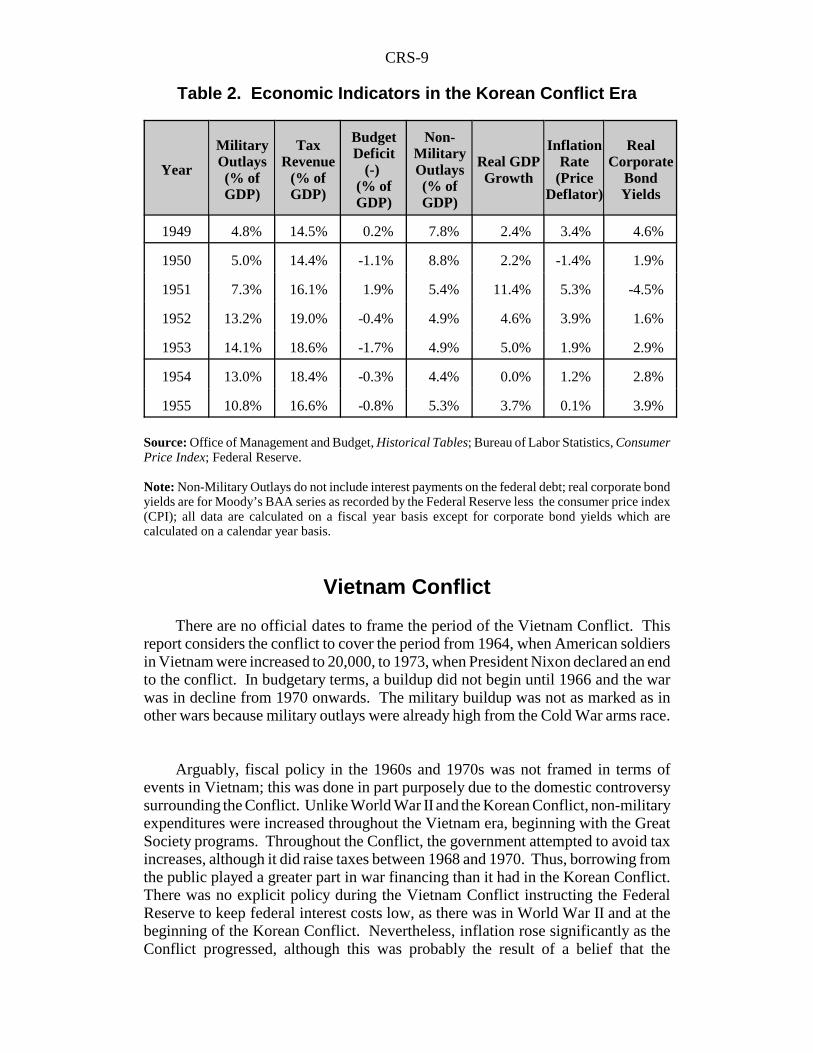
CRS-9
Table 2. Economic Indicators in the Korean Conflict Era
Year
MilitaryOutlays(% ofGDP)
TaxRevenue
(% ofGDP)
BudgetDeficit
(-) (% ofGDP)
Non-MilitaryOutlays(% ofGDP)
Real GDPGrowth
InflationRate
(PriceDeflator)
RealCorporate
BondYields
1949 4.8% 14.5% 0.2% 7.8% 2.4% 3.4% 4.6%
1950 5.0% 14.4% -1.1% 8.8% 2.2% -1.4% 1.9%
1951 7.3% 16.1% 1.9% 5.4% 11.4% 5.3% -4.5%
1952 13.2% 19.0% -0.4% 4.9% 4.6% 3.9% 1.6%
1953 14.1% 18.6% -1.7% 4.9% 5.0% 1.9% 2.9%
1954 13.0% 18.4% -0.3% 4.4% 0.0% 1.2% 2.8%
1955 10.8% 16.6% -0.8% 5.3% 3.7% 0.1% 3.9%
Source: Office of Management and Budget, Historical Tables; Bureau of Labor Statistics, ConsumerPrice Index; Federal Reserve.
Note: Non-Military Outlays do not include interest payments on the federal debt; real corporate bondyields are for Moody’s BAA series as recorded by the Federal Reserve less the consumer price index(CPI); all data are calculated on a fiscal year basis except for corporate bond yields which arecalculated on a calendar year basis.
Vietnam Conflict
There are no official dates to frame the period of the Vietnam Conflict. Thisreport considers the conflict to cover the period from 1964, when American soldiersin Vietnam were increased to 20,000, to 1973, when President Nixon declared an endto the conflict. In budgetary terms, a buildup did not begin until 1966 and the warwas in decline from 1970 onwards. The military buildup was not as marked as inother wars because military outlays were already high from the Cold War arms race.
Arguably, fiscal policy in the 1960s and 1970s was not framed in terms ofevents in Vietnam; this was done in part purposely due to the domestic controversysurrounding the Conflict. Unlike World War II and the Korean Conflict, non-militaryexpenditures were increased throughout the Vietnam era, beginning with the GreatSociety programs. Throughout the Conflict, the government attempted to avoid taxincreases, although it did raise taxes between 1968 and 1970. Thus, borrowing fromthe public played a greater part in war financing than it had in the Korean Conflict.There was no explicit policy during the Vietnam Conflict instructing the FederalReserve to keep federal interest costs low, as there was in World War II and at thebeginning of the Korean Conflict. Nevertheless, inflation rose significantly as theConflict progressed, although this was probably the result of a belief that the

CRS-10
11 Robert Willan, Income Taxes: Concise History and Primer, Clairtor’s PublishingDivision, (Baton Rouge: 1994); John Witte, The Politics and Development of the FederalIncome Tax, University of Wisconsin Press, (Madison: 1985).
economy could grow at a faster rate than was actually possible, rather than a desireto use money creation as a significant source of revenue.
The first tax act of the Vietnam era was a tax reduction, the Revenue Act of1964, which was implemented to counter a perceived economic slowdown. This actembodied many of the proposals made by President Kennedy in 1961 to “getAmerica moving again.” Its major provisions included a reduction in individualincome and corporate tax rates, and an expansion of the standard deduction.Nevertheless, the Vietnam Conflict put strains on the budget that ultimatelyinfluenced budgetary decisions. In 1968 and 1969, temporary 10% surcharges wereapplied to individual income and corporate taxes, ostensibly to curb inflation. Themeasure led to the last budget surplus (in 1969) until 1998. Later that year, the TaxReform Act of 1969 was passed. It was advertised as a measure to reform the taxcode and close certain loopholes, but also had the effect of raising revenue by 0.2%of GDP in 1970. Its major provisions were the repeal of the investment tax credit(revenue raising), the restriction of the tax exempt status of foundations (revenueraising), a broadening of the individual income tax base (revenue raising), and anincrease in the income tax’s standard deduction and personal exemption (revenuereducing). In addition, it extended the temporary surcharges for the first six monthsof 1970 at a rate of 5% (reduced from the previous 10%), raising an additional 0.4%of GDP. The 1971 Revenue Act reduced taxes with the aim of increasing aggregatedemand. It restored the investment tax credit, accelerated planned tax reductions, andincreased the standard deduction. The tax reductions contributed to larger budgetdeficits in the following years.11
The combination of rising budget deficits and expansionary monetary policy ledto rapidly rising inflation in the late 1960s and early 1970s. Rather than furthertighten monetary policy or fiscal policy to weaken aggregate demand, PresidentNixon responded with the imposition of price controls in four phases from 1971 to1974. Under the Nixon program, prices, wages, and profits were controlled for alllarge firms. The prices of some commodities, imports and exports, unprocessedagricultural products, and the wages of low-wage workers were exempted. Later, inphase III, rents were exempted as well. Small firms did not have to comply withprice, profit, or wage controls for some phases. During the four phases, controlswere meant to be gradually reduced. In phase I, prices and wages were “frozen;” inphase II, they were “self-administered” which meant that price increases wereallowed if approved by the government; in phase III, “decontrol” began. (Thesubsequent failure of inflation to slow in phase III led to tighter controls for someindustries in phase IV, while other industries were decontrolled.) The controlsproved to be very unpopular with the public, as shortages and distortions appearedin different markets.
From 1973, the oil shock and ensuing “stagflation” dominated economic events.The combination of higher oil prices and the end of price controls, which releasedpent up inflationary pressures, led to a high inflation rate throughout the 1970s. By

CRS-11
this point, military expenditures as a percentage of GDP had been significantlyreduced.
Table 3. Economic Indicators in the Vietnam Era
Year
MilitaryOutlays(% ofGDP)
TaxRevenue
(% ofGDP)
BudgetDeficit
(-) (% ofGDP)
Non-MilitaryOutlays(% ofGDP)
Real GDPGrowth
InflationRate
(PriceDeflator)
RealCorporate
Bond Yields
1963 8.9% 17.8% -0.8% 8.4% 4.1% 1.3% 3.6%
1964 8.5% 17.6% -0.9% 8.7% 5.7% 1.2% 3.5%
1965 7.4% 17.0% -0.2% 8.6% 5.4% 1.8% 3.3%
1966 7.7% 17.3% -0.5% 8.9% 7.3% 2.2% 2.8%
1967 8.8% 18.3% -1.1% 9.3% 4.5% 3.2% 3.1%
1968 9.4% 17.6% -2.9% 9.8% 3.0% 3.6% 2.7%
1969 8.7% 19.7% 0.3% 9.3% 4.6% 4.5% 2.3%
1970 8.1% 19.0% -0.3% 9.8% 1.2% 5.5% 4.4%
1971 7.3% 17.3% -2.1% 10.7% 1.6% 5.0% 4.2%
1972 6.7% 17.5% -2.0% 11.5% 4.4% 4.7% 5.0%
1973 5.9% 17.6% -1.1% 11.6% 6.0% 4.4% 2.0%
1974 5.5% 18.3% -0.4% 11.7% 2.9% 7.1% -1.5%
1975 5.5% 17.9% -3.4% 14.3% -2.0% 7.5% 1.5%
Source: Office of Management and Budget, Historical Tables; Bureau of Labor Statistics, ConsumerPrice Index; Federal Reserve.
Note: Non-Military Outlays do not include interest payments on the federal debt; real corporate bondyields are for Moody’s BAA series as recorded by the Federal Reserve less the consumer price index(CPI); all data are calculated on a fiscal year basis except for corporate bond yields which arecalculated on a calendar year basis.
Reagan Military Buildup
Military outlays during the Reagan military buildup were significantly lower asa percentage of GDP than they were during any of the preceding military conflicts.Neither tax increases nor money creation were used to finance the buildup. On thecontrary, both taxes and inflation were lowered during this time for reasons unrelatedto the military buildup. Tax cuts and their claimed supply-side effects on economicgrowth were one of the major themes of the Reagan era, and the main goal of theFederal Reserve under Chairman Paul Volcker was to reduce inflation from thedouble-digit rates prevalent in the late 1970s. (The Fed accomplished this goal by
CRS-12
12 For more information, see CRS Report 97-985E, Why the Budget Deficit and TradeDeficit Haven’t Been Moving Together, by Gail Makinen,.
1983, but the side effect of the Fed disinflation was the deepest recession since theGreat Depression.) As a result, increased military outlays and tax cuts led to budgetdeficits and a reduction in non-military outlays as a percentage of GDP.
The Economic Recovery Tax Act of 1981 was the major tax reduction bill of theReagan years. The major provisions were reductions in marginal income tax rates,individual saving incentives, and more favorable capital depreciation rates. In theyears following the act, the budget deficit increased from to 2.6% of GDP in 1981 to4.0% of GDP in 1982 to 6.0% of GDP in 1983. These budget deficits were thelargest budget deficits as a percentage of GDP since World War II. As theorysuggests, the combination of loose fiscal policy and tight monetary policy in the1980s led to the highest ex-post real interest rates of any period covered in this report.Since the United States operated a floating exchange rate in the 1980s, as it does atpresent, economists believe that one result of the large budget deficits were the largetrade deficits of the mid-1980s, which were the result of foreign capital beingattracted to the United States by the high interest rates that budget deficits hadcaused.12
Efforts were undertaken from 1982 onwards to reduce the budget deficit. In1982, parts of the Economic Recovery Tax Act of 1981 that had not yet been phasedin were repealed. In 1983, Social Security taxes were increased and benefits reduced.In 1984, Congress passed the Deficit Reduction Act. In 1985, Congress enacted theGramm-Rudman-Hollings Act, which attempted (unsuccessfully) to balance thebudget in five years through automatic reductions in expenditures. In 1986, the TaxReform Act was passed; it was intended to be revenue neutral. It sought to broadenthe tax base by eliminating deductions and exemptions and lowered marginal taxrates. It also eliminated the special capital gains tax rate and the investment taxcredit, altered depreciation rules, expanded the Alternative Minimum Tax (AMT) onindividuals and introduced an AMT on corporations. As a percentage of GDP, non-military outlays were not cut until 1984. Although President Reagan favored lowergovernment spending in general, the size of the budget deficits was thought to be acentral reason for Congress to enact these reductions in outlays. The deficit was noteliminated until 1998, however. The deficits caused interest payments on thenational debt to rise from 1.9% of GDP in 1980 to 3.1% of GDP in 1985. Militaryoutlays were not reduced until the end of the Reagan presidency, and the reductionswere later accelerated by the fall of the Soviet Bloc.

CRS-13
Table 4. Economic Indicators in the Reagan Era
Year
MilitaryOutlays(% ofGDP)
TaxRevenue
(% ofGDP)
BudgetDeficit
(-) (% ofGDP)
Non-MilitaryOutlays(% ofGDP)
Real GDPGrowth
InflationRate
(PriceDeflator)
RealCorporate
BondYields
1980 4.9% 18.9% -2.7% 14.8% 0.0% 8.9% 0.2%
1981 5.1% 19.6% -2.6% 14.9% 2.2% 9.7% 5.7%
1982 5.7% 19.1% -4.0% 14.8% -1.4% 7.0% 9.9%
1983 6.1% 17.5% -6.0% 14.8% 2.1% 4.4% 10.4%
1984 5.9% 17.4% -4.8% 13.4% 7.6% 3.7% 9.9%
1985 6.1% 17.7% -5.1% 13.7% 4.3% 3.3% 9.1%
1986 6.2% 17.5% -5.0% 13.2% 3.9% 2.4% 8.5%
1987 6.1% 18.4% -3.2% 12.5% 2.8% 2.8% 7.0%
1988 5.8% 18.1% -3.1% 12.4% 4.5% 3.3% 6.7%
1989 5.6% 18.3% -2.8% 12.5% 3.8% 3.8% 5.4%
1990 5.2% 18.0% -3.9% 13.4% 2.3% 3.8% 6.0%
Source: Office of Management and Budget, Historical Tables; Bureau of Labor Statistics, ConsumerPrice Index; Federal Reserve.
Note: Non-Military Outlays do not include interest payments on the federal debt; real corporate bondyields are for Moody’s BAA series as recorded by the Federal Reserve less the consumer price index(CPI); all data are calculated on a fiscal year basis except for corporate bond yields which arecalculated on a calendar year basis.
Desert Storm Operation
The economic and financing issues surrounding the Desert Storm Operation areunique in this survey in several ways. First, it was the only military operationconsidered that did not require any increase in military expenditures as a percentageof GDP. In fact, it took place during the long reduction in military spending as apercentage of GDP that accompanied the end of the Cold War. In this broad sense,there is no reason to consider the economic effects of financing the buildup. In fact,an economic contraction occurred during Desert Storm, unlike the typical wartimeeconomic boom. The 1990-1991 recession is not typically attributed to the war,except for its possible negative effects on confidence. Instead, it is typicallyattributed to contractionary monetary policy (undertaken through 1989 to quell therising inflation rate), problems in the banking sector, and the spike in oil pricesassociated with the Iraqi invasion of Kuwait. Timing supports this argument: themonetary tightening took place in 1988 and 1989, the recession began in July 1990,the oil price spike began in August 1990, and military operations began in January

CRS-14
13 When adjusted for the effects of the economic slowdown, the structural budget deficit wasequivalent to 2.1% of GDP in 1989 and in 1990, and 2.5% of GDP in 1991. Source:Congressional Budget Office, The Budget and Economic Outlook (Washington: January2001), Table F-1.14 Congressional Budget Office, Budget and Economic Outlook, January 1991, “SpecialSupplement,” Tax Notes, Oct. 29, 1990.15 CRS Report RS21013, Costs of Major U.S. Wars and Recent U.S. Overseas MilitaryOperations, by Stephen Daggett and Nina Serafino; Congressional Budget Office, TheEconomic and Budget Outlook (Washington: January 1992), p. 63.
1991. After the conflict ended, the economy began to expand again (in March 1991)— it did not experience post-war contraction.
Unlike previous military conflicts, in which the Federal Reserve had toleratedexcessive money creation, during Desert Storm the Federal Reserve sought to stampout inflationary pressures that originated before the conflict, even at the risk ofrecession. After the conflict ended, the economy began to expand again. The budgetdeficit rose during the conflict, but it would be difficult to claim that militaryspending contributed to the rise in the deficit when overall military spending wasdeclining during this time. Instead, the rising budget deficit was characterized byfalling tax revenues and rising non-military outlays, both of which can be largelyaccounted for by automatic changes in revenues and outlays caused by the economicslowdown.13 To reduce the widening deficit, the Omnibus Budget Reconciliation Actof 1990 cut spending and increased taxes. It was estimated that over the followingfive years, 57% of the deficit reduction would come from spending cuts and 29%from tax increases (14% would come from lower interest payments). Changes toexcise taxes, payroll taxes, and individual income taxes accounted for the bulk of thetax increases. The revenue raising provisions of the act were estimated to raise taxrevenues by 0.3% of GDP in 1991. Most of the spending reductions were to comefrom reductions in military outlays and Medicare spending.14
Another unique aspect of the financing of the Gulf War was the financialcontributions that the United States received from its allies. In effect, foreigngovernments financed a large part of the war effort for the United States —contributions from foreign governments equaled $48 billion, while the overall costof the war was $61 billion in current dollars.15 In the balance of payments, thesecontributions represented a unilateral transfer to the United States, which is recordedas a reduction in the current account deficit. The exchange value of the dollar wasunlikely to have been significantly affected, however, since a substantial portion ofthe contributions came from Saudi Arabia and Kuwait, both of whom had a de factofixed exchange rate with the dollar.

CRS-15
16 See CRS Report RL33110, The Cost of Iraq, Afghanistan, and Other Global War on(continued...)
Table 5. Economic Indicators in the Desert Storm Era
Year
MilitaryOutlays(% ofGDP)
TaxRevenue
(% ofGDP)
BudgetDeficit
(-) (% ofGDP)
Non-MilitaryOutlays(% ofGDP)
Real GDPGrowth
InflationRate
(PriceDeflator)
RealCorporate
BondYields
1989 5.6% 18.3% -2.8% 12.5% 3.8% 3.8% 5.4%
1990 5.2% 18.0% -3.9% 13.4% 2.3% 3.8% 6.0%
1991 4.6% 17.8% -4.5% 14.4% 0.0% 3.9% 5.6%
1992 4.8% 17.5% -4.7% 14.2% 2.2% 2.6% 6.0%
1993 4.4% 17.6% -3.9% 14.1% 3.0% 2.4% 4.9%
Source: Office of Management and Budget, Historical Tables; Bureau of Labor Statistics, ConsumerPrice Index; Federal Reserve.
Note: Non-Military Outlays do not include interest payments on the federal debt; real corporate bondyields are for Moody’s BAA series as recorded by the Federal Reserve less the consumer price index(CPI); all data are calculated on a fiscal year basis except for corporate bond yields which arecalculated on a calendar year basis.
Ongoing War in Iraq and Afghanistan
This section discusses spending and economic trends through 2008 surroundingthe war in Iraq that began in 2003. Like the 1991 conflict, the 2003 war began duringa period of economic weakness. Because the recession had already ended about ayear and a half before the war, the war was clearly not responsible for the economicweakness. At most, it prolonged the initially sluggish nature of the recovery throughthe upward blip in oil prices, which mostly occurred in the months leading up to thewar. Some observers had predicted the war would depress economic activity throughanother channel, weakened consumer and investor confidence, but this did not cometo pass. Economic growth picked up in 2004, and the economy was operating aroundfull employment in 2006. In the latter part of 2007 through the first half of 2008,rising unemployment, increasing oil and gas prices, and historically large numbersof housing foreclosures have put a strain on the economy.
Initially, the war in Iraq made a substantial contribution to the widening of thebudget deficit. During a period of economic sluggishness, this would be expectedto stimulate aggregate demand. However, any stimulative effect was minor sincemilitary outlays increased by only 0.3 percentage points of GDP in 2003 and anadditional 0.2 percentage points in 2004 (if measured by the supplementalappropriations, the increased outlays equaled about 0.6 percentage points of GDP in2003 and 0.7 percentage points in 2004).16 As can be seen in Table 6, the increase

CRS-16
16 (...continued)Terror Operations Since 9/11, by Amy Belasco.17 For more information, see CRS Report RS22850, Tax Provisions of the EconomicStimulus Package, by Jane G. Gravelle.
in military outlays occurring during the early years of the war was not financedthrough higher tax revenues or lower non-military outlays. Therefore, the war canbe thought to be entirely deficit financed.
As opposed to past conflicts where taxes were raised, taxes were cut in 2003.The tax cut’s major provisions were an acceleration of the 2001 income tax ratereductions and a reduction in the tax rate on dividends. Because of general economicweakness, the increased military spending and resultant deficits did not initially leadto higher interest rates or inflation. Inflation began rising in 2005 though it slowedslightly in 2007. Even after the recent increase, military spending as a percentage ofGDP is still lower than it was in any year before 1994.
After the first couple of war years, a shift to a higher level of deficit-financedspending would not be expected to have any further stimulative effect on theeconomy. The increase in revenues that occurred between 2005 and 2007 was causedby rising taxable income generated as a result of strong GDP growth, contributing tolower deficits and allowing the war to be financed through this increase in revenues.Revenues are projected to fall again in 2008 due to the cost of the economic stimulusmeasures passed by Congress in February, as well as the slowing economy.17 Thisindicates a return to funding the war solely through deficit-financed spending.
Table 6. Economic Indicators in the 2003 Iraq War
Year
MilitaryOutlays(% ofGDP)
TaxRevenue
(% ofGDP)
BudgetDeficit
(-)(% ofGDP)
Non-MilitaryOutlays(% ofGDP)
RealGDP
Growth
InflationRate
(PriceDeflator)
RealCorporate
BondYields
2002 3.4% 17.9% -1.5% 14.4% 1.5% 1.9% 6.2%
2003 3.7% 16.5% -3.5% 14.8% 2.7% 2.0% 4.5%
2004 3.9% 16.4% -3.6% 14.6% 4.5% 2.6% 3.7%
2005 4.0% 17.6% -2.6% 14.7% 3.7% 3.2% 2.7%
2006 4.0% 18.5% -1.9% 14.6% 3.4% 3.3% 3.3%
2007 4.0% 18.8% -1.2% 14.2% 2.2% 2.7% 3.6%
2008 4.2%a 17.9%b -2.7%b 14.5%a 1.6%a 2.2%a 3.5%c
Source: Office of Management and Budget, Historical Tables and Mid-Session Review; CongressionalBudget Office, The Budget and Economic Outlook: Fiscal Years 2008 to 2018; Bureau of LaborStatistics, Consumer Price Index; Federal Reserve, Macroeconomic Advisers.

CRS-17
Note: Non-Military Outlays do not include interest payments on the federal debt; real corporate bondyields are for Moody’s BAA series as recorded by the Federal Reserve less the consumer price index(CPI); all data are calculated on a fiscal year basis except for corporate bond yields which arecalculated on a calendar year basis.
a. Based on a calendar year estimateb. Estimatedc. Based on average of monthly data for January-June 2008
Conclusion
There is little reason to believe that the increase in military outlays associatedwith a war would cause a recession; in fact, theory predicts that it will cause anincrease in aggregate demand. Even if a conflict shifted spending away from non-military goods and services, there is no reason to think overall GDP would fallbecause military spending is included in GDP. The increased government outlaysassociated with wars can be financed in four ways: through higher taxes, reductionsin other government spending, government borrowing from the public (the issuanceand sale of U.S. Treasury securities to the public), or money creation. The DesertStorm Operation illustrates that a military campaign of moderate size can be financedwith very little impact on the budget or the economy. That campaign involved noincrease in overall military outlays as a percentage of GDP. When wars get larger,tax increases almost inevitably become necessary. Big conflicts typically bringeconomic booms because borrowing from the public and money creation expandaggregate demand. “Total wars,” such as World War II, typically draw on all fourfinancing methods and may even lead to fundamental shifts away from a marketeconomy.
The choice of how to finance a war is mainly a question of equity, which by itsnature is a political question. (The exceptions are total wars, which involve suchlarge expenses that virtually any financing choices will lead to considerableefficiency losses.) Financing through borrowing has been justified by some on thegrounds that future generations benefit from the sacrifice that present generationsmake by fighting the war, and should therefore bear some of the cost of the war.Borrowing has also been justified on “consumption smoothing” grounds — it isbetter to defray a temporary expense over time than all at once.
Of the four financing methods, economists tend to reject the money creationmethod if it can be avoided. They argue that the “inflation tax” is the most arbitraryof all taxes because the government cannot democratically specify its incidence. Itis also a financing method that leads to large efficiency losses quickly because itreduces the useful functions money serves in a market economy. It also underminesthe effectiveness of monetary policy as a macroeconomic stabilization tool.Economists also tend to believe that the benefits of widespread price controls arelargely illusory. Even if price controls successfully reduce recorded inflation, theycreate serious efficiency and welfare losses, typically lead to shortages, limitindividual choice, and encourage participation in black markets. When removed,price controls have consistently led to a release of pent up inflation historically.

CRS-18
Total wars by their nature require financing methods that lead to large efficiencylosses. Money creation, increasing taxes, or borrowing from the public on a largescale could all be opposed on efficiency grounds — it would be difficult to claim thatany one financing method is most efficient. In addition, governments often feel thatthe equity rationale makes policies such as rationing necessary, compounding theoverall efficiency loss. Thus, attempting to draw general policy conclusions from theexperience with total war risks comparing apples with oranges.