Financing housing since the crisis: examples in Europe Christine M E Whitehead LSE and CCHPR,...
31
Financing housing since the crisis: examples in Europe Christine M E Whitehead LSE and CCHPR, University of Cambridge DRAFT – NOT FOR QUOTATION “Housing finance in Europe in times of crisis” SIEPS Swedish Institute for European Policy Studies Stockholm 11 April 2013
-
Upload
edith-newton -
Category
Documents
-
view
216 -
download
0
Transcript of Financing housing since the crisis: examples in Europe Christine M E Whitehead LSE and CCHPR,...
Financing housing since the crisis: examples in Europe
Christine M E Whitehead LSE and CCHPR, University of Cambridge
DRAFT – NOT FOR QUOTATION
“Housing finance in Europe in times of crisis” SIEPS
Swedish Institute for European Policy Studies
Stockholm11 April 2013
Introduction: context of the research• Based on ENHR Housing Finance working
group survey together with published data• Number 3 in a series of papers on mortgage
and housing market developments before and after the financial crisis by Scanlon, Lunde and Whitehead (see final slide)
• Covers aspects of the consequences of the crisis
• Credit crunch has turned into a debt crisis and recession in many countries - with impacts back on to mortgage and housing markets

Research question, timing and methodology
• What has happened to housing and mortgage finance markets since 2009?
• How have governments and lenders responded?
• Data gathering mainly early 2011with updates 2012 and 2013

Housing market context
• Upswing in early 2000s: remarkable (but by no means total) synchronisation of markets in developed countries
• Peak not simultaneous: 2006 / 2007/ 2008
• Downswing: initially similar in countries with significant debt, but then variability in trajectories
Three Groups?• Group 1: continuing and sometimes
very large declines in prices and activity – although a subset now stabilising
• Group 2: more limited decline; some recovery; and then often some reversal
• Group 3: continued (although usually much slower) growth
• Another group where relatively little debt finance (mostly Eastern Europe)

Trends in house prices: Initial fall in real house prices from peak and recent price changes
Country % change in real house prices: peak
in 2006/7/8 to 2009:4 (or trough if
earlier)
% change in real house prices: peak in 2006/7/8 to 2012:4 (or 2012:3 for
some countries)
Latest year: nominal house price change to 2012:4 (or
2012:3)
Latest year: real house price change to
2012:4 (or 2012:3)
Group 1: Nominal and real prices fallingUK -15.9 % -17.2 % (2012:3)
+ 1.9 %
(2012:3)
-0.8 %Denmark -19.7 % -28.3 %
(2012:3)
-2.7 %
(2012:3)
-4.7 %Spain -11.3 % -34.2 % (2012:4)
-10.5 %
(2012:4)
-12.0 %Ireland -24.7 % -48.1 % (2012:3)
-6.1 %
(2012:4)
-7.4 %The Netherlands
-4.4 % -21.4 % (2012:4)
-6.9 %
(2012:4)
-9.7 %

Country % change in real house prices: peak
in 2006/7/8 to 2009:4 (or trough
if earlier)
% change in real house prices: peak in 2006/7/8 to 2012:4 (or 2012:3 for
some countries)
Latest year: nominal house price change to 2012:4 (or
2012:3)
Latest year: real house price change to 2012:4
(or 2012:3)
Group 2: Peak in house prices in 2007, then price drop to a 2009 turnaround – and sometimes a new house price drop in 2011-12
US - 18.8 % - 25.8 % (2012:3)
+ 3.0 %
(2012:3)
+ 1.5 %
Finland - 8.8 % + 0.1 % (2012:4)
+ 3.0 %
(2012:4)
+ 1.5 %
France - 9.6 % - 4.0 %
(2012:3)
-1.3 %
(2012:3)
-2.9 %
Sweden - 6.3 % 0.1 % (2012:4)
2.1 %
(2012:3)
0.6 %

Country % change in real house prices: peak
in 2006/7/8 to 2009:4 (or trough
if earlier)
% change in real house prices: peak in
2006/7/8 to 2012:4 (or 2012:3 for some
countries)
Latest year: nominal house price change to 2012:4 (or
2012:3)
Latest year: real house price change to 2012:4
(or 2012:3)
Group 3a: Real prices upNorway For 2007:3 to
trough 2008:4:
-11.6 %
+ 14.4 % (2012:3)
+ 6.6 %
(2012:3)
+ 5.2 %
Belgium For 2008:2 to trough 2009:2:
-1.0 %
+ 3.4 %
(2012:3)
+ 2.0 %
(2012:3)
- 0.5 %
Canada For 2008:3 to trough 2009:2:
-6.6 %
+ 10.1 % (2012:3)
+ 3.3 %
(2012:3)
+ 2.4 %
Group 3b: countries with recently relatively stable real house prices – and with actually increasing housing prices.
Germany -2.4 %
+ 12.9 % (2012:3)
+ 10.2 %
(2012:3)
+ 8.6 %
Switzerland -2.1 %
+ 18.0 % (2012:3)
+ 3.4 %
(2012:3)
+ 4.1 %

Figure 1: Real house prices 1970:1 – 2012:4 - 6 countries with falling prices since the 2006-07 peaks
Source: OECD house price statistics of 28th of January 2013.

Figure 2: Real house prices 1970:1 – 2012:4 – 4 countries: upturn, peak in 2007, some house price
drop, a 2009 turn around – and a new house price drop in 2011-12
Source: OECD house price statistics of 28th of January 2013.

Figure 3: Real house prices 1970:1 – 2012:4 - 4 countries with actually increasing real house prices
Source: OECD house price statistics of 28th of January 2013.

Figure 4: Real house prices 1970:1 – 2012:3 - 2 countries with recently relatively stable real house prices – and
with actually slightly increasing real house prices.
Source: OECD house price statistics of 28th of January 2013.

Figure 5: Indices of housing transactions, 2006 – 2010 (2006 = 100) Group 1: price falls

Figure 6: Indices of housing transactions, 2006 – 2010 (2006=100) Group 2: double dip

Figure 7: Indices of housing transactions, 2006 – 2010 (2006=100) Group 3: rising prices

Trends in Mortgage Markets
• Rapid declines in mortgage lending – supply or demand determined?
• Increases in arrears and foreclosures – more complex patterns than expected, partly because of government intervention based on past experience
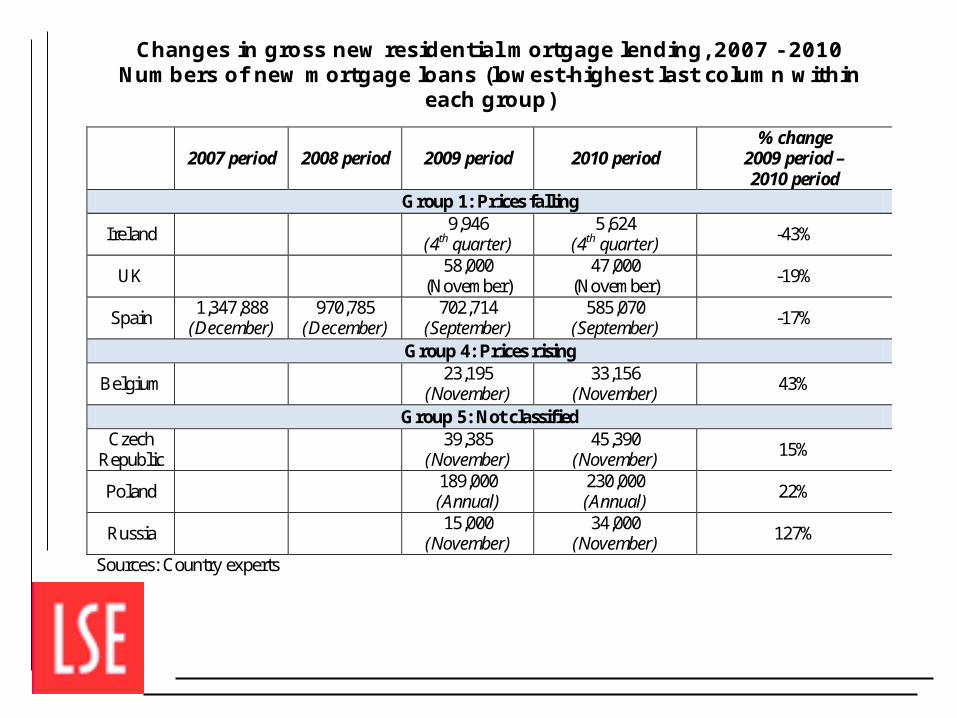
Changes in gross new residential mortgage lending, 2007 - 2010
Numbers of new mortgage loans (lowest-highest last column within each group)
2007 period 2008 period 2009 period 2010 period
% change 2009 period – 2010 period
Group 1: Prices falling
Ireland 9,946
(4th quarter) 5,624
(4th quarter) -43%
UK 58,000
(November) 47,000
(November) -19%
Spain 1,347,888
(December) 970,785
(December) 702,714
(September) 585,070
(September) -17%
Group 4: Prices rising
Belgium 23,195
(November) 33,156
(November) 43%
Group 5: Not classified Czech
Republic 39,385
(November) 45,390
(November) 15%
Poland 189,000
(Annual) 230,000 (Annual)
22%
Russia 15,000
(November) 34,000
(November) 127%
Sources: Country experts

WS-01: Housing Finance and Regulation
Changes in gross new residential mortgage lending, 2005 – 2011 Value of new loans (EUR million) (lowest-highest last column within each group)
Country 2005 2006 2007 2008 2009 2010 2011 % change 2009-2010
% change 2009-2011
Group 1: Prices falling Ireland 34,114 39,872 33,808 23,049 8,076 4,746 2,463 -41 -70
Spain 139,315 156,408 135,576 83,780 68,918 60,986 32,198 -12 -53
Denmark 77,592 49,993 43,272 36,964 49,703 47,453 29,716 -5 -40
USA 2,516,129 2,365,079 1,773,723 1,020,408 1,305,755 1,184,280 -9
UK 421,253 504,654 530,084 319,011 160,814 158,456 162,230 -1 +1
Netherlands 114,134 119,872 108,725 91,881 61,824 Group 2: Double dip
Australia TO COME
Sweden 43,885 41,290 43,895 33,776 39,909 45,077 38,887 -3
Finland 25,957 27,000 28,931 26,669 19,739 20,349 +3
France 134,500 149,080 146,800 122,000 89,000 158,000 136,248 +53 Group 3: Prices rising
Germany 109,600 114,200 119,600 121,300 114,600 122,000 145,600 +6 +27
Belgium 25,198 24,323 22,825 21,531 22,076 26,768 28,074 +21 +27 Group 4: Not classified
Slovenia 672 1,456 1,213 -17
Portugal 17,578 18,391 19,630 13,375 9,330 10,105 4,853 +8 -48 Czech Republic
2,609 4,094 5,395 4,935 2,689 3,216 4,757 +20 +77
Russia 1,897 7,602 16,314 17,863 3,455 9,411 +172 Source: Hypostat 2010; European Mortgage Federation

WS-01: Housing Finance and Regulation
Percentage of residential mortgages over three months in arrears, late 2007- late 2010 (highest-lowest last column within each group)
2007 period 2008 period 2009 period 2010 period Group 1: Prices falling
Ireland 1.21
(December 06) 1.44
(June) 3.6
(4th quarter) 5.7
(4th quarter)
Spain 0.95
(December) 2.40
(December) 3.0
(September) 2.58
(September)
UK 1.08
(2nd half) 1.88
(4th quarter) 2.42
(3rd quarter) 2.13
(3rd quarter)
USA 0.85
(December) 1.88
(December) TO COME
Denmark 0.14
(December) 0.32
(December) 0.57
(November) 0.42
(November) Group 2: Double dip
Sweden 3.5
(November) 1.5
(November)
Australia < 1
November < 1
(November) 0.7
(November) 0.7
(November) Group 3: Prices rising
Belgium* 2.1
(November) 2.1
(November)
Norway 0.7
(November) 0.7
(November) 1.6
(November) 1.7
(November) Group 4: Unclassified
Russia 3.5
(December) 5.4
(December) 6.9
(November) 7.0
(November)
Portugal 1.3
(November) 1.5
(November) 5.2
(November) 5.2
(November)
Czech 2.2
(December) 2.9
(November) Source: Scanlon et al. (2011) and questionnaires * Borrowers with at least one overdue payment

Reasons for Differential Arrears• Careful lending – eg France; Germany• Variable interest rates/lower rates of
unemployment than expected – UK; Denmark; Netherlands?
• Formal forbearance procedures – Ireland; UK
• Legal/cultural attitudes to foreclosure – at one extreme Spain – at the other France

WS-01: Housing Finance and Regulation
Foreclosures late 2009 – late 2010 (alphabetical within each group)
2009 period 2010 period Group 1: Prices falling
Denmark 417
(November) 426
(November)
Ireland 0.01 %
(November) 0.01 %
(November)
Netherlands 550
(November) n.a.
Spain 92,632
(Annual) 118,000 (Annual)
UK 12,200 – 0.11 %
(3rd quarter) 8,900–0.08% (3rd quarter)
USA
TO COME
Group 2: Double dip
Australia App 0
(November) App 0
(November)
Sweden 1%
(November) < 1 %
(November) Group 3: Prices rising
Belgium 1335
(November) 1478
(November)
Norway 486
(November) 704
(November)
Mortgage Products
• Credit assessments tightened• Increasing limitations on range of mortgage
products – demand? Institutional response? Increased regulation?
• Interest –only down being treated like annuity mortgages (UK) and special tax provisions (Netherlands)
• Limitations on maximum LTV - Sweden• But evidence does not suggest that
products themselves were are major source of arrears/foreclosures
WS-01: Housing Finance and Regulation
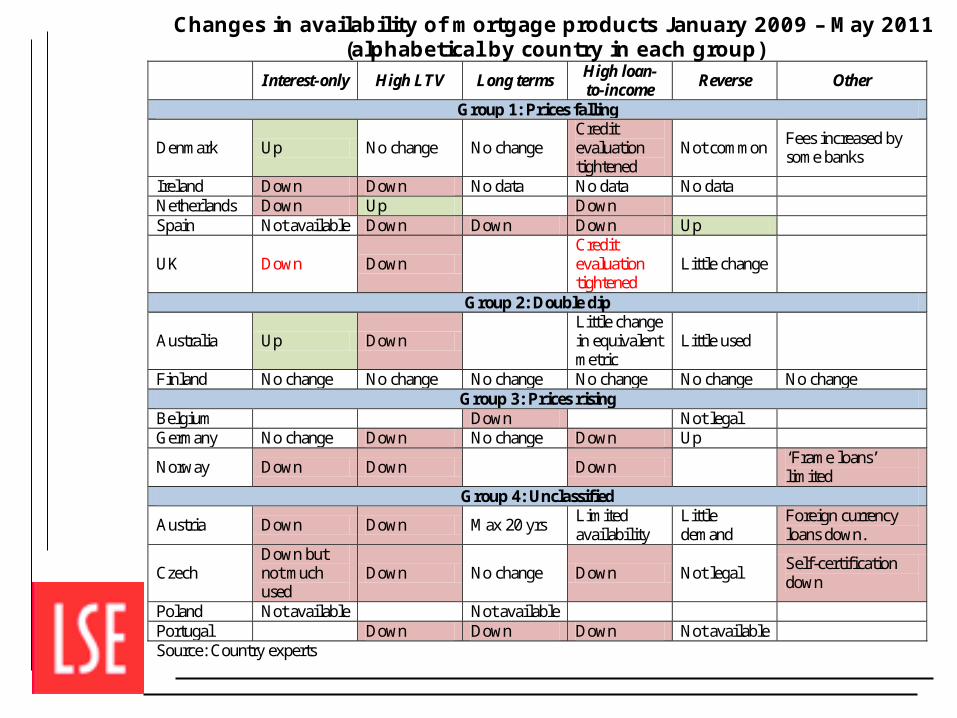
Changes in availability of mortgage products January 2009 – May 2011 (alphabetical by country in each group)
Interest-only High LTV Long terms High loan-to-income
Reverse Other
Group 1: Prices falling
Denmark Up No change No change Credit evaluation tightened
Not common Fees increased by some banks
Ireland Down Down No data No data No data Netherlands Down Up Down Spain Not available Down Down Down Up
UK Down Down Credit evaluation tightened
Little change
Group 2: Double dip
Australia Up Down Little change in equivalent metric
Little used
Finland No change No change No change No change No change No change Group 3: Prices rising
Belgium Down Not legal Germany No change Down No change Down Up
Norway Down Down Down ‘Frame loans’ limited
Group 4: Unclassified
Austria Down Down Max 20 yrs Limited availability
Little demand
Foreign currency loans down.
Czech Down but not much used
Down No change Down Not legal Self-certification down
Poland Not available Not available Portugal Down Down Down Not available Source: Country experts

WS-01: Housing Finance and Regulation
New regulation of mortgage lending in selected countries (alphabetical)
Australia Mortgage exit fees on variable-interest loans banned on new loans from 1 July 2011 Belgium None Czech None Denmark Discussion about limiting interest-only and adjustable-rate mortgages but no regulations yet
Finland Banks urged not to grant mortgages at over 90% LTV (Spring 2010). Lenders must assess borrower ability to pay if interest rates were 6%, and inform borrowers of results.
France Bank of France directs lenders directed to limit the length of loans Ireland 2010 recommendation against loans to borrowers in negative equity later relaxed Netherlands Limits on loan-to-income ratio; maximum 50% of loan to be interest-only
Poland New law to permit reverse mortgages. Foreign currency borrowers permitted to choose currency in which to pay; also down payment requirements increased and tighter credit assessment for foreign currency loans
Portugal Regulation to clarify right of lenders to change interest rates during loan period
Spain Proposals for ceilings and floors for variable mortgage rates; measures to expedite foreclosures; proposals to make mortgages non-recourse loans
Sweden LTVs capped at 85%
UK Proposals to limit issuance of self-certification mortgages; require more stringent affordability tests for interest-only loans; pressure to transfer from interest only to standard mortgages
Source: Country experts

Impact on Investment• Much less variation in supply response
across countries – impact of lack of confidence, Euro recession and unemployment as well as credit crunch
• Some countries still suffering constraints on availability of funds – for developers as well as purchasers
• Initial stimulus packages mainly replaced by public expenditure cutbacks
• Impact of shifting tenure structures

Change in residential building permits 2007-2011
Countries Percentage (%)
EU27 -44
Spain -89
Ireland -86
Greece -75
Portugal -71
Hungary -68
Cyprus -60
Denmark -43
United Kingdom -42
Netherlands -35
Norway -33
Poland -28
Sweden -18
France -13
Germany -7
Switzerland 36
Source: RICS Research – European Housing Review 2012

Outlook: prices and activity
• Have prices bottomed out? – some signs of stabilisation except in worst affected countries
• Equally there are concerns in countries where price increases are occurring notably Norway, Sweden and against past trends, Germany and Switzerland.
• Some countries with strong austerity packages beginning to use housing as a means of expansion – but as yet no significant impact – exception France?
• But low levels of activity in mortgage markets expected to be maintained as much because of lack of demand than funding constraints

Outlook: Mortgage Regulation
• Numbers of mortgage products have declined and generally become more traditional to the country
• Greater access constraints for first time buyers – but also lack of demand
• Changes in regulatory processes and potential impact of Basle III
• So far, long term regulatory change more rhetoric than reality in part because of low levels of activity – some evidence of reversal of strong constraints
• Macro-stability issues seen as increasingly important – both with respect to mortgage markets and funding for developers

Outlook: housing market adjustment
• Levels of development activity remains low in most countries
• Owner-occupation declining in some countries • Capacities to transfer stock to private renting
varies between countries• Concern that real economic growth potential
limited at least for some years

Conclusions• Trajectories with respect to house prices have
varied greatly since the financial crisis • More commonality in mortgage market
behaviour with lower levels of activity and some constraints on mortgage products-. Those that were more flexible have tightened controls – so now more in line with traditionally more regulated countries
• But little agreement with respect to mortgage products on what is risky
• Currently the real economy constraining activity as much as regulators – but if and when there is significant improvement what then?

Sources and ContactsThis presentation is based on research by KJ Scanlon, J
Lunde and CME Whitehead and the ENHR Housing Finance Working Group.
It is a draft and not for quotation.
Earlier papers are published in the International Journal of Housing Finance:
Scanlon, K, Lunde, J and Whitehead, C (2008) ‘Mortgage product innovation in advanced economies: more choice, more risk’ International Journal of Housing Policy 8:2, 109-131
Scanlon, K, Lunde, J and Whitehead, C (2011) ‘Responding to the housing and financial crises:
mortgage lending, mortgage products and government policies’ International Journal of Housing Policy 11:1, 23-49
Contact: [email protected]