Financing Dies in Darkness? The Impact of Newspaper ... · Financing Dies in Darkness? The Impact...
47
Financing Dies in Darkness? The Impact of Newspaper Closures on Public Finance * Pengjie Gao † University of Notre Dame Chang Lee ‡ University of Illinois at Chicago Dermot Murphy § University of Illinois at Chicago July 11, 2018 Abstract Local newspapers hold their governments accountable. We examine the effect of local news- paper closures on public finance for local governments. Following a newspaper closure, we find municipal borrowing costs increase by 5 to 11 basis points in the long run. Identification tests illustrate that these results are not being driven by deteriorating local economic conditions. The loss of monitoring that results from newspaper closures is associated with increased government inefficiencies, including higher likelihoods of costly advance refundings and negotiated issues, and higher government wages, employees, and tax revenues. JEL classification codes: G12, G18, H74 Keywords: media, monitoring, public financing, municipal bonds * We thank Andriy Bodnaruk, Kevin Crotty, Joey Engelberg, Umit Gurun, Ravi Jagannathan, Tim Loughran, David Merriman, Stephan Siegel, Chuck Trzcinka, and seminar participants at DePaul University, Northwestern University, the Securities and Exchange Commission, SFS Cavalcade, University of Illinois at Chicago, and University of Notre Dame for helpful comments. We also thank Randy Moore, Jesse Shapiro, and Michael Sinkinson for generously sharing data used for this project. All errors are our own. † University of Notre Dame, Mendoza College of Business, Department of Finance, Notre Dame, IN, 46556; tel: (574) 631-8048; e-mail: [email protected]. ‡ University of Illinois at Chicago, College of Business, Department of Finance, 601 South Morgan Street, Chicago, IL, 60607-7121; tel: (312) 996-1458; e-mail: [email protected]. § University of Illinois at Chicago, College of Business, Department of Finance, 601 South Morgan Street, Chicago, IL, 60607-7121; tel: (312) 355-4372; e-mail: [email protected].
Transcript of Financing Dies in Darkness? The Impact of Newspaper ... · Financing Dies in Darkness? The Impact...
Financing Dies in Darkness? The Impact of Newspaper Closures on
Public Finance∗
Pengjie Gao†
University of Notre Dame
Chang Lee‡
University of Illinois at Chicago
Dermot Murphy§
University of Illinois at Chicago
July 11, 2018
Abstract
Local newspapers hold their governments accountable. We examine the effect of local news-paper closures on public finance for local governments. Following a newspaper closure, we findmunicipal borrowing costs increase by 5 to 11 basis points in the long run. Identification testsillustrate that these results are not being driven by deteriorating local economic conditions. Theloss of monitoring that results from newspaper closures is associated with increased governmentinefficiencies, including higher likelihoods of costly advance refundings and negotiated issues,and higher government wages, employees, and tax revenues.
JEL classification codes: G12, G18, H74
Keywords: media, monitoring, public financing, municipal bonds
∗We thank Andriy Bodnaruk, Kevin Crotty, Joey Engelberg, Umit Gurun, Ravi Jagannathan, Tim Loughran,David Merriman, Stephan Siegel, Chuck Trzcinka, and seminar participants at DePaul University, NorthwesternUniversity, the Securities and Exchange Commission, SFS Cavalcade, University of Illinois at Chicago, and Universityof Notre Dame for helpful comments. We also thank Randy Moore, Jesse Shapiro, and Michael Sinkinson forgenerously sharing data used for this project. All errors are our own.†University of Notre Dame, Mendoza College of Business, Department of Finance, Notre Dame, IN, 46556; tel:
(574) 631-8048; e-mail: [email protected].‡University of Illinois at Chicago, College of Business, Department of Finance, 601 South Morgan Street, Chicago,
IL, 60607-7121; tel: (312) 996-1458; e-mail: [email protected].§University of Illinois at Chicago, College of Business, Department of Finance, 601 South Morgan Street, Chicago,
IL, 60607-7121; tel: (312) 355-4372; e-mail: [email protected].
“The functionaries of every government have propensities to command at will the liberty and
property of their constituents. There is no safe deposit for these but with the people themselves, nor
can they be safe with them without information. Where the press is free, and every man able to
read, all is safe” – Thomas Jefferson (1816)
1. Introduction
Local newspapers in the United States have been steadily declining in recent years, with cir-
culation numbers down approximately 27% from 2003 to 2014 (Pew Research Center (2017)). Ac-
companying this change was a 35% decline in statehouse reporters, who play an important role in
gathering information about local governments and reporting it to their readers. A recent Federal
Communications Commission report (Waldman (2011)) further hints at the implications of this
decline in local coverage: “. . . in many communities, we now face a shortage of local, professional,
accountability reporting. This is likely to lead to the kinds of problems that are, not surprisingly,
associated with a lack of accountability–more government waste, more local corruption, less effec-
tive schools, and other serious community problems.” Related academic studies in the political
economy space show that geographic areas with reduced local media coverage have less informed
voters (Mondak (1996)) and lower voter turnouts (Gentzkow, Shapiro, and Sinkinson (2011)), re-
moving the incentives of local politicians to work hard on behalf of their constituencies (Snyder
and Stromberg (2010)).
There is also a strong connection between media coverage and securities markets, with recent
research showing that stocks lacking media coverage have higher expected returns in the cross
section (Fang and Peress (2009)) and lower informational efficiencies (Peress (2014)). However,
it still remains an open question whether shocks to media coverage affect finance outcomes in
the long run. If informational inefficiencies persist following a negative coverage shock, then the
accompanying negative finance outcomes should also persist. Furthermore, a negative coverage
shock can lead to a deterioration in the quality of public governance because the local government
1
is no longer being monitored as closely. A local newspaper closure, for example, represents a
negative coverage shock that could affect public borrowing costs because potential lenders have
greater difficulty evaluating the quality of public projects and the government officials in charge of
these projects. On the other hand, if there is high degree of substitutability between the affected
media outlet and alternative, unaffected outlets, then there should be no effect on local financial
markets in the long run. This effect could even be positive if these alternative sources of news
provide more accurate and timelier information to their readers.
We empirically examine how shocks to local media coverage affect long-run public borrowing
costs. The municipal bond market provides an ideal setting for our study because the individual
bonds are largely bought and sold by local investors, providing a more direct link between local
media shocks and securities prices. We use local newspaper closures as a proxy for local media
shocks, as they effectively cause large, discrete changes in local media coverage. Our main find-
ing is that newspaper closures have a significantly adverse impact on municipal borrowing costs.
Specifically, following the three year period after a newspaper closure, municipal bond yields in the
secondary market increase by 6.4 basis points, while offering yields increase by 5.5 basis points;
these results are significant at the 1% level. Further, these results are robust to a comparison of
yields between affected and unaffected counties in the pre-closure period. The effect of newspaper
closures on revenue bonds, which are backed by the cash flows generated by specific projects and
subject to greater information asymmetries, is even stronger, with secondary and offering yields
increasing by 9.9 and 10.6 basis points. Our evidence suggests that there is not a sufficient degree
of substitutability between local newspapers and alternative information sources for evaluating the
quality of public projects and local governments.
A potential concern is that both municipal borrowing costs and newspaper closures are being
driven by underlying economic conditions in the region. We address this concern in several ways.
Our first strategy involves examining the differential effect of a newspaper closure on borrowing
costs in the county which contained that newspaper and a population-matched neighboring county
2
with its own newspaper operation. Declining economic conditions in the region are likely to affect
both counties. If a newspaper closure truly affects local borrowing costs, then we would expect
a newspaper closure to affect borrowing costs in the closure county but not the matched control
county. Consistent with this hypothesis, we find that the differential effect of a newspaper closure on
offering yields in the closure county versus the matched control county is 7.3 basis points (p = 0.012).
Corroborating this evidence, we also find that newspaper closures are evenly dispersed across states
with different economic conditions and across our sample period, which includes both economic
expansion and contraction periods.
A second identification strategy involves examining newspaper closures in counties with a low
number of newspapers versus counties with a high number of newspapers. The latter counties
are unlikely to be significantly affected by a newspaper closure since there are still plenty of local
newspapers in place to cover local issues. This is unlike counties with a low number of newspapers,
which are typically left with only one or even zero newspapers following a newspaper closure. If
newspaper closures were driven by underlying economic conditions, then we would observe similar
yield increases in the low newspaper and high newspaper counties. However, our evidence indicates
that a newspaper closure in a low newspaper county increases offering yields by 10.3 basis points,
while a newspaper closure in a high newspaper county has no significant effect on offering yields,
for a relative yield difference of 11.8 basis points (p = 0.000).
Research has shown that advertising revenues for local newspapers were negatively affected by
the expansion of Craigslist, an online database of classified advertisements which currently has over
60 million global users (Gurun and Butler (2012), Kroft and Pope (2014), Seamans and Zhu (2014),
Gurun, Matvos, and Seru (2016)). The gradual rollout of Craigslist in the United States is useful for
our purposes because its introduction to a geographic area comprises a plausibly exogenous shock
to the probability of a newspaper closure without directly affecting local municipal bond yields.
We examine the effect of newspaper closures on municipal bond yields and use Craigslist entry as
an instrument for newspaper closures. In the first stage regression, we find that Craigslist entry
3
increases the probability of a newspaper closure by about 10 percentage points, which is consistent
with the existing evidence showing that Craiglist negatively affected local newspaper advertising
revenues. Importantly, in the second stage regression, we find that Craigslist-induced newspaper
closures increase municipal bond yields by four to six basis points, further establishing a causal
connection between newspaper closures and municipal borrowing costs.
Differences in state characteristics provide additional insight into the relationship between news-
paper closures and public finance outcomes. Campante and Do (2014) show that the relative dis-
tance between a state’s economic and political centers is a useful measure of the quality of public
governance in that state, with longer distances being associated with lower quality governance. The
marginal effect of external monitoring on governance quality is likely to be stronger in states with
low quality governance. Thus, we hypothesize that the effect of a newspaper closure on borrowing
costs will be higher in high isolation states compared to low isolation states. Consistent with this
hypothesis, we find that a newspaper closure increases yields by 12.3 basis points in high isolation
states and 5.5 basis points in low isolation states, for a difference of 6.8 basis points (p = 0.027).
Newspaper closures have a significant effect on offering yields for both state types, but this effect
is more than twice as strong in the low isolation states. This indicates that local newspapers are
especially important in states that already have low quality governance.
Newspaper closures lead to higher borrowing costs in the long run, suggesting that alternative
sources of media, such as the internet, are not acting as sufficient substitutes for these local news-
papers. We test this latter assertion more directly by examining the effect of newspaper closures
on public borrowing costs in states with high versus low internet usage, which we classify using
internet usage data from the National Telecommunications & Information Administration (NTIA).
If the internet acts as a good substitute for local newspapers, then we should observe little-to-no
effect in the high internet usage states. However, we find that the effect of a newspaper closure
on offering yields is not significantly different across these two state types, further suggesting that
online sources do not act as a perfect substitute for local newspapers.
4
We propose that newspaper closures affect long-run municipal borrowing costs through the gov-
ernment inefficiency channel, and provide evidence that government inefficiencies are more prevalent
following a newspaper closure. First, we show that advance refundings of callable bonds, which
Ang, Green, Longstaff, and Xing (2017) show are almost always negative net present value transac-
tions, are more likely following a newspaper closure. The same holds true for the negotiated sales
of municipal bond issuances (as opposed to competitive sales), which are generally associated with
higher transaction costs. We also directly examine the effect of newspaper closures on the following
government efficiency metrics: the ratio of total county government employee wages to the total
county employee wages, the number of government employees per capita, and the tax revenue per
capita. We find that a newspaper closure leads to a 1.3 percentage point increase in the government
wage ratio. For the median county, this represents a total government wage increase of $1.4 million.
Similarly, in the long-run, we find that the the number of government employees increases by about
four people per 1,000 residents and the tax revenue per capita increases by about $85. Collec-
tively, our evidence suggests that newspaper closures lead to increased government inefficiencies,
supporting our proposed mechanism through which newspaper closures affect municipal borrowing
costs.
Our paper is related and contributes to the literature on the governance or “watchdog” role of
the media - particularly the local news media - and finance. Dyck, Morse, and Zingales (2010) em-
phasize the governance role of media, acting as a whistleblower for fraudulent activities. However,
some authors point out the limitations of news media. Gurun and Butler (2012) illustrate that
local media outlets can be captured or compromised because of advertisement revenues generated
by local businesses. Shapira and Zingales (2017) present anecdotal evidence that the local news
media was reluctant to antagonize DuPont, an industrials firm that was easily the largest employer
in the area. The local media downplayed and suppressed news about a DuPont-related environ-
mental disaster caused by emissions of a toxic chemical named C8. In this case, the media had a
mostly ineffective external governance role. In our context, the local news media has an important
5
and uncompromised external governance role, as media capture by the local government, which is
typically not an important source of revenue for the municipality, is unlikely. This is important be-
cause local newspapers continue to play a crucial role in informing local residents. Based on survey
evidence, the Pew Research Center concludes the following in a research report: “Among all adults,
newspapers were cited as the most relied-upon source or tied for most relied upon for crime, taxes,
local government activities, schools, local politics, local jobs, community/neighborhood events, arts
events, zoning information, local social services, and real estate/housing. This dependence on news-
papers for so many local topics sets it apart from all other sources of local news. The internet,
which was cited as the most relied upon source for five of the 16 topics, was a distant second to
newspapers in terms of widespread use and value” (Pew Charitable Trusts (2011)). As a conse-
quence, the closure of a local newspaper creates a local information vacuum. Moreover, it is unlikely
that such a vacuum can be easily filled by other sources of media. First, local issues are not topical
enough for the national news media, which faces a much broader audience. Second, non-traditional
media outlets, which are primarily online, have not sufficiently filled the investigative journalism
gap that has resulted from newspaper closures (Waldman (2011)). Instead, these non-traditional
outlets have primarily been in the business of content dissemination rather than the production of
new information.
Our paper is also closely related to the literature that explores local news media and political
economy. Mondak (1996) and Gentzkow et al. (2011) examine the impact of media coverage on
political elections and show that newspaper closures are associated with less informed voters and
lower voter turnouts. Snyder and Stromberg (2010) show that governments become less efficient
when a newspaper is no longer there to monitor the government operations. This literature was
fundamental for our empirical design, as we similarly explore how newspaper closures affect real
outcomes. Importantly, we focus on the effect of newspaper closures on public finance outcomes,
which has never been explored, to the best of our knowledge. This strand of literature also provides
us with a plausible political economy foundation for developing our hypotheses of how public finance
6
might be influenced by the loss of monitoring that results from local newspaper closures.
The rest of this paper is organized as follows. Section 2 provides theoretical background and
motivating anecdotal evidence for the empirical analysis. Section 3 describes the data used in
this study. Section 4 presents summary statistics about newspaper closures and municipal bond
characteristics and provides preliminary, univariate tests of municipal bond yields around news-
paper closures. Section 5 presents our baseline results showing the effect of newspaper closures
on municipal bond yields in a multivariate setting, and also includes several identification tests
that support these baseline results by ruling out alternative explanations. Section 6 examines the
effect of newspaper closures on government efficiency outcomes, including the likelihoods of costly
advance refundings and negotiated sales, and government wages, employees, and tax revenues per
capita. Finally, Section 7 concludes.
2. Theory and Anecdotal Evidence
Prat and Stromberg (2013) provide a useful review of the political economy literature on the
influence of media on politics and policy. In Section 5 of their review, they develop a theoretical
model which illustrates the effect of media on political accountability and public policy. In par-
ticular, they assume that there is an incumbent politician who allocates his budget across a set of
public goods and keeps any residual funds for himself. Informed and uninformed voters choose to
vote for the incumbent or a challenger, who keeps the residual funds if she wins. In a pure strategy
equilibrium, the incumbent chooses a public good allocation that is directly related to his budget
level and the share of informed voters. An implication of this equilibrium, according to Proposition
3 of Prat and Stromberg (2013), is that an increase in the share of media users or the amount
of media coverage on a specific issue leads to an increase in the budget allocation and expected
competence of politicians for that issue. This is highly relevant to our study, as a newspaper closure
represents a structural shift in the distribution of local media coverage which should, in theory, lead
to reduced government efficiency in the post-closure equilibrium. From a public finance perspective,
7
a newspaper closure should lead to worsened municipal borrowing outcomes since it is riskier to
lend to inefficient local governments, all else being equal. This reasoning forms the basis of our
empirical tests of how newspaper closures affect public borrowing costs in the long run.
Anecdotal evidence of newspaper closures in the United States suggests that long-run public
finance outcomes deteriorate following a newspaper closure. First, consider the Rocky Mountain
News, a newspaper operating out of Denver, Colorado with a circulation of approximately 250,000
subscribers. Declining circulation numbers and advertising revenues led the newspaper to close in
2009. A search of Rocky Mountain News articles suggests that they provided valuable coverage
of local government issues. Prominent coverage examples include an audit of questionable federal
funds that were allocated to the local sheriffs department, a handshake deal between the city
government and Lufthansa Airlines which may have violated federal law, the lack of oversight
for the 390 “special taxing districts” established in the Denver metropolitan area, and an “under
the table” scheme at the Denver International Airport in which employees were being paid for
undeserved wages. These examples suggest that the Rocky Mountain News was an important
monitoring agent for the local government, providing information to local residents about how their
tax dollars were being spent. Following the newspaper closure, the average (median) yield spread
for newly issued local municipal bonds increased by 37.1 (5.3) basis points, despite the continued
positive growth in population and per capita income in the area. We emphasize the latter point to
illustrate that newspaper closures are not necessarily driven by local economic conditions.
A second example is The Cincinnati Post, a newspaper with a circulation of approximately
25,000 subscribers that serviced the Cincinnati area and nearby suburbs of Kentucky. This news-
paper closed in 2007 due to declining circulation numbers and the conclusion of a 30-year joint
operating agreement formed in 1977 between The Cincinnati Post and The Cincinnati Enquirer
(Schulhofer-Wohl and Garrido (2009)). The Cincinnati Post provided important coverage of the
city government, reporting about the altering of internal audits of city workers by a city manager, a
lawsuit alleging that the city conspired with local churches to evict low income families to redevelop
8
apartment buildings into condominiums, and the formation of a pension task force to refine the
budgeting of annual retiree healthcare costs. Like the Rocky Mountain News, it is clear that the
newspaper played an important government watchdog role. Schulhofer-Wohl and Garrido (2009)
examine the closure of The Cincinnati Post in detail and show that voter turnout and campaign
spending significantly declined following the closure in regions that were the most reliant on this
newspaper. Importantly, we find that the average (median) yield spread for newly issued, local mu-
nicipal bonds increased by about 66.1 (64.5) basis points following the closure, further suggesting
that newspaper closures also have negative implications for public finance outcomes.
The loss or absence of a local newspaper in a particular county can also have serious consequences
for government efficiency outcomes. Consider the case of Bell, California, a suburb of the city of
Los Angeles with a population of about 37,000 people and a median annual household income of
about $30,000. According to a 2011 Federal Communications Commission (FCC) report (Waldman
(2011)), residents of Bell “wondered for a long time how their town officials managed to live like
the rich and famous.” One prominent example was Robert Rizzo, the Bell town manager hired in
1993 who owned a beachfront mansion and a 10-acre horse ranch outside Seattle. In July 2010,
reporters from the Los Angeles Times conducted an investigation of Bell government employee
salaries, and found that Rizzo was earning $787,637 per year, up from his initial starting salary
of $72,000 per year in 1993, as a result of large and regular annual raises. The police chief of
Bell, meanwhile, was earning $457,000 per year, 50% more than the police chief of Los Angeles.
Two months following this investigation, the district attorney of Los Angeles County filed charges
against eight Bell officials, alleging that they stole $5.5 million in public funds. The FCC report
suggests that the corruption in Bell, California went unchecked for such a long time because of
a lack of local newspaper coverage. Community activist Christina Garcia stated that “a lot of
residents tried to get the media’s attention, but it was impossible. The city of Bell doesn’t even
have a local paper; no local media of any sort.” Although the city did have a local newspaper called
the Bell, Maywood, Cudahy Community News, this newspaper shut down in the late 1990s. The
9
FCC report also adds that the closest television stations, located in Los Angeles, rarely covered
Bell. Further, the staffs at the major newspapers in Los Angeles were already spread so thin that
they could barely provide coverage to surrounding municipalities like Bell. Terry Francke, founder
of Californians Aware, a nonprofit organization which advocates for open governments, summed
up the problem thusly: “ . . . the Bell spectacle is what happens to communities without their own
old-fashioned diligent news coverage by veteran newspaper reporters, or at least smart reporters
led by veteran newspaper editors. The result need not be on paper, but it must be done with the
community memory and professional savvy almost unique to newspaper-trained journalists with
experience watching small-town politics” (Waldman (2011)).
3. Data
We construct U.S. daily newspaper data from 1996 to 2015 using two data sources. The first
source is the United States Newspaper Panel, constructed by Gentzkow et al. (2011). This database
includes information on U.S. daily newspapers for every four years from 1872 to 2004. We collect
information for the years 1996, 2000, and 2004 from this panel data. The information for the
remaining years from 1996 to 2015 is hand-collected from the Editor and Publisher Yearbook, an
annually published directory of U.S. newspapers. The combined data set contains the name, city,
and state of every English-language daily newspaper in each year from 1996 to 2015. Following
Gentzkow et al. (2011), we match newspapers to counties based on the cities in which they are
located. We use the 2010 U.S. Census county definition to find the county in which a city resides.1
If a newspaper is located on the border of two counties, we match the newspaper to both counties.
This matching yields 1,596 newspapers serving 1,266 counties at some point between 1996 and 2015.
We exclude counties which have never had a newspaper in our sample period from our analysis, as
these no-newspaper counties tend to be small and very sparsely populated.
1Independent cities are considered as county equivalents by the U.S. Census Bureau. If an independent city servesas the county seat of an adjacent county, we consider the independent city and its adjacent county as one combinedcounty equivalent. Otherwise, an independent city is considered as a county equivalent in itself.
10
A newspaper drops out of our data mainly for one of three reasons: (1) the newspaper was
closed or absorbed by another newspaper (68 cases); (2) the newspaper turned non-daily, in that it
publishes fewer than four days a week (152 cases); or (3) the newspaper was merged with another
newspaper to form a new newspaper (59 cases). An additional 17 exits are attributed to other or
unidentified reasons. In total, we observe 296 newspaper exits from 1996 to 2015. We do not analyze
newspaper openings in our study because they are fairly infrequent during the sample period.
Similar to Gentzkow et al. (2011), we identify the counties that experience a newspaper closure by
calculating the annual change in the total number of newspapers for each county. A newspaper
closure, our key event, occurs in a county in year t if the number of newspapers in the county
decreases to two or fewer from year t to t+1. For our purposes, we do not focus on closures in which
a county still has three or more newspapers, as the press coverage in that county is still significant.
This implies that our main focus will be on newspaper closures in which the county was left with
two or fewer newspapers following the closure, resulting in a duopoly newspaper environment, at
best. Studies have shown that competition among newspapers is important for competitive local
politics (Schulhofer-Wohl and Garrido (2009)) and ideological diversity (Gentzkow, Shapiro, and
Sinkinson (2014)). Therefore, we expect that counties where a newspaper closure results in two or
fewer newspapers will also suffer from the decline in press coverage following the newspaper closure,
despite still having their own local newspapers. We should also note that our results remain robust
if we focus only on newspaper closures in which there are one or zero newspapers remaining after
the closure.
We construct monthly U.S. municipal bond data from 1999 to 2015 using several data sources.
Municipal bond transaction-level prices and yields are provided by the Municipal Securities Rule-
making Board (MSRB). The data consist of all intraday broker-dealer municipal bond trades for
the period 1999 to 2015. Each observation includes the bond price, yield, par value traded, and
whether the trade was a customer purchase from a broker-dealer, customer sale to a broker-dealer,
or an interdealer trade. We study municipal bond secondary yields around newspaper closures at
11
the monthly level. To convert the MSRB database to a monthly frequency, we take the average
secondary yield of all customer buy transactions within each bond-month, weighted by the par
value traded. The offering yield and attributes of each bond contained in the MSRB database
are collected from the Mergent Municipal Bond Securities Database. The attributes of individual
bonds include the state of issuance, issue series, issuance date, type of issue sale (negotiated versus
competitive), maturity date, coupon rate, bond size, as well as bond ratings from Moody’s and
Standard & Poor’s (if the bond is rated). The Mergent database also provides information about
whether the bond is general obligation, insured, and callable. We collect the county location of
municipal issuers from Bloomberg and match bonds to counties based on the locations of the is-
suers. We also gather the type of municipal issuers from the Electronic Municipal Market Access
(EMMA) system, which is operated by MSRB, to classify issuers into state governments and local
governments.
We exclude municipal bonds with fewer than ten transactions in our sample period, a maturity
of more than one hundred years, or a variable coupon rate. We also exclude bonds that are subject
to federal taxes. We only include bonds that are issued in U.S. states, and thus not those issued in
U.S. territories, as our newspaper database does not cover newspapers published in U.S. territories.
To mitigate the effect of outliers, we exclude any transactions from the MSRB database that have
non-positive yields or yields greater than 50 percentage points. We also exclude state-issued bonds
from our main analysis, as our study applies to local governments within a county.
4. Summary Statistics
According to the 2010 U.S. Census county definition, there are 3,129 counties in the U.S. In our
sample period from 1996 to 2015, there are 1,596 newspapers serving 1,266 counties at some point.
The remaining 1,863 counties do not have a daily newspaper operation located in that county in any
year. These “No Newspaper” counties are excluded from our analysis, as they tend to be smaller
and more sparsely populated. There are 296 newspaper exits and 81 newspaper entries over the
12
20 years, resulting in 204 counties that experience a net decrease in the number of newspapers to
fewer than three during our sample period. We call these 204 counties “Closure” counties. We call
the remaining 1,062 counties that do not see a decline in their number of newspapers “No Closure”
counties.
For the most part, the newspaper closures in our sample are evenly distributed across the
sample period. Figure 1 displays the number of newspaper exits in each year of our sample period
and illustrates that newspaper exits are evenly spread throughout the sample years. While the
number of exits appears to increase toward the end of our sample period, we also observe a sizable
number of exits in the early part of the sample. In addition, it appears that newspaper exits are
evenly distributed across both economic recession and expansion periods. The recession years in
our sample period are 2001 and 2007 through 2009; this represents 20% (4/20) of the years in our
sample. There are 69 newspaper exits during these recession years, which represents about 23% of
the total number of exits between 1996 and 2015. This is comparable to the proportion of recession
years (20%) in the sample. Overall, this figure suggests that newspaper closures are not necessarily
driven by economic conditions in the time series.
The newspaper closures in our sample also appear to be evenly distributed across geographic
regions. Figure 2 provides a map of the United States indicating the counties that experience a
newspaper closure. Newspaper closures do not appear to be clustered in a particular region; rather,
they appear to occur in almost all of the states. States with higher populations tend to have more
newspapers, which is why we generally observe more newspaper closures in those states. Texas,
California, and New York, for example, experience 19, 12, and 8 newspaper closures, respectively.
Yet, we observe a sizable number of newspaper closures in states with lower population levels as
well. Oklahoma, Missouri, and Colorado, for example, experience 12, 10, and 6 newspaper closures,
respectively. Lastly, the political orientation of a state also does not seem to affect the incidences of
newspaper closures, in that newspaper closures tend to occur in both Democratic and Republican
states. This figure suggests that newspaper closures are not necessarily driven by the underlying
13
economic conditions in the state cross-section.
Panel A of Table 1 presents summary statistics for the municipal bonds issued in the 204
counties that experience a newspaper closure (“Closure” counties) in our sample period. There are
92,397 bonds in Closure counties, which represent 4,516 issues. These bonds have an average bond
size of $4.68 million, issue size of $63.67 million, and maturity of 13.2 years. Fifty-two percent of
these bonds are insured. Eighty-eight percent of these bonds are classified as investment grade and
12% are unrated. Fifty percent of these bonds are general obligation, in that they are backed by
the tax revenue of the issuing municipality. Finally, 61% of these bonds are callable.
For comparison purposes, Panel A of Table 1 also provides summary statistics for the municipal
bonds issued in the 1,062 counties that have newspapers but do not experience a newspaper closure
(“No-Closure” counties). There are 257,112 bonds in No-Closure counties, which represents 15,262
issues. These bonds have an average bond size of $4.8 million, issue size of $69.79 million, and
maturity of 13.02 years. About 55.26% of No-Closure county bonds are insured. Eighty-eight
percent of these bonds are classified as investment grade and 11% are unrated. Fifty-one percent
of these bonds are general obligation and 61% of these bonds are callable. Overall, we find that the
characteristics of bonds issued in Closure counties are similar to those issued in No-Closure counties,
indicating that different bond types are not self-selecting into Closure or No-Closure counties.
The focus of this paper is on the long-run effect of newspaper closures on municipal finances,
particularly municipal bond yields. As a preliminary univariate test, we divide bonds from Closure
counties into those issued at least three years following a newspaper closure and those issued before
that. This definition assumes that it takes at least three years for a newspaper closure to have
a bearing on municipal finances. Panel B of Table 1 reports offering yield summary statistics for
bonds issued in Closure counties during the pre-closure and post-closure periods. This panel also
reports summary statistics for a control group of bonds that are matched by state and year to the
sample of bonds issued in Closure counties. Bonds issued in Closure counties during the pre-closure
period have a slightly lower average offering yield than the bonds in the matched control group.
14
Specifically, we find that the average offering yield for bonds issued in Closure counties during the
pre-closure period is 4.047%, which is 1.5 basis points lower than the average offering yield from
the matched control group (4.062%). In the post-closure period, we find that the average offering
yield for bonds issued in Closure counties is 3.556%, which is 3.0 basis points higher than the
average offering yield for the matched control group (3.526%).2 The difference in offering yields in
the post-closure period compared to the difference in the pre-closure period is 4.5 basis points, and
this is significant at the 1% level. These preliminary results indicate that newspaper closures have
a significant effect on long-run municipal bond yields compared to other bonds issued in the same
state and year.
Panel B of Table 1 also reports summary statistics for the yield spread between a municipal
bond and a coupon-equivalent risk-free bond in Closure counties and the matched control counties.3
We obtain similar results to our univariate tests above for the offering yield. In particular, we find
that the average offering yield spread for bonds issued in Closure counties during the pre-closure
period is -0.264%. This is 1.9 basis points lower than the average yield spread for the matched
control group. In the post-closure period, however, we find that the average offering yield spread
for bonds issued in Closure counties is 3.6 basis points higher that the average for bond issued in
matched control counties. In this case, the difference in offering yield spreads in the post-closure
period compared to the pre-closure period is 5.5 basis points, which is significant at the 1% level.
Overall, the results in Panel B of Table 1 indicate that offering yields generally increase following
a newspaper closure.
One might wonder if the difference in average offering yields between Closure and No Closure
2For both groups, the offering yields are about 0.5 percentage points lower because of a general downward trendin interest rates in our sample. In our main multivariate regression tests later in the paper, we will control for yearfixed effects.
3We calculate the yield on the coupon-equivalent risk-free bond as follows. For each municipal bond, we calculatethe present value of its coupon payments and face value using the U.S. Treasury yield curve, which is based on thezero-coupon yield curve estimated in Gurkaynak, Sack, and Wright (2007). This gives us the price of the coupon-equivalent risk-free bond. The risk-free yield-to-maturity is then calculated using this price, the coupon payments,and the face value payment. The yield spread is calculated as the difference between the municipal bond yield andthe risk-free yield-to-maturity. This is similar to the yield spread calculation in Longstaff, Mithal, and Neis (2005).
15

counties is being driven by other differences between these counties such as local economic condi-
tions. Table 2 provides county-level summary statistics for the Closure and No-Closure counties.
The average annual income per capita for Closure counties is $35,210, compared to $33,440 for No
Closure counties. Closure counties have a median population of 76,630, which is only slightly higher
than the median population of 70,540 for No Closure counties. Overall, these results indicate that
there are minimal differences between these counties. This table also reports the average growth
rates in population, employment, and total wages for Closure and No Closure counties during our
sample period. Closure counties have an average population growth of 0.67%, employment growth
of 0.75%, and total wage growth of 1.94% per year. No Closure counties have an average pop-
ulation growth of 0.6%, employment growth of 0.59%, and total wage growth of 1.61%. These
growth rates in Closure counties and No Closure counties are fairly comparable, suggesting that
newspaper closures are not strongly associated with deteriorating economic conditions during our
sample period.
5. Newspaper Closures and Public Finance Outcomes
5.1. Baseline Results
We hypothesize that local newspaper closures negatively affect public finance outcomes in the
long run. Our initial tests focus on the effect of newspaper closures on local municipal borrowing
costs. Define yijt as the municipal bond yield spread (measured in percentage points) for bond i
in county j during year-month t. As before, the municipal bond yield spread is calculated as the
difference between the municipal bond yield and the yield on an equivalent risk-free bond. Further,
define Closurejt as an indicator variable that equals one if t occurs at least three years after a
newspaper closure in county j, and zero otherwise. We only focus on closures in counties that had
three or fewer newspapers before the closure, as any county with a large number of newspapers is
unlikely to be significantly affected by a single newspaper closure. With our key dependent and
16
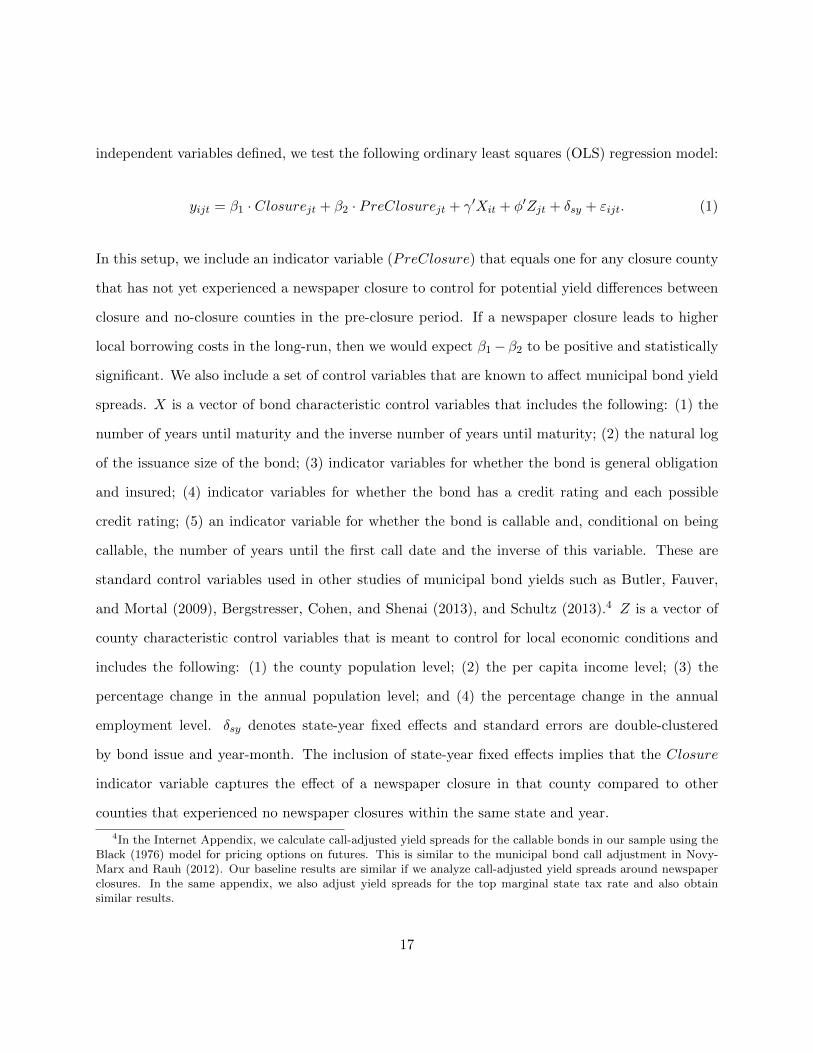
independent variables defined, we test the following ordinary least squares (OLS) regression model:
yijt = β1 · Closurejt + β2 · PreClosurejt + γ′Xit + φ′Zjt + δsy + εijt. (1)
In this setup, we include an indicator variable (PreClosure) that equals one for any closure county
that has not yet experienced a newspaper closure to control for potential yield differences between
closure and no-closure counties in the pre-closure period. If a newspaper closure leads to higher
local borrowing costs in the long-run, then we would expect β1− β2 to be positive and statistically
significant. We also include a set of control variables that are known to affect municipal bond yield
spreads. X is a vector of bond characteristic control variables that includes the following: (1) the
number of years until maturity and the inverse number of years until maturity; (2) the natural log
of the issuance size of the bond; (3) indicator variables for whether the bond is general obligation
and insured; (4) indicator variables for whether the bond has a credit rating and each possible
credit rating; (5) an indicator variable for whether the bond is callable and, conditional on being
callable, the number of years until the first call date and the inverse of this variable. These are
standard control variables used in other studies of municipal bond yields such as Butler, Fauver,
and Mortal (2009), Bergstresser, Cohen, and Shenai (2013), and Schultz (2013).4 Z is a vector of
county characteristic control variables that is meant to control for local economic conditions and
includes the following: (1) the county population level; (2) the per capita income level; (3) the
percentage change in the annual population level; and (4) the percentage change in the annual
employment level. δsy denotes state-year fixed effects and standard errors are double-clustered
by bond issue and year-month. The inclusion of state-year fixed effects implies that the Closure
indicator variable captures the effect of a newspaper closure in that county compared to other
counties that experienced no newspaper closures within the same state and year.
4In the Internet Appendix, we calculate call-adjusted yield spreads for the callable bonds in our sample using theBlack (1976) model for pricing options on futures. This is similar to the municipal bond call adjustment in Novy-Marx and Rauh (2012). Our baseline results are similar if we analyze call-adjusted yield spreads around newspaperclosures. In the same appendix, we also adjust yield spreads for the top marginal state tax rate and also obtainsimilar results.
17
The results of the regression model in equation (1) are reported in Table 3. According to
the regression in column (1), a newspaper closure increases the average secondary municipal bond
yield spread for bonds issued in that county by 6.4 basis points. Relative to the pre-closure yield
difference (β2), the average yield spread increases by 8.2 basis points following a newspaper closure
(0.064 − (−0.018)). These coefficients are both statistically and economically significant. To put
the latter number in context, consider the average credit spread between Ba1-rated and Aaa-rated
municipal bonds, which equals 42.2 basis points for our sample of municipal bonds. This implies
that the average yield increase following a newspaper closure represents 8.2/42.2 = 19.4% of the
default spread. Thus, a newspaper closure leads to a significant increase in risk for municipal bonds
issued in that county. We also analyze the effect of newspaper closures on municipal bond offering
yields, which is advantageous because offering yields directly represent the effective interest rates
on the bonds at the time of issuance and are less subject to the illiquidity biases that pervade the
secondary municipal bond market (Harris and Piwowar (2006)). Column (2) reports the results for
offering yields. In this case, we find that a closure increases the average offering yield spread by 5.5
basis points, which is comparable to our results for secondary yields. Overall, our results indicate
that long-run municipal borrowing costs are higher following a newspaper closure.
Revenue bonds are commonly issued to finance local projects such as schools and hospitals,
and are backed by the revenues generated by those projects. General obligation bonds, on the
other hand, are typically used to finance public works projects such as roadways and parks, and
are backed by local taxes and fees. Revenue bonds should be subject to greater scrutiny because of
the free cash flows that these projects generate, and these bonds are rarely regulated by the state
government. A local newspaper provides an ideal monitoring agent for these revenue-generating
projects, as mismanaged projects can be exposed by investigative reporters employed by the local
newspaper. When a newspaper closes, this monitoring mechanism also ceases to exist, leading
to a greater risk that the cash flows generated by these projects will be mismanaged. Thus,
we hypothesize that the adverse effect of a newspaper closure on borrowing costs will be even
18
greater for revenue bonds. For similar reasons, we also focus on revenue bonds in our future tests
of newspaper closures and municipal finance outcomes. In columns (3) and (4) of Table 3, we
analyze the effect of newspaper closures on secondary yields and offering yields, respectively, for
revenue bonds only. Consistent with our hypothesis, we find that the effect is more pronounced
for this subset of bonds. In particular, we find that, following a closure, the average secondary and
offering yields increase by 9.9 basis points and 10.6 basis points, respectively. These results are
also highly robust to difference-in-differences tests that compare the post-closure and pre-closure
yield differences, with statistically significant coefficients of 11.6 basis points and 9.5 basis points.
Overall, this evidence indicates that the loss of monitoring due to a newspaper closure is especially
detrimental to revenue-generating local projects.
The bond characteristic control variables (X) in the regressions reported in Table 3 provide
further insight into the drivers of municipal bond yields. Yields are lower for bonds that are
insured, which is consistent with the evidence in Nanda and Singh (2004) showing that insurance
adds value for the issuer. This is because the insurer essentially becomes an issuer of a tax-exempt
security in the event of default, allowing them to provide lower prices on the insurance they sell
to municipal bond issuers. In addition, fixed income investors are typically more risk-averse and
thus willing to pay more for bonds that come with a third-party guarantee. We find that bonds
with longer times to maturity have higher yields, as these bonds are subject to greater interest rate
and inflation risk. Larger-size bonds have lower yields on the secondary market, which is likely
because these bonds tend to be more frequently traded, and thus are more liquid. However, we
also find that larger-sized bonds have slightly higher yields at issuance, which likely reflects the
difficulty associated with raising large amounts of cash all at once. We find that unrated bonds
have higher yields, reflecting the lack of credit risk information associated with the bond, and bonds
with higher credit ratings have lower yields, reflecting their lower credit risks. We find that callable
bonds generally have higher yields, which reflects the risk that the issuer will call the bond when
interest rates are low. Finally, we find that general obligation bonds have lower yields, as they are
19

generally thought of as safer because they are backed by the tax base of the municipality instead
of revenues generated by a single project.
The county characteristic control variables (Z) provide additional information about the deter-
minants of municipal bond yields. Bonds issued in counties with higher populations tend to have
lower yields, as higher populations tend to provide a good indication of the economic health of
that area and provide a broader tax base. Bonds issued in counties with higher average per capita
income levels also have lower yields for similar reasons. We also include the percentage changes in
the county population and employment levels, but find that they do not have statistically signifi-
cant relationships with municipal bond yields. Overall, our results indicate that county population
and per capita income levels are the main county-level determinants of municipal bond yields.
5.2. Newspaper Closures in the County Cross-Section
We consider a number of cross-sectional comparisons of how a newspaper closure affects public
finance outcomes to better understand the underlying economic mechanisms. First, consider a
county that already has many newspaper operations. An extreme example would be Los Angeles
County in California, which has 14 newspaper operations in our sample. If a newspaper closes in
such a county, then the closure is very unlikely to have an effect on public finance outcomes because
there are still plenty of newspapers monitoring the local governments. However, this will clearly not
be the case for counties with few newspapers. The difference between “high newspaper” and “low
newspaper” counties provides the basis for our first test. Under our definition, a high newspaper
county has at least four newspapers and a low newspaper county has at most three newspapers
prior to a newspaper closure (this cutoff choice was explained in the summary statistics section).
Column (1) of Table 4 reports the differential effect of a newspaper closure in a low newspaper
county versus a high newspaper county. As before, we include state-year fixed effects so that the
comparison is done within the same state and year. To further account for within-state cross-
county variation, we control for county-level differences in population, population growth, per
20

capita income, and employment growth. We also include the bond characteristic controls utilized
in our main specification. Our estimates illustrate that a closure event in a low newspaper county
is associated with a 10.3 basis point increase in the offering yields of municipal bonds issued in
those counties after the closure. On the other hand, a closure event in a high newspaper county
has no significant affect on offering yields. The difference between a closure event in low newspaper
counties and high newspaper counties is about 11.8 basis points, which is statistically significant
at 1% level.
It is possible that both newspaper closures and the subsequently higher municipal bond yields
are both being driven by deteriorating economic conditions in the geographic region. To address
this concern, we examine the differential effect of a newspaper closure on the county in which the
newspaper operation is located and a neighboring county with a similar population size and its
own newspaper operation. One may view this exercise as a refinement of our main specification
in equation (1) where we match each closure county to a control county based on the economic
attributes and demographics of those counties. The results are presented in column (2) of Table 4.
We find that a closure significantly affects yields in the county where the newspaper was located, but
not the matched neighboring county. Specifically, yields in the closure county increase by 6.4 basis
points while those in the matched neighboring county do not experience any significant change.
The differential effect equals 7.3 basis points and is just under significance at the 1% level. This
evidence suggests that the mean increase in yields following a newspaper closure is unlikely to be
driven by deteriorating economic conditions. Furthermore, the evidence in the summary statistics
section showing that newspaper closures are evenly distributed over time, which includes both
economic expansion and contraction periods, and across states with different per capita income
levels corroborates this finding.
21

5.3. Newspaper Closures and Craigslist Entry
An additional concern is that newspaper closures and municipal bond yields are jointly de-
termined by unobserved variables specific to that county. We address this concern by utilizing a
plausibly exogenous variable that affects the probability of a newspaper closure but not municipal
bond yields. In particular, we utilize the introduction of Craigslist to the county. Craigslist is
an online database of classified advertisements that originated in San Francisco in the late 1990s.
Originally exclusive to the San Francisco area, Craigslist slowly established “sites” in other cities
in the U.S. and other countries over the next 10 to 15 years in response to high demand for its
classified advertisement platform, making it one of the most visited classified advertisement web-
sites in the world. As of November 2017, the number of Craigslist users was about 60 million, the
average number of monthly pageviews was about 50 billion, and the average number of classified
advertisements posted to the site per month was about 80 million.
The growing popularity of Craigslist in the 2000s came at a cost to traditional newspaper
outlets, which largely rely on revenue from advertisement sales. Seamans and Zhu (2014) estimate
that Craiglist entry led to a $5 billion loss in advertising revenues for local newspapers from 2000
to 2007. Kroft and Pope (2014) show that Craigslist had a large impact on job advertising in local
newspapers, as employers were increasingly using online forums like Craigslist to advertise their job
openings. Gurun and Butler (2012) provide evidence that Craigslist entry in Pittsburgh and St.
Louis significantly eroded advertisement sales for the Pittsburgh Post-Gazette and St. Louis-Post
Dispatch, causing those papers to provide more favorably slanted coverage to local corporations
that purchased advertisements in those newspapers. Gurun et al. (2016) provide further evidence
that Craigslist absorbed a significant amount of mortgage-related classified advertisement revenue
from local newspapers as well. Overall, the evidence suggests that Craigslist entry had a highly
negative effect on advertisement revenues for local newspapers, and thus the viability of the print
newspaper business model.
Our empirical approach in this subsection involves testing the predictive power of Craigslist
22

entry to a geographical area for newspaper closures, and then testing the relationship between
municipal bond yield spreads and the predicted value of newspaper closure. We obtained the list of
Craigslist sites and their entry years from www.craigslist.org. For sites added after June 2006,
the entry year is not provided by Craigslist. For these sites, we use a digital archive of the internet
called the Wayback Machine to identify the entry year. With all of the Craiglist sites and their
entry years identified, we then define Craigslist as an indicator variable that equals one if a county
is located within an 30-mile radius of a Craigslist entry point, excluding the entry point itself.
We include the latter condition because Craigslist likely self-selected into the most economically
developed metropolitan areas during its expansion period, which would introduce bias into our
tests because these areas tend to have lower municipal bond yields.5 By focusing on the counties
located immediately outside the entry area, we can examine the indirect effect of Craigslist entry
on newspaper closures without these self-selection issues. Another reason is that the Craigslist
entry points in our sample usually have many newspaper operations, implying that Craigslist entry
would not have much of an effect on municipal bond yields through the newspaper closure channel
for these cities. This is consistent with our evidence in the previous subsection that newspaper
closures primarily affects yields in counties with a low number of newspapers.
We utilize a two-stage least squares regression approach to determine the effect of newspaper
closures on municipal bond yields through the Craigslist entry channel. In particular, we test the
following model:
First Stage: Closurejt = ψ1 · Craigslistjt + φ′Zjt + δs + δy + εjt (2)
Second Stage: yijt = β1 · Closurejt + γ′Xit + φ′Zjt + δs + δy + uijt, (3)
where Closure and the control variables X and Z are defined as before, δs represents state fixed
effects, δy represents year fixed effects, and standard errors are clustered by state-year. If a news-
5The earliest Craigslist entry points include San Francisco, Boston, Chicago, Los Angeles, New York, Portland,San Diego, Seattle, and Washington D.C.
23
paper closure occurred before Craigslist entered the area, then we exclude those observations. The
linear probability model comprising the first stage regression test provides a useful estimate of the
incremental probability of a newspaper closure after Craigslist has entered the area (ψ1). The
second stage regression estimates the effect that the increased probability of a newspaper closure
induced by the Craigslist entry has on yield spreads for municipal bonds issued in the area (β1).
The overall effect of Craigslist entry on yield spreads can then be calculated by multiplying the
main coefficients from the first and second stage regressions (ψ1 × β1).
Panel A of Table 5 reports the results of the first stage regression, with column (1) focusing
on the effect of Craigslist entry on counties located within a 30-mile radius of the Craigslist entry
point. Following Craigslist entry, we find that the probability of a newspaper closure increases
by 9.6%, even after controlling for the general downward trend in newspaper operations via the
year fixed effects. The tests in columns (2) and (3), which examine the effect of Craiglist entry
on counties located within a 60-mile and 90-mile radius of the Craiglist entry point, respectively,
produce similar estimates. This evidence is largely consistent with the findings in Gurun and
Butler (2012) and Gurun et al. (2016) that Craigslist entry has a significantly negative effect on
newspaper advertising revenues. Given that declining advertising revenues is a commonly-cited
reason for newspaper closures, it is unsurprising that Craigslist entry also has a significant effect
on newspaper closures.
Panel B of Table 5 reports the results of the second stage regression of yield spreads on the
predicted closure variable. Column (1) indicates that there is a strongly positive relationship
(β1 = 0.437) between these variables that is statistically significant at the 1% level. Using this
coefficient and ψ1 from the first stage regression, we can quantify the effect of newspaper closures
on local municipal bond yields through the Craigslist entry channel: ψ1×β1 = 0.096×0.437 = 0.042,
or 4.2 basis points. When we expand the radius of the Craigslist entry variable to 90 miles around
the Craigslist entry point in column (3), we find that the second stage coefficient is stronger, with an
overall effect on municipal bond yields of 0.101× 0.606 = 6.1 basis points, which is in line with the
24
estimates presented in Tables 3 and 4. This suggests that Craigslist entry has a stronger effect on
smaller communities located further from the Craigslist entry point, typically a major city. Overall,
the evidence from our two-stage Craigslist tests establishes a clear connection between newspaper
closures and local municipal bond yields.
5.4. Newspaper Closures in the State Cross-Section
A nice feature of the municipal bond market in the United States is its segmentation into 50
smaller markets, with one market for each state. One important reason for this segmentation, ac-
cording to Schultz (2012), is the differences in tax treatments for in-state and out-of-state municipal
bonds. Most states do not tax municipal bonds issued within their state, but do tax municipal
bonds issued out-of-state. This encourages municipal bond investors to trade in local municipal
bonds, leading to market segmentation. Municipal bond investors also tend to favor local municipal
bonds because they possess soft information that is not readily available to outsiders about the
underlying project, further contributing to market segmentation. The segmented nature of munic-
ipal bond markets allows us to explore how differences in state characteristics interact with local
newspaper closure events to determine municipal borrowing costs.
Campante and Do (2014) propose that the distance between a state’s economic and political
centers is a useful measure of the quality of public governance and accountability in the state.
Governments face less scrutiny by citizens and the media when the distance between these centers
is large, and Campante and Do (2014) show that the quality of governance is worse as a result.
Governance quality at the state and local levels are likely to be correlated, as states with high-
quality governance are more likely to have mechanisms in place for monitoring the operations of
their local municipalities, leading to a positive trickle-down governance effect. We hypothesize
that the effect of a newspaper closure on municipal borrowing costs will be weaker in high-quality
governance states, as the monitoring provided by those states acts as a weak substitute for the
monitoring provided by the local newspaper.
25
We use the publicly-available, state-level distance metric from Campante and Do (2014) to
test the governance hypothesis. In particular, we classify each state as “high isolation” or “low
isolation” based on whether the relative distance between their economic and population centers
is above or below median. This allows us to examine the effect of a local newspaper closure on
municipal financing costs across states with higher or lower quality governance. We interact the
“high isolation” and “low isolation” indicator variables with our Closure indicator variable and
examine how these interaction variables affect local municipal bond yields. The results are reported
in Column (1) of Table 5. We find that while a newspaper closure has a positive and statistically
significant effect on yields in both low and high isolation states, the effect is much stronger in high
isolation states. In particular, following a newspaper closure, yields in low isolation states increase
by 5.5 basis points, while those in high isolation states increase by 12.3 basis points, for a difference
of 6.8 basis points that is significant at the 5% level. This evidence supports our hypothesis that
newspaper closures lead to worse public finance outcomes in states with low quality governance.
We also find evidence that yields are slightly higher in high isolation states (2.2 basis points),
suggesting that states with low quality governance generally have higher borrowing costs, even
without accounting for newspaper closures.
Do other forms of media fill the vacuum created by local newspaper closures? Ideally, we would
like to have comprehensive information on household news consumption such as newspaper circula-
tion data and internet website visit data aggregated at the county level so that we can test whether
there is any substitution between local newspapers and other forms of media. Unfortunately, we
are somewhat constrained by data availability. However, we can still shed some light on this issue
by examining cross-state variations in internet usage. We obtain state-level internet usage data
from the National Telecommunications & Information Administration (NTIA). For a majority of
the years from 1998 to 2015, NTIA provide data on the percentage of the state population that
uses the internet at any location in the state.6 We denote this variable INTUSE. Our maintained
6We fill in the years with no data by interpolating the percentages from the surrounding years.
26
assumption is that internet usage is correlated with online news consumption. If there is a strong
substitution effect between the information obtained from local newspapers and other sources of
media, then a local newspaper closure event is unlikely to have much of an impact on public fi-
nancing costs. In contrast, if the substitution effect is weak, then the impact of a local newspaper
closure on public financing costs should be fairly strong.
We divide states into “high internet usage” and “low internet usage” states based on whether
the INTUSE variable provided by NTIA is above or below the median value in that year. As in
our previous test, we interact the indicator variables representing high and low internet usage states
with our Closure variable and examine how these interaction variables affect municipal borrowing
costs. If information from online sources provides a perfect substitute for information from local
newspapers, then newspaper closures should have no effect on the yields in high internet usage
states. We report our test results in column (2) of Table 5. Our results indicate that the impact of
a local newspaper closure on municipal offering yield spreads in low internet usage states is about
9.0 basis points, while the impact in high internet usage states is about 6.6 basis points. While
this differential impact of 2.4 basis points might suggest some degree of substitutability between
information obtained from local newspapers and online sources, the difference is also statistically
insignificant. Thus, our results indicate that online sources do not provide a sufficient substitute
for the monitoring mechanism provided by local newspapers.
6. Newspaper Closures and Government Inefficiencies
Newspaper closures lead to higher municipal borrowing costs in the long run, and we have
argued that this effect partially occurs through the government inefficiency channel. However,
it is still unclear whether government inefficiencies actually become more pronounced following a
newspaper closure. The goal of this section is to provide more direct evidence of this relationship,
thereby strengthening our mechanism through which newspaper closures affect borrowing costs.
27

6.1. Post-Closure Advance Refundings and Negotiated Sales
In our first test, we examine the likelihood of an advance refunding following a newspaper
closures. An advance refunding occurs when a municipality retires an outstanding callable bond
at least 90 days prior to its first possible call date by issuing new debt to refund that bond. In
effect, the municipality synthetically calls the bond. Ang et al. (2017) show that 85% of all advance
refundings occur at a net present value loss, amounting to an aggregate loss of approximately
$15 billion from 1995 to 2013. Further, they show that municipalities tend to advance refund
their debt at a loss because they are financially constrained and need to reduce their short-term
cash outflows. Taken together, their evidence suggests that advance refundings are symptomatic
of government inefficiencies. If newspaper closures lead to higher borrowing costs through the
government inefficiency channel, then we should observe higher incidences of these transactions
following newspaper closures.
We test the likelihood of an advance refunding following a newspaper closure using a probit
regression framework. Similar to the methodology in Ang et al. (2017), we construct an annual
time series for every callable bond in our database. Each time series begins the year the callable
bond was offered and ends either the year the callable bond was advance refunded or, if the bond
was not advance refunded, the year of the first call date. We define 1AR as an indicator variable
that equals one if the bond was advance-refunded in that bond-year, and zero otherwise. Many of
the callable bonds in our database are not advance refunded, meaning that 1AR equals zero for all
the years in those bonds’ time series. With this variable defined, we then test the following probit
regression model:
Pr(1ARijy |·) = F (β1 · Closurejy + β2 · PreClosurejy + γ′Xiy + δy), (4)
where i, j, and y represent the bond, county, and calendar year, and δy represents year fixed effects.
X is a vector of control variables that includes the number of years until the first call date and the
28

number of years until maturity.
The results of the probit regression model are reported in column (1) of Table 7. We find
that the probability of an advance refunding increases by about 0.42 percentage points after a
newspaper closure compared to the pre-closure period. To put this number in context, consider the
unconditional probability that a callable bond will be advance refunded in a year, which we find
equals about 3.05% in our sample. This suggests that the proportional increase in the probability
of an advance refunding after a newspaper closure is about 13.8% (0.42/3.05). Our results are also
robust to including only advance refundings that occur at least one year in advance of the first
call date in column (2), and the inclusion of county-level control variables in column (3). Overall,
the evidence from these probit regressions indicates that local governments are more inefficient
following newspaper closures from the perspective of advance refundings.
Municipal bonds are generally sold through either a competitive or negotiated sale. In the
latter case, the municipal bonds are sold directly to the underwriter by the municipality, and are
typically associated with higher underwriter gross spreads compared to competitive sales (Robbins
(2002)). Thus, negotiated issues are generally seen as a costlier method for borrowing funds for
municipal projects. Using the same sample of bonds and probit regression model, we test the effect
of a newspaper closure on the probability of a negotiated issue, and we find a a strongly positive
effect. Specifically, according to column (4) of Table 7, the probability of a negotiated issue after a
newspaper closure is about 3.5 percentage points higher compared to the pre-closure period. This
evidence further suggests that local governments are more inefficient following newspaper closures.
6.2. Newspaper Closures and Government Efficiency Metrics
Local newspapers play a crucial role during every step of the political process under a demo-
cratic political system, providing information during election periods about political candidates
and during non-election periods about the decisions of local officials. Incidentally, a lack of local
newspaper coverage can lead to worsened political outcomes. Mondak (1996) and Gentzkow et al.
29

(2011), for example, show that newspaper closures are associated with less informed voters and
lower voter participation during local elections. Clearly, this lack of newspaper coverage and the
associated lack of engagement by local citizens compromises the effective monitoring of elected
officials. Snyder and Stromberg (2010) show that when this external governance mechanism is
compromised, local politicians become less engaged. Consequently, this leads to a decline in real
outcomes for the municipality, with Snyder and Stromberg (2010) showing a subsequent decrease
in monetary transfers from the federal government.
We hypothesize that local newspaper closures lead to inefficient government outcomes at the
county level. One challenge in testing this hypothesis is the construction of an accurate measure of
government efficiency, especially given that county-level data are limited. We consider three related
metrics: the total wages of government employees relative to the total wages of all employees within
the county (WAGE), the average number of government employees relative to the size of population
within the county (EMP ), and the total local tax revenues per capita (TAX). Our assumption
is that inefficient governments are associated with higher government wages relative to the local
population, more government employees per capita, and higher taxes. While neither of these three
measures is a perfect metric for government inefficiency, we believe that together they convey a
clearer picture of how government outcomes are affected by a newspaper closure. We then test
the effect of a newspaper closure on the annual, county-level government efficiency metrics using
a simple OLS regression model. In this setup, we also include the following county and state-level
control variables: county population level; county per capita income level; 12-month percentage
growth in the state coincident index, which is designed to capture local economic conditions in
the state; the state tax rate; 12-month percentage growth in house prices; and the pension funding
ratio, which represents the ratio of state pension assets to state pension liabilities. Year fixed effects
are also included to account for broader economic changes.
Table 8 reports our empirical findings. In particular, column (1) reports the effect of a newspaper
closure on the ratio of county government wages to total county wages. We find that a newspaper
30
closure event is associated with a 1.3 percentage point increase in the WAGE variable compared
to counties in the same year that did not experience a newspaper closure. This 1.3 percentage
point increase is equivalent to a 0.25 standard deviation increase in the WAGE variable. For
the median county, the 1.3 percentage point increase represents a total county government wage
increase of approximately $1.4 million over the total county employee wage. Similar patterns emerge
for the per capita number of government employees and local tax revenues. Specifically, column
(2) illustrates that a newspaper closure is associated with a 0.43 percentage point increase in the
number of government employees per capita, or four additional government employees for every
1,000 residents. This represents a 0.27 standard deviation increase in the EMP variable. Finally,
column (3) illustrates that a newspaper closure event is associated with an additional $84.60 tax
dollars per capita. In our sample, the median annual employee wage is approximately $33,700,
meaning that an additional tax of $84.60 represents about 0.25 percent of the median employee
wage. Collectively, the evidence in Table 8 suggests that government efficiencies worsen following
a local newspaper closure, supporting our proposed mechanism through which newspaper closures
affect public financing costs.
7. Conclusion
Newspapers play an important monitoring role for local governments. Other papers have shown
that the loss of a local newspaper leads to worsened political outcomes in the region, and we il-
lustrate that there are worsened financial outcomes as well. In particular, we show that long-run
municipal borrowing costs increase by as much as 11 basis points following a newspaper closure,
and we utilize several identification tests to show that these results are not being driven by un-
derlying economic conditions in the region. We also show that government efficiency outcomes are
substantially affected by newspaper closures. In particular, we find that government wage rates,
government employees per capita, tax dollars per capita, and the likelihoods of costly advance
refundings and negotiated sales all increase following a newspaper closure. From a finance per-
31

spective, our results suggest that local newspapers are important for the health of local capital
markets.
For counties that have experienced local newspaper closures, we do not expect these newspapers
to return, nor do we think that they should, per se. Online news outlets are fundamentally changing
the way that people consume news, and they are very likely to remain the dominant source for
news consumption. However, these paradigm-shifting news outlets do not necessarily provide a
good substitute for high-quality, locally-sourced, investigative journalism. In the long-run, perhaps
an equilibrium will be reached in which these online-based organizations contract out work to local
reporters and tailor their news to the local areas. In 2009, former Baltimore Sun reporter and
famous television producer David Simon stated the following: “The day I run into a Huffington
Post reporter at a Baltimore Zoning Board hearing is the day that I will be confident that we’ve
actually reached some sort of equilibrium.” We concur, and our evidence suggests that economic
growth at the county level will be better off in that equilibrium.
32
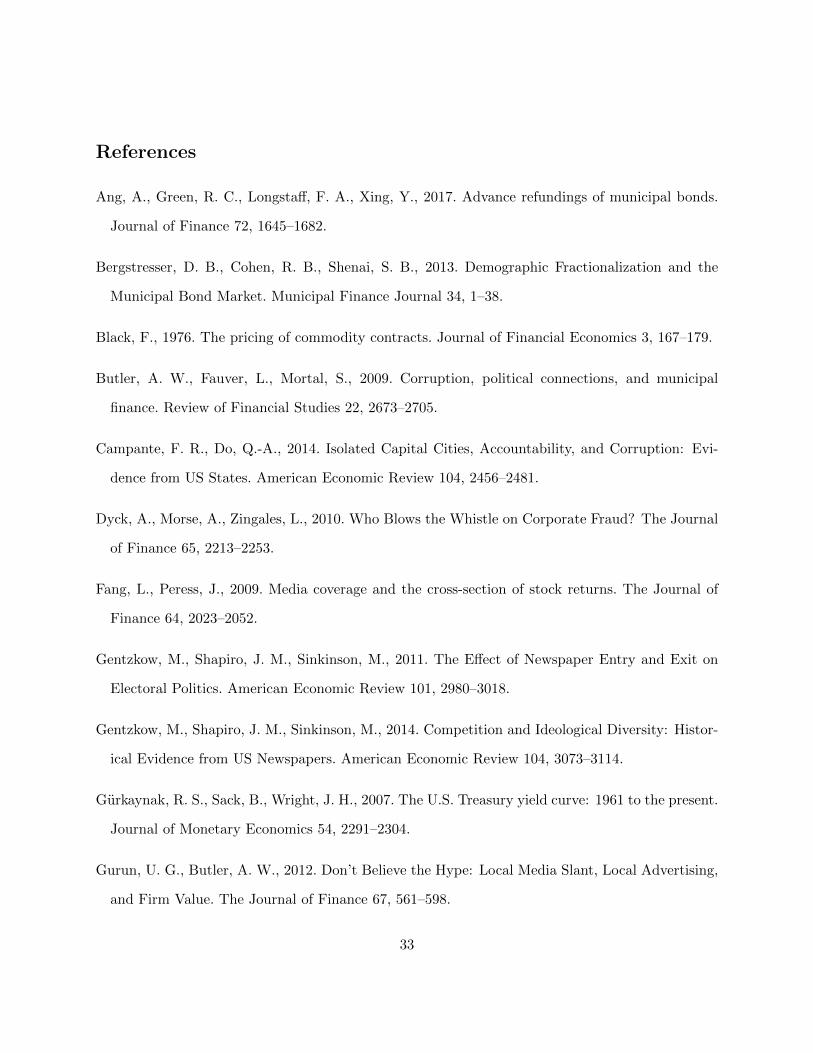
References
Ang, A., Green, R. C., Longstaff, F. A., Xing, Y., 2017. Advance refundings of municipal bonds.
Journal of Finance 72, 1645–1682.
Bergstresser, D. B., Cohen, R. B., Shenai, S. B., 2013. Demographic Fractionalization and the
Municipal Bond Market. Municipal Finance Journal 34, 1–38.
Black, F., 1976. The pricing of commodity contracts. Journal of Financial Economics 3, 167–179.
Butler, A. W., Fauver, L., Mortal, S., 2009. Corruption, political connections, and municipal
finance. Review of Financial Studies 22, 2673–2705.
Campante, F. R., Do, Q.-A., 2014. Isolated Capital Cities, Accountability, and Corruption: Evi-
dence from US States. American Economic Review 104, 2456–2481.
Dyck, A., Morse, A., Zingales, L., 2010. Who Blows the Whistle on Corporate Fraud? The Journal
of Finance 65, 2213–2253.
Fang, L., Peress, J., 2009. Media coverage and the cross-section of stock returns. The Journal of
Finance 64, 2023–2052.
Gentzkow, M., Shapiro, J. M., Sinkinson, M., 2011. The Effect of Newspaper Entry and Exit on
Electoral Politics. American Economic Review 101, 2980–3018.
Gentzkow, M., Shapiro, J. M., Sinkinson, M., 2014. Competition and Ideological Diversity: Histor-
ical Evidence from US Newspapers. American Economic Review 104, 3073–3114.
Gurkaynak, R. S., Sack, B., Wright, J. H., 2007. The U.S. Treasury yield curve: 1961 to the present.
Journal of Monetary Economics 54, 2291–2304.
Gurun, U. G., Butler, A. W., 2012. Don’t Believe the Hype: Local Media Slant, Local Advertising,
and Firm Value. The Journal of Finance 67, 561–598.
33
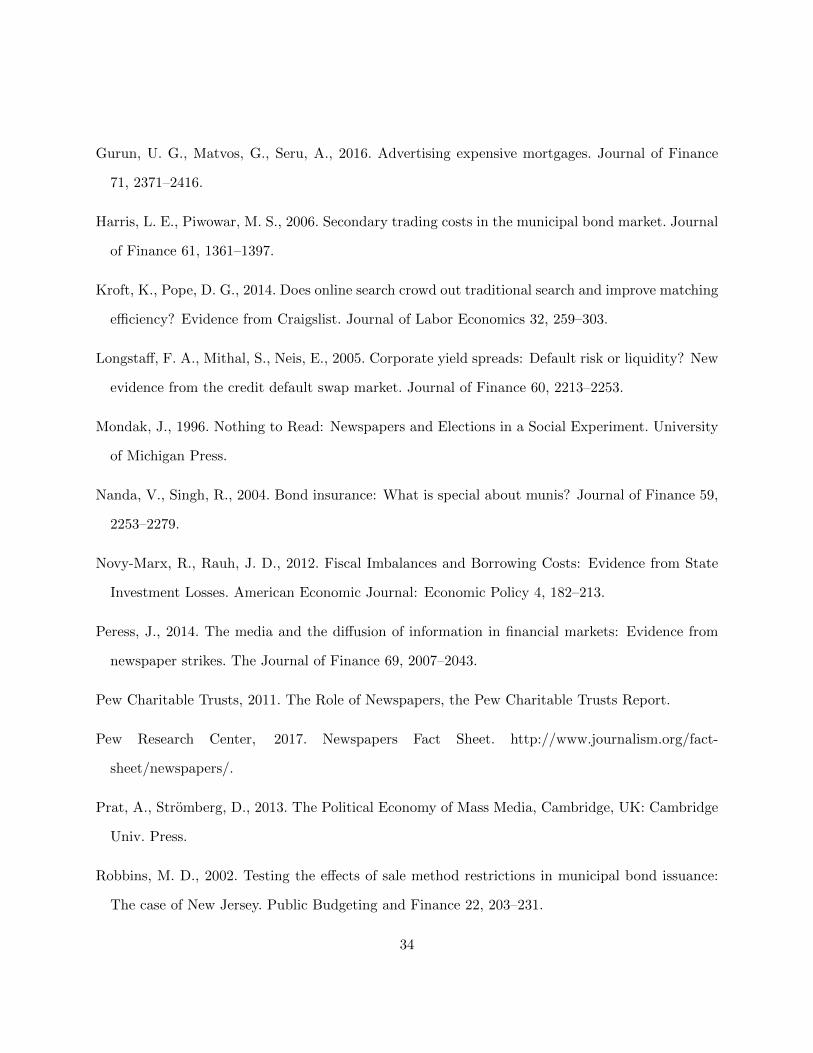
Gurun, U. G., Matvos, G., Seru, A., 2016. Advertising expensive mortgages. Journal of Finance
71, 2371–2416.
Harris, L. E., Piwowar, M. S., 2006. Secondary trading costs in the municipal bond market. Journal
of Finance 61, 1361–1397.
Kroft, K., Pope, D. G., 2014. Does online search crowd out traditional search and improve matching
efficiency? Evidence from Craigslist. Journal of Labor Economics 32, 259–303.
Longstaff, F. A., Mithal, S., Neis, E., 2005. Corporate yield spreads: Default risk or liquidity? New
evidence from the credit default swap market. Journal of Finance 60, 2213–2253.
Mondak, J., 1996. Nothing to Read: Newspapers and Elections in a Social Experiment. University
of Michigan Press.
Nanda, V., Singh, R., 2004. Bond insurance: What is special about munis? Journal of Finance 59,
2253–2279.
Novy-Marx, R., Rauh, J. D., 2012. Fiscal Imbalances and Borrowing Costs: Evidence from State
Investment Losses. American Economic Journal: Economic Policy 4, 182–213.
Peress, J., 2014. The media and the diffusion of information in financial markets: Evidence from
newspaper strikes. The Journal of Finance 69, 2007–2043.
Pew Charitable Trusts, 2011. The Role of Newspapers, the Pew Charitable Trusts Report.
Pew Research Center, 2017. Newspapers Fact Sheet. http://www.journalism.org/fact-
sheet/newspapers/.
Prat, A., Stromberg, D., 2013. The Political Economy of Mass Media, Cambridge, UK: Cambridge
Univ. Press.
Robbins, M. D., 2002. Testing the effects of sale method restrictions in municipal bond issuance:
The case of New Jersey. Public Budgeting and Finance 22, 203–231.
34
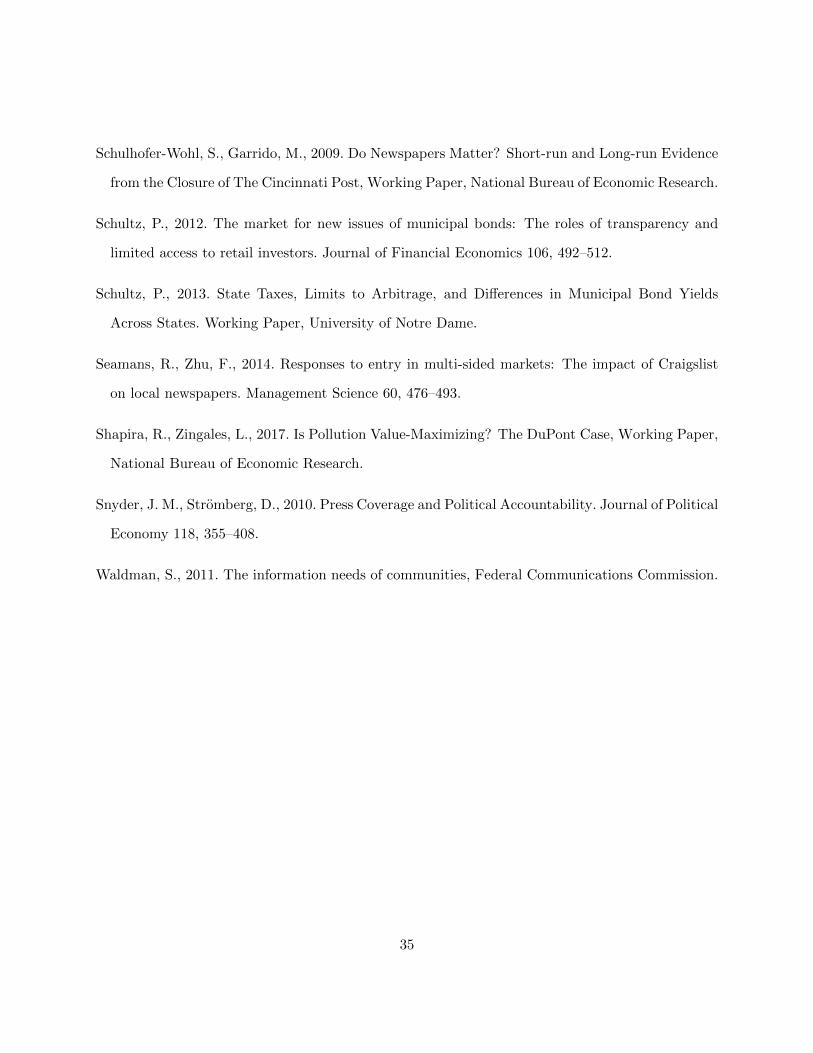
Schulhofer-Wohl, S., Garrido, M., 2009. Do Newspapers Matter? Short-run and Long-run Evidence
from the Closure of The Cincinnati Post, Working Paper, National Bureau of Economic Research.
Schultz, P., 2012. The market for new issues of municipal bonds: The roles of transparency and
limited access to retail investors. Journal of Financial Economics 106, 492–512.
Schultz, P., 2013. State Taxes, Limits to Arbitrage, and Differences in Municipal Bond Yields
Across States. Working Paper, University of Notre Dame.
Seamans, R., Zhu, F., 2014. Responses to entry in multi-sided markets: The impact of Craigslist
on local newspapers. Management Science 60, 476–493.
Shapira, R., Zingales, L., 2017. Is Pollution Value-Maximizing? The DuPont Case, Working Paper,
National Bureau of Economic Research.
Snyder, J. M., Stromberg, D., 2010. Press Coverage and Political Accountability. Journal of Political
Economy 118, 355–408.
Waldman, S., 2011. The information needs of communities, Federal Communications Commission.
35
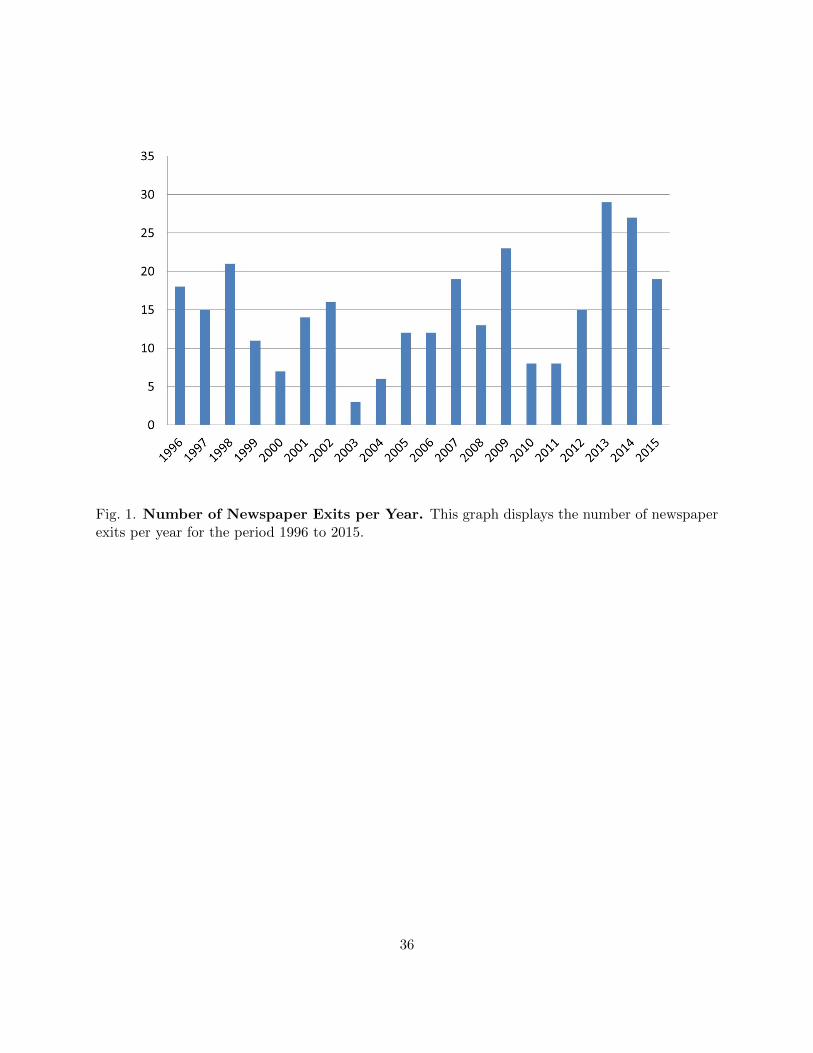
Fig. 1. Number of Newspaper Exits per Year. This graph displays the number of newspaperexits per year for the period 1996 to 2015.
36
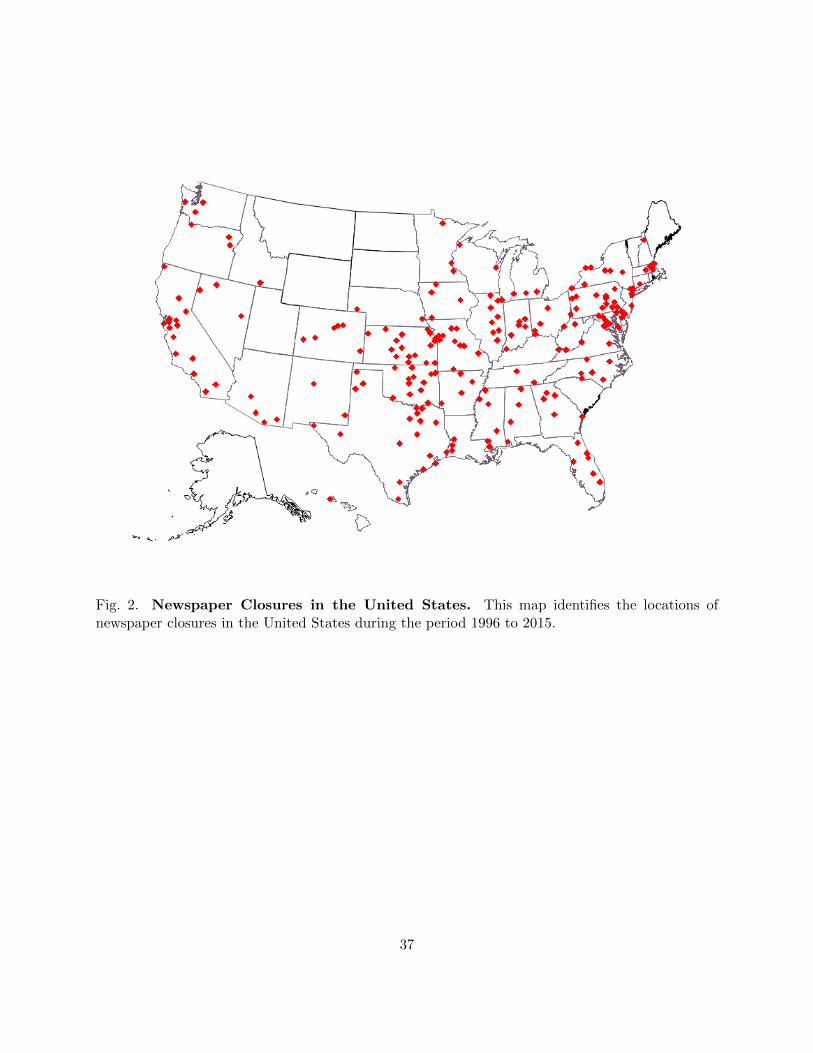
Fig. 2. Newspaper Closures in the United States. This map identifies the locations ofnewspaper closures in the United States during the period 1996 to 2015.
37
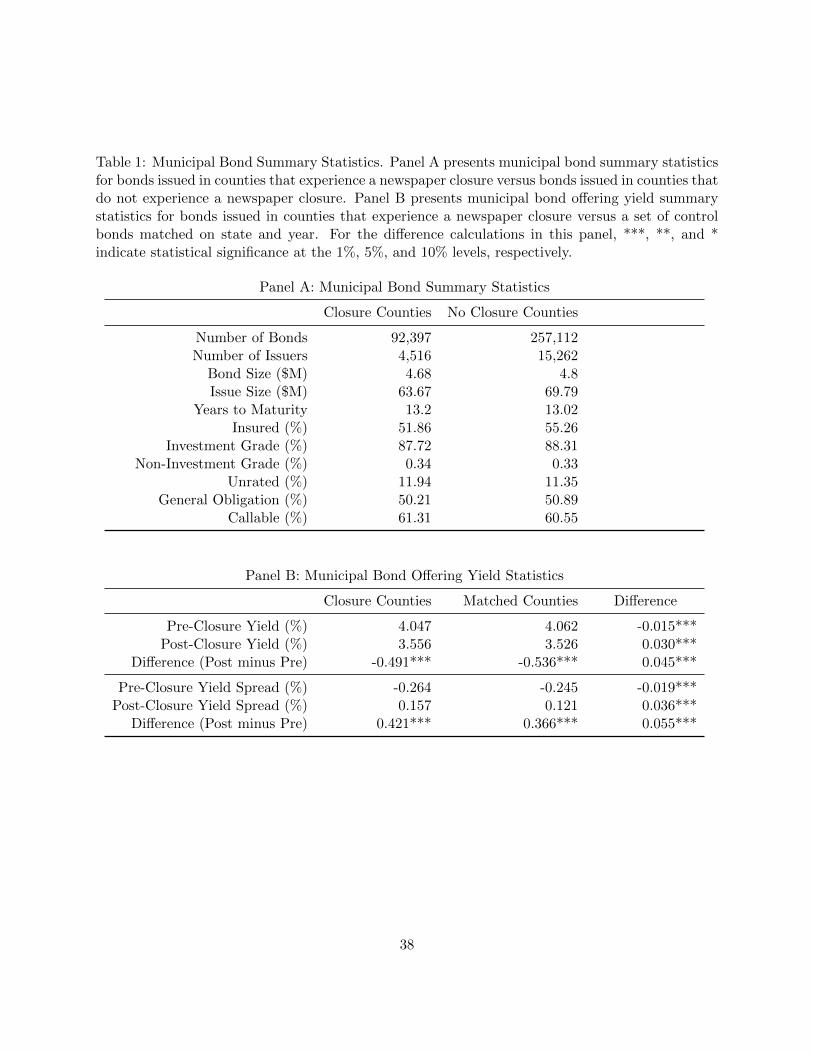
Table 1: Municipal Bond Summary Statistics. Panel A presents municipal bond summary statisticsfor bonds issued in counties that experience a newspaper closure versus bonds issued in counties thatdo not experience a newspaper closure. Panel B presents municipal bond offering yield summarystatistics for bonds issued in counties that experience a newspaper closure versus a set of controlbonds matched on state and year. For the difference calculations in this panel, ***, **, and *indicate statistical significance at the 1%, 5%, and 10% levels, respectively.
Panel A: Municipal Bond Summary Statistics
Closure Counties No Closure Counties
Number of Bonds 92,397 257,112Number of Issuers 4,516 15,262
Bond Size ($M) 4.68 4.8Issue Size ($M) 63.67 69.79
Years to Maturity 13.2 13.02Insured (%) 51.86 55.26
Investment Grade (%) 87.72 88.31Non-Investment Grade (%) 0.34 0.33
Unrated (%) 11.94 11.35General Obligation (%) 50.21 50.89
Callable (%) 61.31 60.55
Panel B: Municipal Bond Offering Yield Statistics
Closure Counties Matched Counties Difference
Pre-Closure Yield (%) 4.047 4.062 -0.015***Post-Closure Yield (%) 3.556 3.526 0.030***
Difference (Post minus Pre) -0.491*** -0.536*** 0.045***
Pre-Closure Yield Spread (%) -0.264 -0.245 -0.019***Post-Closure Yield Spread (%) 0.157 0.121 0.036***
Difference (Post minus Pre) 0.421*** 0.366*** 0.055***
38
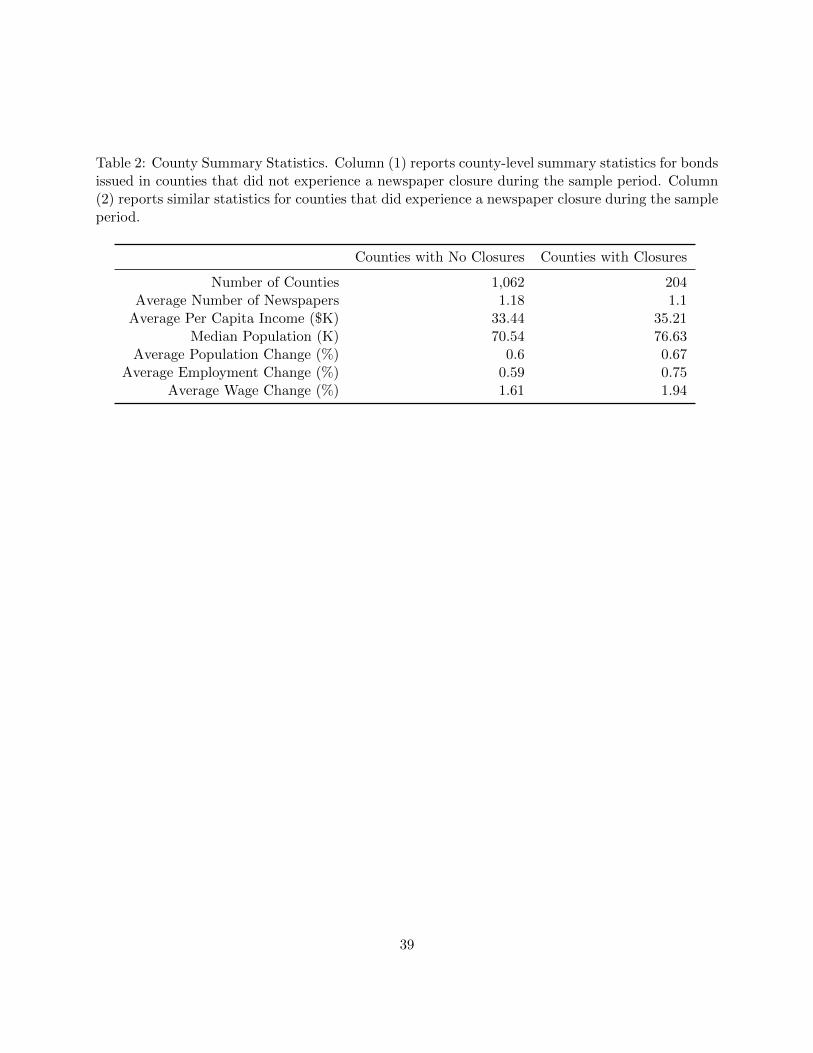
Table 2: County Summary Statistics. Column (1) reports county-level summary statistics for bondsissued in counties that did not experience a newspaper closure during the sample period. Column(2) reports similar statistics for counties that did experience a newspaper closure during the sampleperiod.
Counties with No Closures Counties with Closures
Number of Counties 1,062 204Average Number of Newspapers 1.18 1.1
Average Per Capita Income ($K) 33.44 35.21Median Population (K) 70.54 76.63
Average Population Change (%) 0.6 0.67Average Employment Change (%) 0.59 0.75
Average Wage Change (%) 1.61 1.94
39
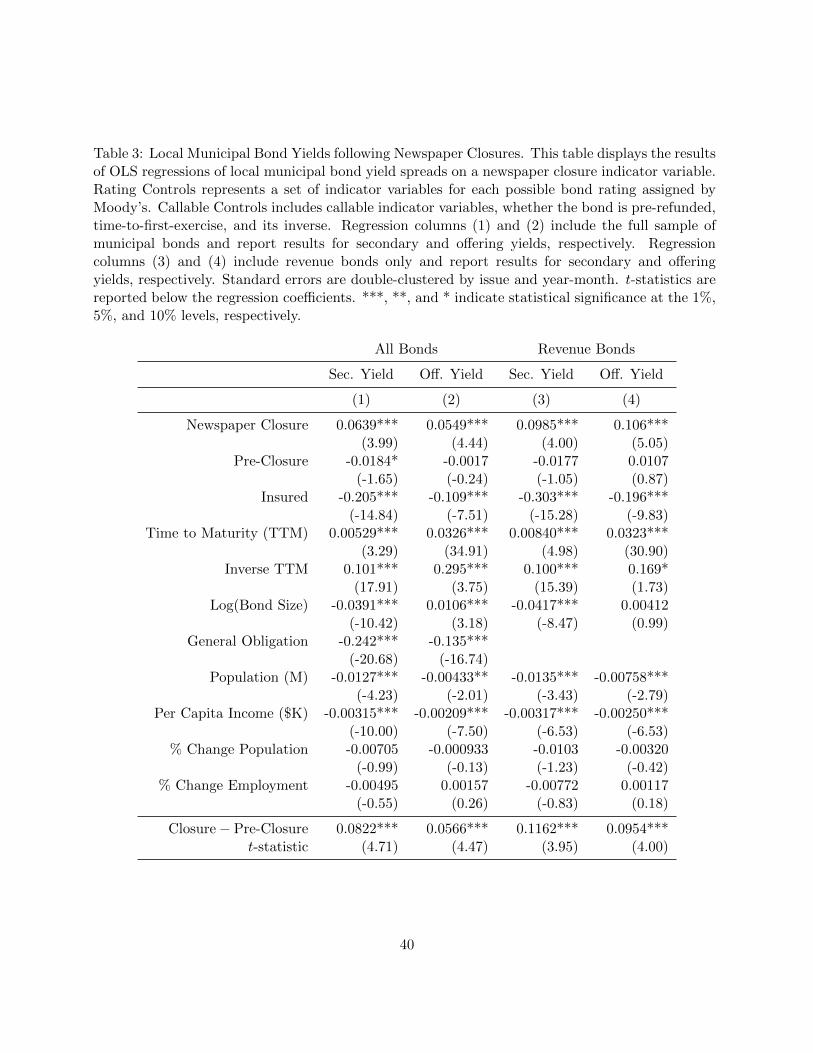
Table 3: Local Municipal Bond Yields following Newspaper Closures. This table displays the resultsof OLS regressions of local municipal bond yield spreads on a newspaper closure indicator variable.Rating Controls represents a set of indicator variables for each possible bond rating assigned byMoody’s. Callable Controls includes callable indicator variables, whether the bond is pre-refunded,time-to-first-exercise, and its inverse. Regression columns (1) and (2) include the full sample ofmunicipal bonds and report results for secondary and offering yields, respectively. Regressioncolumns (3) and (4) include revenue bonds only and report results for secondary and offeringyields, respectively. Standard errors are double-clustered by issue and year-month. t-statistics arereported below the regression coefficients. ***, **, and * indicate statistical significance at the 1%,5%, and 10% levels, respectively.
All Bonds Revenue Bonds
Sec. Yield Off. Yield Sec. Yield Off. Yield
(1) (2) (3) (4)
Newspaper Closure 0.0639*** 0.0549*** 0.0985*** 0.106***(3.99) (4.44) (4.00) (5.05)
Pre-Closure -0.0184* -0.0017 -0.0177 0.0107(-1.65) (-0.24) (-1.05) (0.87)
Insured -0.205*** -0.109*** -0.303*** -0.196***(-14.84) (-7.51) (-15.28) (-9.83)
Time to Maturity (TTM) 0.00529*** 0.0326*** 0.00840*** 0.0323***(3.29) (34.91) (4.98) (30.90)
Inverse TTM 0.101*** 0.295*** 0.100*** 0.169*(17.91) (3.75) (15.39) (1.73)
Log(Bond Size) -0.0391*** 0.0106*** -0.0417*** 0.00412(-10.42) (3.18) (-8.47) (0.99)
General Obligation -0.242*** -0.135***(-20.68) (-16.74)
Population (M) -0.0127*** -0.00433** -0.0135*** -0.00758***(-4.23) (-2.01) (-3.43) (-2.79)
Per Capita Income ($K) -0.00315*** -0.00209*** -0.00317*** -0.00250***(-10.00) (-7.50) (-6.53) (-6.53)
% Change Population -0.00705 -0.000933 -0.0103 -0.00320(-0.99) (-0.13) (-1.23) (-0.42)
% Change Employment -0.00495 0.00157 -0.00772 0.00117(-0.55) (0.26) (-0.83) (0.18)
Closure− Pre-Closure 0.0822*** 0.0566*** 0.1162*** 0.0954***t-statistic (4.71) (4.47) (3.95) (4.00)
40

SE Clustering Issue-YM Issue-YM Issue-YM Issue-YMFixed Effects State-Year State-Year State-Year State-Year
Rating Controls Yes Yes Yes YesCallable Controls Yes Yes Yes Yes
N 7,647,911 348,377 4,474,139 172,751R-Squared 0.354 0.644 0.350 0.644
41
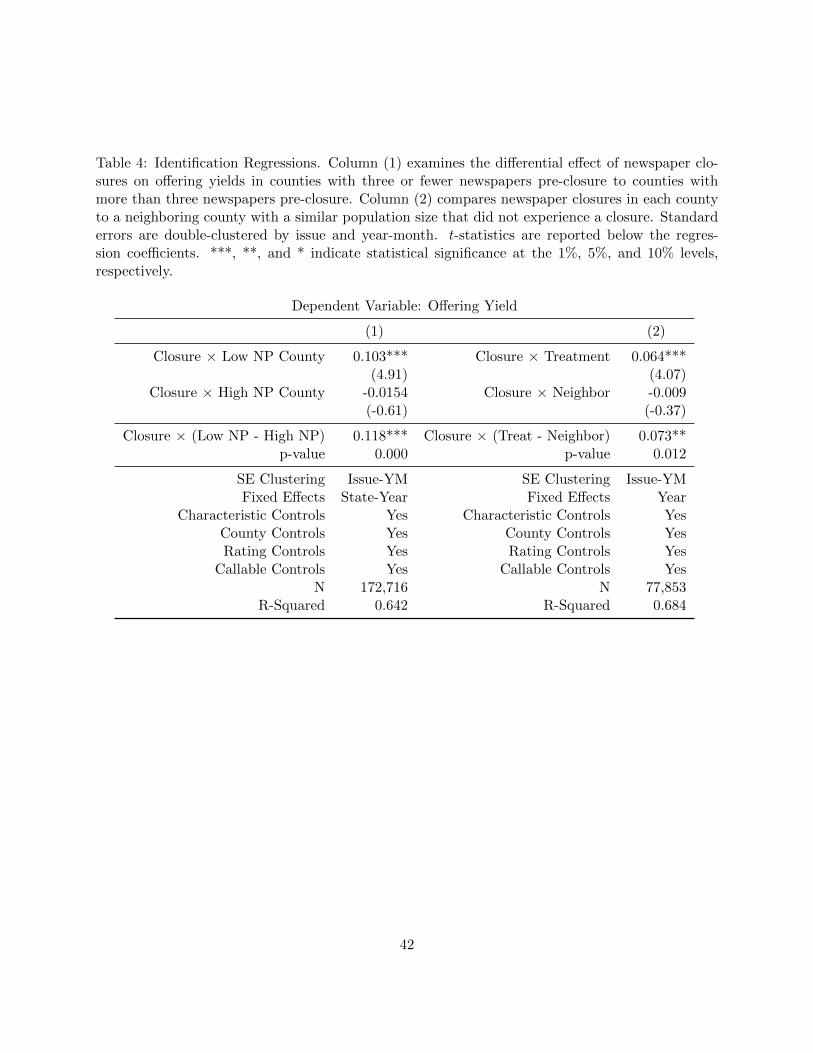
Table 4: Identification Regressions. Column (1) examines the differential effect of newspaper clo-sures on offering yields in counties with three or fewer newspapers pre-closure to counties withmore than three newspapers pre-closure. Column (2) compares newspaper closures in each countyto a neighboring county with a similar population size that did not experience a closure. Standarderrors are double-clustered by issue and year-month. t-statistics are reported below the regres-sion coefficients. ***, **, and * indicate statistical significance at the 1%, 5%, and 10% levels,respectively.
Dependent Variable: Offering Yield
(1) (2)
Closure × Low NP County 0.103*** Closure × Treatment 0.064***(4.91) (4.07)
Closure × High NP County -0.0154 Closure × Neighbor -0.009(-0.61) (-0.37)
Closure × (Low NP - High NP) 0.118*** Closure × (Treat - Neighbor) 0.073**p-value 0.000 p-value 0.012
SE Clustering Issue-YM SE Clustering Issue-YMFixed Effects State-Year Fixed Effects Year
Characteristic Controls Yes Characteristic Controls YesCounty Controls Yes County Controls YesRating Controls Yes Rating Controls Yes
Callable Controls Yes Callable Controls YesN 172,716 N 77,853
R-Squared 0.642 R-Squared 0.684
42
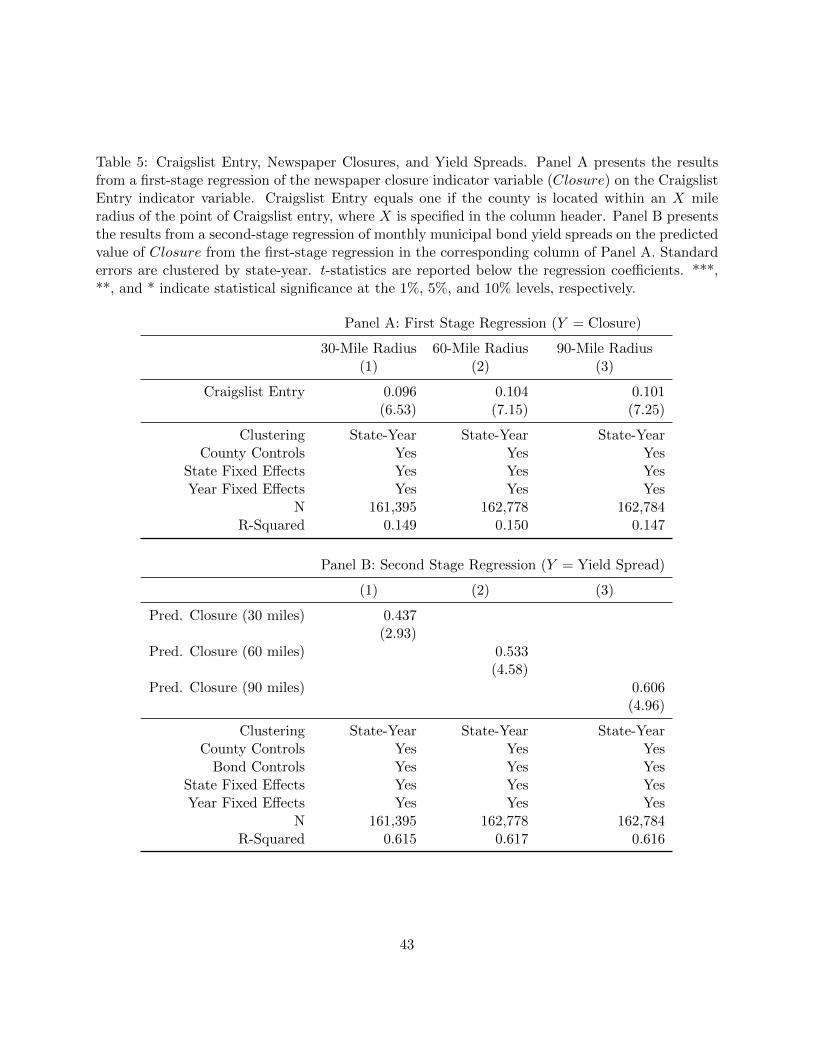
Table 5: Craigslist Entry, Newspaper Closures, and Yield Spreads. Panel A presents the resultsfrom a first-stage regression of the newspaper closure indicator variable (Closure) on the CraigslistEntry indicator variable. Craigslist Entry equals one if the county is located within an X mileradius of the point of Craigslist entry, where X is specified in the column header. Panel B presentsthe results from a second-stage regression of monthly municipal bond yield spreads on the predictedvalue of Closure from the first-stage regression in the corresponding column of Panel A. Standarderrors are clustered by state-year. t-statistics are reported below the regression coefficients. ***,**, and * indicate statistical significance at the 1%, 5%, and 10% levels, respectively.
Panel A: First Stage Regression (Y = Closure)
30-Mile Radius 60-Mile Radius 90-Mile Radius(1) (2) (3)
Craigslist Entry 0.096 0.104 0.101(6.53) (7.15) (7.25)
Clustering State-Year State-Year State-YearCounty Controls Yes Yes Yes
State Fixed Effects Yes Yes YesYear Fixed Effects Yes Yes Yes
N 161,395 162,778 162,784R-Squared 0.149 0.150 0.147
Panel B: Second Stage Regression (Y = Yield Spread)
(1) (2) (3)
Pred. Closure (30 miles) 0.437(2.93)
Pred. Closure (60 miles) 0.533(4.58)
Pred. Closure (90 miles) 0.606(4.96)
Clustering State-Year State-Year State-YearCounty Controls Yes Yes Yes
Bond Controls Yes Yes YesState Fixed Effects Yes Yes YesYear Fixed Effects Yes Yes Yes
N 161,395 162,778 162,784R-Squared 0.615 0.617 0.616
43
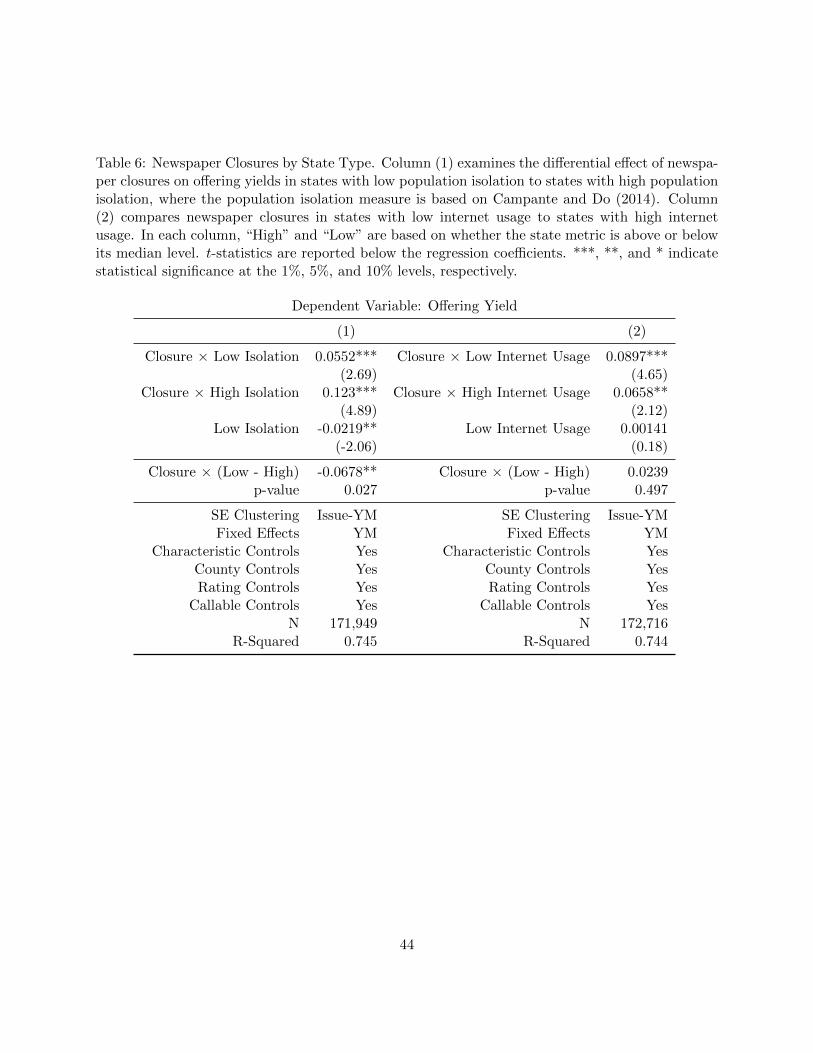
Table 6: Newspaper Closures by State Type. Column (1) examines the differential effect of newspa-per closures on offering yields in states with low population isolation to states with high populationisolation, where the population isolation measure is based on Campante and Do (2014). Column(2) compares newspaper closures in states with low internet usage to states with high internetusage. In each column, “High” and “Low” are based on whether the state metric is above or belowits median level. t-statistics are reported below the regression coefficients. ***, **, and * indicatestatistical significance at the 1%, 5%, and 10% levels, respectively.
Dependent Variable: Offering Yield
(1) (2)
Closure × Low Isolation 0.0552*** Closure × Low Internet Usage 0.0897***(2.69) (4.65)
Closure × High Isolation 0.123*** Closure × High Internet Usage 0.0658**(4.89) (2.12)
Low Isolation -0.0219** Low Internet Usage 0.00141(-2.06) (0.18)
Closure × (Low - High) -0.0678** Closure × (Low - High) 0.0239p-value 0.027 p-value 0.497
SE Clustering Issue-YM SE Clustering Issue-YMFixed Effects YM Fixed Effects YM
Characteristic Controls Yes Characteristic Controls YesCounty Controls Yes County Controls YesRating Controls Yes Rating Controls Yes
Callable Controls Yes Callable Controls YesN 171,949 N 172,716
R-Squared 0.745 R-Squared 0.744
44
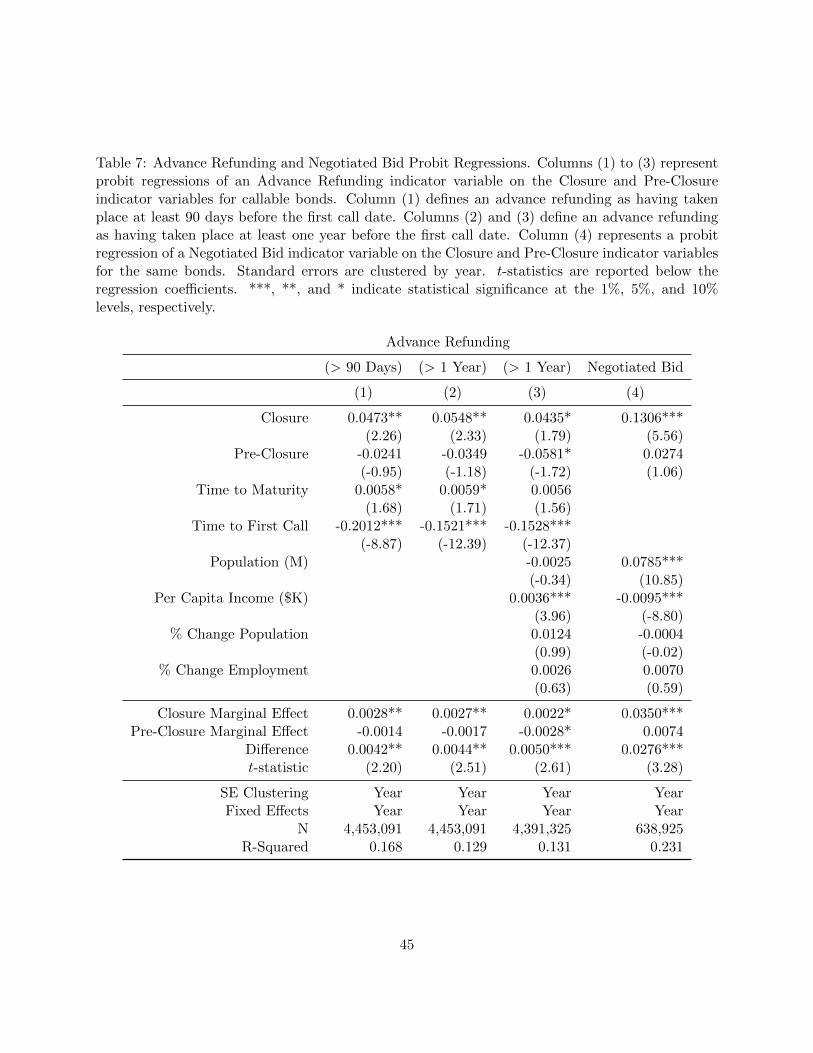
Table 7: Advance Refunding and Negotiated Bid Probit Regressions. Columns (1) to (3) representprobit regressions of an Advance Refunding indicator variable on the Closure and Pre-Closureindicator variables for callable bonds. Column (1) defines an advance refunding as having takenplace at least 90 days before the first call date. Columns (2) and (3) define an advance refundingas having taken place at least one year before the first call date. Column (4) represents a probitregression of a Negotiated Bid indicator variable on the Closure and Pre-Closure indicator variablesfor the same bonds. Standard errors are clustered by year. t-statistics are reported below theregression coefficients. ***, **, and * indicate statistical significance at the 1%, 5%, and 10%levels, respectively.
Advance Refunding
(> 90 Days) (> 1 Year) (> 1 Year) Negotiated Bid
(1) (2) (3) (4)
Closure 0.0473** 0.0548** 0.0435* 0.1306***(2.26) (2.33) (1.79) (5.56)
Pre-Closure -0.0241 -0.0349 -0.0581* 0.0274(-0.95) (-1.18) (-1.72) (1.06)
Time to Maturity 0.0058* 0.0059* 0.0056(1.68) (1.71) (1.56)
Time to First Call -0.2012*** -0.1521*** -0.1528***(-8.87) (-12.39) (-12.37)
Population (M) -0.0025 0.0785***(-0.34) (10.85)
Per Capita Income ($K) 0.0036*** -0.0095***(3.96) (-8.80)
% Change Population 0.0124 -0.0004(0.99) (-0.02)
% Change Employment 0.0026 0.0070(0.63) (0.59)
Closure Marginal Effect 0.0028** 0.0027** 0.0022* 0.0350***Pre-Closure Marginal Effect -0.0014 -0.0017 -0.0028* 0.0074
Difference 0.0042** 0.0044** 0.0050*** 0.0276***t-statistic (2.20) (2.51) (2.61) (3.28)
SE Clustering Year Year Year YearFixed Effects Year Year Year Year
N 4,453,091 4,453,091 4,391,325 638,925R-Squared 0.168 0.129 0.131 0.231
45
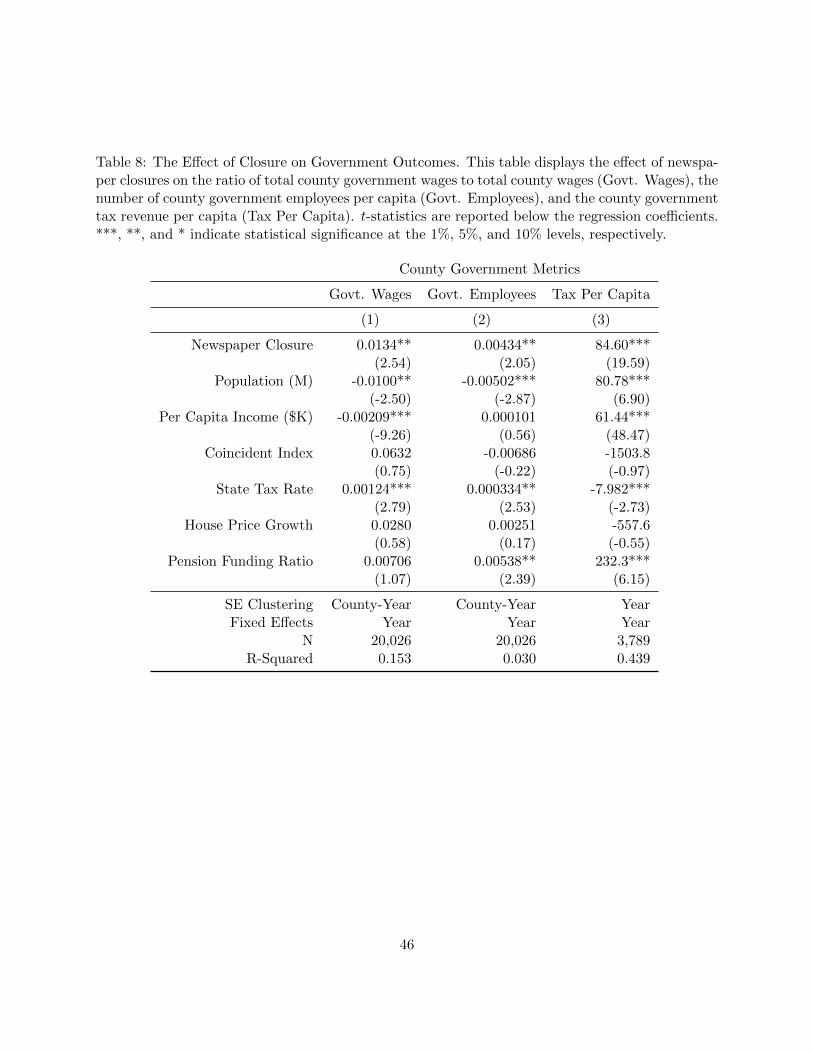
Table 8: The Effect of Closure on Government Outcomes. This table displays the effect of newspa-per closures on the ratio of total county government wages to total county wages (Govt. Wages), thenumber of county government employees per capita (Govt. Employees), and the county governmenttax revenue per capita (Tax Per Capita). t-statistics are reported below the regression coefficients.***, **, and * indicate statistical significance at the 1%, 5%, and 10% levels, respectively.
County Government Metrics
Govt. Wages Govt. Employees Tax Per Capita
(1) (2) (3)
Newspaper Closure 0.0134** 0.00434** 84.60***(2.54) (2.05) (19.59)
Population (M) -0.0100** -0.00502*** 80.78***(-2.50) (-2.87) (6.90)
Per Capita Income ($K) -0.00209*** 0.000101 61.44***(-9.26) (0.56) (48.47)
Coincident Index 0.0632 -0.00686 -1503.8(0.75) (-0.22) (-0.97)
State Tax Rate 0.00124*** 0.000334** -7.982***(2.79) (2.53) (-2.73)
House Price Growth 0.0280 0.00251 -557.6(0.58) (0.17) (-0.55)
Pension Funding Ratio 0.00706 0.00538** 232.3***(1.07) (2.39) (6.15)
SE Clustering County-Year County-Year YearFixed Effects Year Year Year
N 20,026 20,026 3,789R-Squared 0.153 0.030 0.439
46