Financing Airport Development
35
Financing Airport Development Prof. Amedeo Odoni Airport Planning and Management Module 21 January 2016 Istanbul Technical University Air Transportation Management M.Sc. Program
Transcript of Financing Airport Development

Financing Airport DevelopmentProf. Amedeo Odoni
Airport Planning and Management
Module 21
January 2016
Istanbul Technical University
Air Transportation Management
M.Sc. Program

Financing Airport Development
q Objective: Review the financing needs and
sources of financing for infrastructure
development at large airports, as well as the
main sources of revenue
q Outline
– Sources of financing
– Recent financial performance of large airports
– Principal sources of revenue
– Risks in airport financing and airport defenses
Page 2

Financing NeedsAirport infrastructure development requires large
amounts of financing
– Airport construction and expansion projects with
cost of more than $1 billion are becoming
increasingly common even at secondary airports
– Several projects around the world (e.g.,
London’s additional runway, Hong Kong, New
Istanbul, Singapore, Dubai, etc.) will cost well
beyond $10 billion
Airports or governmental entities undertaking such
projects must raise sufficient capital from public or
private sources (or a combination of both)
Page 3

Page 4
SIN – 2-runway configuration
5750 ft (1750 m) between runway centerlines
2014: 54.1 mio pax, 341K mvts

Singapore Changi Airport with Third Runway
Page 5Source: Wikipedia (2011)

Page 6
Hong Kong: 2 independent parallel

Page 7
Hong Kong: Third Runway Project (March 2012)

New Istanbul Airport (Feb 2015)

High Variability
Availability of alternative sources of funding and
the best combinations of funding vary widely
depending on several factors
– National policies and practices
– Legal requirements and restrictions
– Size of airport and of project
– Creditworthiness of the airport operator
– Access to financial markets
Page 9

Financing Needs [2]Most of the costs in question are capital costs
but, in some cases, airports may seek financing
to support operations, as well
Another important consideration in less
developed economies is that debt may often
have to be repaid in foreign currency because it
may involve advanced technology equipment or
facilities
– Competes with the country’s other internal
needs for foreign currency
– Is exposed to the uncertainties of the currency
exchange markets
Page 10

Page 11
Financing Airport Capital Investments [1]
1. Outright Government Grants
– Direct funding (e.g., Airport Improvement Program -- $3.5
billion per year in US favoring medium-size and small
airports)
– Provision of resources other than funding (e.g., land,
materials, access to utilities)
2. Special-Purpose Taxes
– Passengers pay a fee that goes to a fund that supports
eligible airport-related development projects (e.g.,
Passenger Facility Charge (PFC) in US, $4.50 per ticket)
• Airlines are strongly opposed to “pre-funding” of
projects
• These special-purpose taxes are sometimes used
inappropriately
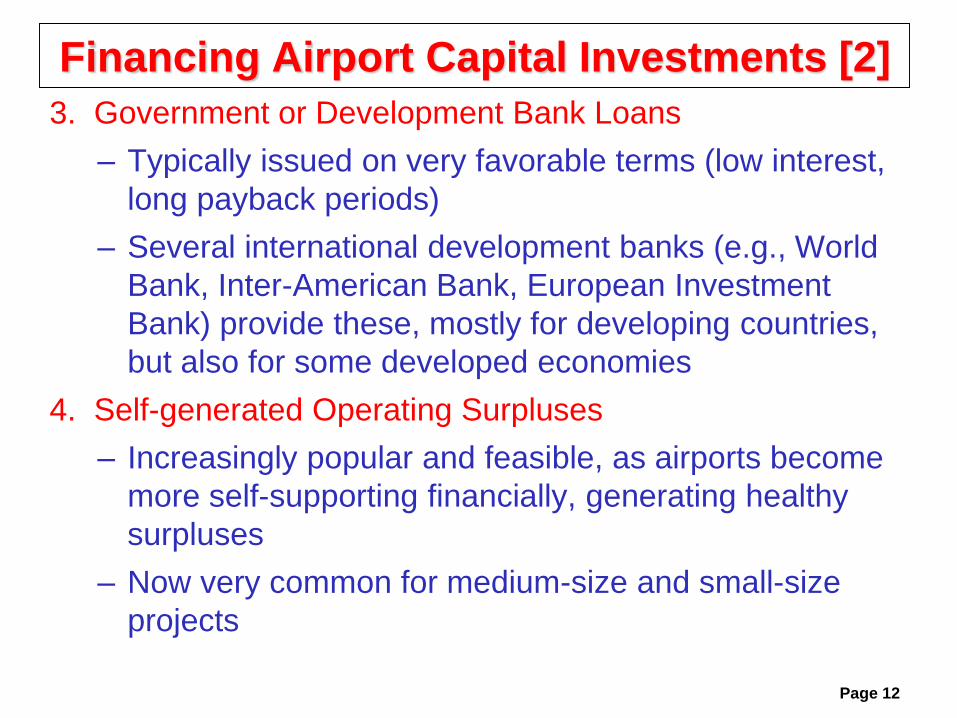
Financing Airport Capital Investments [2]
3. Government or Development Bank Loans
– Typically issued on very favorable terms (low interest,
long payback periods)
– Several international development banks (e.g., World
Bank, Inter-American Bank, European Investment
Bank) provide these, mostly for developing countries,
but also for some developed economies
4. Self-generated Operating Surpluses
– Increasingly popular and feasible, as airports become
more self-supporting financially, generating healthy
surpluses
– Now very common for medium-size and small-size
projects
Page 12

Financing Airport Capital Investments [3]
5. Commercial Bank Loans
– A number of commercial banks provide loans for
airport capital development
– Typically have the highest interest rates; the rates may
be reduced through governmental loan guarantees
6. Tax-exempt, General Obligation Bonds
– Raised from commercial capital equity markets,
including private investors, banks, investment houses,
or fund pools
– Backed by the "full faith and credit" of a governmental
unit and secured by taxes collected by it (from the
taxpayers)
– In developed economies, these are now largely
replaced by tax-exempt revenue bonds (see next) Page 13

Financing Airport Capital Investments [4]
7. Tax-exempt Revenue Bond
– In some countries, this is now the most common type of
financing for infrastructure development at large airports;
can be divided into several categories:
– General airport revenue bonds (GARBS) are secured by
the revenues of the airport as a whole
– Revenue bonds secured by long-term airline leases
– Revenue bonds secured by approved airport
development taxes (e.g., PFCs) or by future expected
government grants
– Revenue bonds backed solely by revenues from a facility
constructed with the proceeds of these bonds
Page 14

Capital Project Financing, USA (2001-2004)
Page 15
Source: ACRP
Synthesis 1 (2007)
Innovative Finance
and Alternative
Sources of Funding

Financing Airport Capital Investments [5]
8. Private financing against specified rights to airport
revenues
– May involve the construction of a single facility (e.g.,
a parking facility) or of an entire airport
– BOT agreements typically include such financing
q There are many variations of the eight types of financing
outlined above.
q For large airport infrastructure development projects,
several of these types of financing are often used
concurrently.
Page 16

Page 17
Financing of New Athens International Airport (1996-
2001)
European Investment Bank $1,128 47%
Consortium of commercial banks $ 360 15%
Airport development fund (Greece) $ 288 12%
European Union grants $ 264 11%
Greek State grants $ 168 7%
Share capital $ 144 6%
(55% Greek State, 45% German group)
Secondary debt (commercial rates) $ 48 2%
(taken on by shareholders)
Total $ 2,400 million

A Financially Sound Industry Large airports, as an industry, have generally performed
well financially despite the economic volatility associated
with the air transportation sector
Major credit rating agencies (e.g., Moody’s, Fitch,
Standard & Poor’s) consider airports, overall, as
financially sound and highly creditworthy
Credit ratings of airports naturally fluctuate in response to
economic and political events (e.g., downgrading of
ratings of many US airports in 2001)
In the United States there has never been a default on
GARBS
However, there have been several instances of airline
special facility debt defaults
Page 18

2013 Airport Industry Revenues and Costs
Total
Revenue
Aeronautical
Revenue*
Non-Aeron’al
Revenue**
%
Aeron’al
Total Costs
(Operating
+ Capital)
Africa 2.9 2.1 0.8 72% 2.1
Asia-Pacific 37.0 18.8 18.2 51% 25.8
Europe 49.8 30.1 19.7 60% 42.1
Latin America
– Caribbean
7.0 4.4 2.6 63% 5.1
Middle East 8.7 4.4 4.3 51% 7.4
North
America
25.5 13.9 11.6 55% 22.7
Total 130.9 73.7 57.2 56% 106.5
Page 19
Amounts shown are in Billions of US$ (1900 airports, 150 countries)
* Includes ground-handling income
** Includes non-operating income
Source: Airport World,
February – March 2015

Distribution of Non-Aeronautical Income (2013)
Retail
Concessions
Car
Parking
Real
Estate
Rental
Cars
Food +
Beverage
Advert’ng Other
Africa 44 15 18 4 1 8 10
Asia-Pacific 33 8 23 1 3 4 28
Europe 35 15 19 2 5 2 28
Latin
America --
Caribbean
25 9 14 3 6 5 38
Middle East 49 8 11 2 5 3 22
North
America
8 39 13 17 7 6 10
Total 27 20 18 6 5 4 20
Page 20
All figures shown in the Table are percentages (%)
Source: Airport World, February – March 2015

Financial Performance: 100 Largest Airport
Operators (2012)
Page 21
Total revenue $ 77 billion
Net operating result $ 16.4 billion
Operating margin 21.2%
Average operating margin (2008-2012) 17.9%
Net result $ 8.2 billion
Net margin 10.6%
Average net margin (2008-2012) 8.9%
Source: FlightGlobal/ Airline
Business, October 2013.

Financial Results: Airports vs. Airlines (2007-12)
Page 22
AIRLINE-AIRPORT PROFITABILITY GAP
Top 100/50 airport group financial results
2012 2011 2010 2009 2008 2007
Operating margin % 21.2 19.1 17.2 14.0 18.2 20.7
Net margin % 10.6 9.5 9.8 6.0 8.5 12.8
Top 150 airline group financial results
2012 2011 2010 2009 2008 2007
Operating margin % 2.9 3.1 5.5 0.0 -2.6 5.3
Net margin % 0.6 0.9 3.3 -1.5 -5.8 4.1
Profitability Gap (airport vs airline group)
2012 2011 2010 2009 2008 2007
Operating margin 18.3 16.0 11.7 14.0 20.8 15.4
Net margin 10.0 8.6 6.5 7.5 14.3 8.7
Source: FlightGlobal/ Airline
Business, October 2013.

30 Airport Operators with Highest Revenue (2012)
Page 23Source: FlightGlobal/ Airline Business, October 2013.
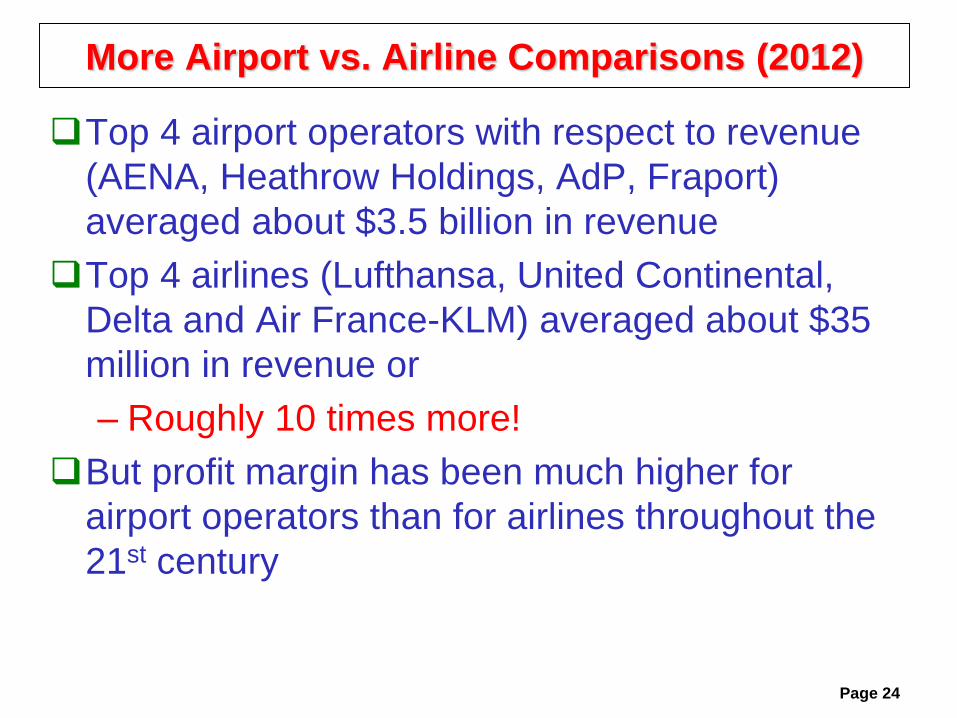
More Airport vs. Airline Comparisons (2012)
Top 4 airport operators with respect to revenue
(AENA, Heathrow Holdings, AdP, Fraport)
averaged about $3.5 billion in revenue
Top 4 airlines (Lufthansa, United Continental,
Delta and Air France-KLM) averaged about $35
million in revenue or
– Roughly 10 times more!
But profit margin has been much higher for
airport operators than for airlines throughout the
21st century
Page 24

Page 25
Financial Statistics for 30 Busiest US Airports (2009)
Revenues of 30 busiest airports ($14.3 billion)
equal 61% of total revenues ($23.4 billion) of 519
airports with commercial service
Expenditures:
– Operating: $6.6 billion ($2.7 billion for personnel,
$2.0 billion for contractual services)
– Non-operating: $2.5 billion for interest
– Depreciation: $3.1 billion
Expenditures for projects: $6.8 billion ($3.1 billion
for terminals, $1.3 billion for airfields)
Bond proceeds: $3.8 billion
Bond indebtedness: $49 billion

Risks in Airport Financing
Overly Optimistic Forecasts
– “The forecast is always wrong”
– Forecasting for airports has historically proved to
be very difficult and often very wrong
– Tendency to be over-optimistic (several reasons)
– Numerous examples internationally
Geopolitical events with disruptive impacts
– Economic recessions, wars, epidemics (e.g.,
SARS, Ebola), terrorism
Page 26

Forecasts of Total U.S. Airport Operations
Source: FAA, Terminal Area Forecasts, 2001-2012
Prepared by Joakim Karlsson and Amon Tarakemeh

Tower Operations by Aviation Segment

Rio de Janeiro/Galeão–Antonio Carlos Jobim (GIG)
2013: 25-year concession to consortium of Oderbrecht (Br, 60%)
and Changi Airport (Sin, 40%); ~$8 billion for 51% share; forecast:
175% growth in 15 yrs (~7.5/year); ~17.5 mio pax in 2012


ATH: Main and Satellite Terminal Buildings

Risks in Airport Financing [2]
Airline-related changes
– Bankruptcies (Eastern Miami, Sabena
Brussels, Swissair Zurich, Malev Budapest)
– Mergers (Delta – Northwest Minneapolis,
American – TWA St. Louis and Kansas City)
– Network reconfigurations (Alitalia Rome vs.
Milan, USAir Philadelphia vs. Pittsburgh)
– Limited “loyalty” to airports, especially by some
low-cost carriers
Page 32

Airport Defenses
Strong O/D traffic
– Airlines come and go, but airport traffic base remains
strong
– Several “Compensatory” system airports in the US are in
this category
Presence of strong dominant airline(s) with long-term
commitment to the airport
Long-term airline leases and commitments (e.g., for
exclusive-use terminal facilities)
For airports relying on connecting traffic
– Airline-airport partnerships
– “Residual” system of charges, under which airlines
benefit from non-aeronautical revenues in exchange for
assuming financial risk Page 33

References
de Neufville, R. and A. Odoni (2013) Airport Systems: Planning, Design and Management, 2nd
Edition, McGraw-Hill Education. [Chapters 7 and 8]
Graham, Anne (2014) Managing Airports: An International Perspective, 4th Edition, Routledge Publishers. [Chapters 2, 3 and 4]
ACRP – Airport Cooperative Research Program (2007) Innovative Finance and Alternative Sources of Revenue for Airports, Washington, DC.
Page 34

Questions? Comments?
Page 35